Transcriptome Analysis of Deoxynivalenol (DON)-Induced Hepatic and Intestinal Toxicity in Zebrafish: Insights into Gene Expression and Potential Detoxification Pathways

 and
and 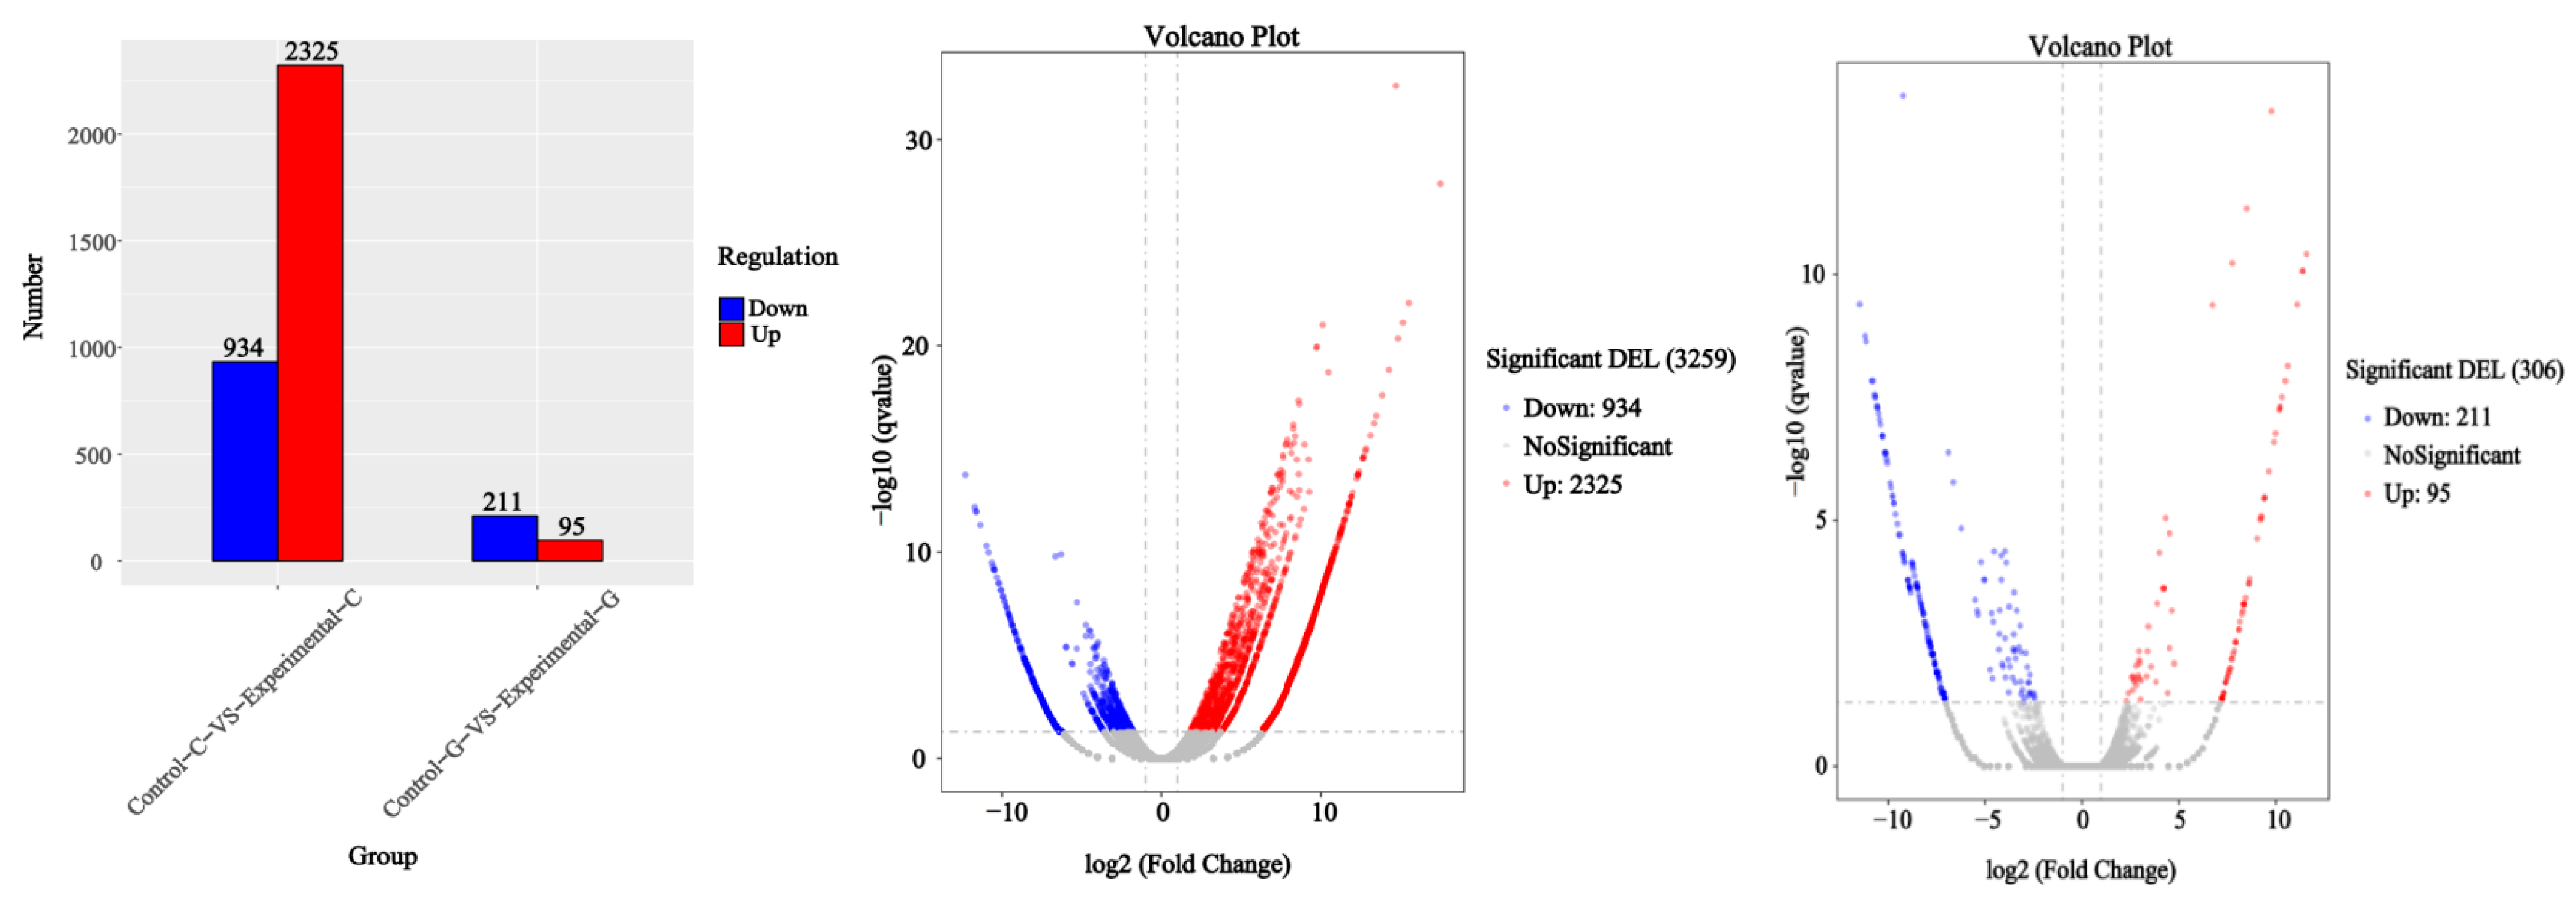
Abstract
:1. Introduction
2. Results
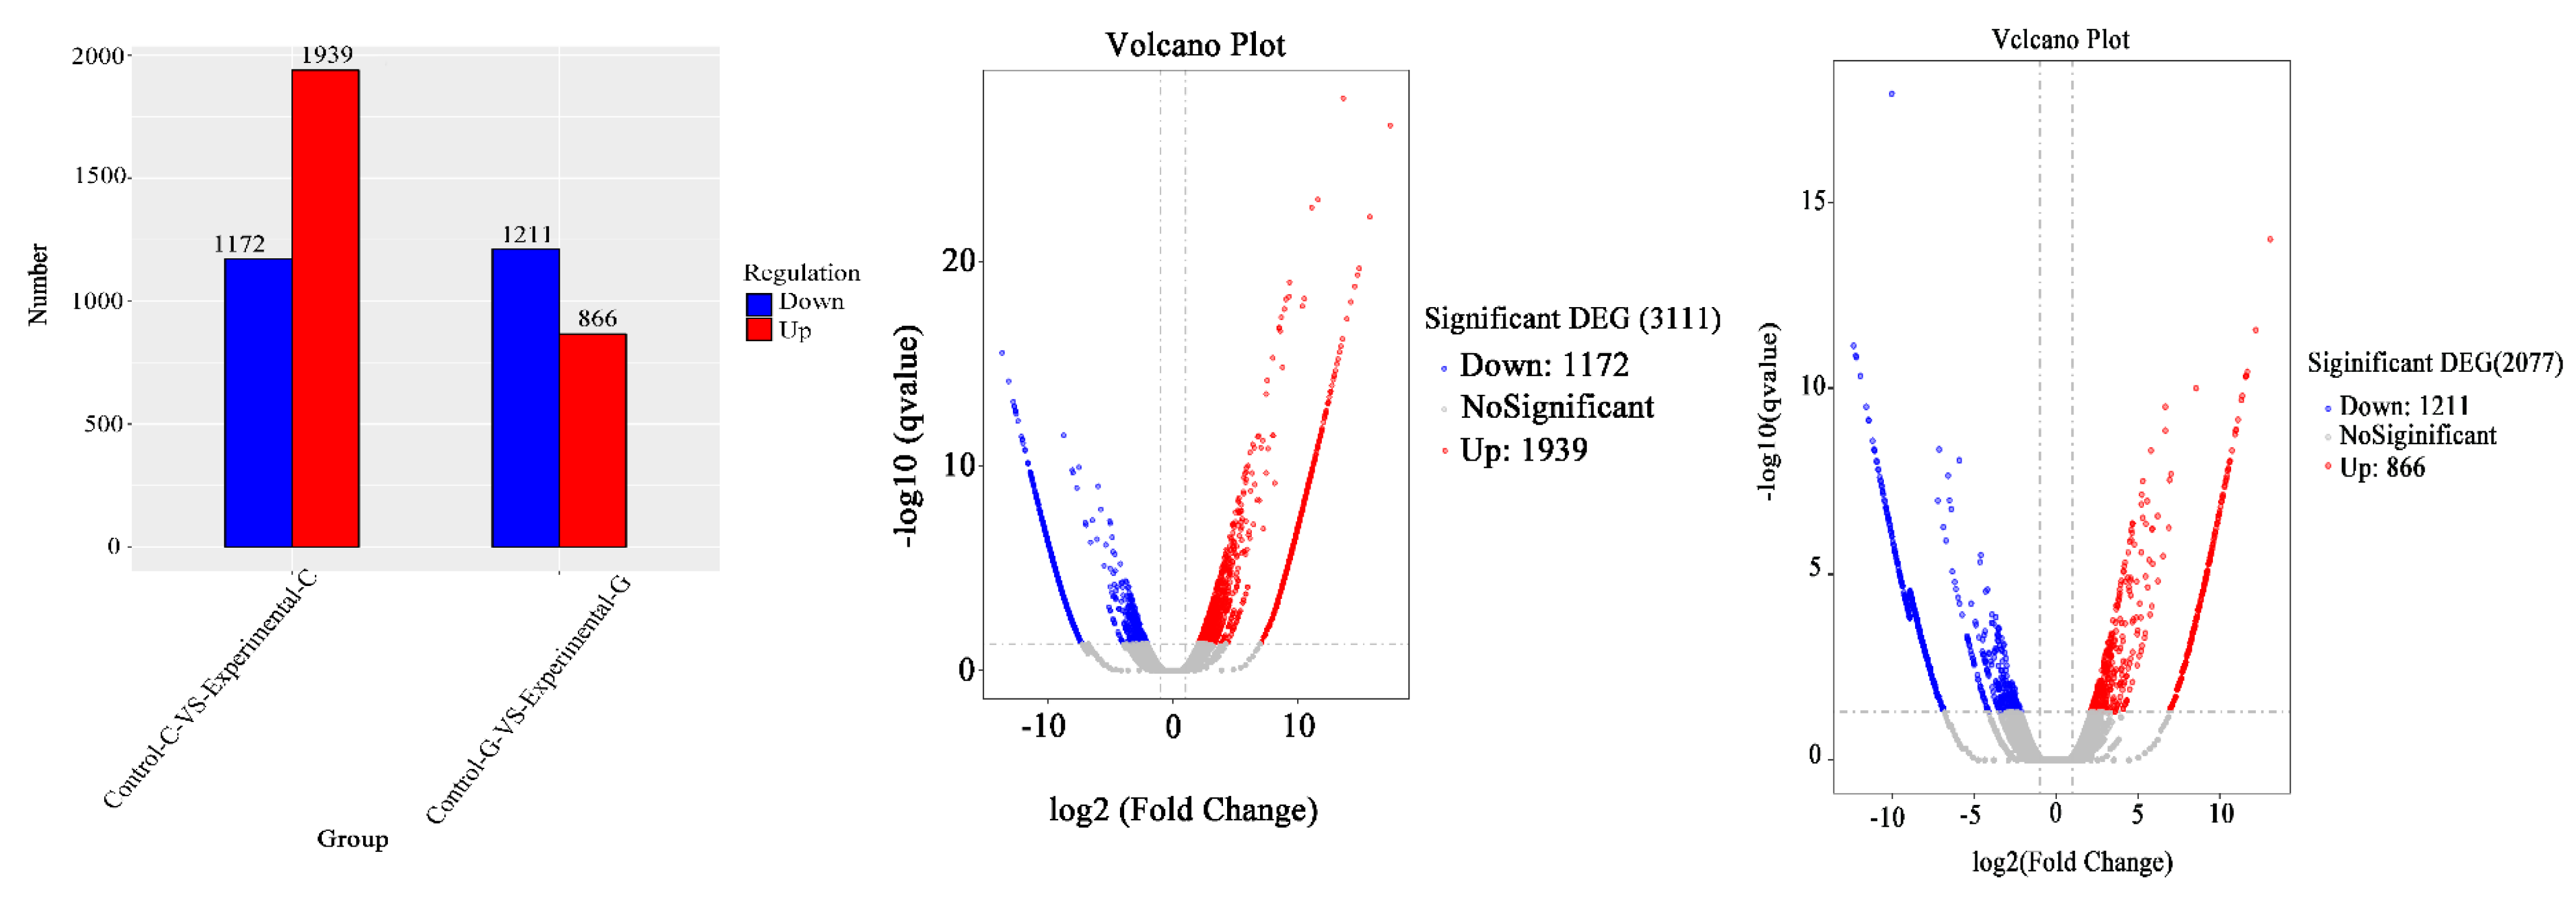
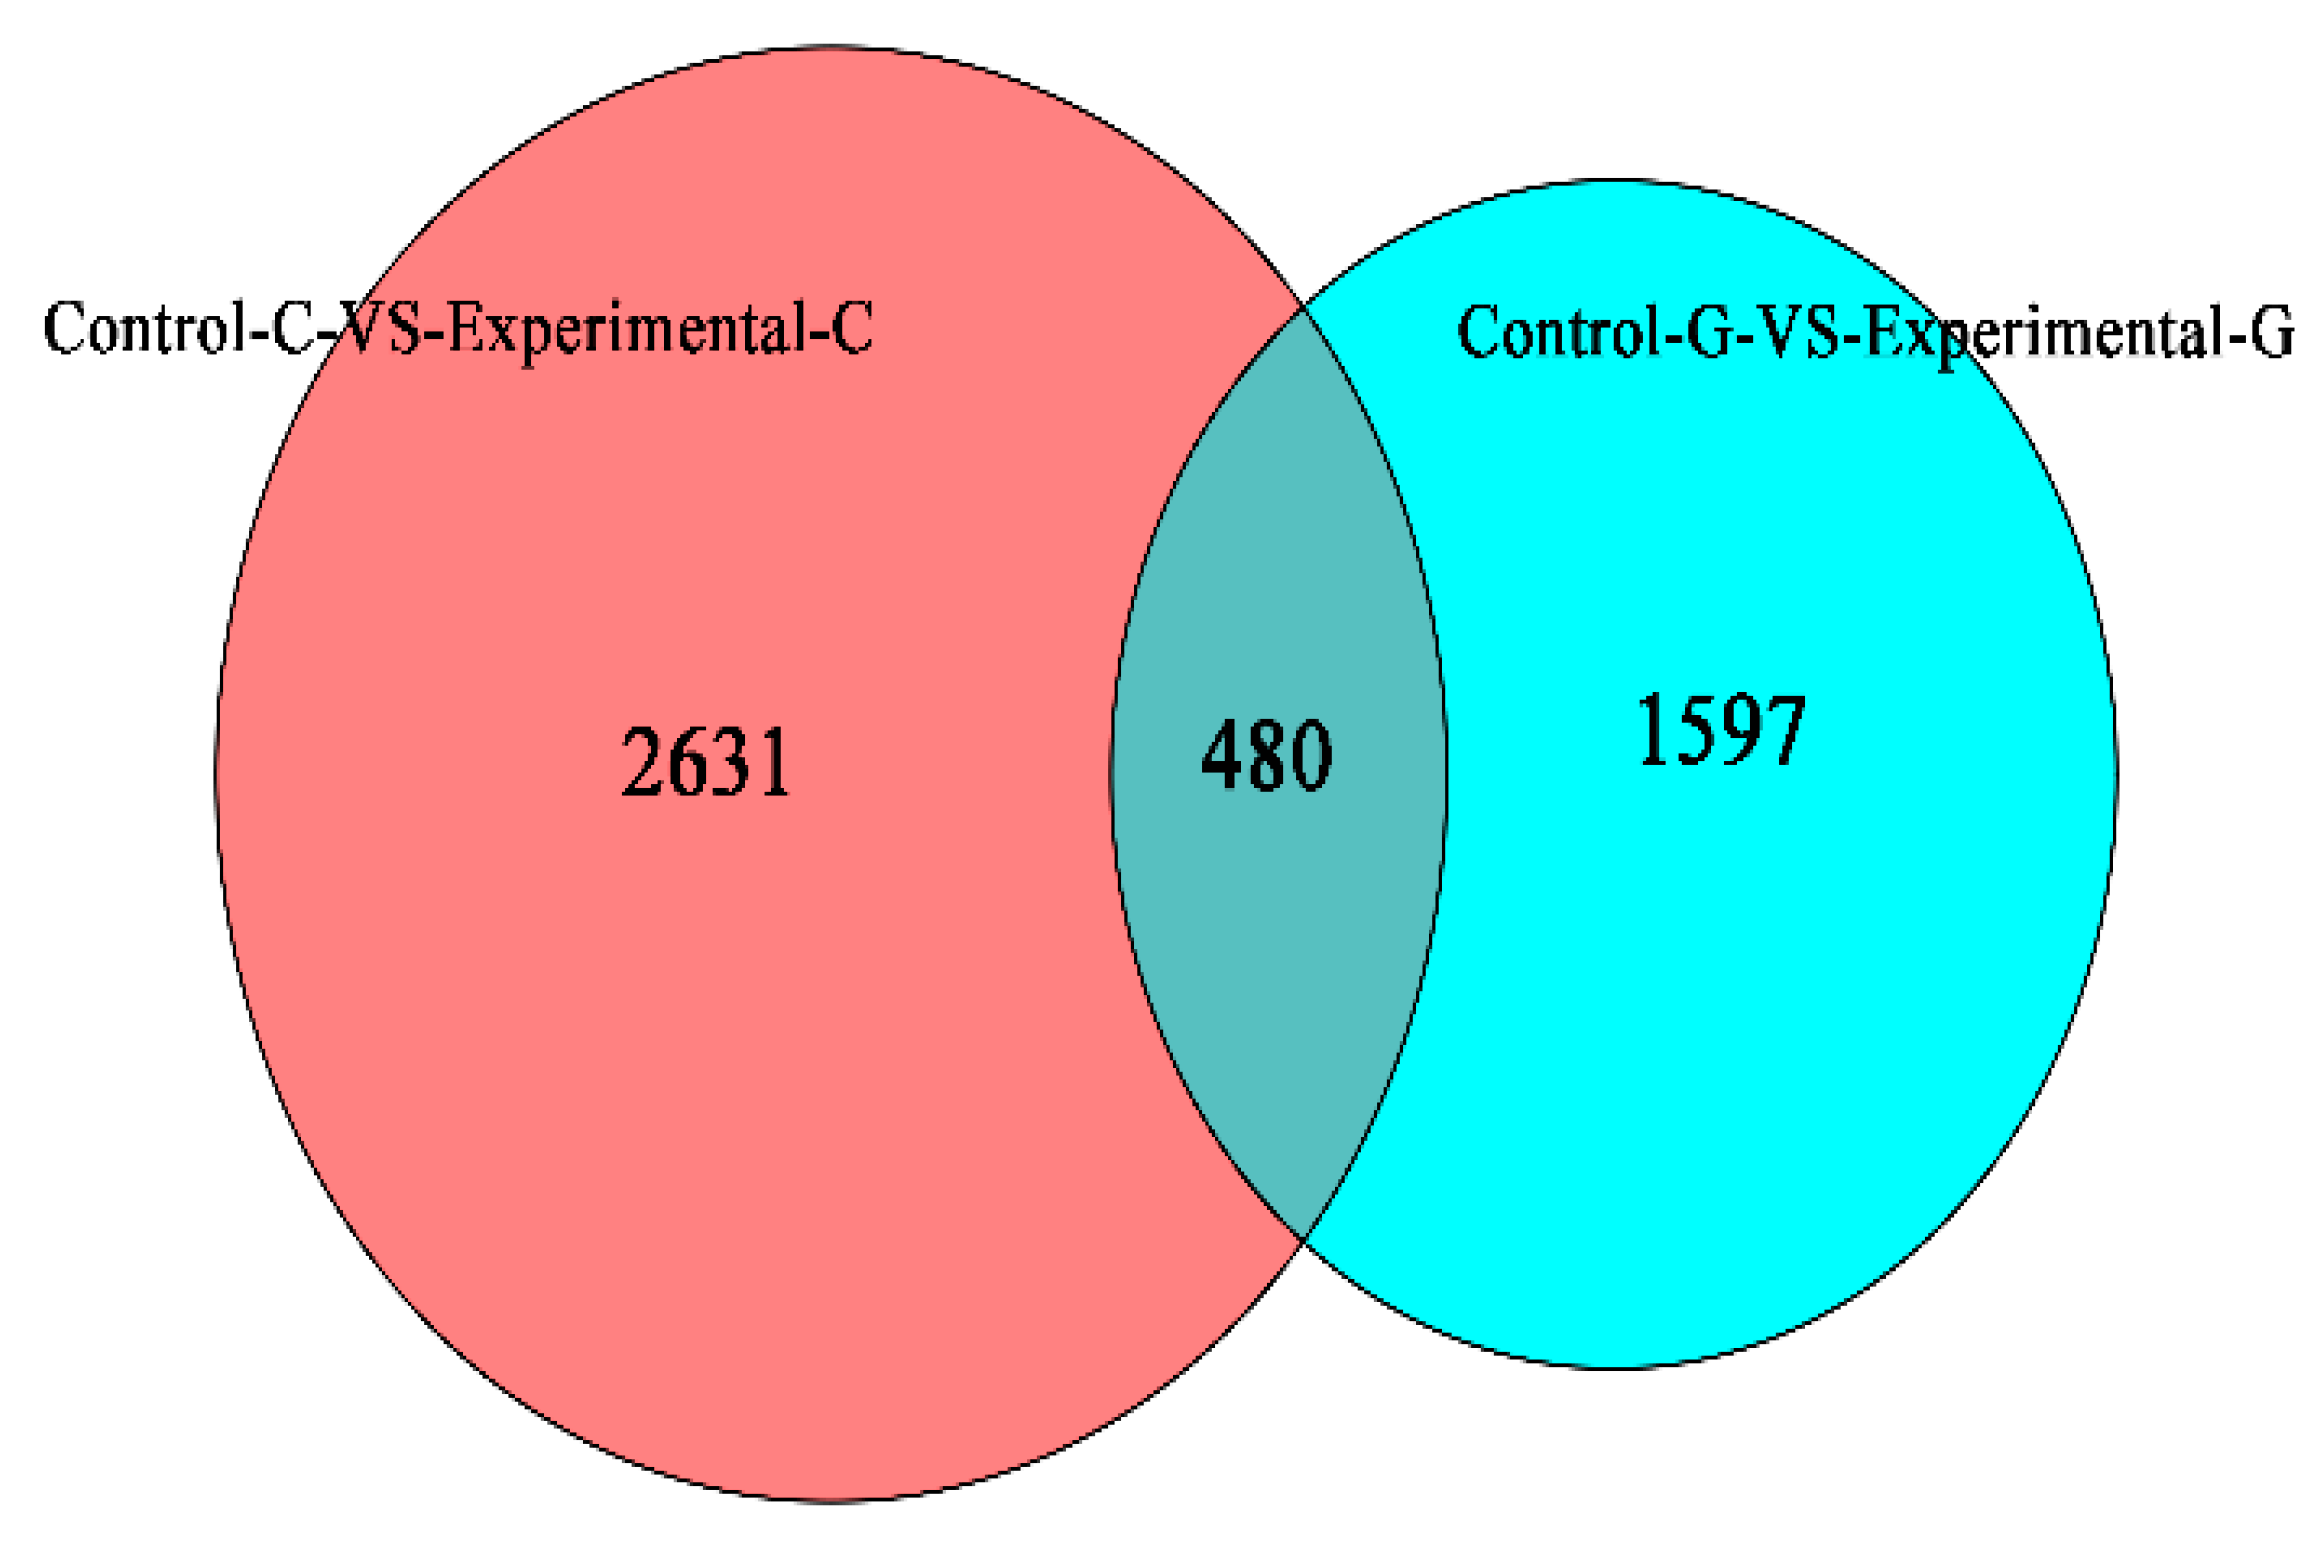
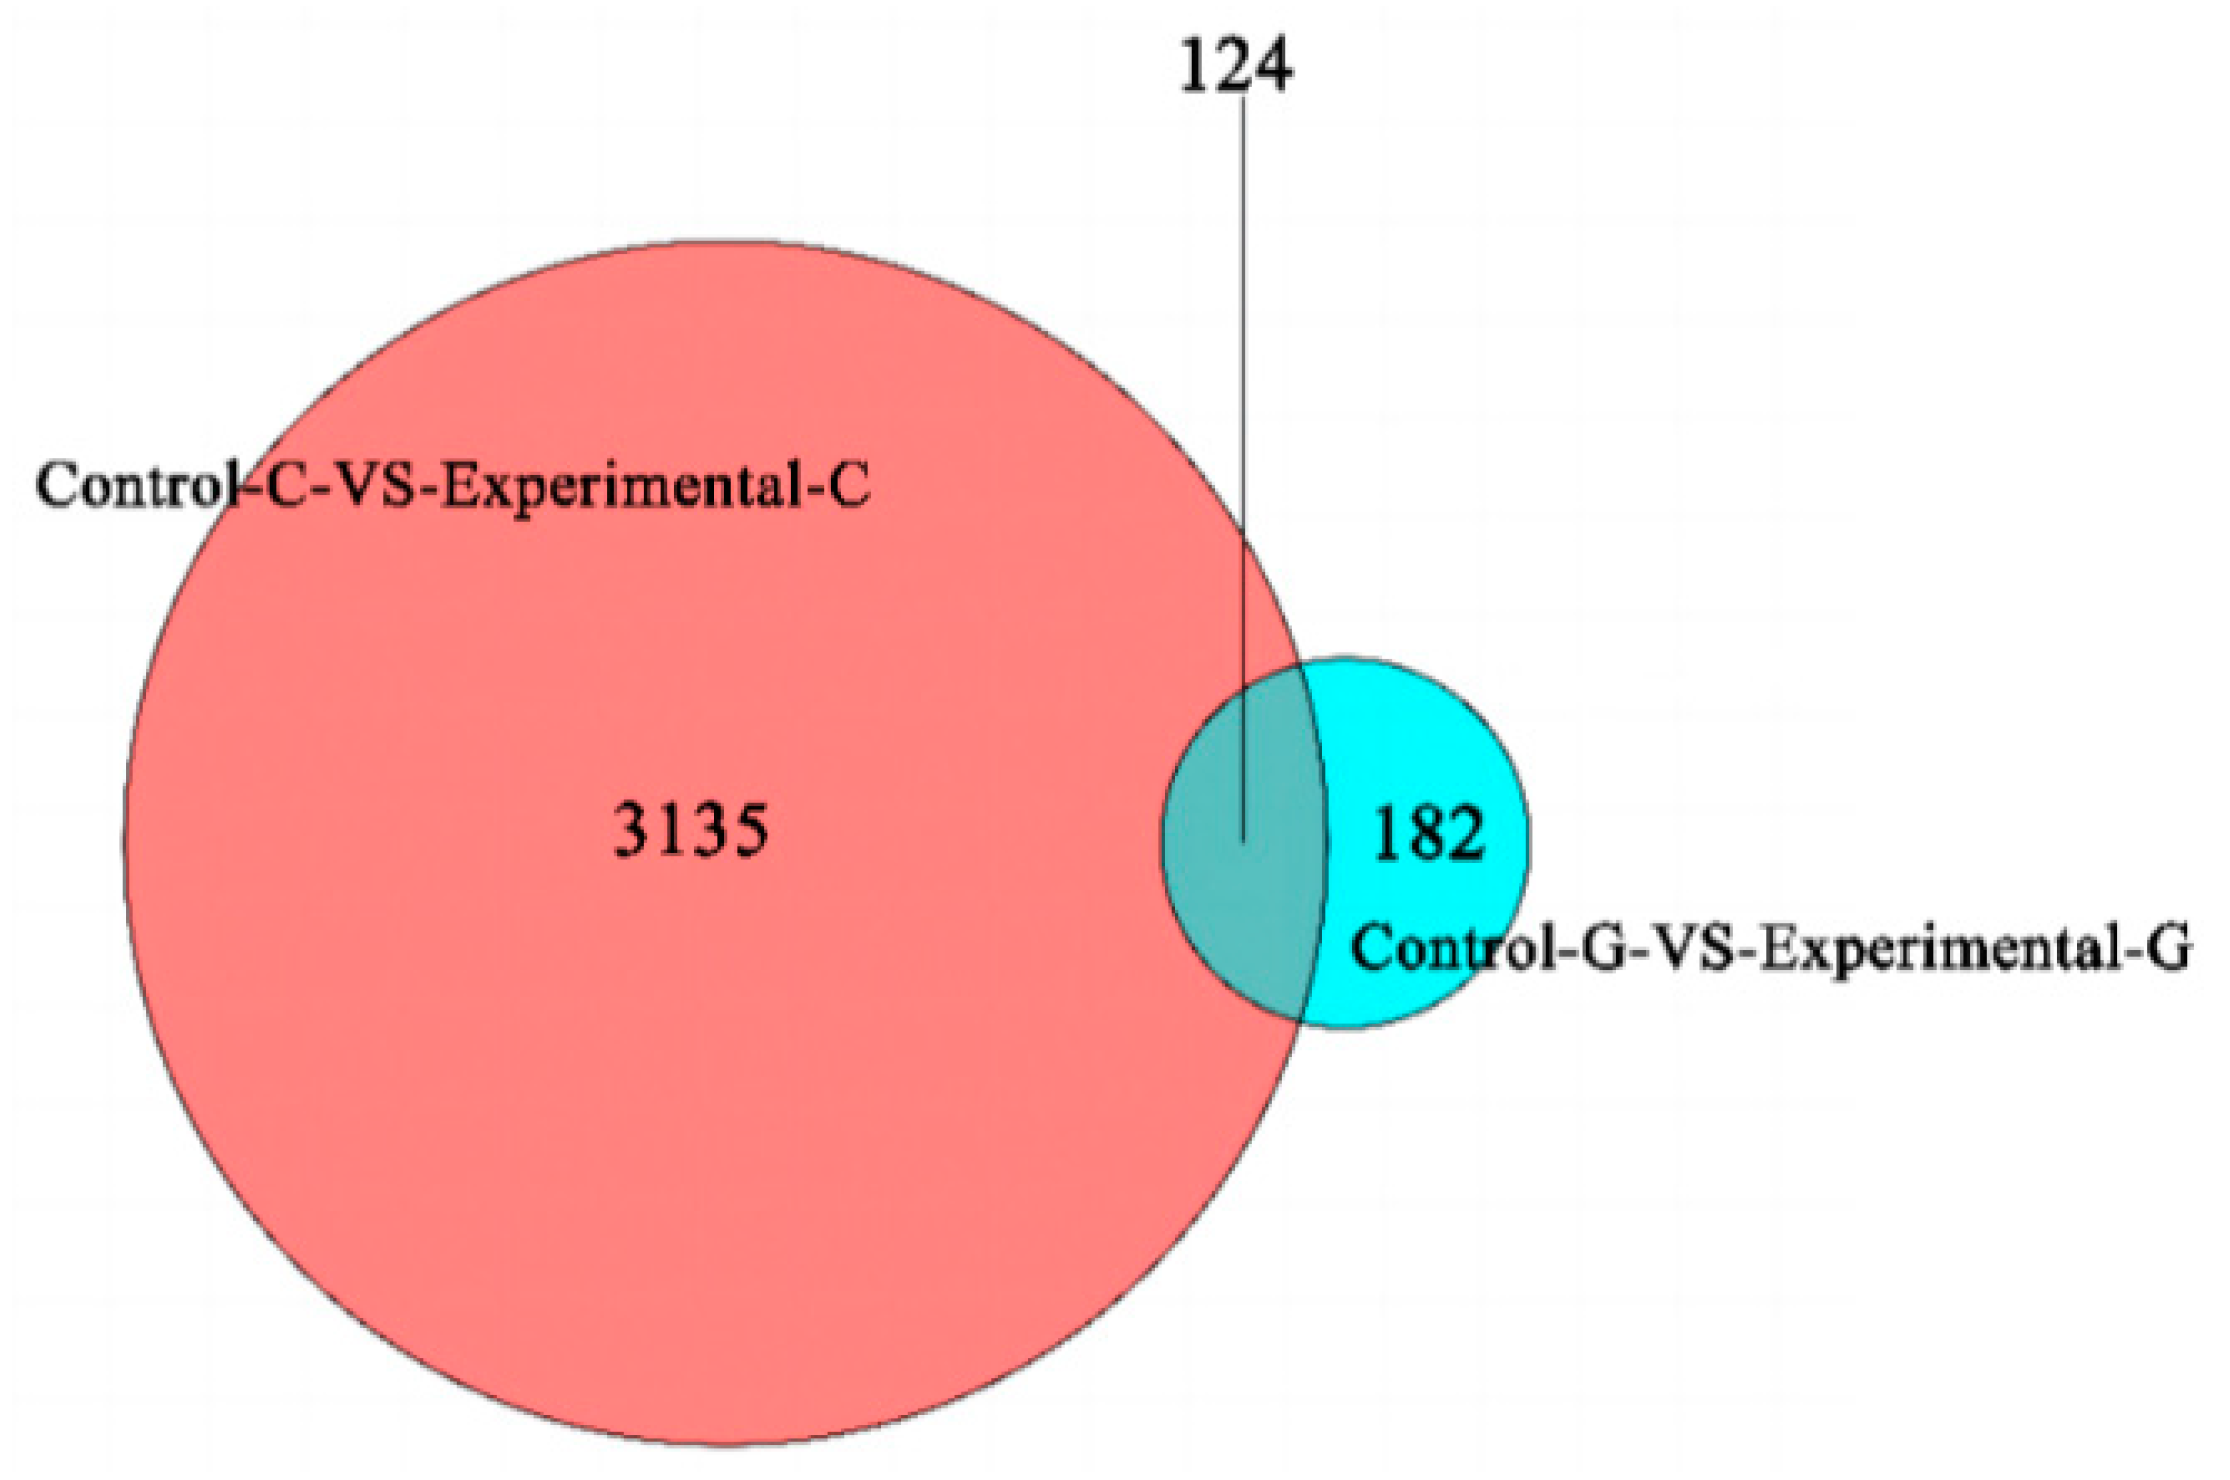
2.1. Differential Expression Analysis of lncRNA
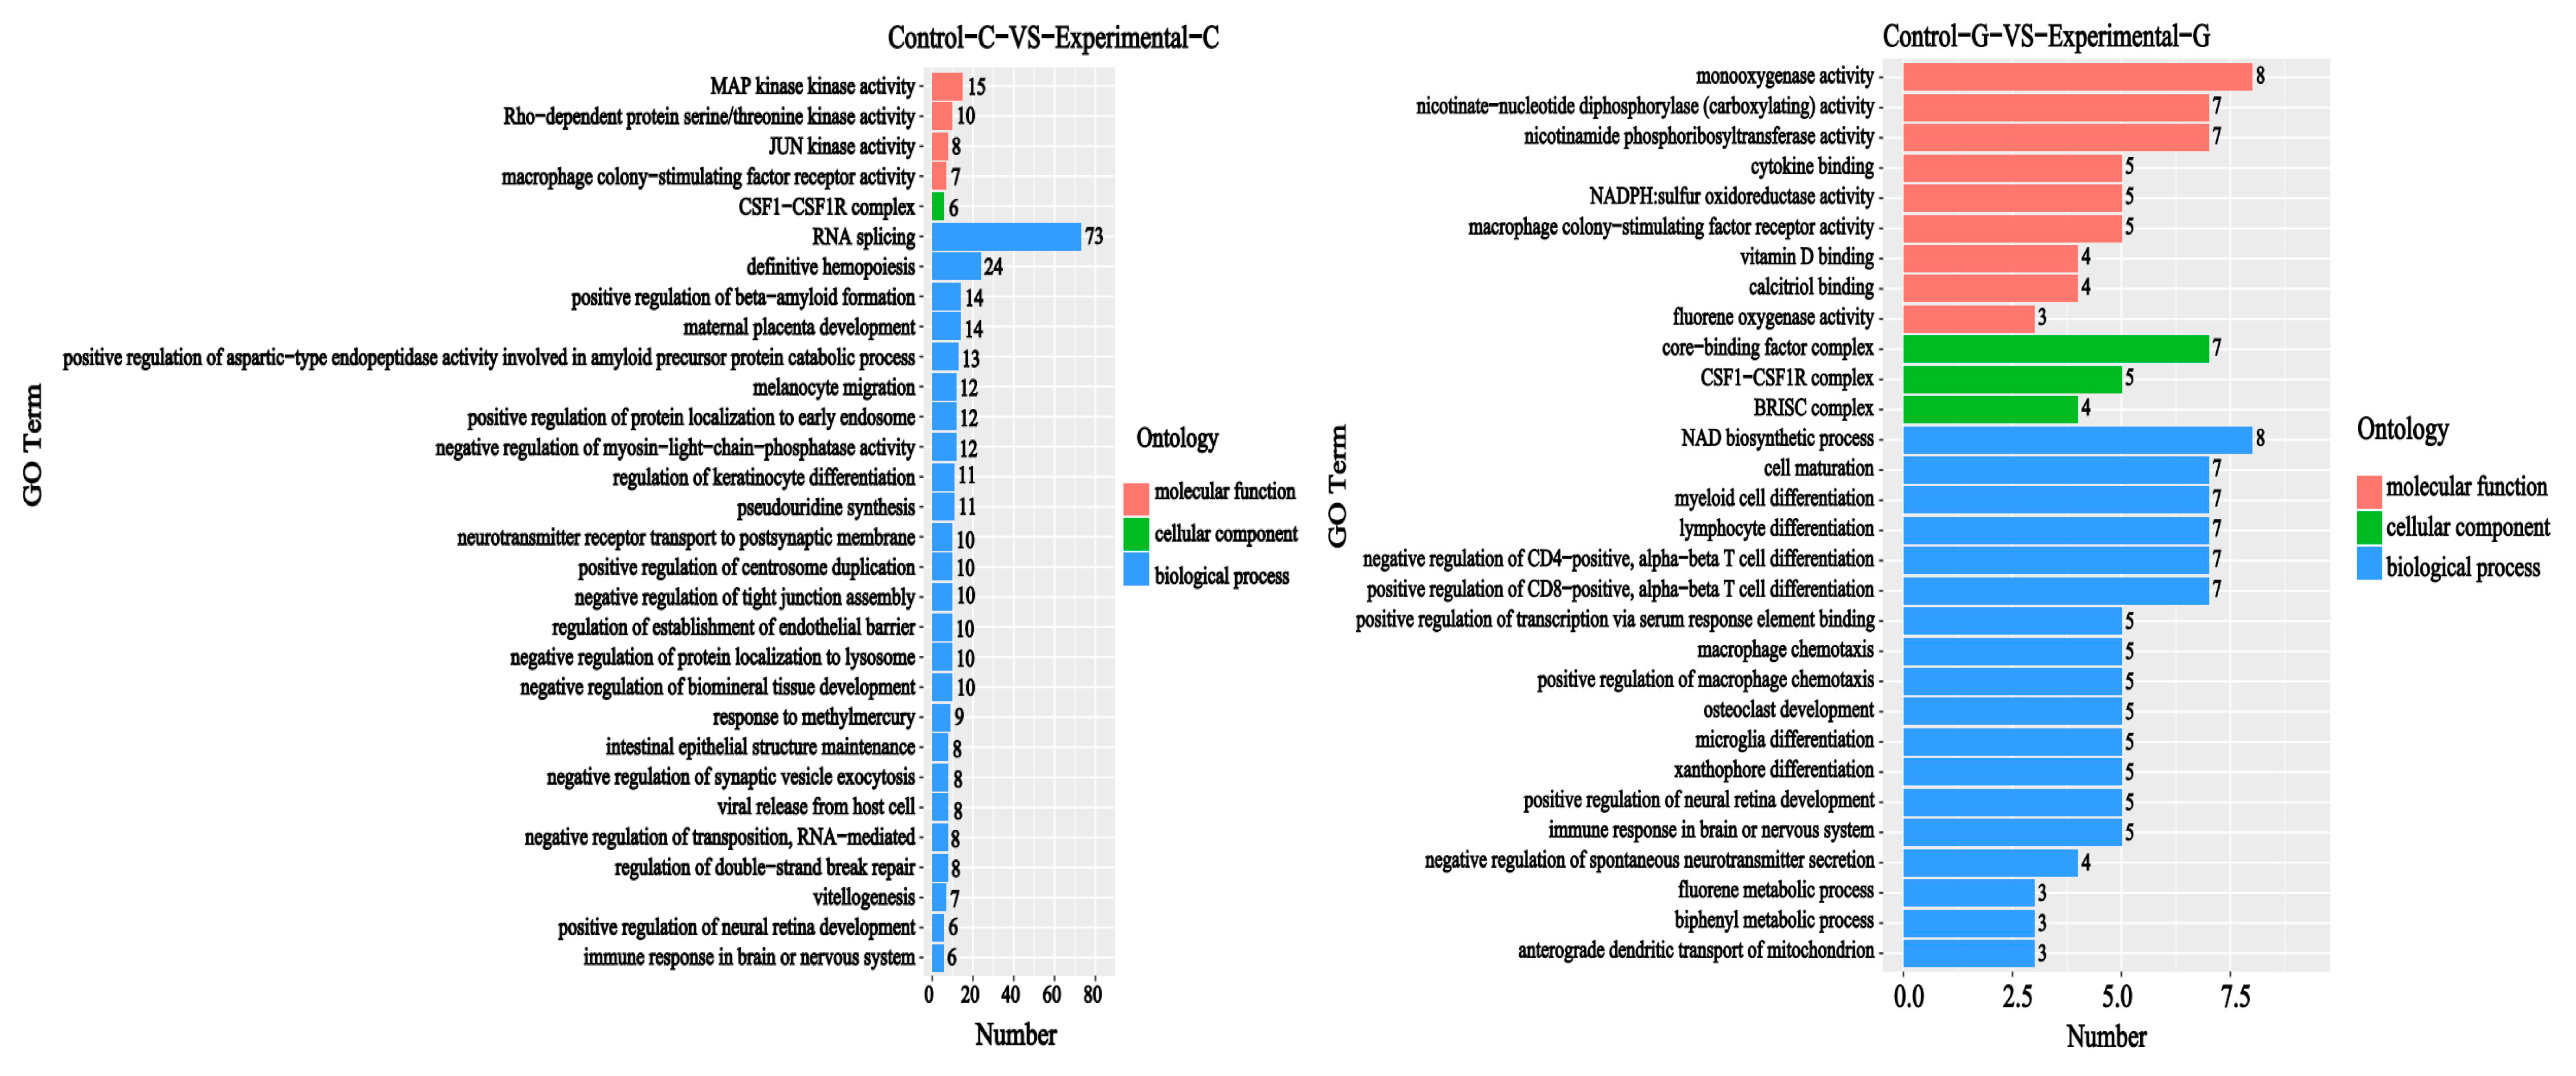
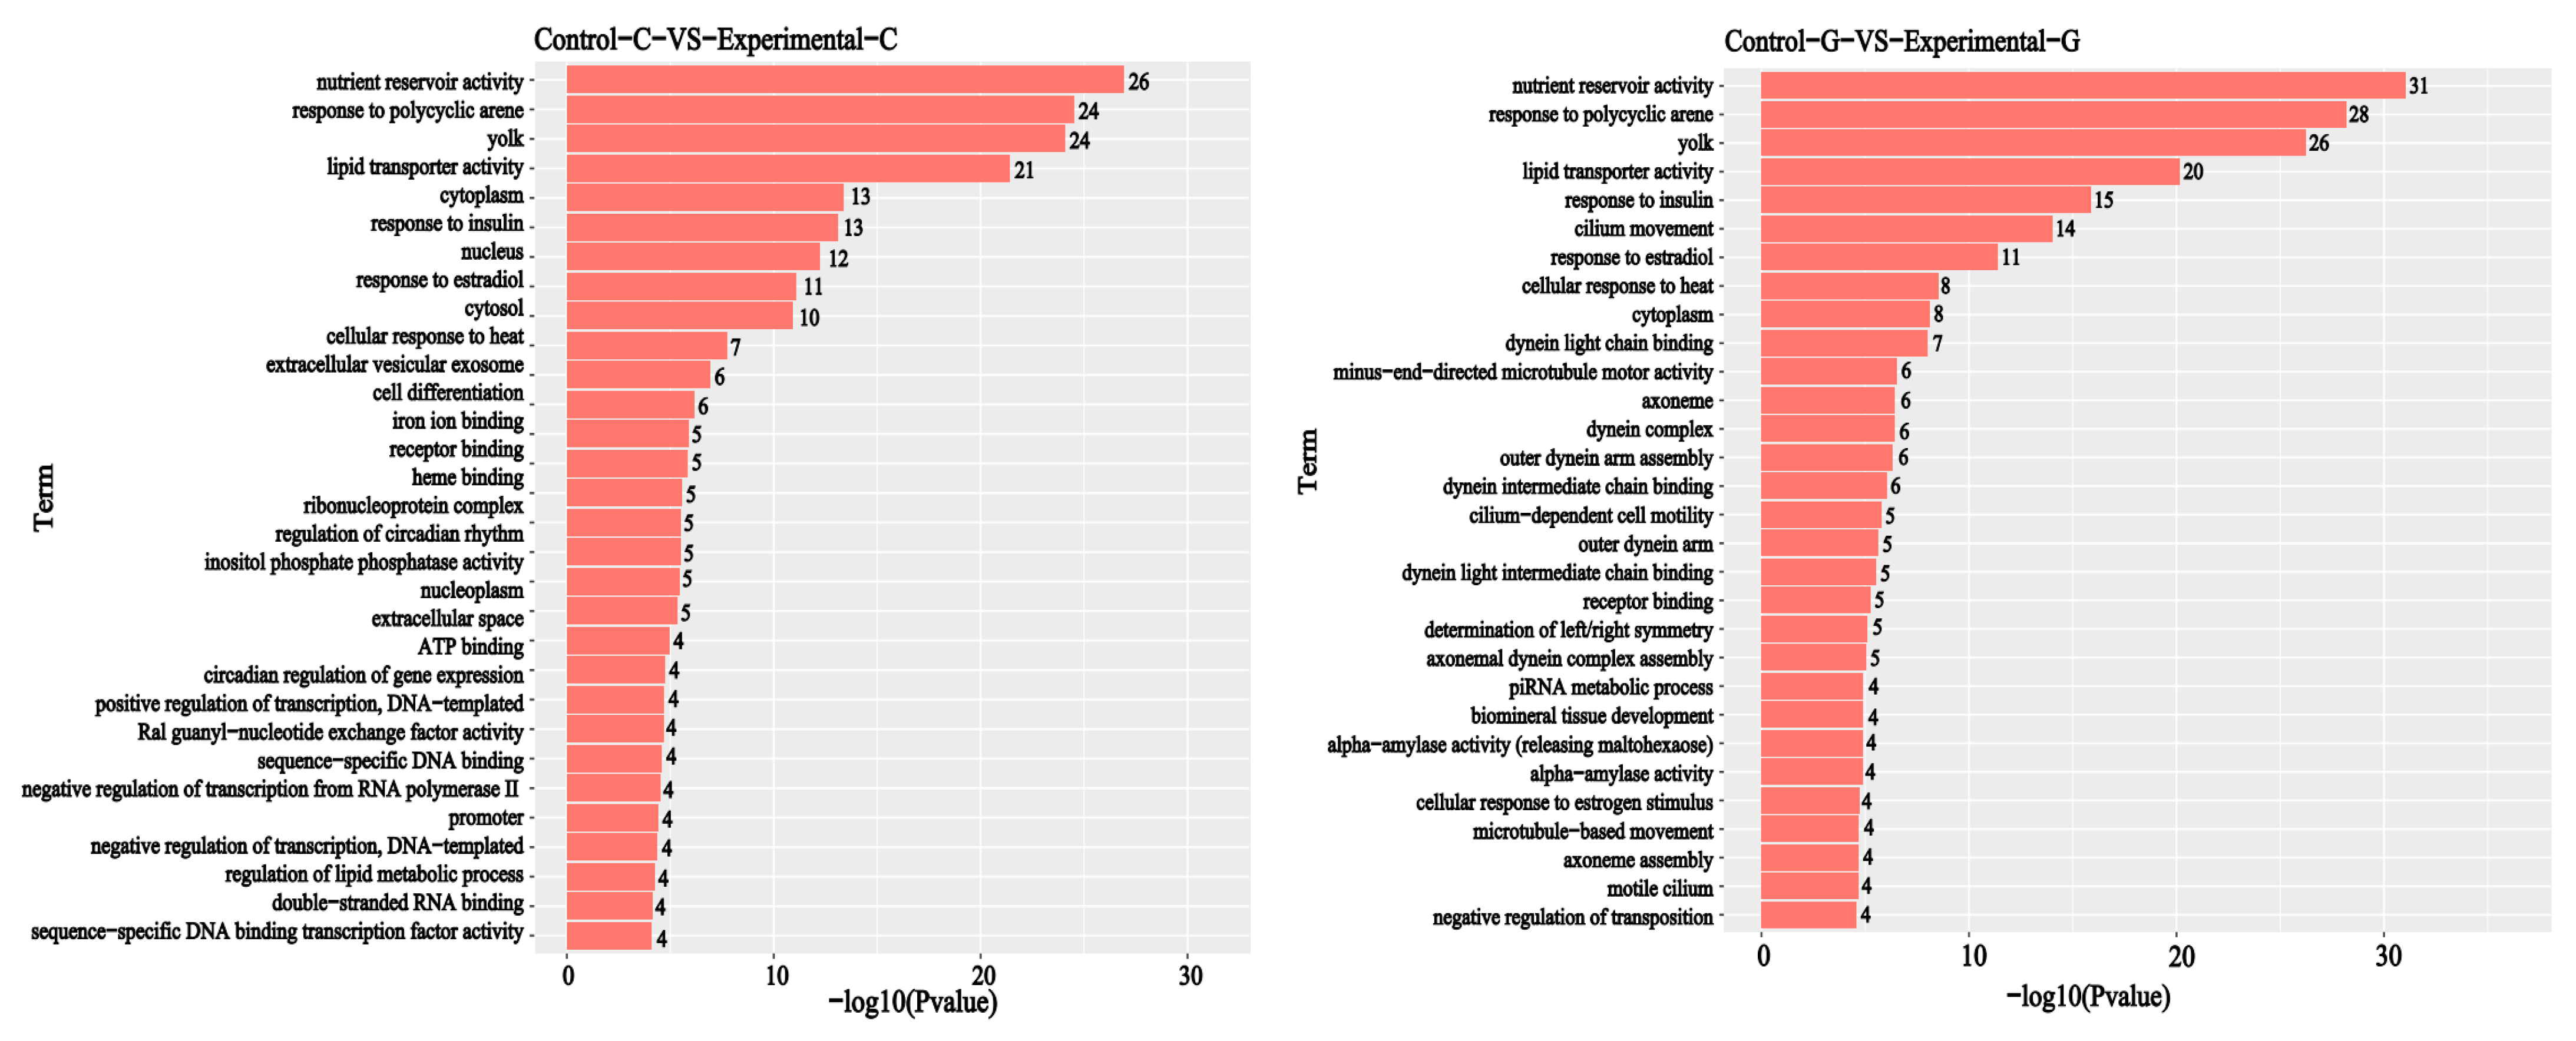
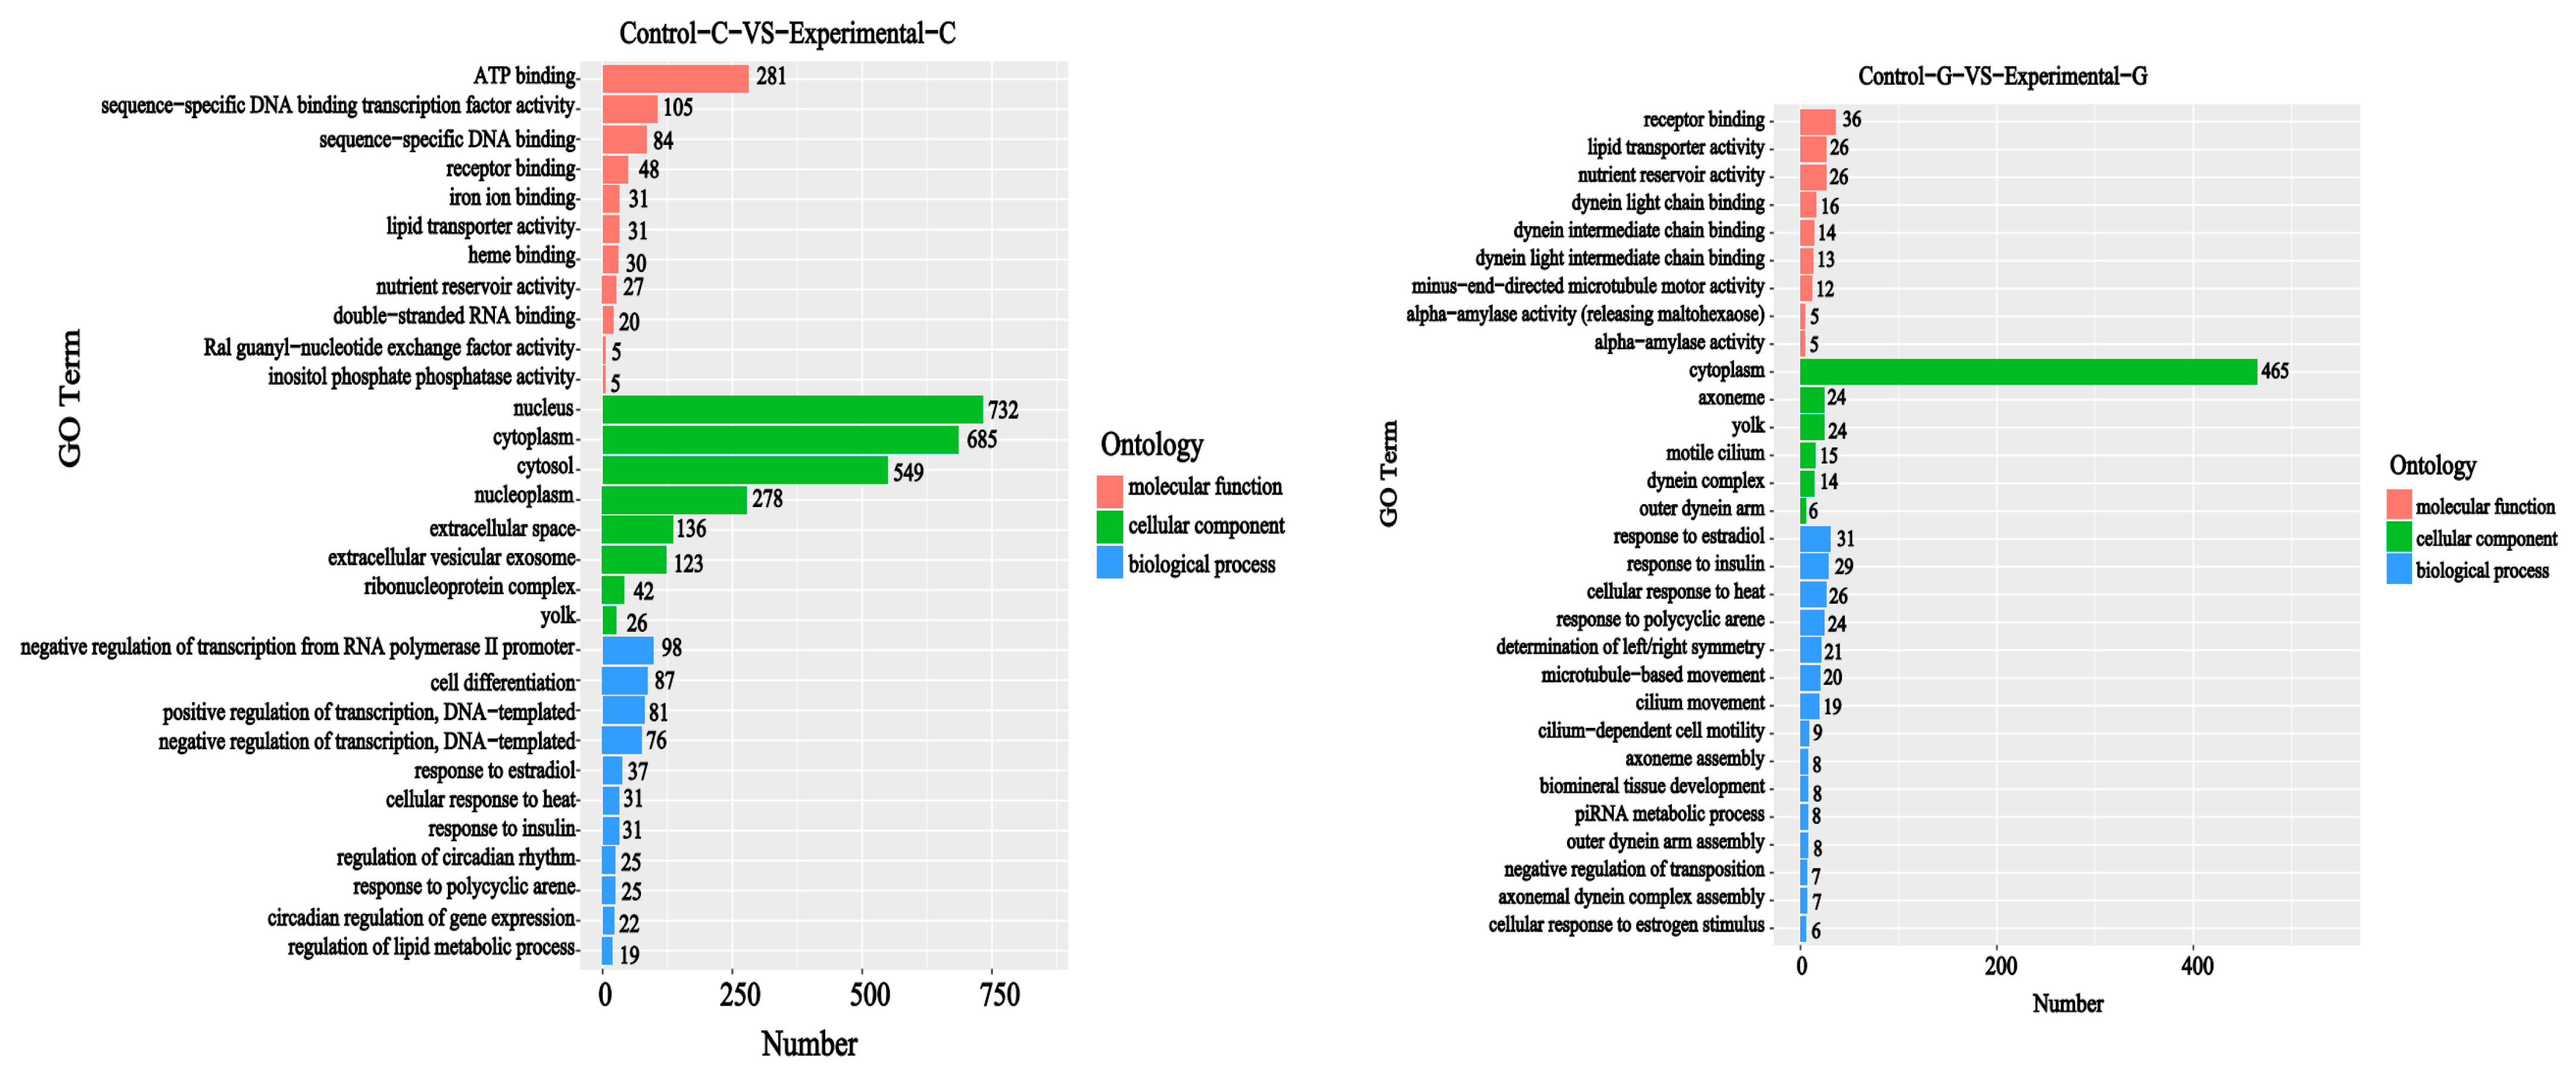
2.2. GO Functional Annotation Analysis of Differentially Expressed Genes
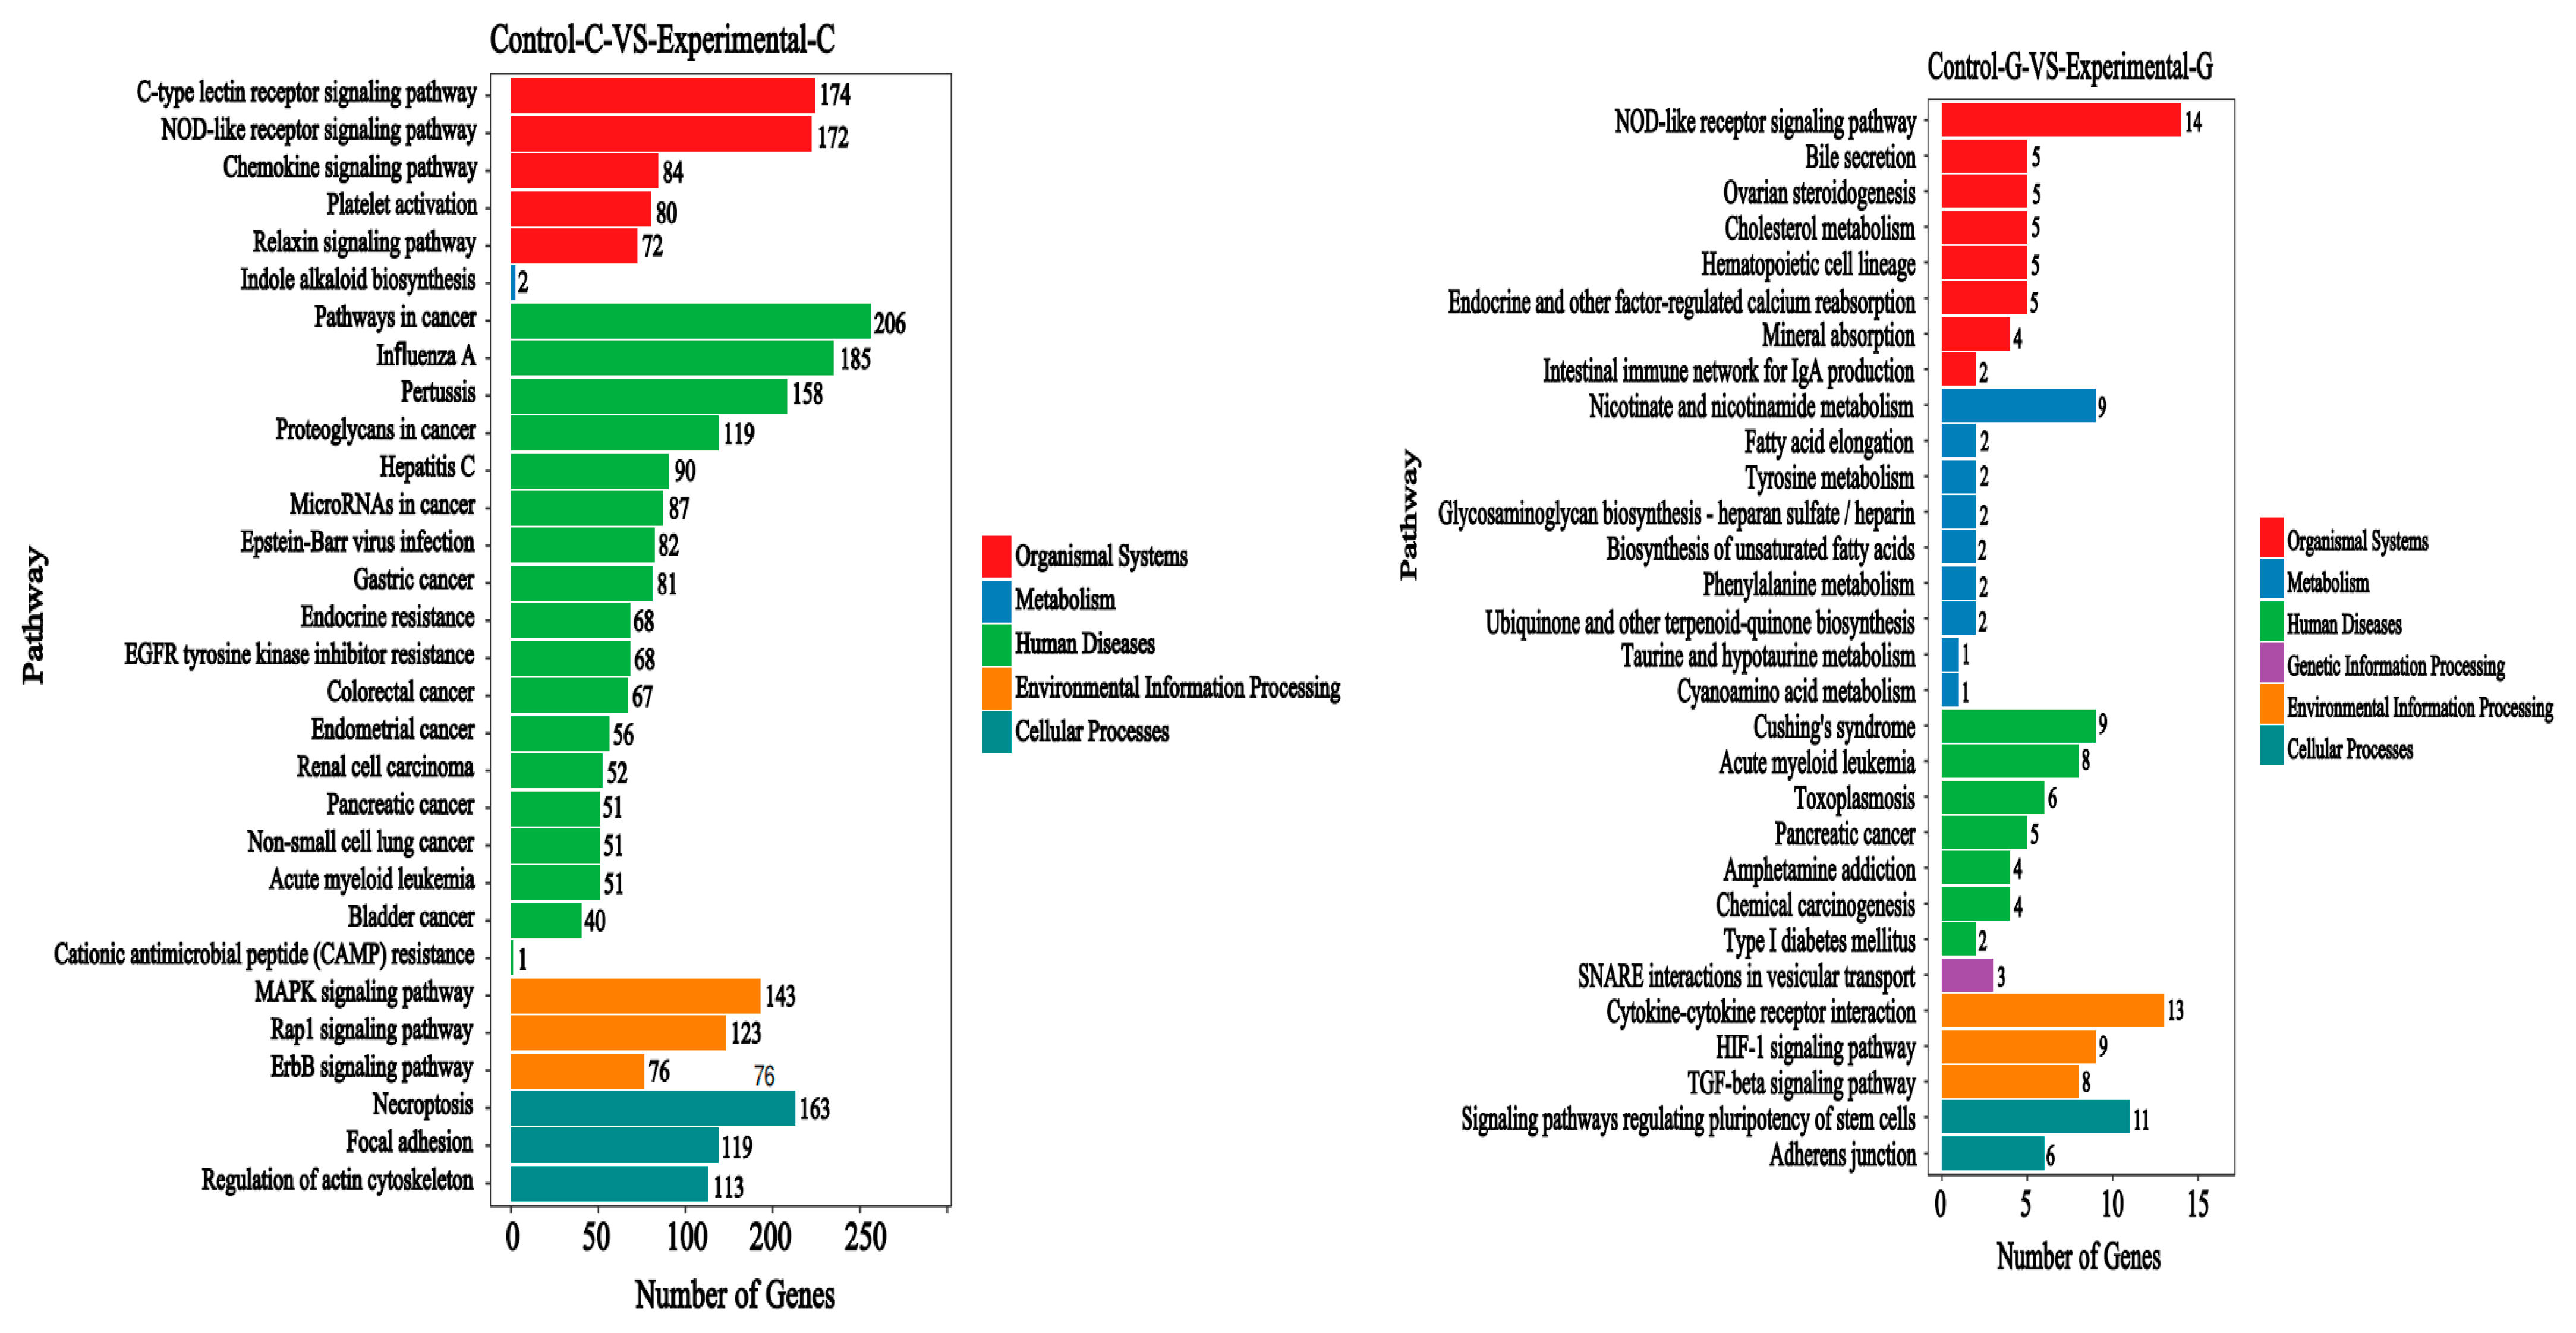
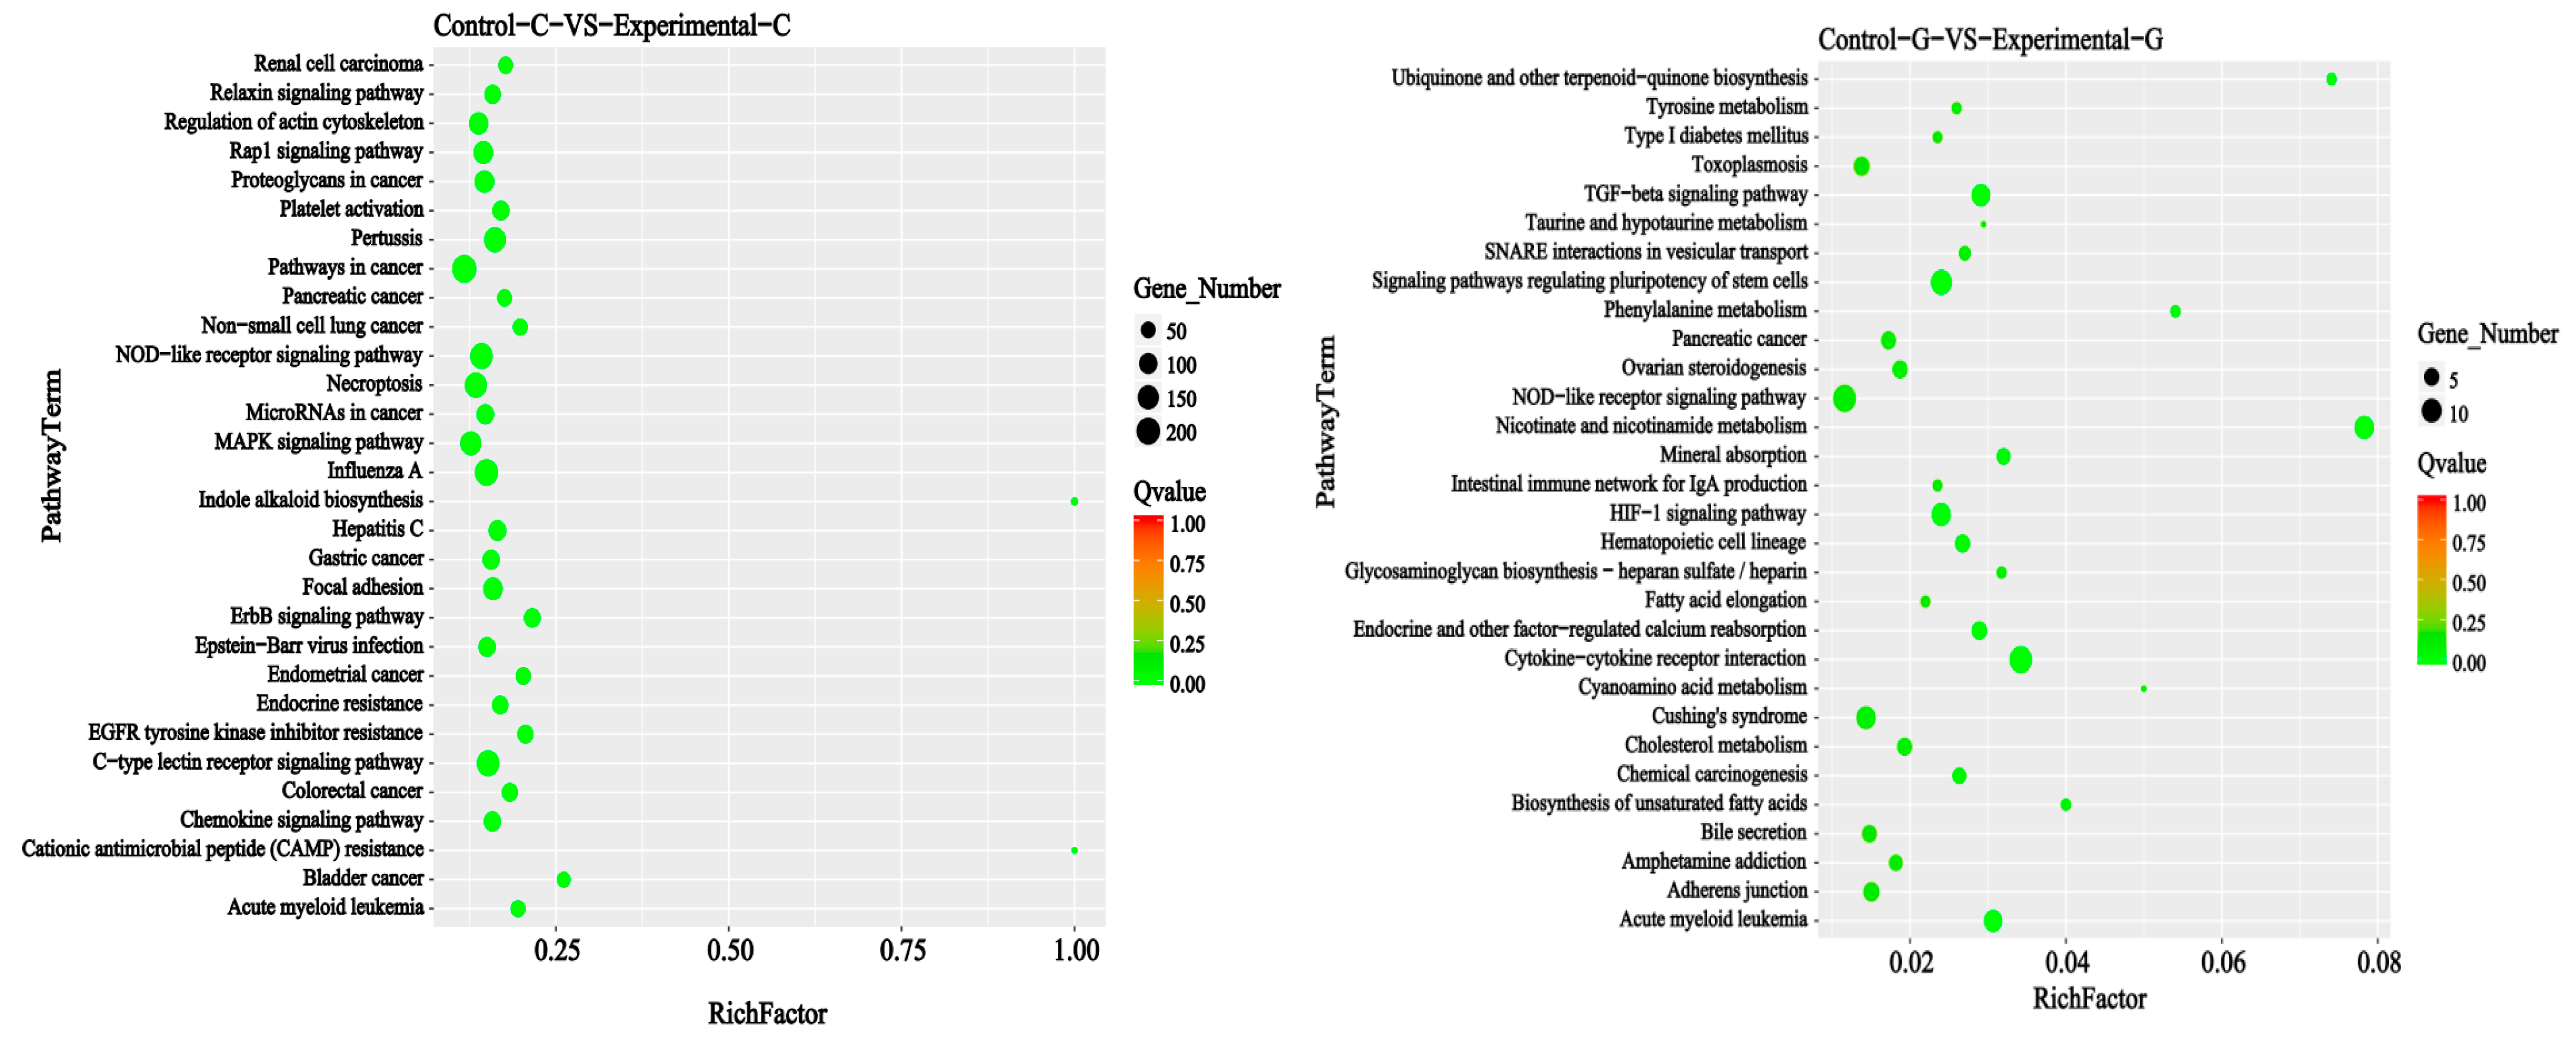
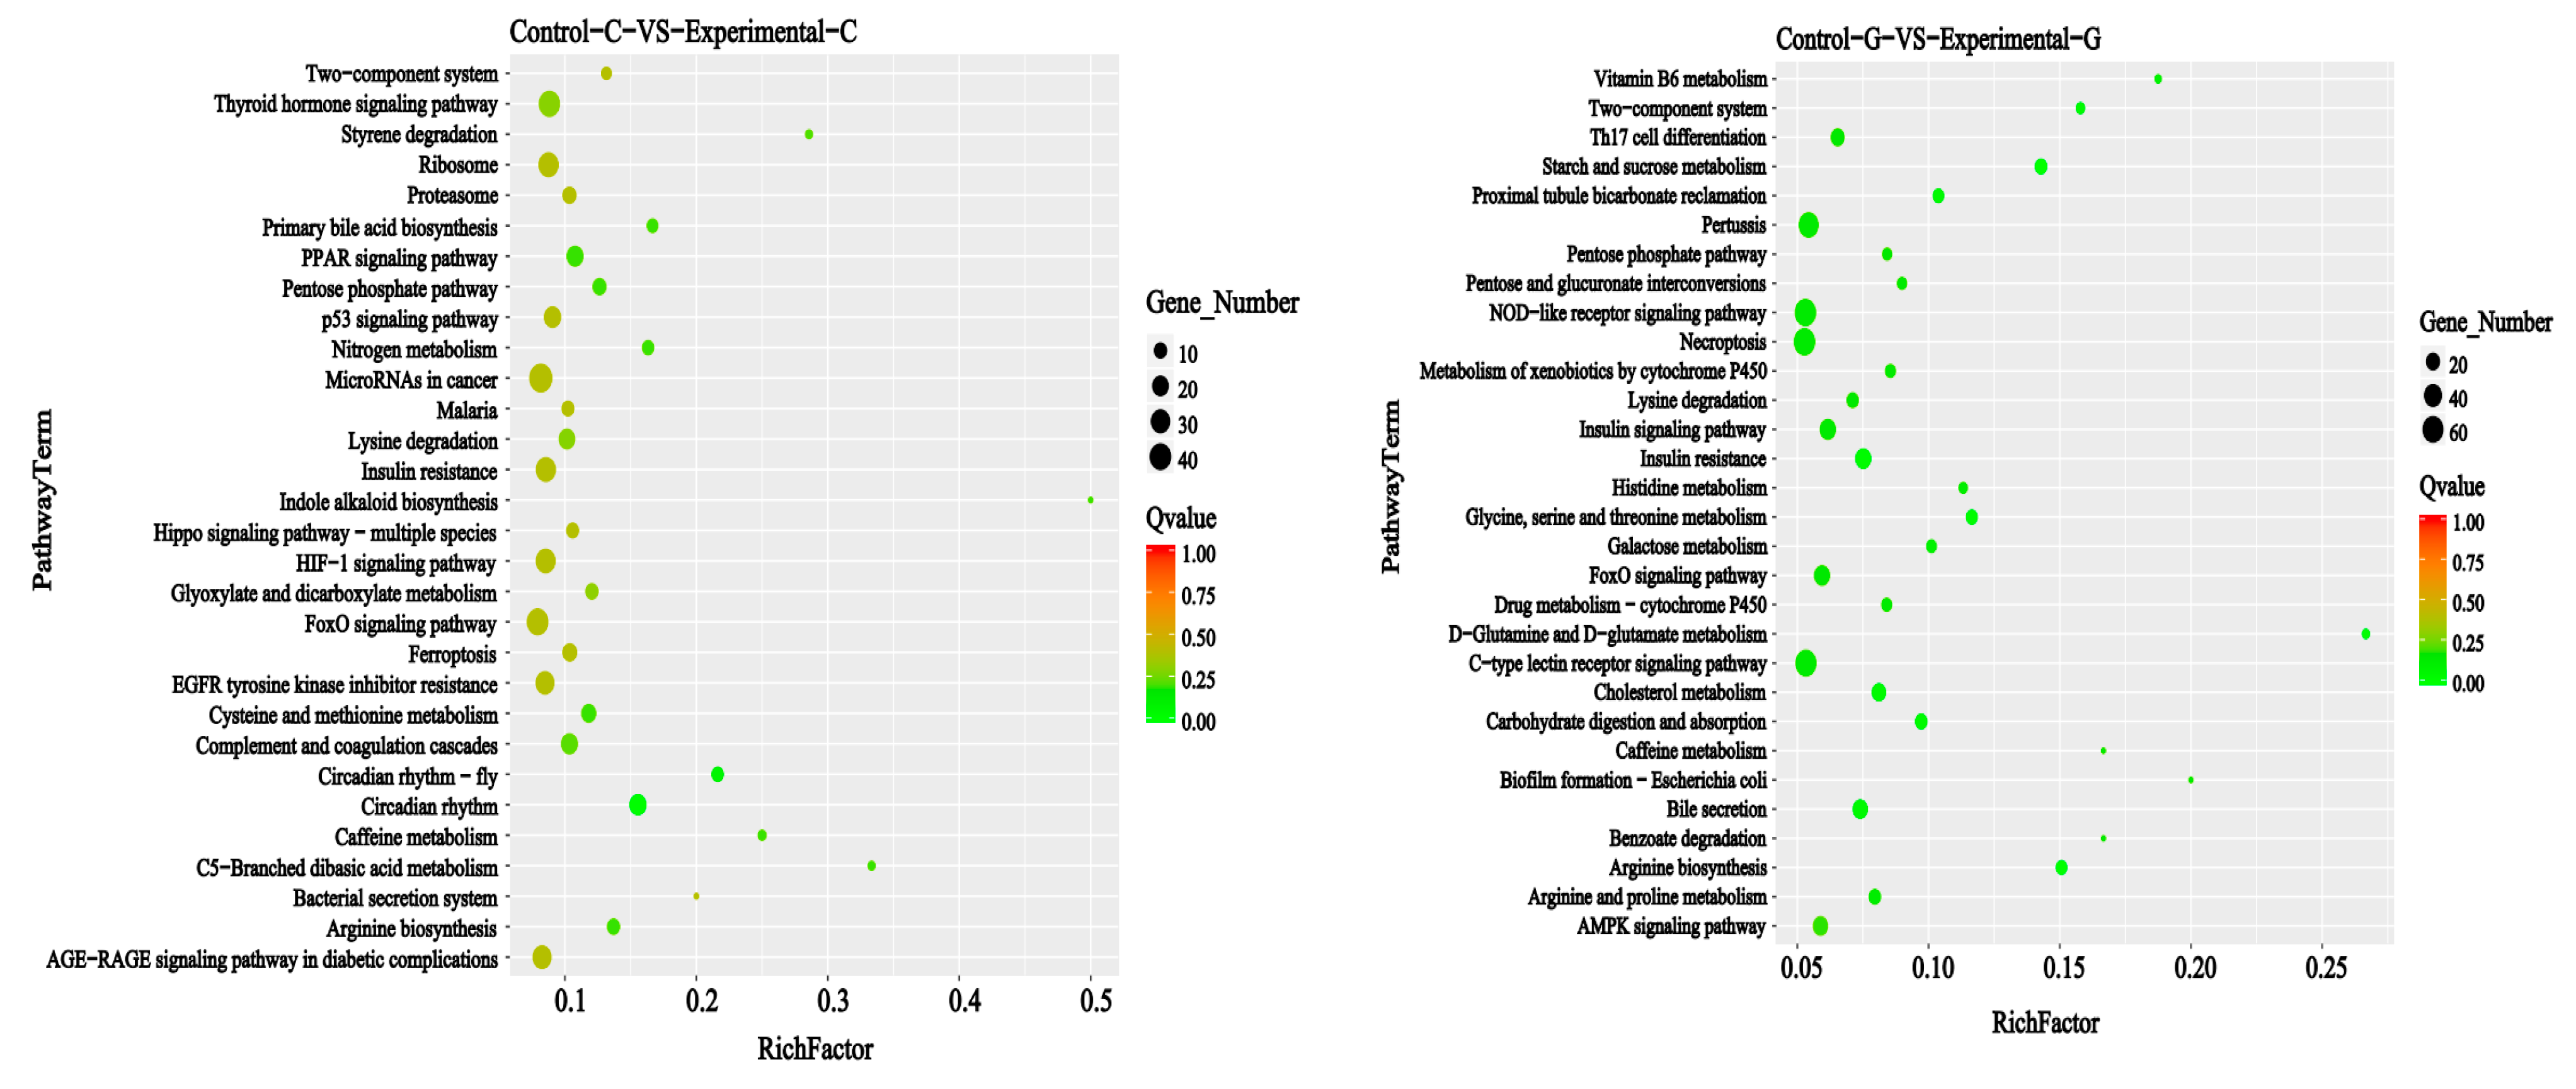
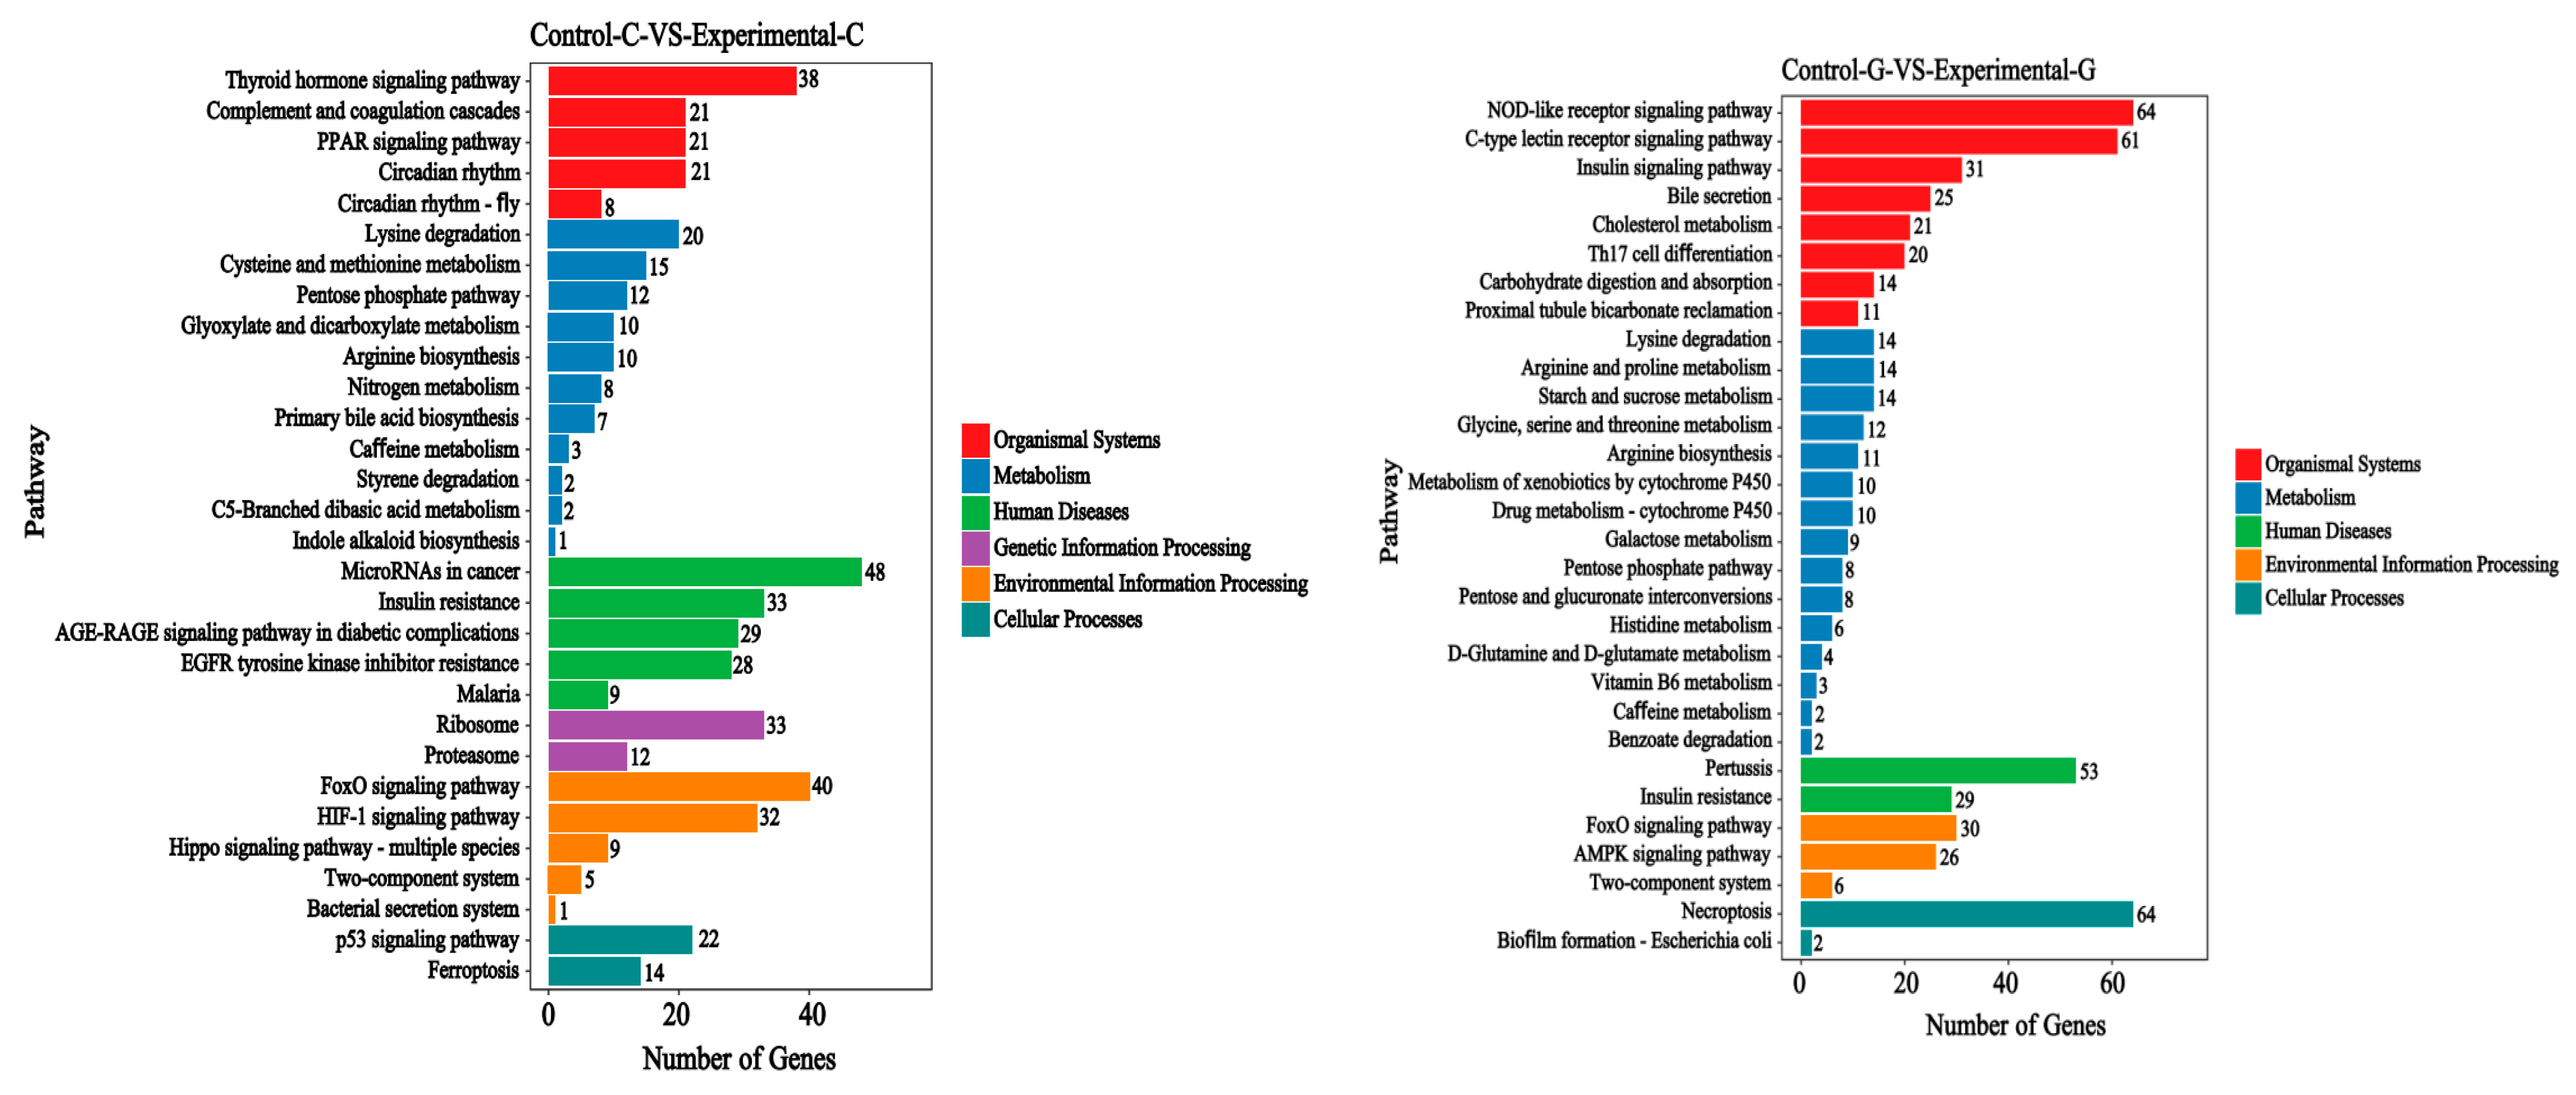
2.3. KEGG Signal Pathways Analysis
2.4. mRNA Gene Expression Analysis
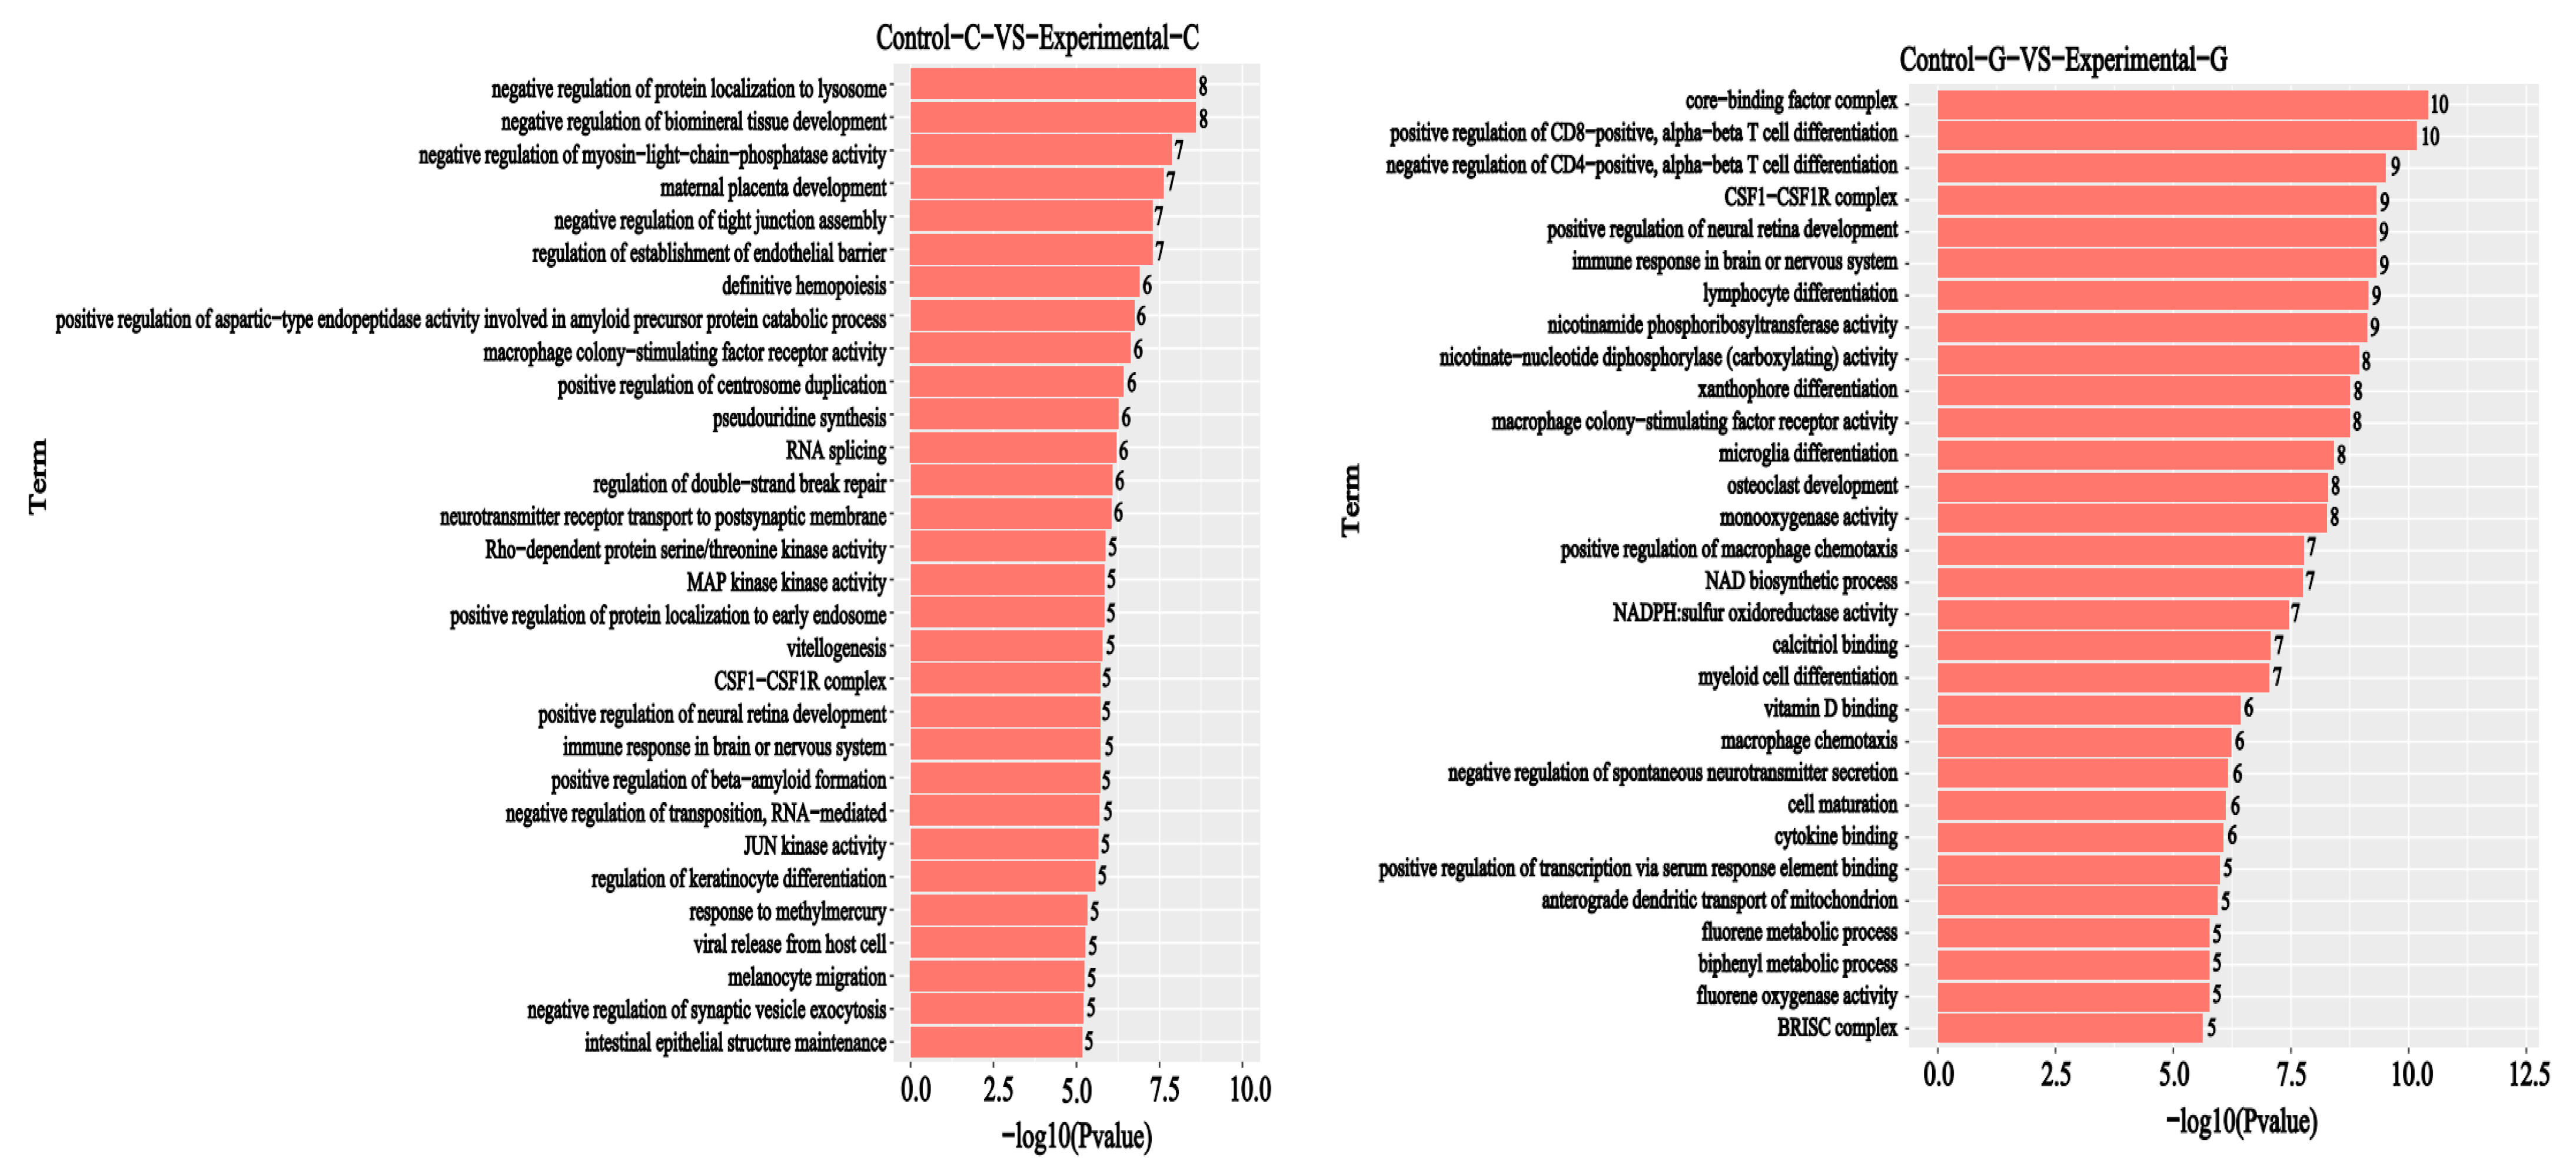
2.5. GO Enrichment Analysis of Differential Comparison Gene mRNA
2.6. KEGG Signal Pathways Analysis
3. Discussion
4. Conclusions
5. Materials and Methods
5.1. Chemicals and Reagents
5.2. Pretreatment of Zebrafish
5.3. Extraction and Detection of Total RNA from Samples
5.4. Construction of cDNA Library
5.5. High-Throughput RNA-Seq Sequencing and Screening of Differentially Expressed Genes (DEGs)
5.6. Gene Ontology (GO) and KEGG Functional Enrichment Analysis
5.7. Differential Expression Analysis of lncRNAs and mRNAs
5.8. Data Processing and Analysis
Author Contributions
Funding
Institutional Review Board Statement
Informed Consent Statement
Data Availability Statement
Acknowledgments
Conflicts of Interest
References
- Morooka, N.; Uratsuji, N.; Yoshizawa, T.; Yamamoto, H. Studies on the toxic substances in barley infected with Fusarium spp. J. Food Hyg. Soc. Jpn. 1972, 13, 368–375. [Google Scholar] [CrossRef]
- Chen, Y.; Kistler, H.C.; Ma, Z. Fusarium Graminearum Trichothecene Mycotoxins: Biosynthesis, regulation, and management. Annu. Rev. Phytopathol. 2019, 57, 15–39. [Google Scholar] [CrossRef]
- Binder, E.M.; Tan, L.M.; Chin, L.J.; Handl, J.; Richard, J. Worldwide occurrence of mycotoxins in commodities, feeds and feed ingredients. Anim. Feed Sci. Technol. 2007, 137, 265–282. [Google Scholar] [CrossRef]
- Gruber-Dorninger, C.; Jenkins, T.; Schatzmayr, G. Global mycotoxin occurrence in feed: A ten-year survey. Toxins 2019, 11, 375. [Google Scholar] [CrossRef]
- Zhao, L.; Zhang, L.; Xu, Z.; Liu, X.; Sun, L. Occurrence of aflatoxin B1, deoxynivalenol and zearalenone in feeds in China during 2018-2020. J. Anim. Sci. Biotechnol. 2021, 12, 74. [Google Scholar] [CrossRef]
- Knutsen, H.K.; Alexander, J.; Barregard, L.; Bignami, M.; Bruschweiler, B.; Ceccatelli, S.; Cottrill, B.; Dinovi, M.; Grasl-Kraupp, B.; Hogstrand, C. Risks for animal health related to the presence of zearalenone and its modified forms in feed. Efsa J. 2017, 15, 4718. [Google Scholar] [CrossRef]
- Listed, N.A. Toxins derived from Fusarium graminearum, F. culmorum and F. crookwellense: Zearalenone, deoxynivalenol, nivalenol and fusarenone X. IARC Monogr. Eval. Carcinog. Risks Hum. 1993, 56, 397–444. [Google Scholar] [CrossRef]
- Commission, E. Commission recommendation of 17 August 2006 on the presence of deoxynivalenol, zearalenone, ochratoxin A, T-2 and HT-2 and fumonisins in products intended for animal feeding. Off. J. Eur. Union. 2006, L229, 7–9. [Google Scholar]
- Trenholm, H.L.; Hamilton, R.M.G.; Friend, D.W.; Thompson, B.K.; Hartin, K.E. Feeding trials with vomitoxin (deoxynivalenol)-contaminated wheat: Effects on swine, poultry, and dairy cattle. J. Am. Vet. Med. Assoc. 1984, 185, 527–531. [Google Scholar] [CrossRef]
- Yao, Y.; Long, M. The biological detoxification of deoxynivalenol: A review. Food Chem. Toxicol. 2020, 145, 111649. [Google Scholar] [CrossRef]
- Awad, W.A.; Aschenbach, J.R.; Zentek, J. Cytotoxicity and metabolic stress induced by deoxynivalenol in the porcine intestinal IPEC-J2 cell line. Journal of Animal Physiology and Animal Nutrition. 2012, 96, 717–724. [Google Scholar] [CrossRef]
- Liu, M.; Zhang, L.; Mo, Y.; Li, J.; Yang, J.; Wang, J.; Karrow, N.A.; Wu, H.; Sun, L. Ferroptosis is involved in deoxynivalenol-induced intestinal damage in pigs. J. Anim. Sci. Biotechnol. 2023, 14, 1–10. [Google Scholar] [CrossRef]
- Waśkiewicz, A.; Beszterda, M.; Kostecki, M.; Zielonka, Ł.; Goliński, P. Deoxynivalenol in the gastrointestinal tract of immature gilts under per os toxin application. Toxins 2014, 6, 973–987. [Google Scholar] [CrossRef]
- Ji, X.; Qiao, Y.; Zheng, W.; Jiang, H.; Yao, W. Deoxynivalenol interferes with intestinal motility via injuring the contractility of enteric smooth muscle cells: A novel hazard to the gastrointestinal tract by environmental toxins. Ecotoxicol. Environ. Saf. 2021, 224, 112656. [Google Scholar] [CrossRef]
- Huang, C.; Feng, L.; Jiang, W.D.; Wu, P.; Liu, Y.; Zeng, Y.Y.; Jiang, J.; Kuang, S.Y.; Tang, L.; Zhou, X.Q. Deoxynivalenol decreased intestinal immune function related to NF-kappaB and TOR signalling in juvenile grass carp (Ctenopharyngodon idella). Fish Shell-fish Immunol. 2018, 84, 470–484. [Google Scholar] [CrossRef]
- Wang, Y.; Wang, Q.; Ji, C.; Guo, X.; Yang, G.; Wang, D.; Weng, H.; Qian, Y.; Chen, C. Mixture toxic impacts and the related mechanism of afatoxin B1 and deoxynivalenol on embryonic zebrafsh (Danio rerio). Environ. Sci. Eur. 2021, 33, 86. [Google Scholar] [CrossRef]
- Muthulakshmi, S.; Maharajan, K.; Habibi, H.R.; Kadirvelu, K.; Venkataramana, M. Zearalenone induced embryo and neurotoxicity in zebrafish model (Danio rerio): Role of oxidative stress revealed by a multi biomarker study. Chemosphere 2018, 198, 111–121. [Google Scholar] [CrossRef]
- Sanden, M.; Jørgensen, S.; Hemre, G.-I.; Ørnsrud, R.; Sissener, N.H. Zebrafish (Danio rerio) as a model for investigating dietary toxic effects of deoxynivalenol contamination in aquaculture feeds. Food Chem. Toxicol. 2012, 50, 4441–4448. [Google Scholar] [CrossRef]
- Yan, L.; Zhao, C.Y. Liver: A new immune organ. Int. J. Intern. Med. 2009, 36, 206–210. [Google Scholar]
- Holanda, D.M.; Kim, S.W. Investigation of the efficacy of mycotoxin-detoxifying additive on health and growth of newly-weaned pigs under deoxynivalenol challenges. Anim. Biosci. 2020, 34, 405–416. [Google Scholar] [CrossRef]
- Eskola, M.; Kos, G.; Elliott, C.T.; Hajšlová, J.; Mayar, S.; Krska, R. Worldwide contamination of food-crops with mycotoxins: Validity of the widely cited ‘FAO estimate’ of 25%. Crit. Rev. Food Sci. Nutr. 2019, 9, 2773–2789. [Google Scholar] [CrossRef]
- Schatzmayr, G.; Streit, E. Global occurrence of mycotoxins in the food and feed chain: Facts and figures. World Mycotoxin J. 2013, 6, 213–222. [Google Scholar] [CrossRef]
- Streit, E.; Schatzmayr, G.; Tassis, P.; Tzika, E.; Marin, D.; Taranu, I.; Tabuc, C.; Nicolau, A.; Aprodu, I.; Puel, O.; et al. Current situation of mycotoxin contamination and co-occurrence in animal feed—Focus on Europe. Toxins 2012, 4, 788–809. [Google Scholar] [CrossRef] [PubMed]
- Koletsi, V.; Schrama, J.W.; Graat, E.A.M.; Wiegertjes, G.F.; Lyons, P.; Pietsch, C. The occurrence of mycotoxins in raw materials and fish feeds in Europe and the potential effects of deoxynivalenol (DON) on the health and growth of farmed fish species—A Review. Toxins 2021, 13, 403. [Google Scholar] [CrossRef] [PubMed]
- Pestka, J.J. Deoxynivalenol: Mechanisms of action, human exposure, and toxicological relevance. Arch. Toxicol. 2010, 84, 663–679. [Google Scholar] [CrossRef] [PubMed]
- Pinton, P.; Oswald, I. Effect of deoxynivalenol and other type B trichothecenes on the intestine: A review. Toxins 2014, 6, 1615–1643. [Google Scholar] [CrossRef] [PubMed]
- Payros, D.; Alassane-Kpembi, I.; Pierron, A.; Loiseau, N.; Pinton, P.; Oswald, I.P. Toxicology of deoxynivalenol and its acetylated and modified forms. Arch. Toxicol. 2016, 90, 2931–2957. [Google Scholar] [CrossRef]
- Pierron, A.; Mimoun, S.; Murate, L.S.; Loiseau, N.; Lippi, Y.; Bracarense, A.-P.F.L.; Schatzmayr, G.; He, J.W.; Zhou, T.; Moll, W.-D. Microbial biotransformation of DON: Molecular basis for reduced toxicity. Sci. Rep. 2016, 6, 29105. [Google Scholar] [CrossRef]
- Yuan, L.; Mu, P.; Huang, B.; Li, H.; Mu, H.; Deng, Y. EGR1 is essential for deoxynivalenol-induced G2/M cell cycle arrest in HepG2 cells via the ATF3 Delta Zip2a/2b-EGR1-p21 pathway. Toxicol. Res. 2018, 299, 95–103. [Google Scholar] [CrossRef]
- Ren, Z.; Guo, C.; He, H.; Zuo, Z.; Hu, Y.; Yu, S.; Zhong, Z.; Liu, H.; Zhu, L.; Xu, S.; et al. Effects of deoxynivalenol on mitochondrial dynamics and autophagy in pig spleen lymphocytes. Food Chem. Toxicol. 2020, 140, 111357. [Google Scholar] [CrossRef]
- Huang, X.H.; Zhang, X.H.; Li, Y.H.; Wang, J.L.; Wang, F.R. Carcinogenic effects of sterigmatocystin and deoxynivalenol in NIH mice. Chin. J. Oncol. 2004, 26, 705–708. [Google Scholar]
- Peyman, A.; Saskia, B.; Hendrik, G.; Koelink, P.J.; Verheijden, K.; Johan, G.; Johanna, F.G. Deoxynivalenol: A trigger for intestinal integrity breakdown. Faseb J. Off. Publ. Fed. Am. Soc. Exp. Biol. 2014, 28, 2414. [Google Scholar] [CrossRef]
- Luo, S.; Terciolo, C.; Bracarense, A.; Payros, D.; Pinton, P.; Oswal, I. In vitro and in vivo effects of a mycotoxin, deoxynivalenol, and a trace metal, cadmium, alone or in a mixture on the intestinal barrier. Environ. Int. 2019, 132, 105082. [Google Scholar] [CrossRef]
- Alexandra, S.; Sabine, H.; Gerd, S.; Elisabeth, M. Early activation of MAPK p44/42 is partially involved in DON-Induced disruption of the intestinal barrier function and tight junction network. Toxins 2016, 8, 264. [Google Scholar] [CrossRef]
- Wang, X.C.; Zhang, Y.F.; Cao, L.; Zhu, L.; Wu, J.J. Deoxynivalenol induces intestinal damage and inflammatory response through the nuclear factor-κB signaling pathway in piglets. Toxins 2019, 11, 663. [Google Scholar] [CrossRef]
- Walle, J.V.D.; Sergent, T.; Piront, N.; Toussaint, O.; Schneider, Y.J.; Larondelle, Y. Deoxynivalenol affects in vitro intestinal epithelial cell barrier integrity through inhibition of protein synthesis. Toxicol. Appl. Pharmacol. 2010, 245, 291–298. [Google Scholar] [CrossRef]
- Mao, X.; Li, J.; Xie, X.; Chen, S.; Huang, Q.; Mu, P.Q.; Jiang, J.; Deng, Y.Q. Deoxynivalenol induces caspase-3/GSDME-dependent pyroptosis and inflammation in mouse liver and HepaRG cells. Arch. Toxicol. 2022, 96, 3091–3112. [Google Scholar] [CrossRef]
- Kim, D.; Langmead, B.; Salzberg, S.L. HISAT: A fast spliced aligner with low memory requirements. Nat. Methods 2015, 12, 357–360. [Google Scholar] [CrossRef]
- Langmead, B.; Salzberg, S.L. Fast gapped-read alignment with Bowtie 2. Nat. Methods 2012, 9, 357–359. [Google Scholar] [CrossRef]
- Li, B.; Dewey, C.N. RSEM: Accurate transcript quantification from RNA-Seq data with or without a reference genome. BMC Bioinform. 2011, 12, 323. [Google Scholar] [CrossRef]
- Love, M.I.; Huber, W.; Anders, S. Moderated estimation of fold change and dispersion for RNA-seq data with DESeq2. Genome Biol. 2014, 15, 550. [Google Scholar] [CrossRef] [PubMed]
- Huang, D.W.; Sherman, B.T.; Lempicki, R.A. Systematic and integrative analysis of large gene lists using DAVID bioinformatics resources. Nat. Protoc. 2009, 4, 44–57. [Google Scholar] [CrossRef] [PubMed]
- Zhou, Y.; Zhou, B.; Pache, L.; Chang, M.; Khodabakhshi, A.H.; Tanaseichuk, O.; Benner, C.; Chanda, S.K. Meta scape provides a biologist-oriented resource for the analysis of systems-level datasets. Nat. Commun. 2019, 10, 1523. [Google Scholar] [CrossRef] [PubMed]
- Kanehisa, M.; Goto, S. KEGG: Kyoto encyclopedia of genes and genomes. Nucleic Acids Res. 2000, 28, 27–30. [Google Scholar] [CrossRef]
- Wickham, H. ggplot2. Wiley Interdiscip. Rev. Comput. Stat. 2011, 3, 180–185. [Google Scholar] [CrossRef]


Disclaimer/Publisher’s Note: The statements, opinions and data contained in all publications are solely those of the individual author(s) and contributor(s) and not of MDPI and/or the editor(s). MDPI and/or the editor(s) disclaim responsibility for any injury to people or property resulting from any ideas, methods, instructions or products referred to in the content. |
© 2023 by the authors. Licensee MDPI, Basel, Switzerland. This article is an open access article distributed under the terms and conditions of the Creative Commons Attribution (CC BY) license (https://creativecommons.org/licenses/by/4.0/).
Share and Cite
Yao, F.; Zhao, M.; Du, Y.; Chang, G.; Li, C.; Zhu, R.; Cai, C.; Shao, S. Transcriptome Analysis of Deoxynivalenol (DON)-Induced Hepatic and Intestinal Toxicity in Zebrafish: Insights into Gene Expression and Potential Detoxification Pathways. Toxins 2023, 15, 594. https://doi.org/10.3390/toxins15100594
Yao F, Zhao M, Du Y, Chang G, Li C, Zhu R, Cai C, Shao S. Transcriptome Analysis of Deoxynivalenol (DON)-Induced Hepatic and Intestinal Toxicity in Zebrafish: Insights into Gene Expression and Potential Detoxification Pathways. Toxins. 2023; 15(10):594. https://doi.org/10.3390/toxins15100594
Chicago/Turabian StyleYao, Feng, Miaomiao Zhao, Yaowen Du, Guoli Chang, Chuanpeng Li, Ruiyu Zhu, Chenggang Cai, and Suqing Shao. 2023. "Transcriptome Analysis of Deoxynivalenol (DON)-Induced Hepatic and Intestinal Toxicity in Zebrafish: Insights into Gene Expression and Potential Detoxification Pathways" Toxins 15, no. 10: 594. https://doi.org/10.3390/toxins15100594
APA StyleYao, F., Zhao, M., Du, Y., Chang, G., Li, C., Zhu, R., Cai, C., & Shao, S. (2023). Transcriptome Analysis of Deoxynivalenol (DON)-Induced Hepatic and Intestinal Toxicity in Zebrafish: Insights into Gene Expression and Potential Detoxification Pathways. Toxins, 15(10), 594. https://doi.org/10.3390/toxins15100594