1. Introduction
Fusarium head blight (FHB), a devastating plant disease that infects wheat, barley, oats, and other small grain cereals, causes billions of dollars of crop yield and quality losses worldwide [
1,
2,
3]. Up to 17 fungal species have been shown to cause FHB, among which most species belong to the genus
Fusarium, and a couple of species belong to genus
Microdochium [
4,
5]. Often,
Fusarium species form a disease complex where different
Fusarium species co-occur in the infected cereals [
6]. Some
Fusarium species produce mycotoxins that cause a risk for the end-use of the cereal crops in the food and feed industry. One especially important plant pathogen is
Fusarium graminearum, which produces the mycotoxins trichothecenes deoxynivalenol (DON) and nivalenol (NIV) and the mycoestrogen zearalenone (ZEN) [
7]. The identification of species that inflict FHB is important, since they differ in fungicide sensitivity, host resistance, pathogenicity, and toxin production [
8]. In Finnish cereals, the most common
Fusarium species detected in 2005–2014 were
F. avenaceum,
F. culmorum,
F. graminearum,
F. poae,
F. sporotrichioides, and
F. langsethiae [
9]. The prevalence of
F. culmorum and
F. graminearum was high in oats and barley, but when compared to previous studies, a shift from
F. culmorum to
F. graminearum was detected, which has led to increased DON content. A rapid increase in the prevalence of
F. graminearum has also been detected in other European countries [
10,
11,
12]. Effective FHB management strategies are needed and the development of these management methods requires information about the composition and abundance of the whole
Fusarium community, because different populations could be affected selectively [
13]. To evaluate the impact of fungal control means in disease control, quantitative data of the
Fusarium community and different species are needed.
A variety of different methods are currently applied in the detection and identification of
Fusarium species in cereals—for a recent review, see Karelov et al. [
14]. Traditional plating methods on a selective nutrient medium applied in the detection of
Fusarium fungi are laborious and some species can outgrow others, preventing the detection of the whole
Fusarium community. In the past few years, the focus in
Fusarium detection has been on molecular DNA-based methods. The most prevalent DNA-based methods for
Fusarium quantification and identification are single and multiplex qPCR methods that detect different
Fusarium-specific DNA regions. Bluhm et al. [
15] developed a TaqMan real-time PCR assay for group-specific detection of trichothecene- and fumonisin-producing
Fusarium spp. by targeting the genes involved in mycotoxin biosynthesis, and Sarlin et al. [
16] evaluated the application of the method of
Fusarium trichothecene gene-region measurement to detect toxigenic fungi in barley and malt. In addition, Kulik et al. [
17] developed a TaqMan-based qPCR assay targeting the enniatin synthetase gene to quantify
Fusarium avenaceum,
Fusarium tricinctum, and
Fusarium poae abundance in wheat grains, and a positive and significant correlation was observed between the
Fusarium amount and the total concentration of enniatins. Waalwijk et al. [
8] reported the development and application of a TaqMan qPCR method to quantify individual
Fusarium species and closely related
Microdochium nivale in infected cereals. Recently, Morcia et al. [
5] applied a new chip digital PCR method for quantification of
F. graminearum,
F. culmorum,
F. sporotrichioides,
F. poae, and
F. avenaceum. Then, Sonia et al. [
17] developed individual qPCR methods for seven
Fusarium and two
Microdochium species. The co-occurrence of several
Fusarium species in cereals makes monitoring more challenging, and the detection of only a few
Fusarium species is not sufficient. Genus-specific conventional PCR methods are available for the detection of the presence of
Fusarium fungi in cereals [
14], but a genus-specific quantitative PCR method for quantification of all the
Fusarium species is still lacking.
New metabarcoding methods using the
Fusarium elongation factor region (
EF1α gene) have been applied in assessing the diversity of the
Fusarium community in cereals [
18,
19]. These new metabarcoding methods enable the detection of the
Fusarium community to the species level and monitoring the distribution and community shifts in cereals in changing environmental conditions. In addition, new emerging species can be detected with these methods.
In this study, a new TaqMan-based qPCR method (FusE) targeting the Fusarium-specific elongation factor region (EF1α) was developed for the detection and quantification of whole Fusarium spp. simultaneously. As a proof of principle, new FusE qPCR analyses were performed on field samples to assess the Fusarium contamination in Finnish oat crop survey samples collected in 2015–2017. The years 2016 and 2017 were especially challenging regarding the Fusarium contamination, and 25% of the national yearly crop survey oat samples collected by the Finnish Cereal Committee had mycotoxin deoxynivalenol (DON) content over 1750 µg/kg. To evaluate the connection between Fusarium abundance and DON content, the correlation between the FusE qPCR, Fusarium plating method, and deoxynivalenol (DON) results was evaluated. In addition, the whole Fusarium community in oat samples was characterized with a novel Fusarium metabarcoding method.
3. Discussion
An efficient and rapid method for
Fusarium quantification is needed for assessing the FHB and mycotoxin risk in cereals. Quantitative PCR assays with TaqMan-based primers for specific individual
Fusarium species and some toxin-producing
Fusarium species have been developed [
8,
15,
17]. However, an efficient method for quantifying the whole
Fusarium group with one qPCR method has been lacking so far. The co-occurrence of several
Fusarium species in the FHB complex in cereals makes monitoring challenging. If only a few
Fusarium species are targeted with qPCR, the
Fusarium contamination can remain underestimated or even undetected.
This study developed a new TaqMan qPCR assay targeting the
Fusarium elongation factor region (
EF1α) to quantify the abundance of
Fusarium spp. in cereal samples. To validate the method with representative material, DNA from 157 oat samples and 40 barley samples were extracted. The DNA extraction method applied for the oat samples was successfully used for cereal samples including barley in a previous study by Sarlin et al. [
16]. Samples were analyzed with the FusE qPCR assay,
F. graminearium, and
F. culmorum-specific qPCR assays, conventional
Fusarium plating method, and DON measurement. The correlation of the FusE method with DON content was analyzed from the whole sample set. The
Fusarium metabarcoding method was applied to a subset of 51 oat samples to which both high and low
Fusarium-contaminated samples were selected from each year. Although we applied the FusE qPCR assay for cereal samples in this study, the method can be used to quantify
Fusarium DNA in many different environmental samples (data not shown). The specificity of our assay was confirmed in silico, and subsequently against a diverse panel of fungal and bacterial species associated with cereals. Only
Fusarium species, as well as
Microdochium nivale and
Microdochium majus, were amplified with the FusE qPCR assay. The cross-reaction between
M. nivale strains was expected, since
M. nivale is a close relative to
Fusarium fungi and has previously been part of the
Fusarium genus [
21,
22]. Cross-reaction was not detected with DNA extracted from sterile oat cells, revealing that the primers were not amplifying any regions of oat DNA. Furthermore, PCR-inhibitory effects were not detected when spiking a DNA sample isolated from oat grains with a known amount of
Fusarium DNA.
The FusE qPCR method developed in this study proved as an effective tool to monitor
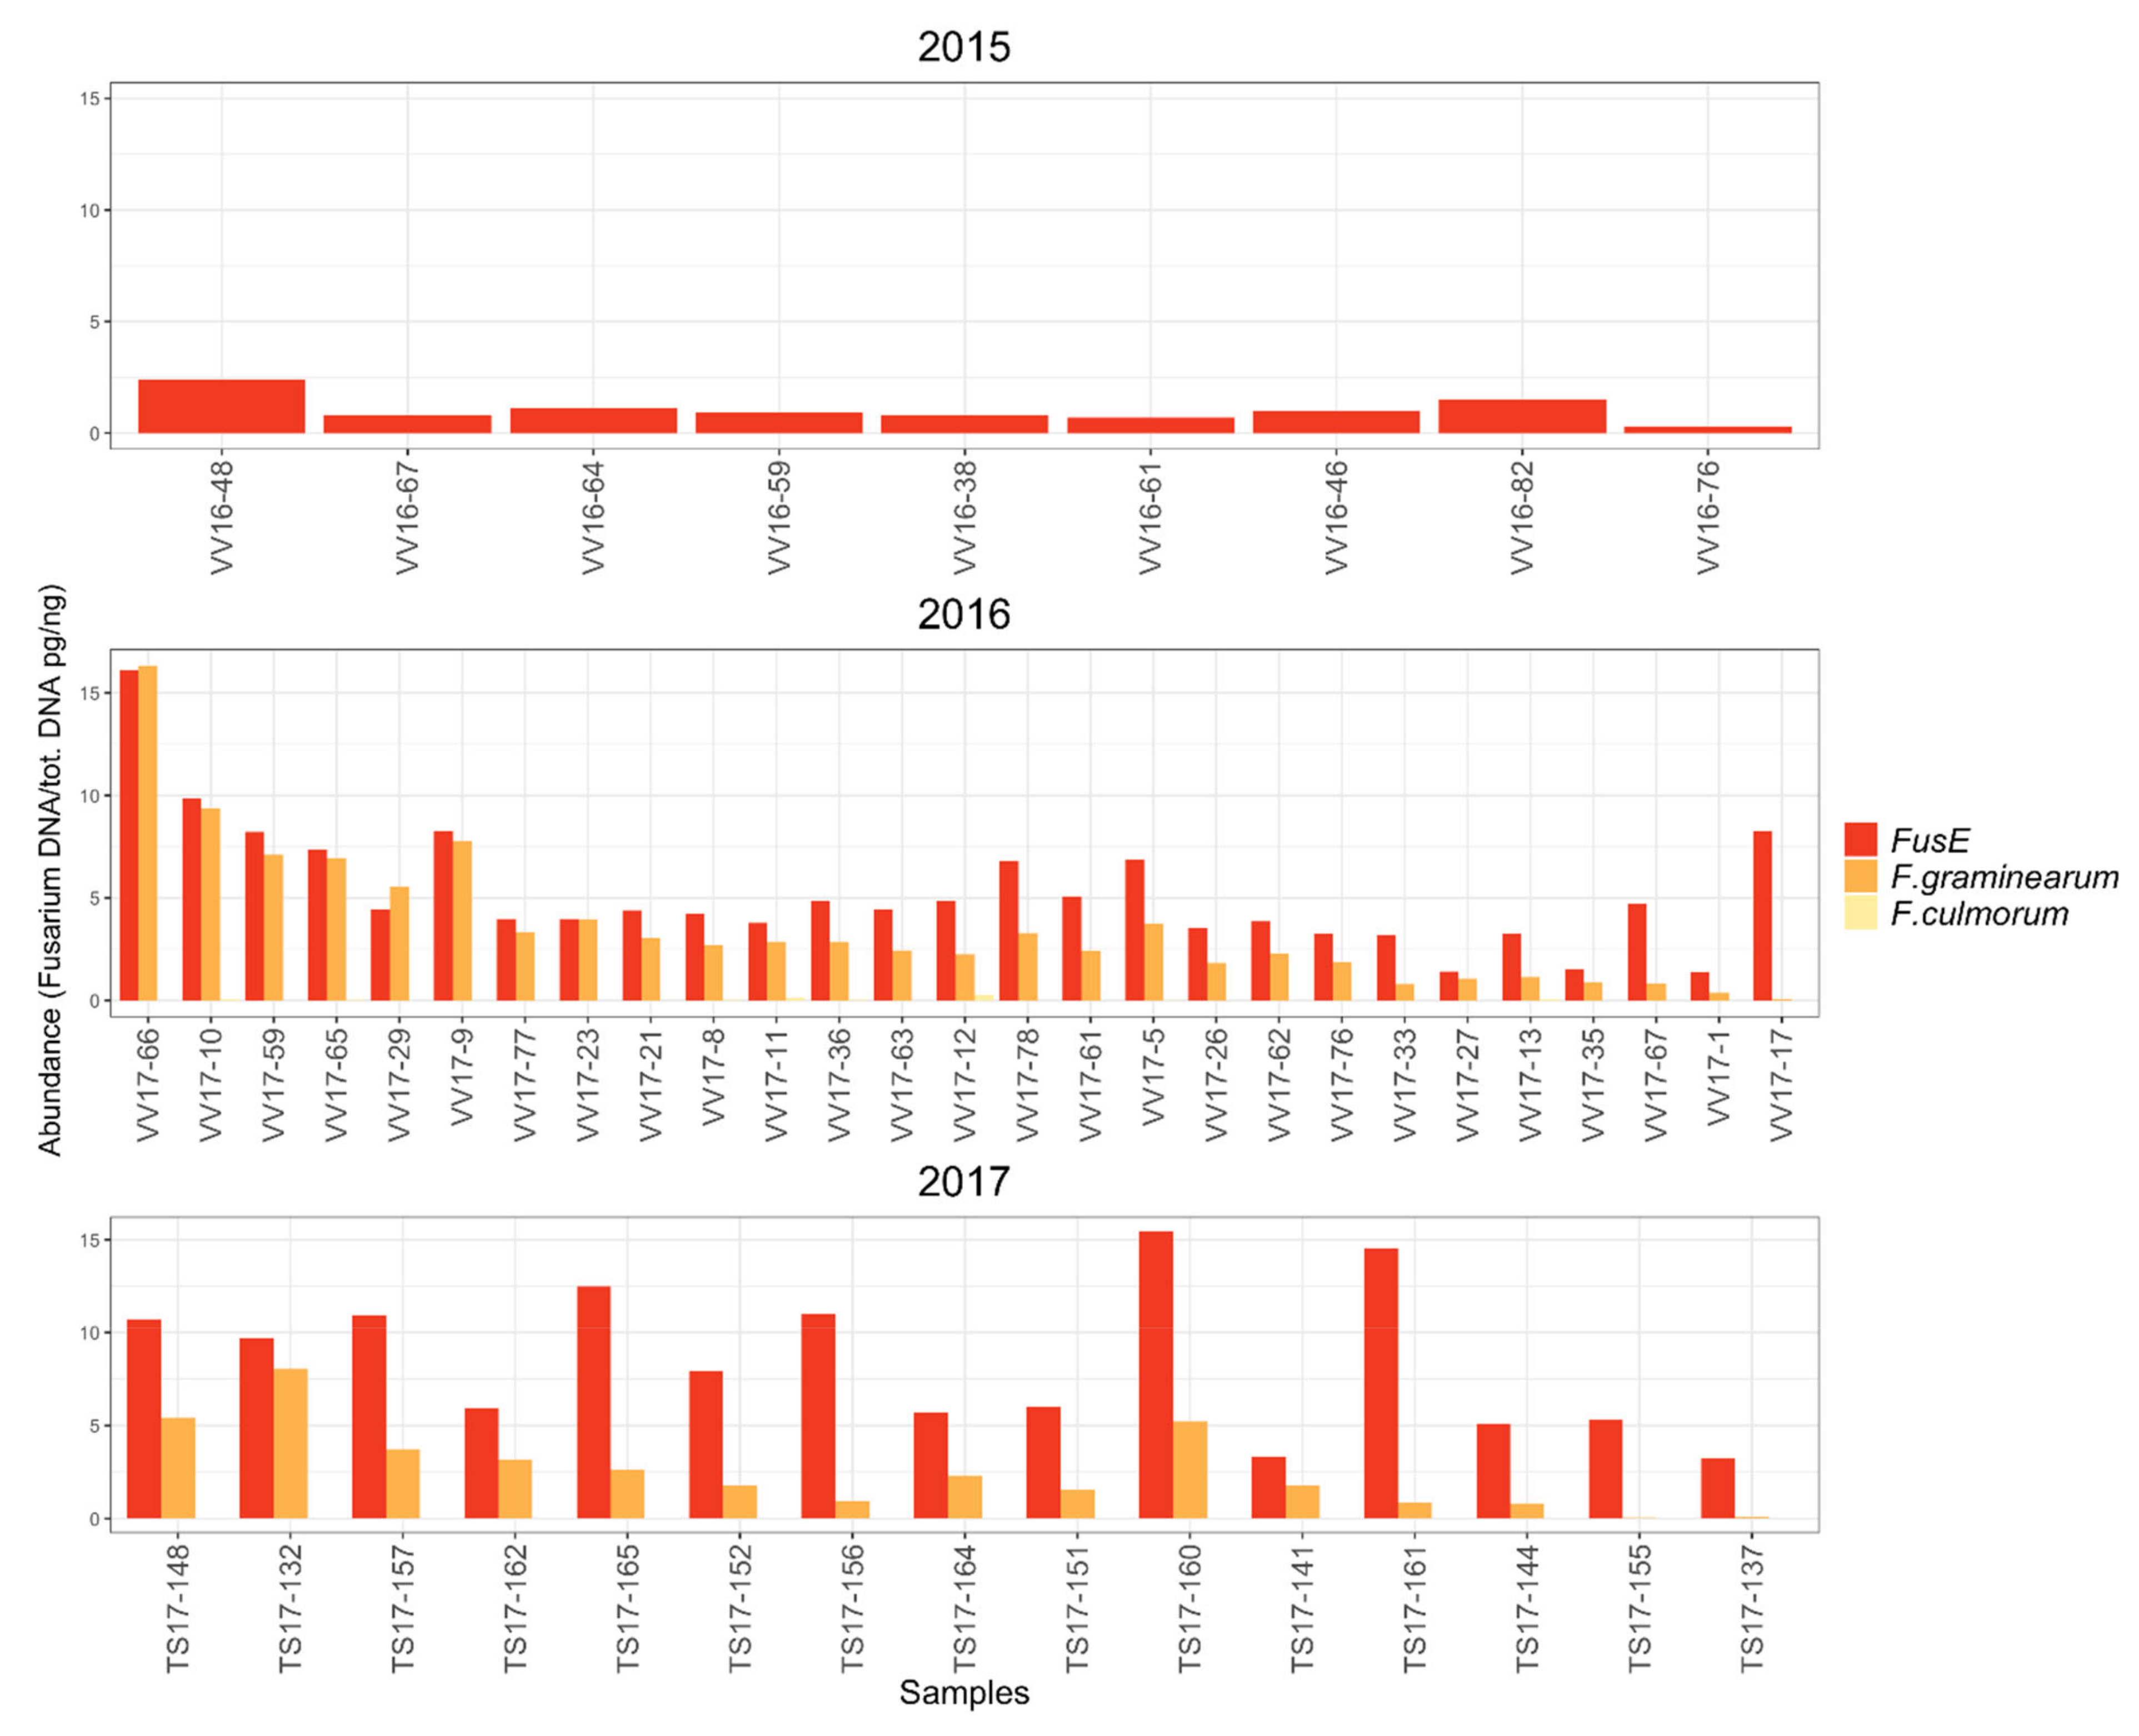
Fusarium contamination in cereals. The FusE qPCR assay revealed that the amount of
Fusarium DNA and thus the severity of
Fusarium infection was notably higher in cereal samples collected in the years 2016 and 2017 compared to the samples collected in 2015. The amounts of
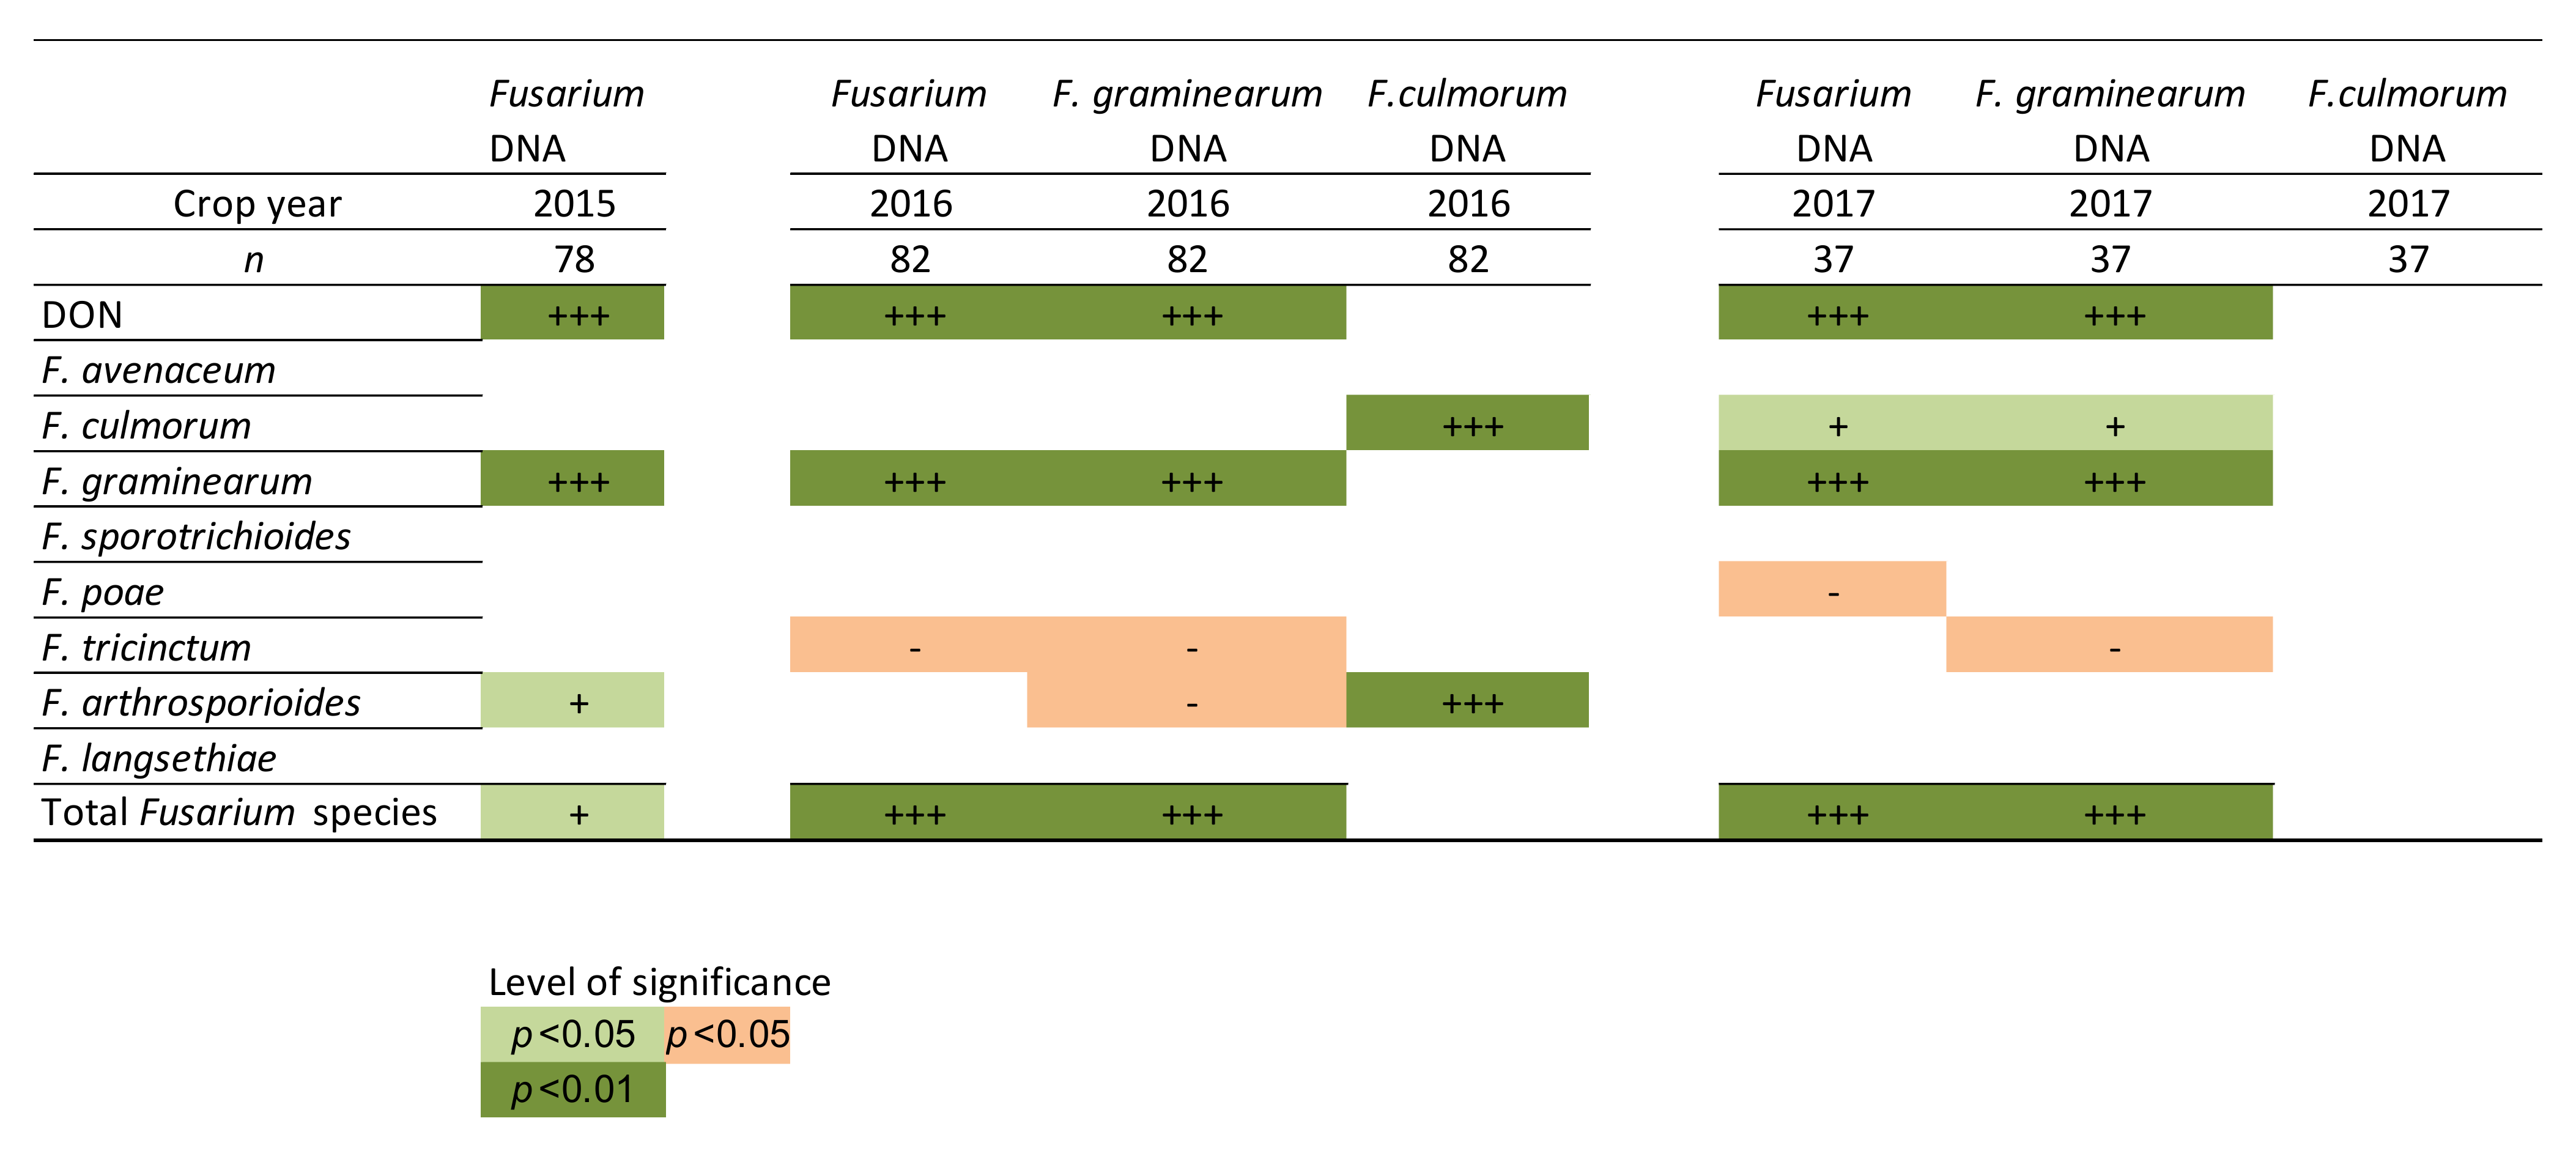
Fusarium spp. DNA and
F. graminearum DNA analyzed with the FusE and
F. graminearum species-specific qPCR assays, respectively, correlated significantly with deoxynivalenol (DON) toxin content in each sampling year.
F. culmorum DNA levels were very low in all years and no correlation was found between
F. culmorum qPCR results and DON content. FusE qPCR method can be used to quantify the total
Fusarium biomass to screen the mycotoxin risk in cereal samples. If
Fusarium DNA is detected, then the presence and abundance of specific toxin-producing
Fusarium species can be measured using species-specific
Fusarium primers, such as
F. graminearum or
F. culmorum primers, to evaluate the mycotoxin risk more precisely [
8,
23]. In our study, the high correlation between the amounts of
Fusarium DNA and DON content was detected, but in a study by Sarlin et al. [
16], barley grain samples contained relatively high amounts of trichothecene-producing
Fusarium DNA, although no DON was detected. Some of the results presented by Sarlin et al. [
16] were explained with the production of other trichothecenes than DON and low levels of
F. graminearum, but also environmental factors such as temperature, humidity, and other microbes, and the host plant can influence the mycotoxin production of
Fusarium species in cereals [
24,
25]. The effects of environmental factors can impact the estimation of mycotoxin risk based only on the
Fusarium DNA levels. Another application for the FusE method is the assessment of the gushing risk in malting barley such as that studied by Virkajärvi et al. [
26], where a higher
Fusarium DNA level was associated with a higher gushing risk.
The economic losses caused by FHB to cereal producers are significant, and thus effective management strategies for FHB are needed. Important tools to monitor the FHB are
Fusarium-specific detection and quantification methods. With these methods, the effectiveness of the management methods can be evaluated and mycotoxin risk in cereals can be assessed. In addition to the level of
Fusarium contamination in cereals, the development of these management methods requires information about the composition of the whole
Fusarium community because different populations could be affected selectively [
13]. In this study, we evaluated the suitability of the new
Fusarium metabarcoding method by Cobo-Díaz et al. [
19] for
Fusarium community profiling in cereal samples. With this new metabarcoding method, the whole
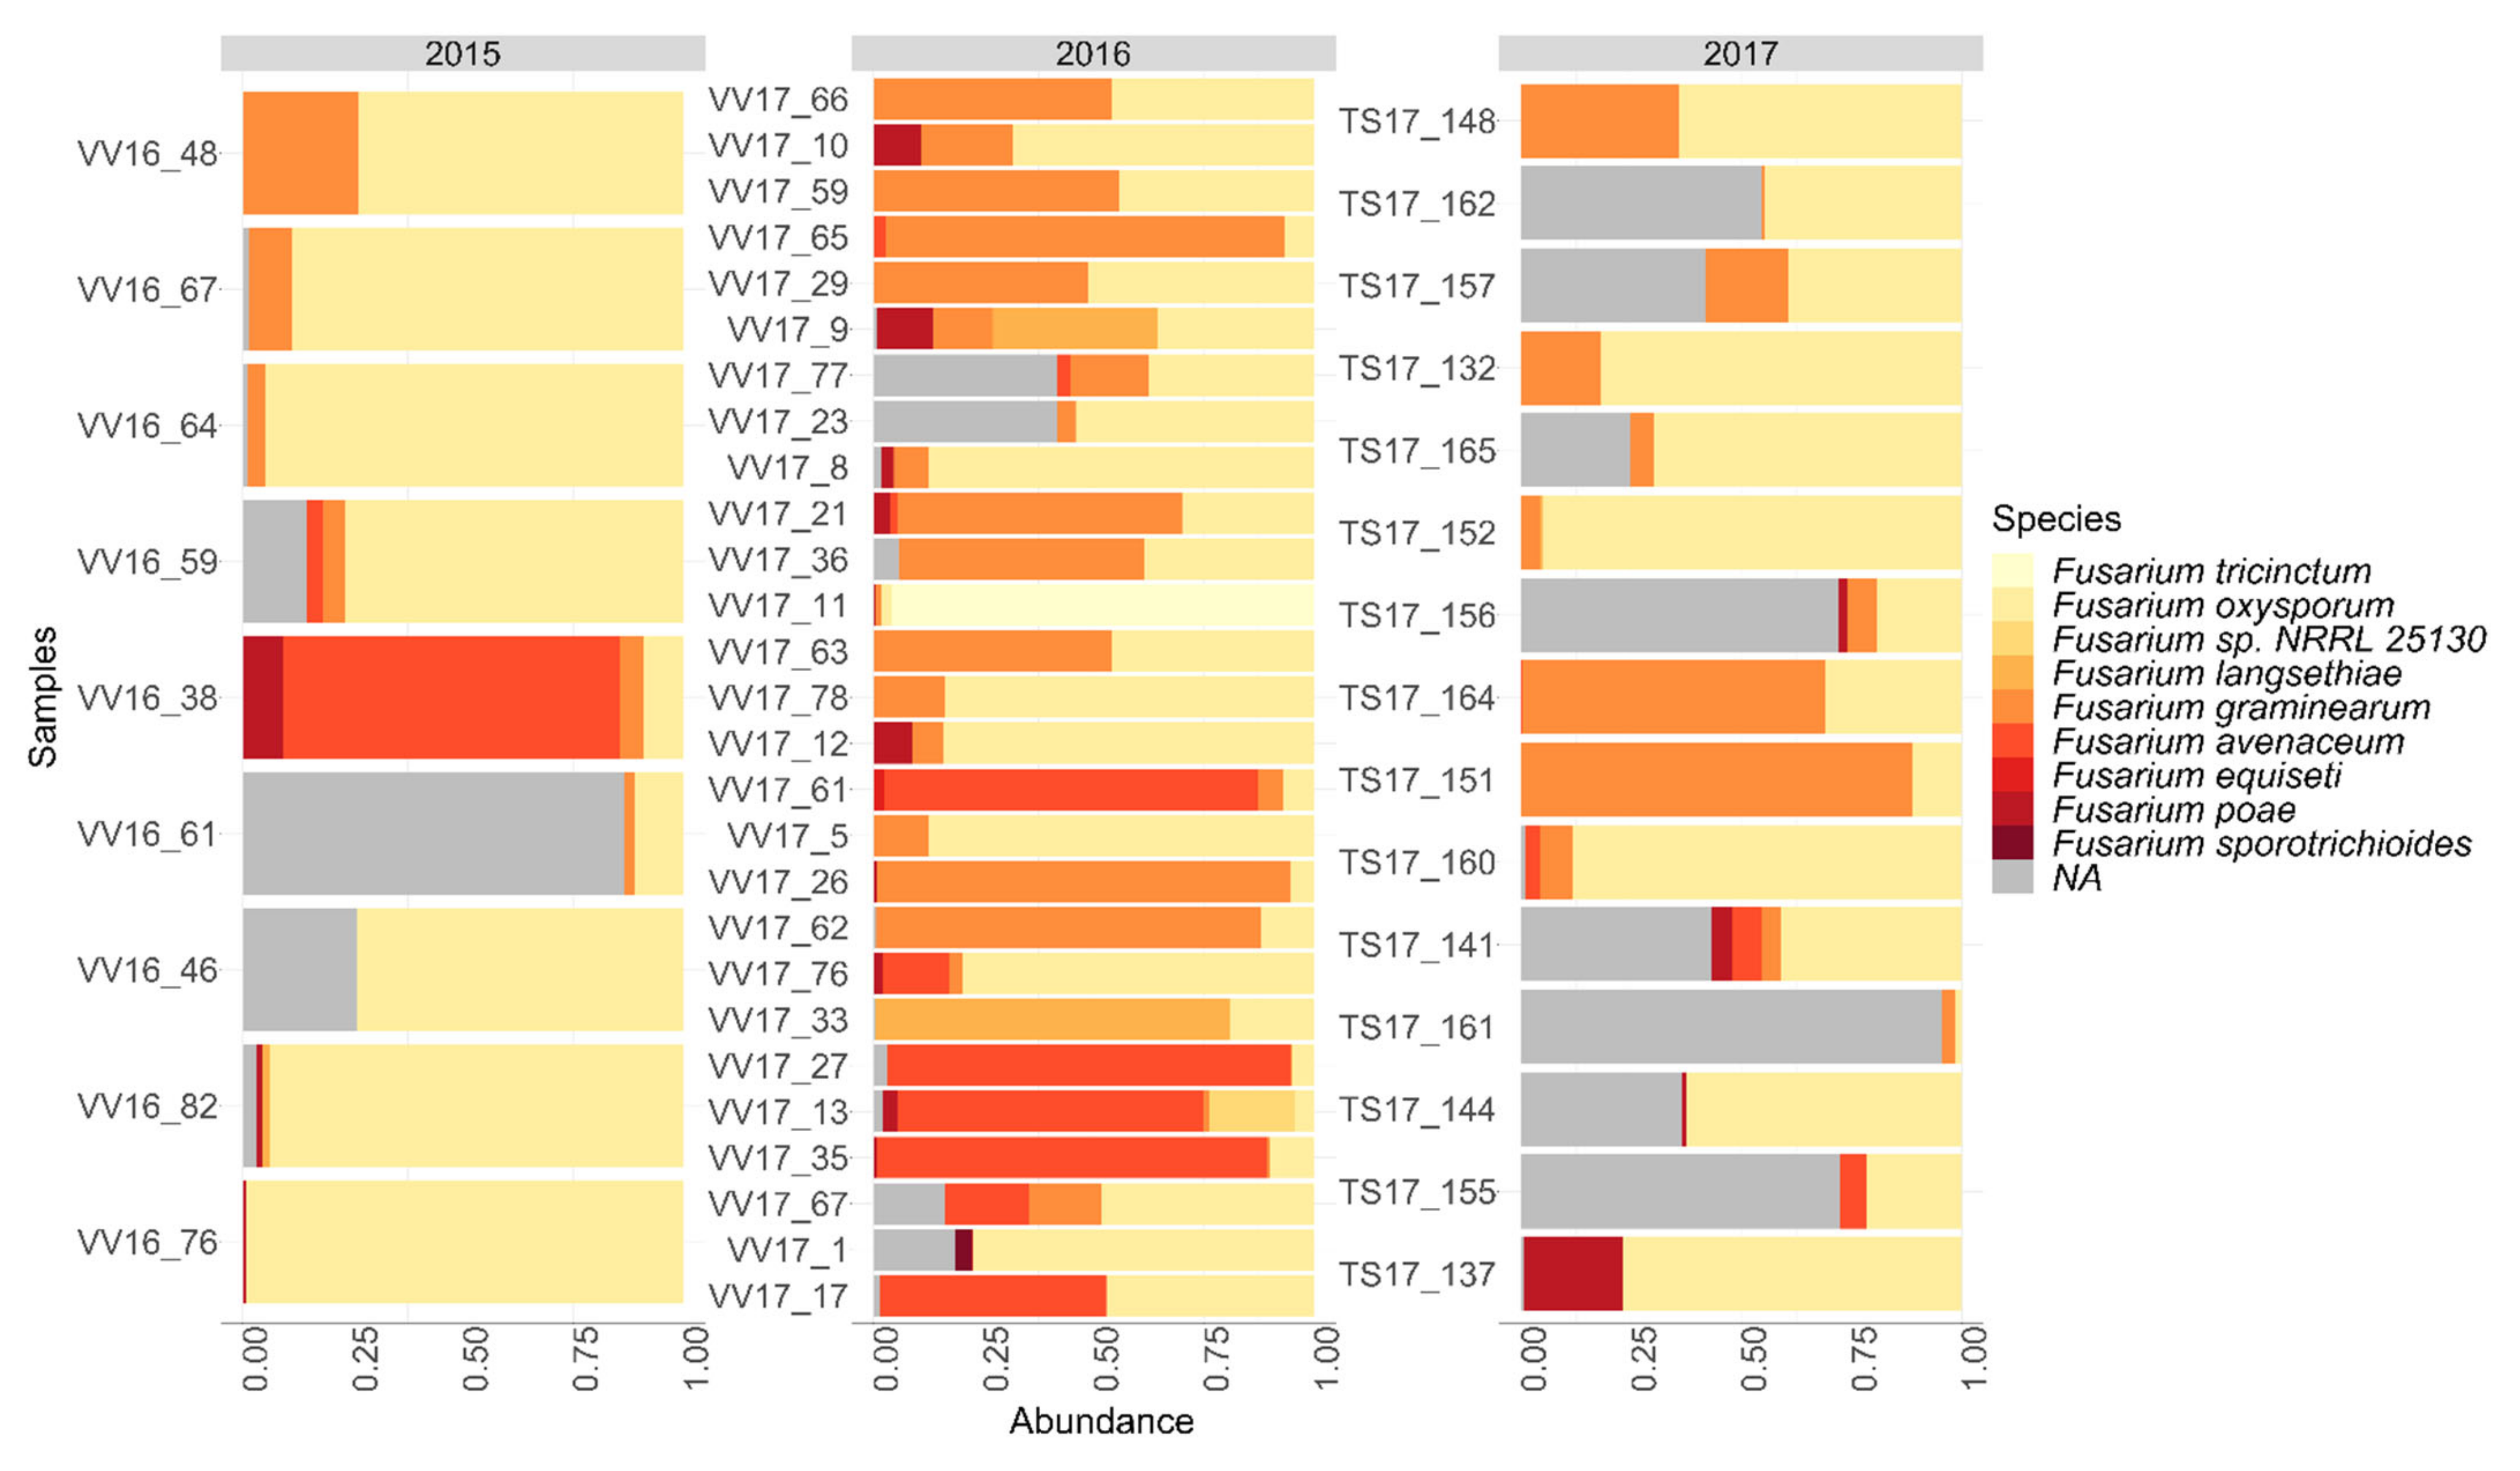
Fusarium community in Finnish oat samples was characterized. Similar
Fusarium species were detected with both the
Fusarium plating method and metabarcoding methods.
F. graminearum was detected especially in the oat samples collected in 2016 and 2017 according to both the plating method and metabarcoding methods. Only low amounts of
F. culmorum were detected in the oat samples with plating and metabarcoding methods.
F. oxysprorum was detected as the dominant
Fusarium species in Finnish oat samples with metabarcoding.
F. oxysporum was also the most abundant species in soil samples collected from maize fields in the study of Cobo et al. where the
Fusarium metabarcoding method was established [
19].
F. oxysporum was not detected in oat samples with the
Fusarium plating method, and
F. arthrosporioides and
F. sambucinum were detected from oat samples by the plating method but not by the metabarcoding method. The plating method can favor some
Fusarium species over others, and species growing faster can overtake other slower growing species, which can explain the differences in the results by the plating method and metabarcoding method. In addition, some sequences could not be identified to the species level with the metabarcoding method. This could be due to the lack of
Fusarium elongator factor sequences in the sequence databases, or the fact that these species cannot be distinguished from each other because of sequence similarity in the elongation factor region between those taxa [
19].
A shift from
F. culmorum to
F. graminearum in FHB infected cereal grains has been detected in Europe [
10,
11,
12]. The results of this study confirm that
F. graminearum was detected as the main mycotoxin-producing
Fusarium species in Finnish oat samples. The reason for this shift is still partly unknown, but Parikka et al. [
27] indicated that the shift is due to climate changes and farming practices. Climate is known to affect the
Fusarium incidence and
Fusarium community structure [
28].
New
Fusarium metabarcoding methods enable the detection of the
Fusarium community to the species level and monitoring the distribution and community shifts in cereal production. In addition, new emerging species can be detected with these methods. Compared to the laborious and time-consuming plating method that needs high levels of expertise in
Fusarium species identification, the new
Fusarium metabarcoding method provides the
Fusarium species information from cereal samples faster and more reliably. The
Fusarium metabarcoding method by Cobo-Díaz et al. [
19] detected
Fusarium species as well as
Microdochium nivale.
M. nivale is a close relative to
Fusarium species and has been previously part of the
Fusarium genus, which explains the similarities in the targeted elongation factor region and amplification of
M. nivale with primers Fa-150 and Ra2 designed by Cobo-Díaz et al. [
19]. The
Fusarium plating method is only a semi-quantitative method because the method only shows the percentage of the contaminated grains. With the
Fusarium metabarcoding method, the relative abundance of the
Fusarium species is obtained. Relative abundances that are currently used in metabarcoding studies can be compared within the same dataset, but this can lead to misinterpretations of microbial community structures. Because the sequencing data are compositional, the increase in one taxon leads to the concurrent decrease in the others [
29]. Quantitative PCR provides the absolute quantification of the
Fusarium DNA but does not give the species identification, and developing a species-specific qPCR method for all
Fusarium species is not reasonable. Quantitative PCR combined with metabarcoding could be used in the absolute quantification of microbial abundances [
29]. FusE qPCR assay combined with
Fusarium metabarcoding method could be used in the absolute quantification of the whole
Fusarium species complex in cereal samples.
Fusarium community structure in cereals can be studied in more detail using the novel
Fusarium metabarcoding method. The significance of the whole cereal microbiome for the development of
Fusarium-related diseases has been recognized lately. Both interactions within the
Fusarium microbiome and interaction with the plant microbiome in the cereals play an important role in the FHB outbreaks and accumulation of mycotoxins [
30]. Knowledge gained from these interactions can be used in developing new management methods for FHB. Future studies are especially needed to identify the characteristics of cereal microbiomes linked to
Fusarium suppression.
4. Materials and Methods
4.1. Materials
The fungal and bacteria pure cultures used in this study were obtained from the culture collection of VTT Technical Research Centre of Finland Ltd. (VTT Culture Collection, Espoo, Finland) (
Table 1). From the
Fusarium genus, 14 different
Fusarium species were used in the evaluation of the specificity of the developed FusE qPCR method. In addition, 12 other fungal strains commonly associated with cereals, one yeast strain, and two bacterial strains were tested. Fungal strains were cultured on potato dextrose agar (CM0139, Oxoid Ltd., Hampshire, UK), yeast strain on yeast mold agar (yeast: B271210, Becton, Dickinson and Company, Franklin Lakes, NJ, USA), and bacterial strains on MRS agar (de Man, Rogosa and Sharpe, CM0361, Oxoid Ltd., Hampshire, UK). Strains were incubated for 2–4 days at 25 °C before the DNA was isolated.
4.2. Field Samples
Cereal samples were selected among the yearly crop survey samples collected around Finland by the Finnish Cereal Committee during the years 2015–2017. The total amount of the samples consisted of 157 oat samples and 40 barley samples. DON content detected in the cereal samples ranged from <25 to 26,000 µg/kg.
In this paper, a subset of 51 oat samples was selected from the whole field sample set to compare the results of the new Fusarium-specific FusE qPCR method, the conventional Fusarium plating method, F. graminearum- and F. culmorum-specific qPCR methods and DON measurement. Both samples with high and low Fusarium contamination were selected in the subset. In addition, the new Fusarium-specific metabarcoding method was applied for the same subset of 51 oat samples. The correlation analysis was performed for the whole field sample set.
4.3. DNA Isolation
DNA from pure microbial isolates and ground cereal samples was extracted with FastDNA® SPIN Kit for Soil (MP Biomedicals, Irvine, CA, USA). Cereal samples (10–20 g) were ground into fine flour with a grain mill (Bauknecht, Stuttgart, Germany). The DNA extraction was carried out from 100 mg of microbial biomass of the pure cultures or grain flours according to the manufacturer’s instructions but using a lysing step modified by VTT. The lysis was performed for 2 × 1 min at 6.0 s−1 using the FastPrep® Cell Disrupter (MP Biomedicals, Irvine, CA, USA) and Lysing Matrix A tubes (MP Biomedicals, Irvine, CA, USA). The tubes were placed on ice in between the two lysis runs. Centrifugation steps in the DNA extraction were carried out in Eppendorf Centrifuge 5424 (Eppendorf, Hamburg, Germany) and 13,000× g. DNA was extracted in triplicate from each cereal sample. Extracted DNA was stored in a freezer at −20 °C until being further analyzed.
4.4. Design of Primers and Hydrolysis Probe for Fusarium Genus
Primers FusEF and FusER and probe FusEP for the FusE TaqMan qPCR were designed in silico (
Table 2). The reference
Fusarium elongation factor
EF1α gene sequences were searched from the JGI database (Joint Genome Institute,
https://genome.jgi.doe.gov/portal/, accessed on 1 June 2017), Broad Institute (
https://www.broadinstitute.org/, accessed on 1 June 2017), and Ensemble Fungi (
https://fungi.ensembl.org/index.html, accessed on 1 June 2017). Specific regions to
Fusarium species were identified using BLASTn search (NCBI, Bethesda, MD, USA,
https://blast.ncbi.nlm.nih.gov/Blast.cgi, accessed on 1 June 2017) against the NCBI nucleotide collection (nr/nt) (NCBI, Bethesda MD, USA,
https://www.ncbi.nlm.nih.gov/, accessed on 1 June 2017). Next, ClustalO (The European Bioinformatics Institute (EMBL-EBI), Cambridgeshire, United Kingdom
https://www.ebi.ac.uk/Tools/msa/clustalo/, accessed on 1 June 2017) was used to align ten closest homologs. Several primer pairs binding to the
Fusarium EF1α gene were designed using Primer-BLAST (NCBI, Bethesda MD, USA,
https://www.ncbi.nlm.nih.gov/tools/primer-blast/, accessed on 1 June 2017) and the NCBI nr database and a primer pair that amplified only
Fusarium species were selected. The designed primers amplified a 96 bp region of the
EF1α gene, and the melting temperature of the primers was 59–68 °C. The primers and the probe used in this study were synthesized by Integrated DNA Technologies (IDT Inc., Coralville, IA, USA). A reporter dye FAM (6-carboxy-fluorescein) was used in labeling the 5′ end and quencher dye TAMRA (6-carboxy-tetramethyl rhodamine) the 3′ end of the probe FusEP.
4.5. TaqMan qPCR and Data Analysis
qPCR amplification was performed in the LightCycler
® 480 qPCR device (Roche Diagnostics Ltd., Risch-Rotkreuz, Switzerland) with software version Version 1.5.0.39. PCR amplification was carried out in 20 µL volume reactions using the Lightcycler 480 Probes Master Kit (Roche Molecular Systems Inc., Pleasanton, CA, USA), containing 2 × Probes Master, 5 pmol of each primer, 2 pmol of the hydrolysis probe, and 5 µL of the template. For microbial pure cultures concentration of 2 ng μL
−1 was used. The PCR program for the FusE qPCR consisted of an initial denaturation step for 10 min at 95 °C, followed by 39 cycles of denaturation for 10 s at 95 °C, annealing for 45 s at 57 °C, and extension for 1 s at 72 °C. In addition, negative controls with only PCR-grade water as a template were performed to rule out possible contamination. The
F. graminearum-specific qPCR runs were carried out according to Yli-Mattila et al. [
23], and
F. culmorum-specific qPCR runs were carried out according to Waalwijk et al. [
8].
The size of the amplified product was confirmed by loading the PCR products on 1.5% (w/v) agarose gel stained with Midori Green Nucleic Acid Stain (Nippon Genetics Europe, Düren, Germany) and using a DNA ladder (GeneRuler, Thermo Fisher Scientific, Waltham, Massachusetts, USA).
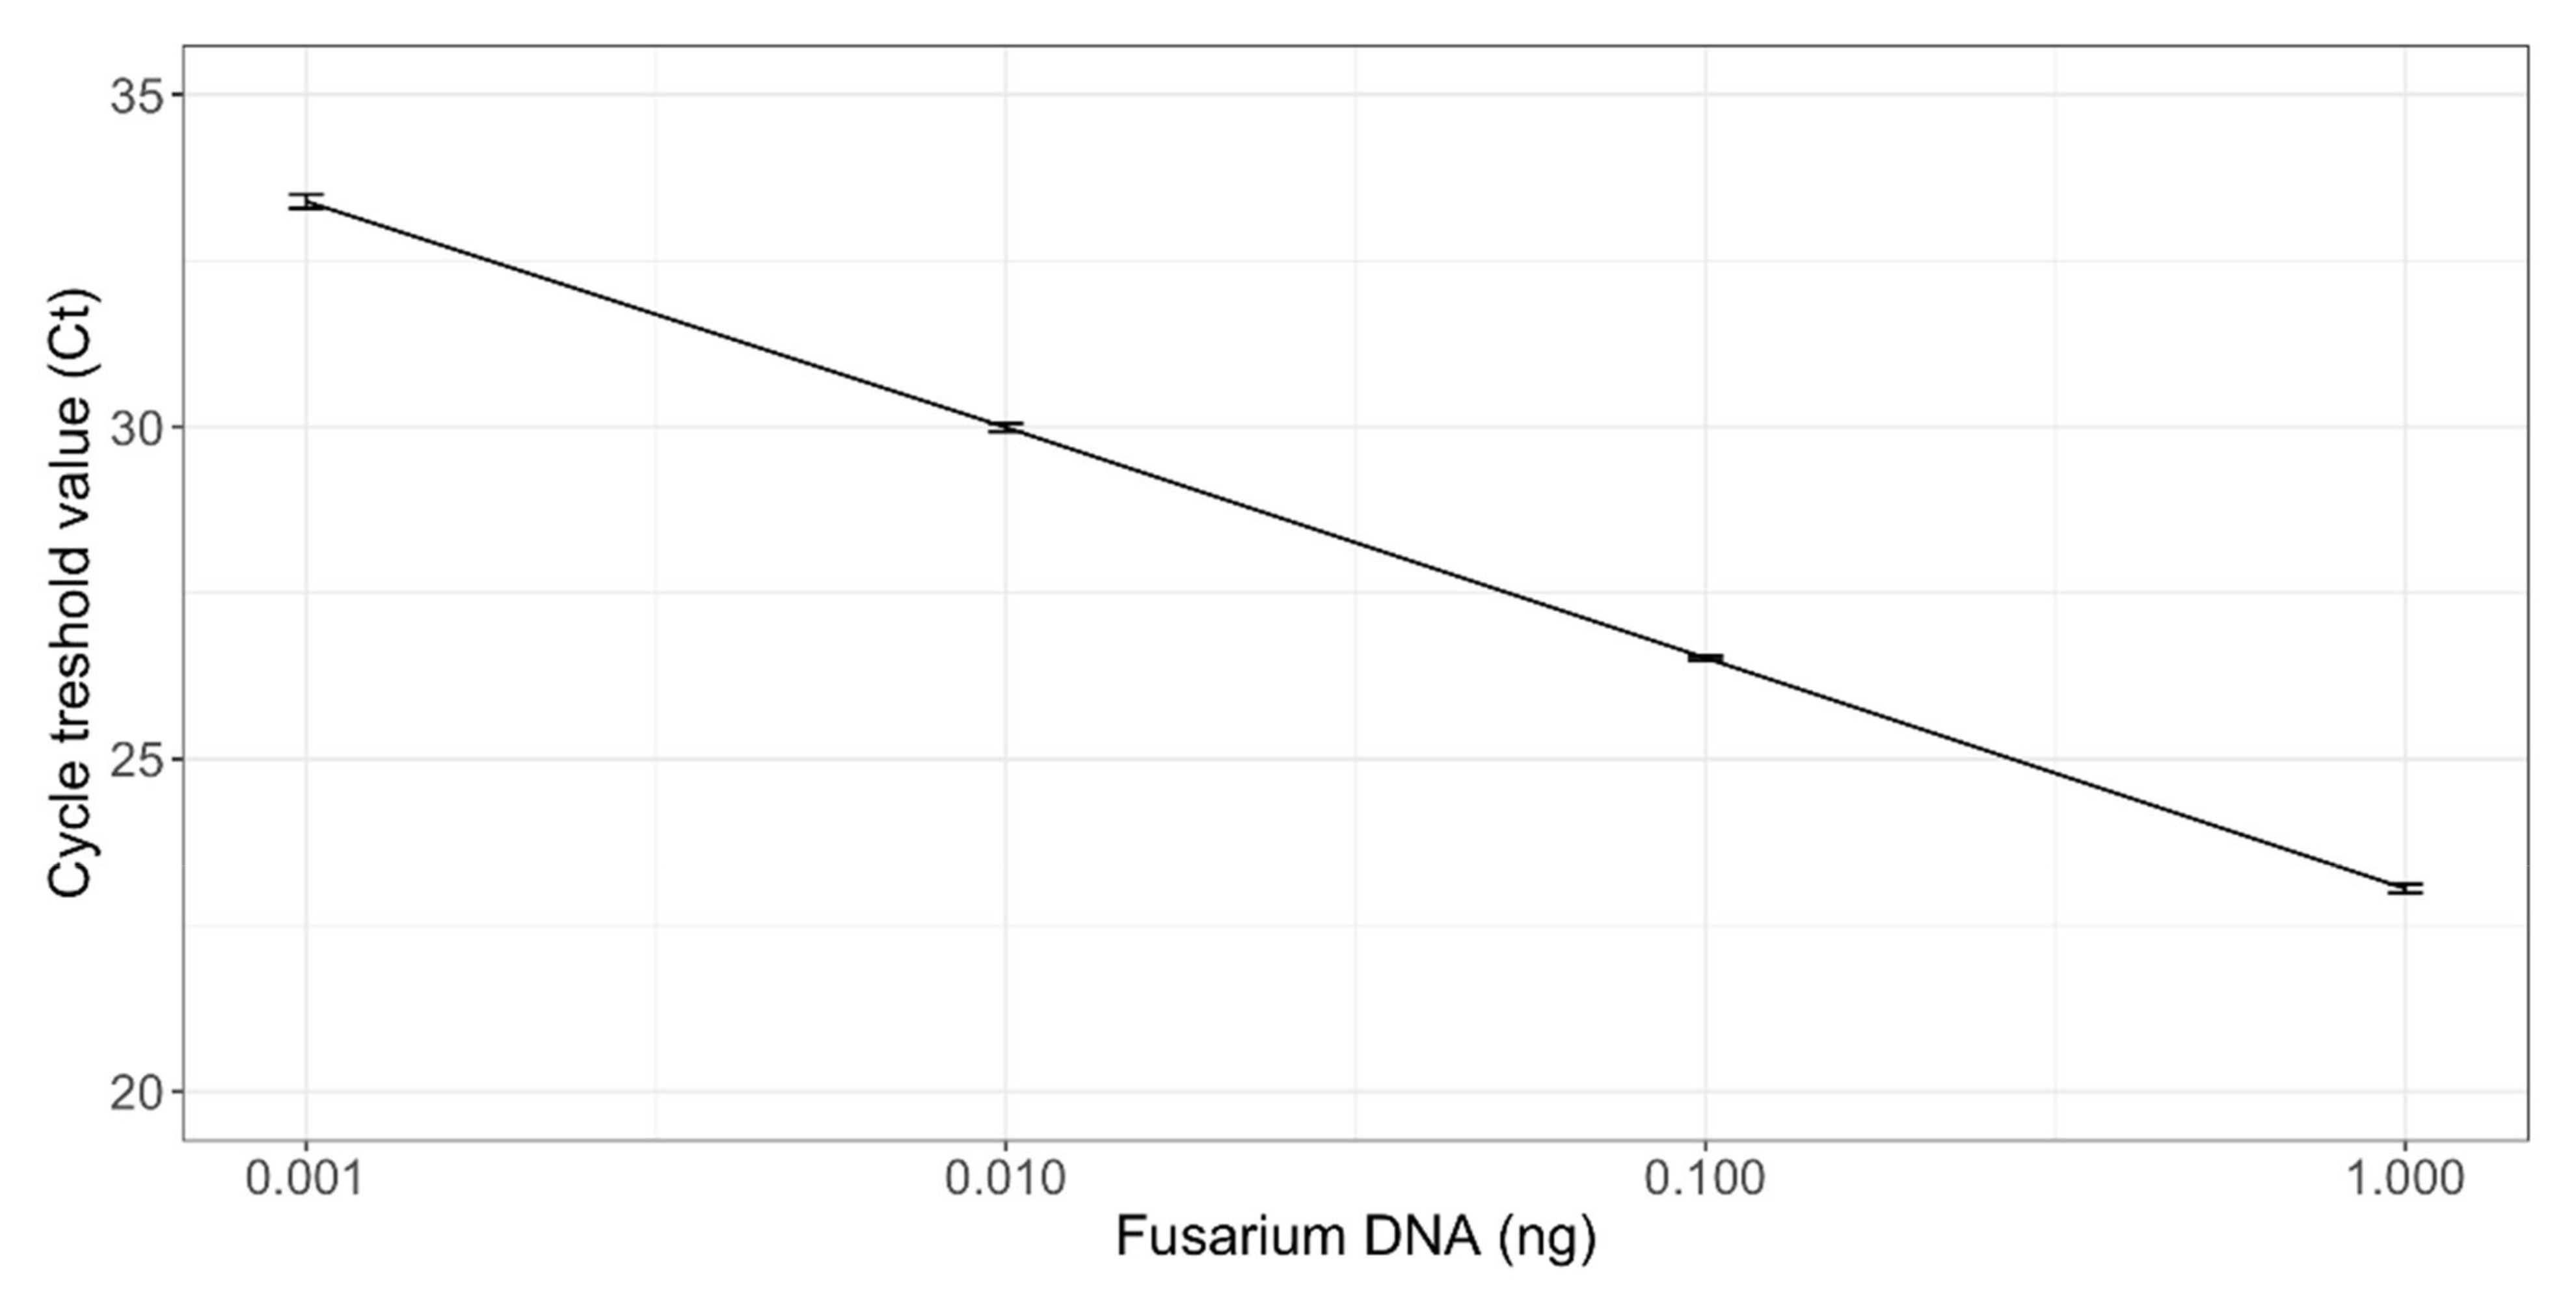
A standard curve was set up using a serial dilution of 0.001 to 1 ng target DNA per reaction of Fusarium DNA extracted from a pure culture of F. culmorum (VTT D-80148). The concentration of the F. culmorum DNA was quantified spectrophotometrically using a NanoDrop 2000 system (Thermo Scientific, Waltham, Massachusetts, USA). Three replicates were measured for each standard dilution.
The PCR inhibition of the cereal matrix was studied by spiking DNA extracted from a sterile oat sample with 1 ng of Fusarium genomic DNA. PCR reactions were performed in triplicate, as described above. The cycle threshold (Ct) values between the spiked reactions and Fusarium standard were compared to investigate potential PCR inhibition. The results obtained from the real-time PCR assay were analyzed with Abs Quant/2nd Derivate Max method in LightCycler® 480 program (Roche Diagnostics Ltd., Risch-Rotkreuz, Switzerland), and the results were normalized by dividing the Fusarium DNA quantities with the amounts of total genomic DNA in the template.
4.6. Conventional Fusarium Plating from Field Samples
Fusarium contamination in cereal samples was determined by plating (100 grains/sample) on peptone-pentachloronitrobenzene (PCNB) medium (Nash and Snyder medium) [
31] and incubating the plates in the dark at room temperature (22 °C). The growing colonies were isolated on potato dextrose agar (PDA), and
Fusarium species were identified morphologically from the developing colonies. The percentage of grains contaminated with each identified
Fusarium species was calculated.
4.7. DON Analysis
Trichothecenes were analyzed as described by Hietaniemi et al. [
9]. The laboratories of Natural Resources Institute Finland apply a quality control system in accordance with SFS-EN ISO/IEC 17025:2017. In brief, 15 g ground cereal samples were extracted with 84% acetonitrile. The raw extract was purified with MycoSep #227 SPE column (RomerLabs, Getzersdorf, Austria). The cleaned-up extract was transferred to a silylated test tube and evaporated to dryness. Deoxynivalenol (DON) was identified and quantified as trimethylsilylether derivatives by GC-MS. The limit of quantification (LOQ) was 25 μg/kg. The method for trichothecenes (DON) has been accredited since 2003. The reference materials for DON quality control were either corn naturally contaminated with deoxynivalenol (Trilogy, TR-D100, 1.9 ± 0.1 mg/kg, Trilogy Washington, MO, USA) or matrix reference material deoxynivalenol in wheat (Biopure, BRM003022, 877 µg/kg ± 23 µg/kg and QCM2W1, 906 ± 68 µg/kg, Biopure, Cambridge, MA, USA).
4.8. Fusarium Community Analysis with NGS
DNA elutions extracted from 51 oat samples were sent to Illumina Miseq sequencing of the
Fusarium elongation factor (
EF1α) region to Microsynth AG, Switzerland. First,
Fusarium EF1α libraries were sequenced with Nextera (Illumina, Inc., San Diego, CA, USA) two-step PCR with primers Fa-150 5′ CCGGTCACTTGATCTACCAG-3′ and Ra-2 5′ATGACGGTGACATAGTAGCG-3′ [
19]. The libraries were sequenced at Microsynth AG by 2 × 250 bp paired-end sequencing on the MiSeq platform using MiSeq v3 Reagent Kit. Negative controls for amplicon barcoding PCR and positive controls including the known amount of DNA from species belonging to the genus
Fusarium and a few other fungal species isolated from the cereal matrix were included in the sequencing set.
The sequence reads obtained from Illumina Miseq sequencing were subjected to sequence analysis using the DADA2 software package version 1.14 [
32] and DADA2 Pipeline Tutorial 1.16 with some modifications. DADA2 package run in RStudio (RStudio, Boston, MA, USA, version 1.4.1106) with R version 4.0.4. First, the sequences were pre-filtered to remove ambiguous bases (Ns) that could affect accurate mapping. Then, primers were identified from the sequences and removed using the cutadapt tool [
33]. The quality of the sequence reads was checked according to the DADA2 workflow. Next sequences were filtered and trimmed using DADA2 filterAndTrim function. Filtering parameters maxN = 0, maxEE = c(2, 2), truncQ = 2, minLen = 50 were used. A minimum length of 50 bp was used to remove spurious very low-length sequences. The maximum possible error rates were calculated using the learnErrors command. Identical reads were de-replicated (unique sequences). Amplicon sequence variants of the sequence data were identified using the DADA2 pipelines core sample inference algorithm. Denoised paired reads were merged according to the DADA2 pipeline, and an amplicon sequence variant table (ASV) table was constructed. Subsequently, chimeric sequence reads were removed from the dataset with the removeBimeraDeNovo function, using the consensus option. Finally, taxonomy from the domain to the species level was assigned to ASVs with DADA2’s native implementation of the naive Bayesian classifier method. Taxonomy was assigned against an in-house-generated
Fusarium database for
EF1α sequences. The
Fusarium database for
EF1α sequences was constructed according to Boutigny et al. [
18], and in addition, sequences from Cobo-Díaz et al. [
19] were added to the database. All images of the sequencing data were constructed with R using the packages phyloseq [
34] and ggplot2 [
35]. The Fusarium
EF1α gene region sequences have been submitted to the European Nucleotide Archive (ENA,
https://www.ebi.ac.uk/ena/, accessed on 31 July 2021) under accession numbers ERS7652901-ERS7652951.
4.9. Statistical Analysis
The correlation analysis to evaluate the correlation between qPCR results, DON content, and conventional Fusarium plating method was calculated using the IBM SPSS Statistics for Windows program (IBM Corp., Armonk, NY, USA, version 24). The Pearson or Spearman correlation coefficients at significance levels of p < 0.05 and p < 0.01 were calculated. Standard deviations of the qPCR results were calculated with Microsoft Excel (Microsoft Corp., Redmond, WA, USA, version 2102). Linear regression between Ct values and the amount of Fusarium DNA (ng) was calculated to acquire the r2 values of the qPCR standard curve. The qPCR, Fusarium plating method, and metabarcoding figures were created with R and correlation figures with Excel.

 ,
, 


