Article

Proteomic Identification and Quantification of Snake Venom Biomarkers in Venom and Plasma Extracellular Vesicles

by
Nicholas Kevin Willard
1,2,†,
Emelyn Salazar
1,†,
Fabiola Alejandra Oyervides
1,2,
Cierra Siobhrie Wiebe
1,2,
Jack Sutton Ocheltree
1,2,
Mario Cortez
1,2,
Ricardo Pedro Perez
3,
Harry Markowitz
4,
Anton Iliuk
4,
Elda Eliza Sanchez
1,2,
Montamas Suntravat
1,2 and
Jacob Anthony Galan
1,2,*
1
National Natural Toxins Research Center (NNTRC), Texas A&M University-Kingsville, MSC 224, 975 West Avenue B, Kingsville, TX 78363, USA
2
Department of Chemistry, Texas A&M University-Kingsville, MSC 161, Kingsville, TX 78363, USA
3
Omx Analytics, Kingsville, TX 38363, USA
4
Tymora Analytical Operations, West Lafayette, IN 47906, USA
*
Author to whom correspondence should be addressed.
These authors equally contributed to this work.
Toxins 2021, 13(9), 654; https://doi.org/10.3390/toxins13090654
Submission received: 12 August 2021 / Revised: 5 September 2021 / Accepted: 8 September 2021 / Published: 15 September 2021
(This article belongs to the Section Animal Venoms)

Abstract

:
The global exploration of snakebites requires the use of quantitative omics approaches to characterize snake venom as it enters into the systemic circulation. These omics approaches give insights into the venom proteome, but a further exploration is warranted to analyze the venom-reactome for the identification of snake venom biomarkers. The recent discovery of extracellular vesicles (EVs), and their critical cellular functions, has presented them as intriguing sources for biomarker discovery and disease diagnosis. Herein, we purified EV’s from the snake venom (svEVs) of Crotalus atrox and C. oreganus helleri, and from plasma of BALB/c mice injected with venom from each snake using EVtrap in conjunction with quantitative mass spectrometry for the proteomic identification and quantification of svEVs and plasma biomarkers. Snake venom EVs from C. atrox and C. o. helleri were highly enriched in 5′ nucleosidase, L-amino acid oxidase, and metalloproteinases. In mouse plasma EVs, a bioinformatic analysis for revealed upregulated responses involved with cytochrome P450, lipid metabolism, acute phase inflammation immune, and heat shock responses, while downregulated proteins were associated with mitochondrial electron transport, NADH, TCA, cortical cytoskeleton, reticulum stress, and oxidative reduction. Altogether, this analysis will provide direct evidence for svEVs composition and observation of the physiological changes of an envenomated organism.
Key Contribution: Our work demonstrates the utility of EVtrap (Extracellular Vesicles total recovery and purification) technology for the comprehensive analysis of complex snake venom-derived extracellular vesicles and envenomated mouse plasma extracellular vesicles. As such, this analysis explores the composition of svEVs present in snake venom and the use of EV’s as biomarkers (venom-reactome) after snake envenomation.

1. Introduction

Snake venoms contain a diverse and extensive variety of toxins used to immobilize and digest their prey [1]. Though the diversity and composition of a snake’s venom can vary in toxicity and lethality from different species or within the same species, nearly all snake venom contains toxins from one of the twelve major proteins families [2]. These toxins are used to cause severe localized damage such as cell necrosis, hemolysis, edema, and inflammation that can later lead to hemorrhage, coagulopathy, and, without treatment, eventual death. Despite being considered the third most dangerous animal in the world (behind mosquitos and humans), and having a multitude of diverse toxic species spanning six continents, snake envenomings have been overlooked as a serious health concern [3]. Recently, the World Health Organization (WHO) has placed snake bite envenomation as a global health concern with 5.4 million snake bites causing 2.7 million cases, resulting on average 138,000 deaths a year and 400,000 cases of permanent disability [4]. Though the diversity of snakes and snake venom has been very well studied for many North and South American species, the detailed mechanism of action of snake envenomation remains poorly understood.
In the United States alone, it is estimated that there are about 10,000 snakebites per year that require emergency treatment [5]. About 4500 of these cases have been determined to be medically relevant and caused by snakes within the Crotalinae subfamily [5]. Several rattlesnakes from the Crotalinae are found within California, the most predominant being C. oreganus (Northern Pacific Rattlesnake). This species is found in the great central valley [6], and its subspecies C. oreganus helleri (Southern Pacific Rattlesnake), can be found in Southern California, Northern Baja California, and Mexico [7]. Another species of rattlesnake is the Crotalus atrox (Western Diamondback Rattlesnake), which accounts for most envenomations within northern Mexico and the United States [8]. Both C. atrox and C. o. helleri venoms are predominantly hemotoxic, myotoxic, cytotoxic, and hemorrhagic. Upon envenomation, the victim will suffer from severe pain, vomiting, edema, [9,10] and fluctuation of blood pressure [11]. The principal protein families found in C. atrox and C. o. helleri venom are L-amino acid oxidases (LAAOs), snake venom serine proteases (svSPs), snake venom phospholipase A2s (svPLA2s), and snake venom metalloproteinases (svMPs) [12,13]. Other proteins are also found, including cysteine-rich secretory proteins (CRiSPs), C-type lectins, and disintegrins. Indeed, the most abundant protein family is the svMPs, which can comprise of up to 70% of the total amount of protein in the venom [13].
These proteins found in snake venom are produced from a highly specialized gland that synthesizes, stores, and secretes the complex mixture of toxins. Many of these toxins are expressed as pro-enzymes in the active form or are kept inactivated by peptides liberated by prodomain hydrolysis or by other inhibitory factors present in the venom as the acidic pH environment, high citrate concentrations, and tripeptides containing pyroglutamate [14]. As such, envenomings result in highly active proteases which cleave basement membranes and non-enzymatic receptor antagonists (such as disintegrins and C-type lectins) that disrupt cell–cell interactions [14]. Despite venom originating from cells, very little attention has been given to the functionality of snake venom gland-derived extracellular vesicles (svEVs). Many cell types have the capability to release small membranous vesicles, including apoptotic bodies, microvesicles, and exosomes. Microvesicles can range from 150 to 500 nm and are formed by the outward budding and fission of the plasma membrane. Exosomes can range from 30 to 150 nm and are formed intracellularly by the inward budding of endocytic compartment membranes [15,16]. These EVs play a major role in many biological responses, such as cell communication, apoptosis, and immune-responses [17]. Recently, they have been given important attention due to the growing ability to be isolated from blood, urine, saliva, and breast milk using various analytical methods [18], and for their relevance in the quantification and identification of biomarkers in cancer, neurogenerative disease, cardiovascular disease, and infection [19,20,21,22,23].
Though svEVs were first observed in 1973 [24], only four recent studies have shown evidence for snake venom extracellular vesicles and partial characterization [25,26,27,28]; however, their precise protein content, function, and mechanism/role in snake envenomation remain unknown. In our study, we examined C. atrox and C. o. helleri snake venom-derived extracellular vesicles. Both displayed a unique venom toxin composition in EVs. Interestingly, EVtrap enrichment revealed previously unidentified signaling, adaptor, transmembrane, and vesicle proteins. To further explore EVs in C. atrox and C. o. helleri envenomation, EVtrap [29,30] and quantitative mass spectrometry were used to analyze mouse plasma-derived extracellular vesicles after sublethal injection. Our results shed new insights into snake venom extracellular vesicles and quantify potential biomarkers for snake envenomation resulting in altered metabolic pathways.

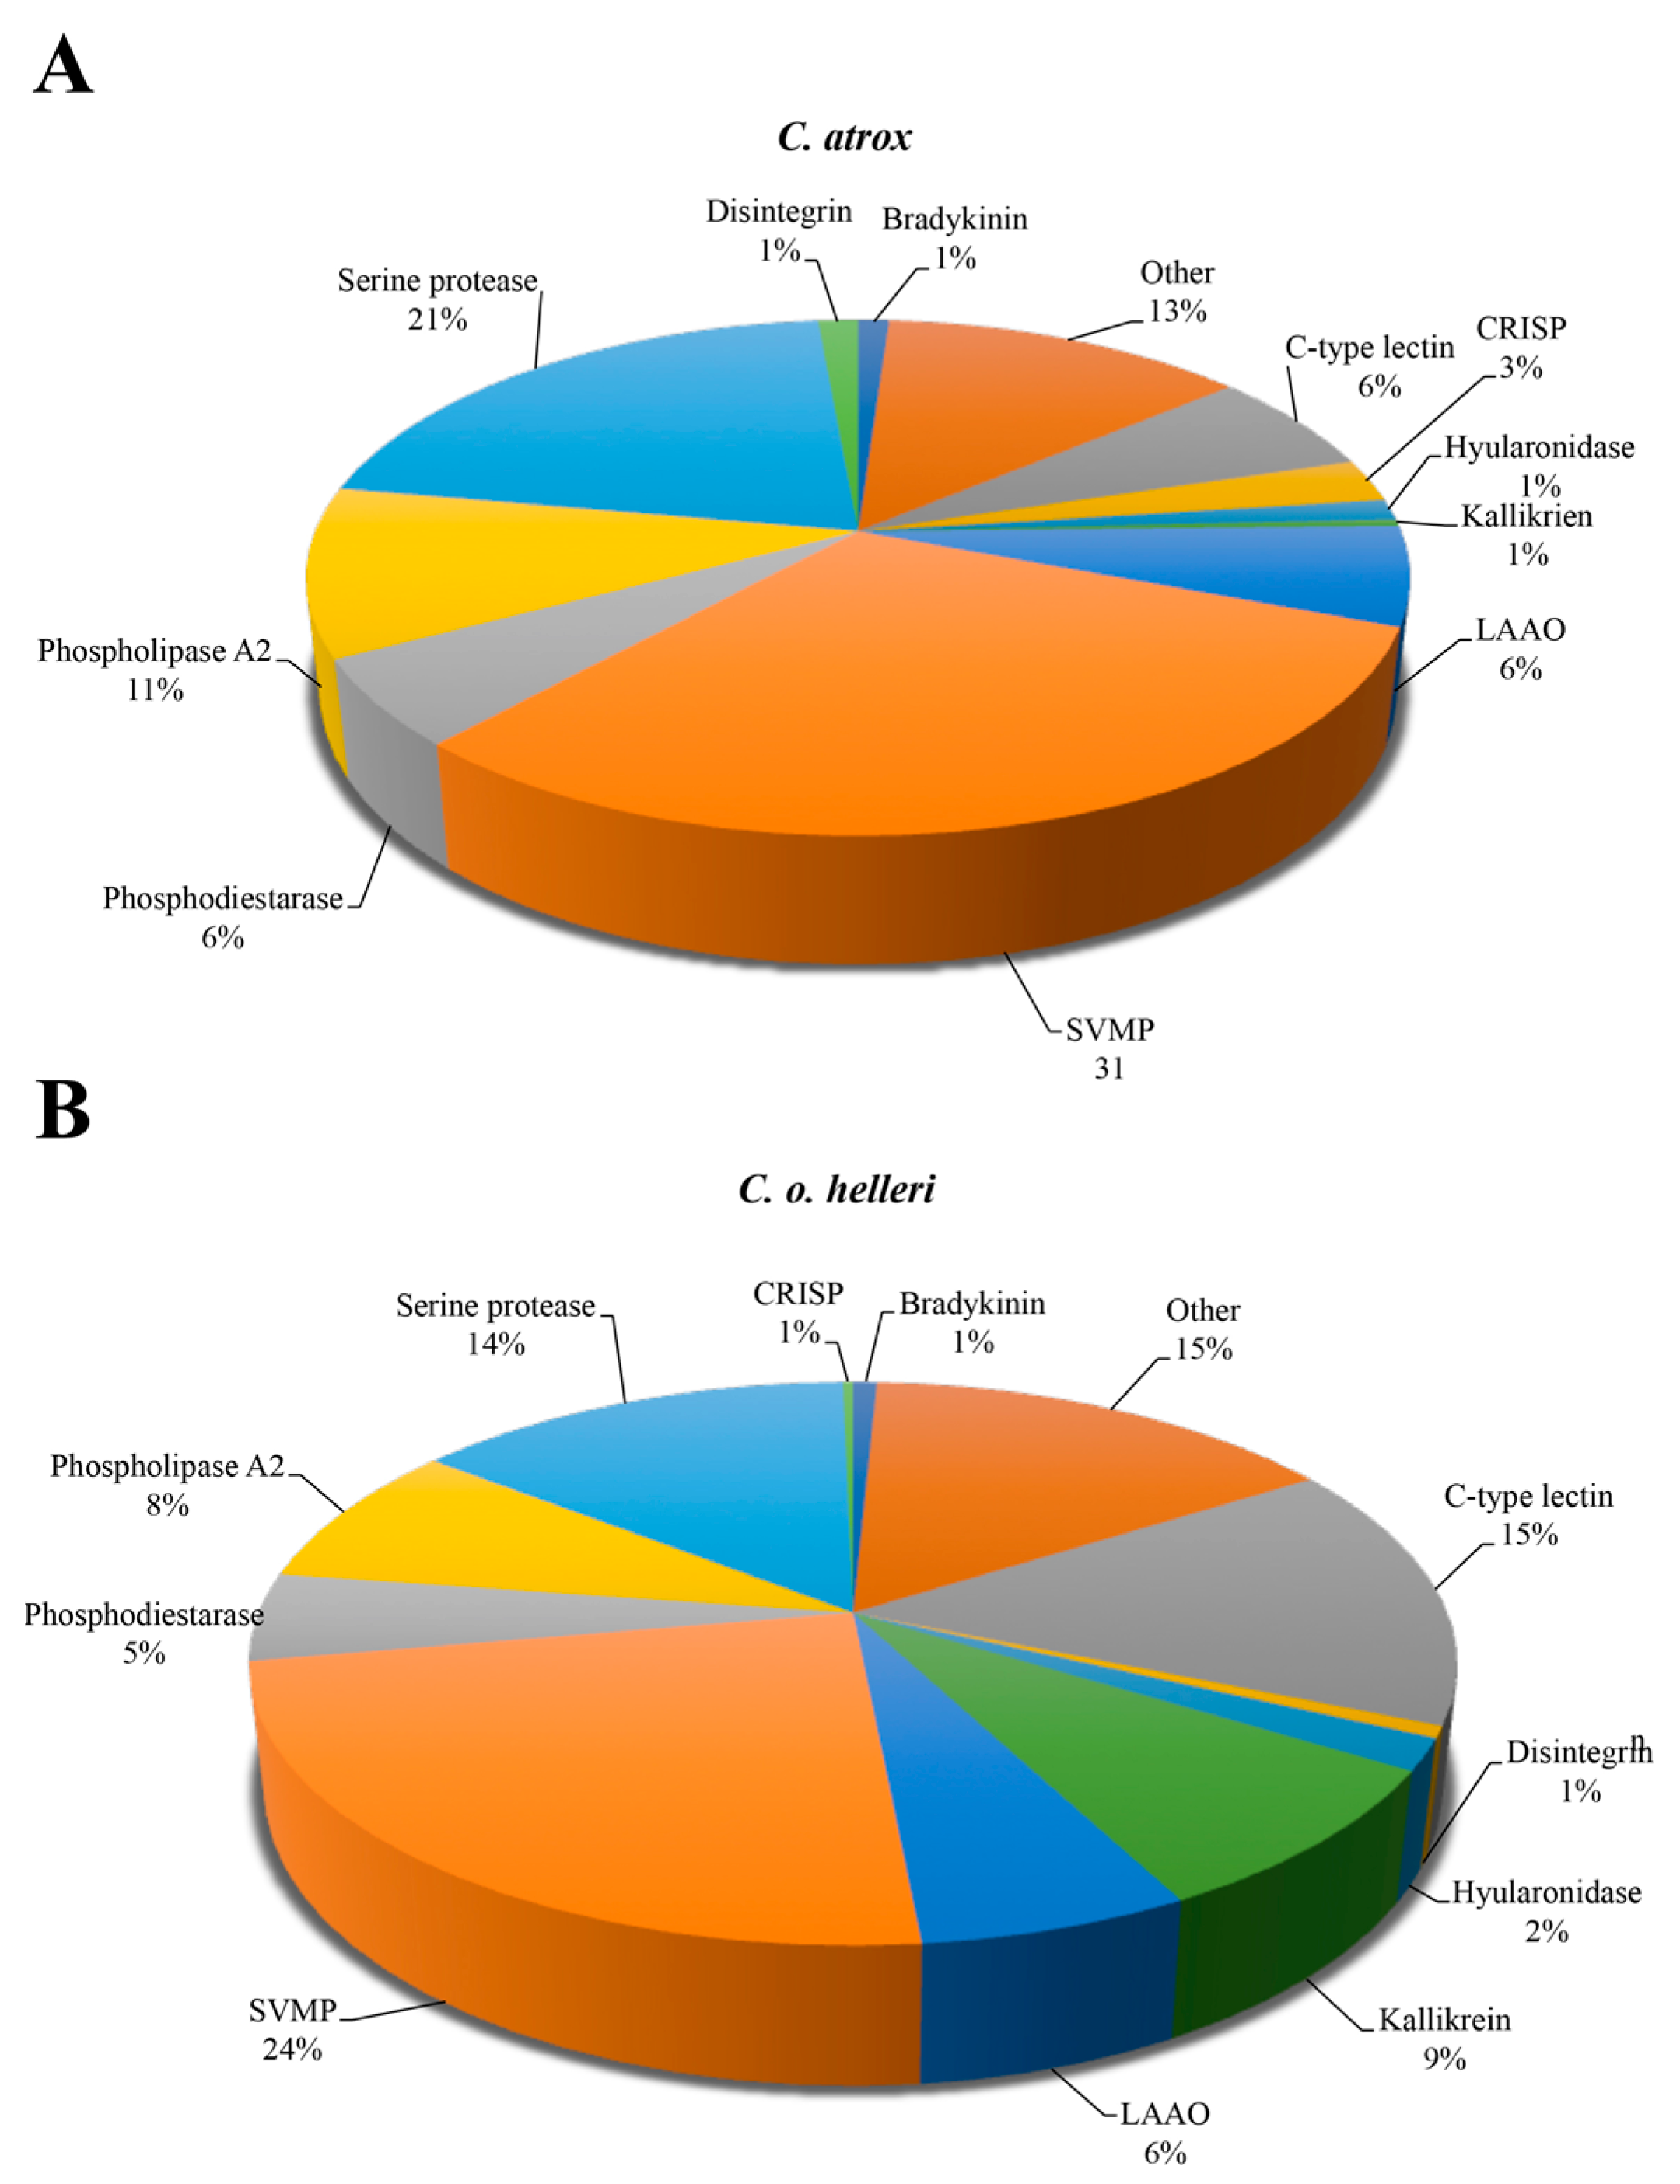
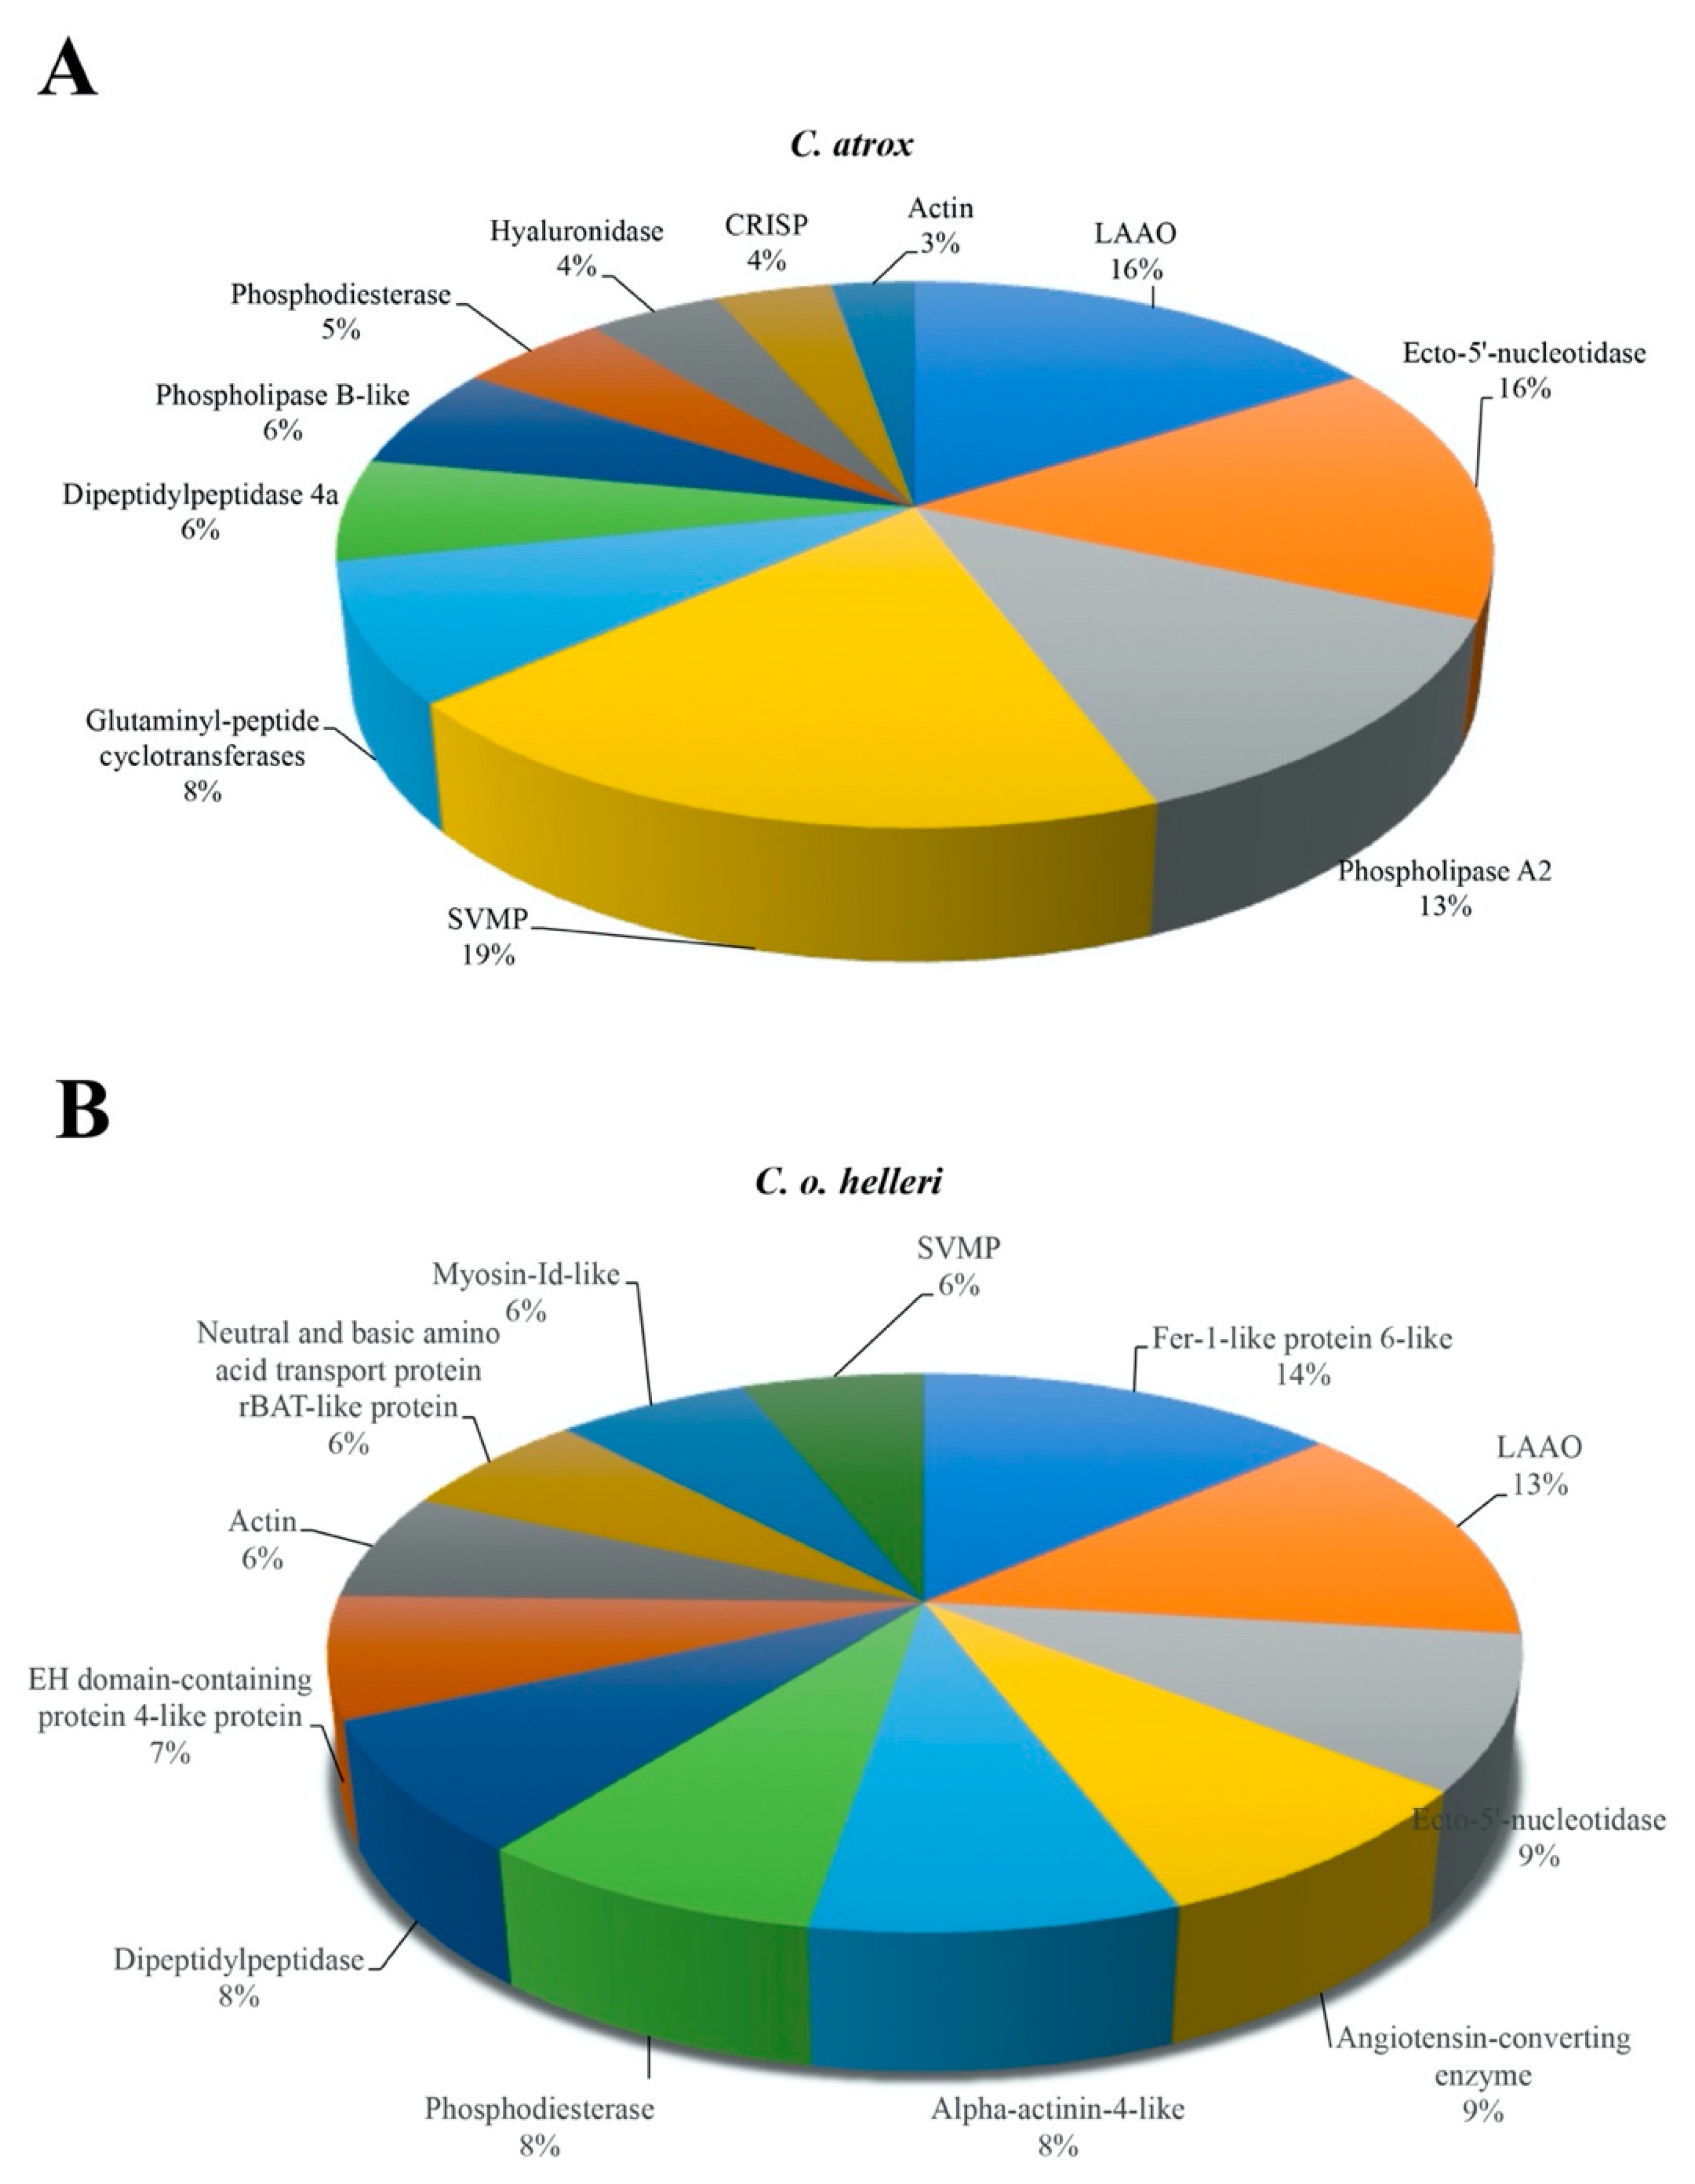
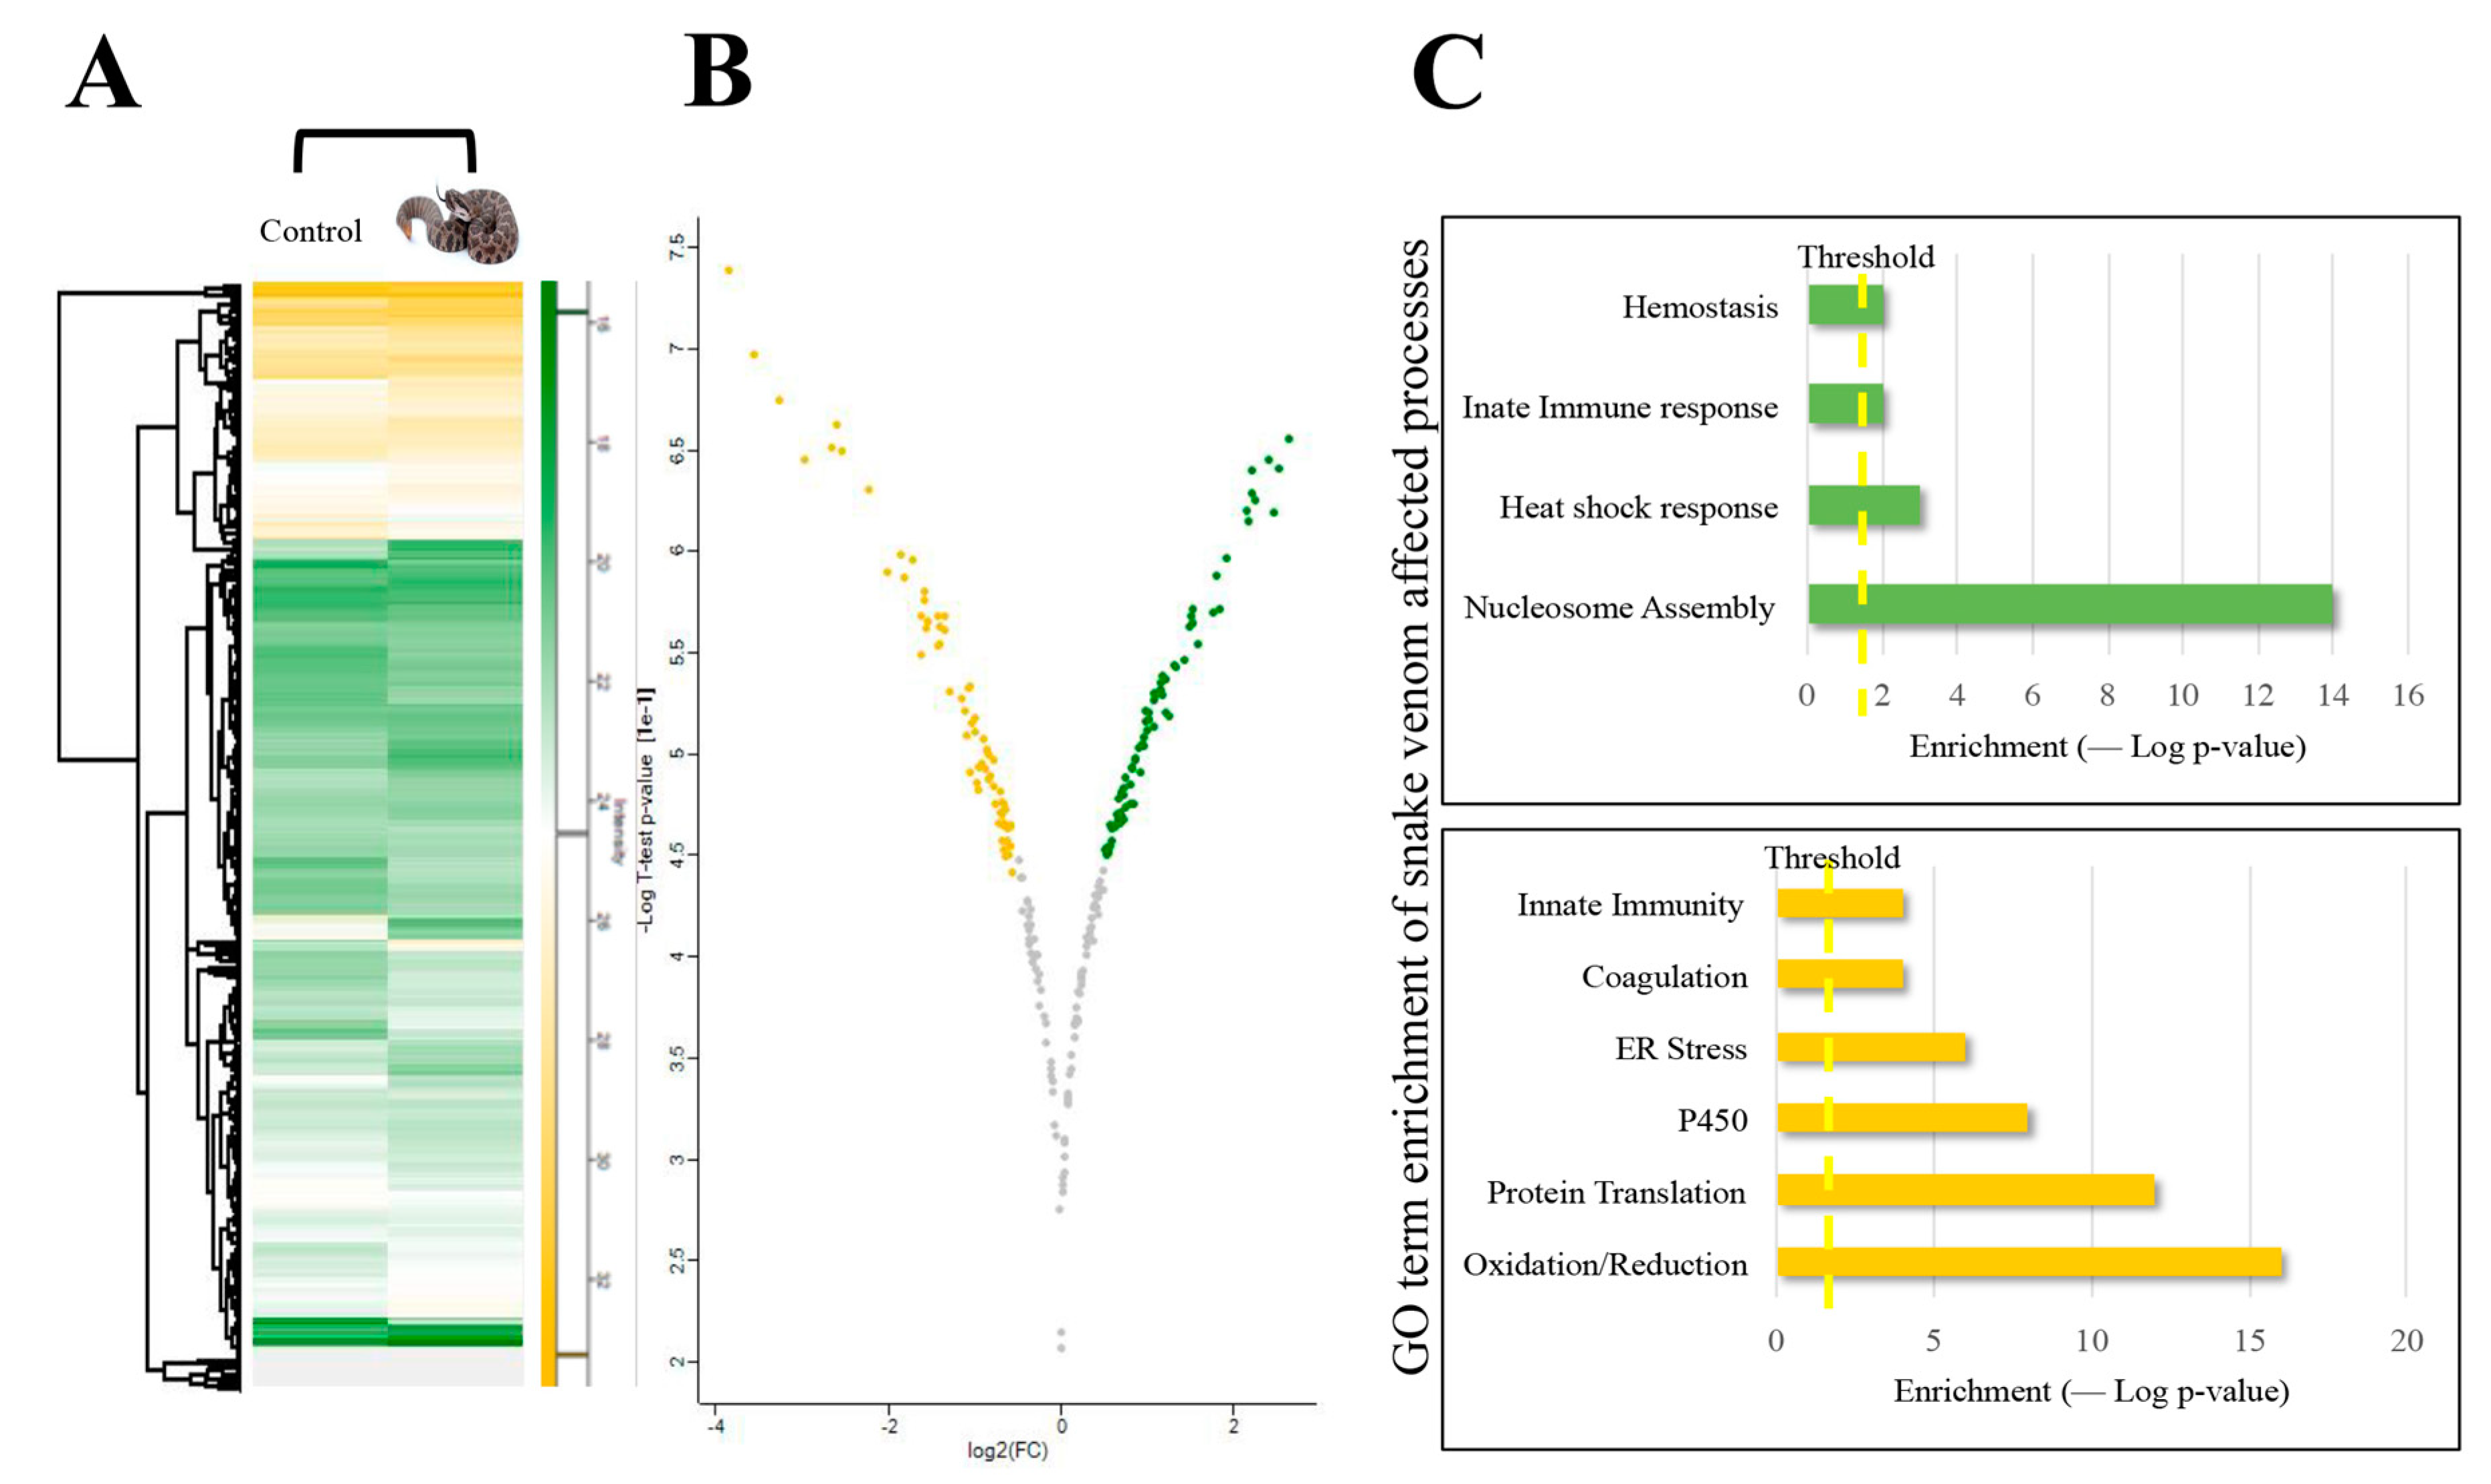
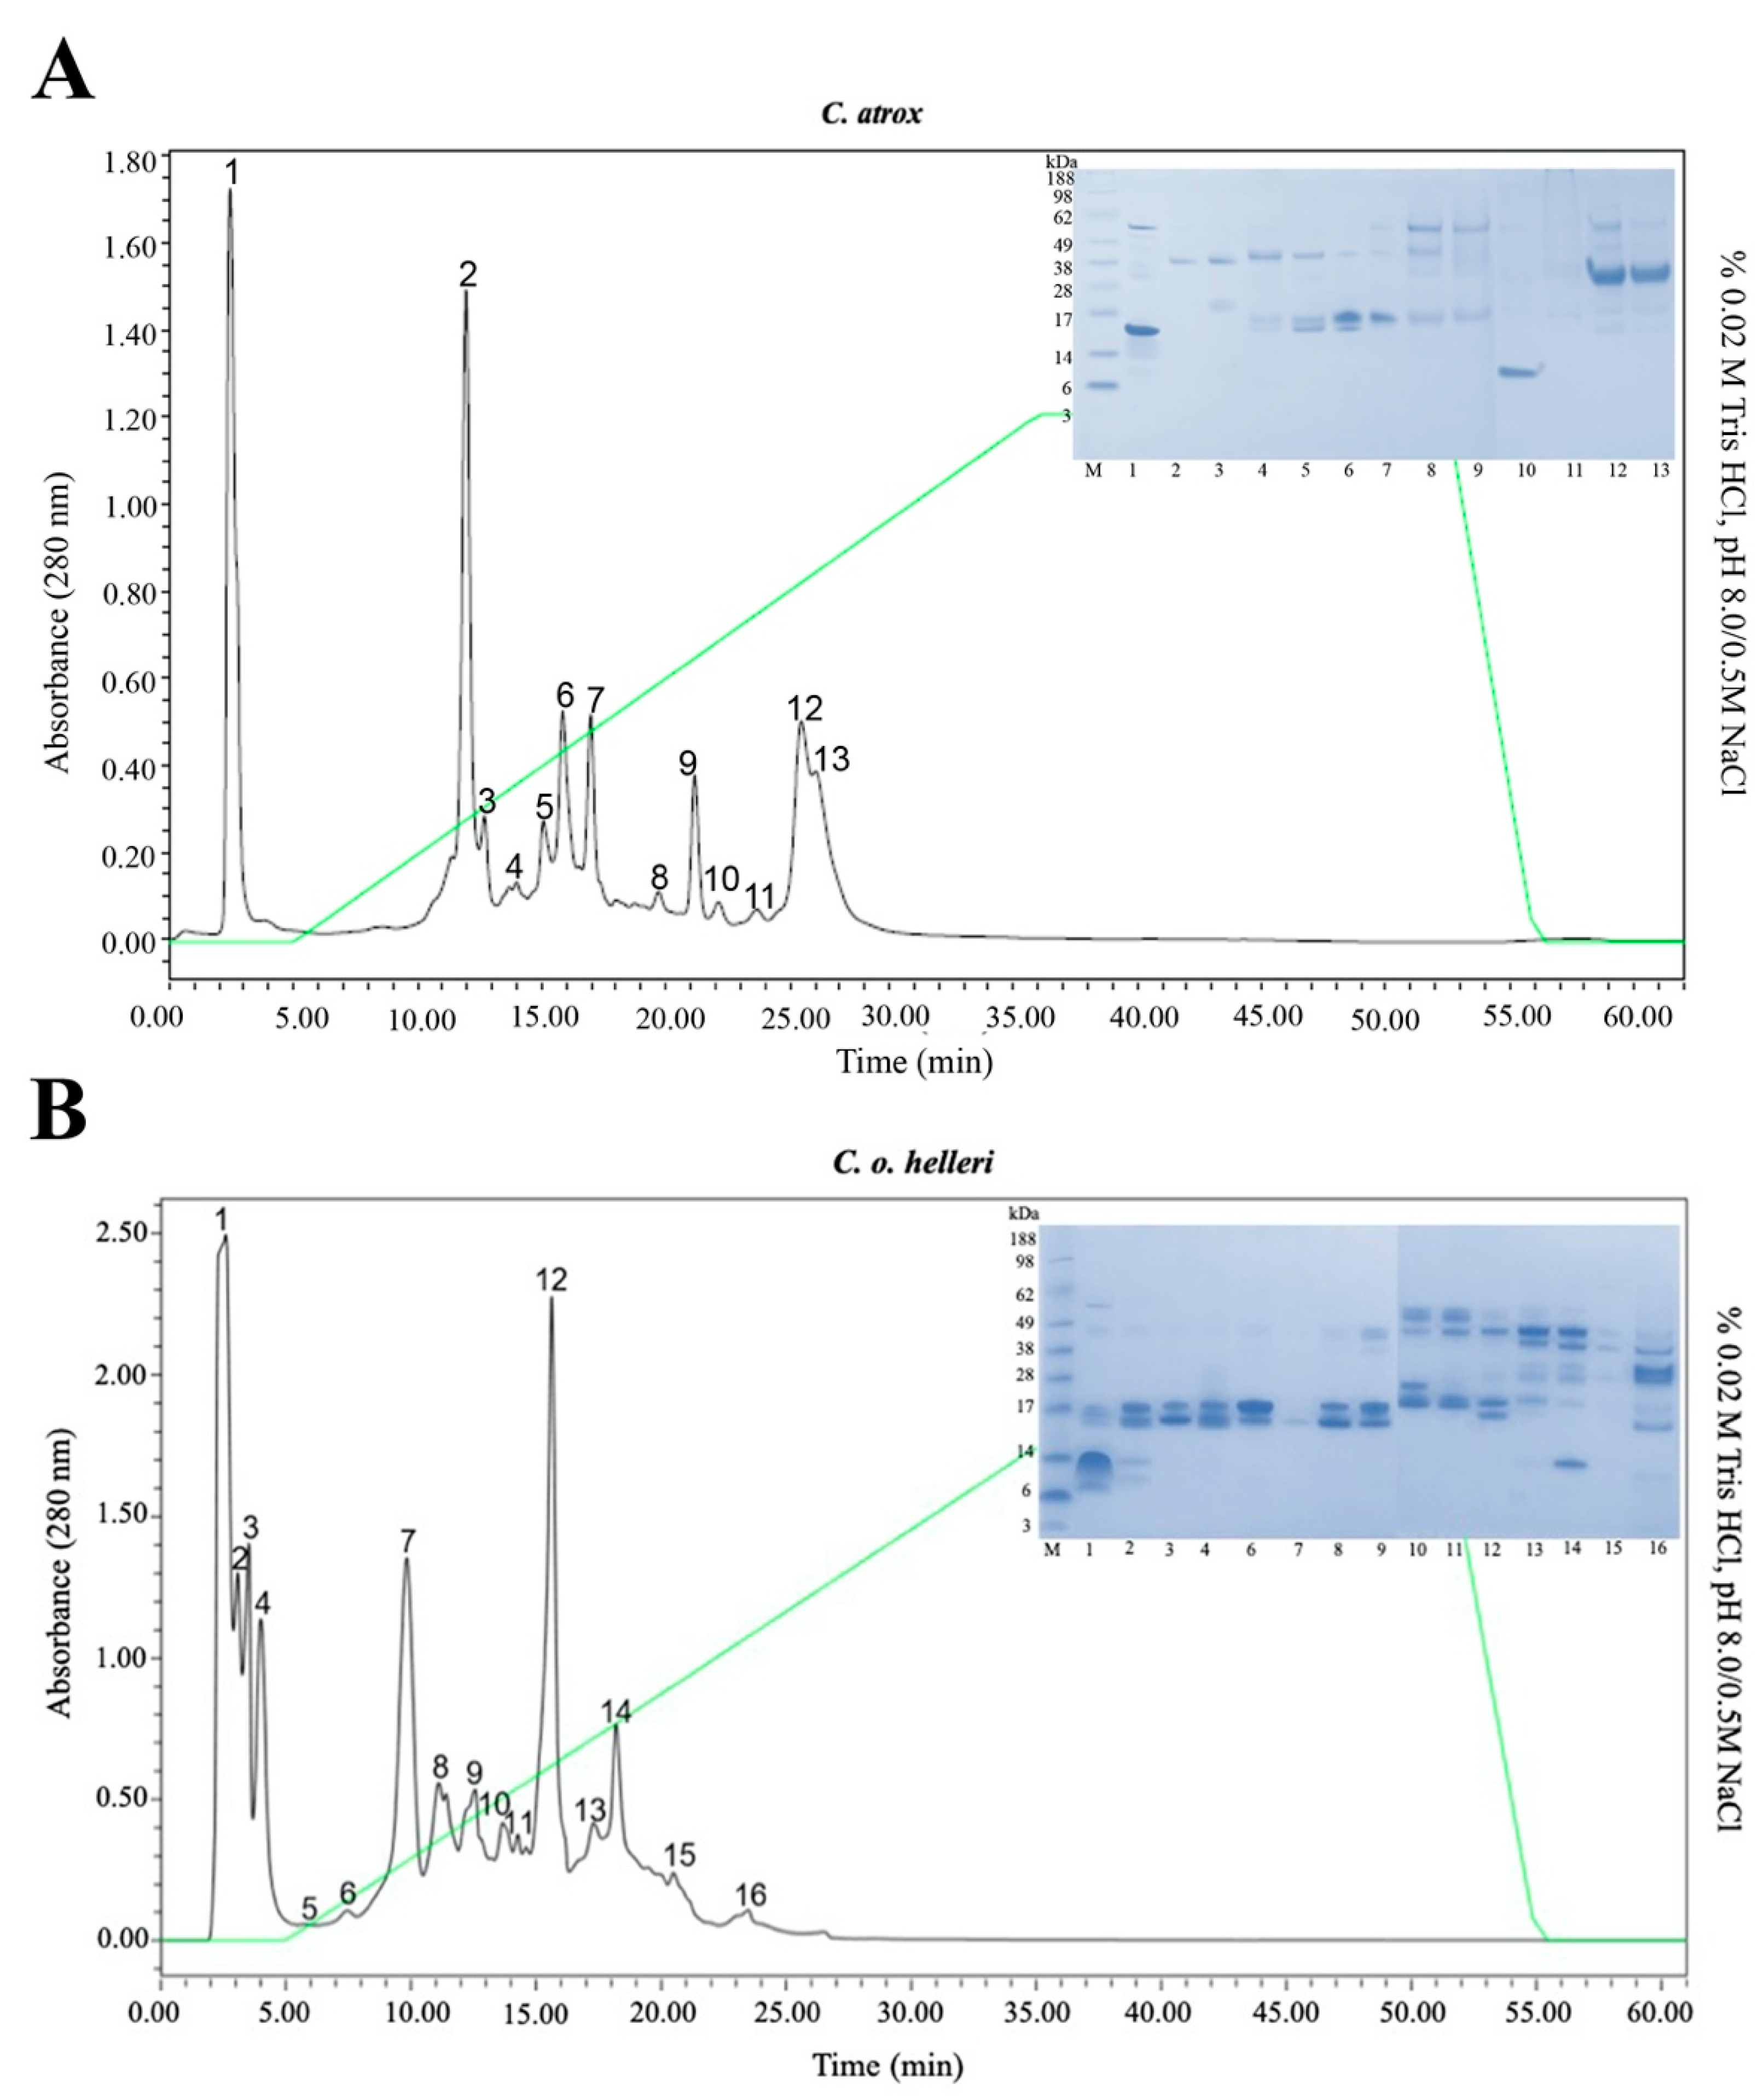
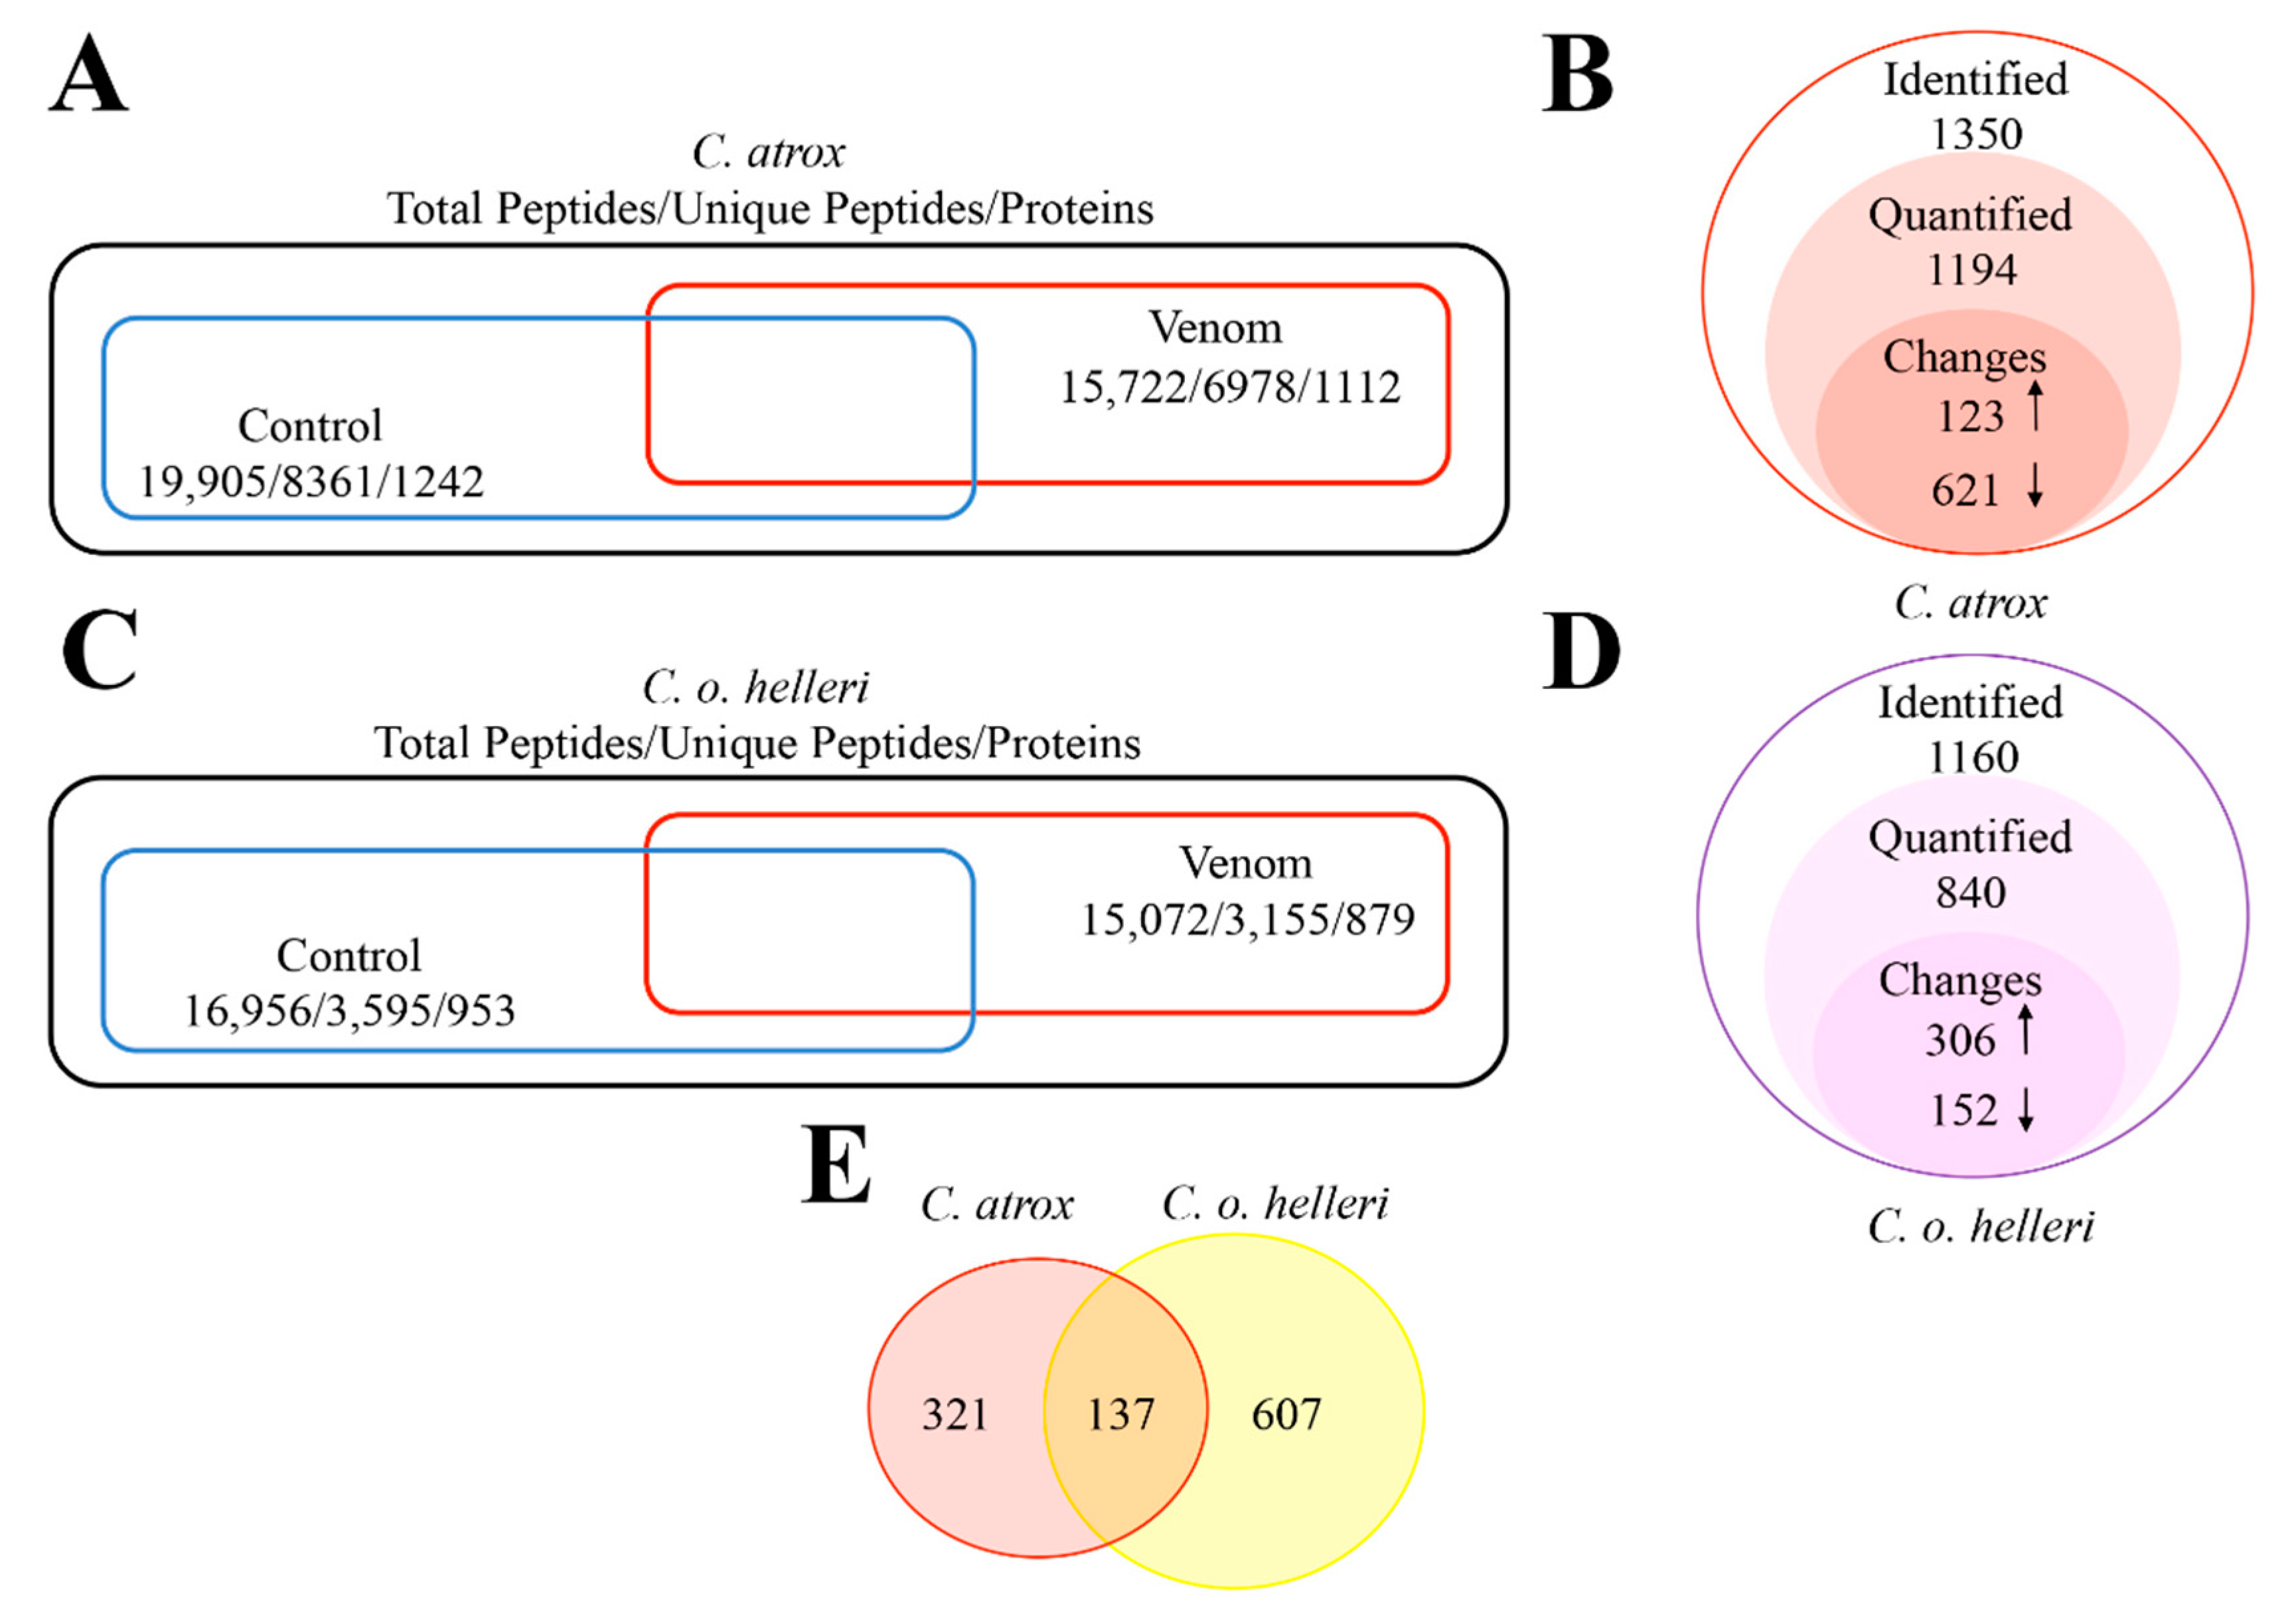
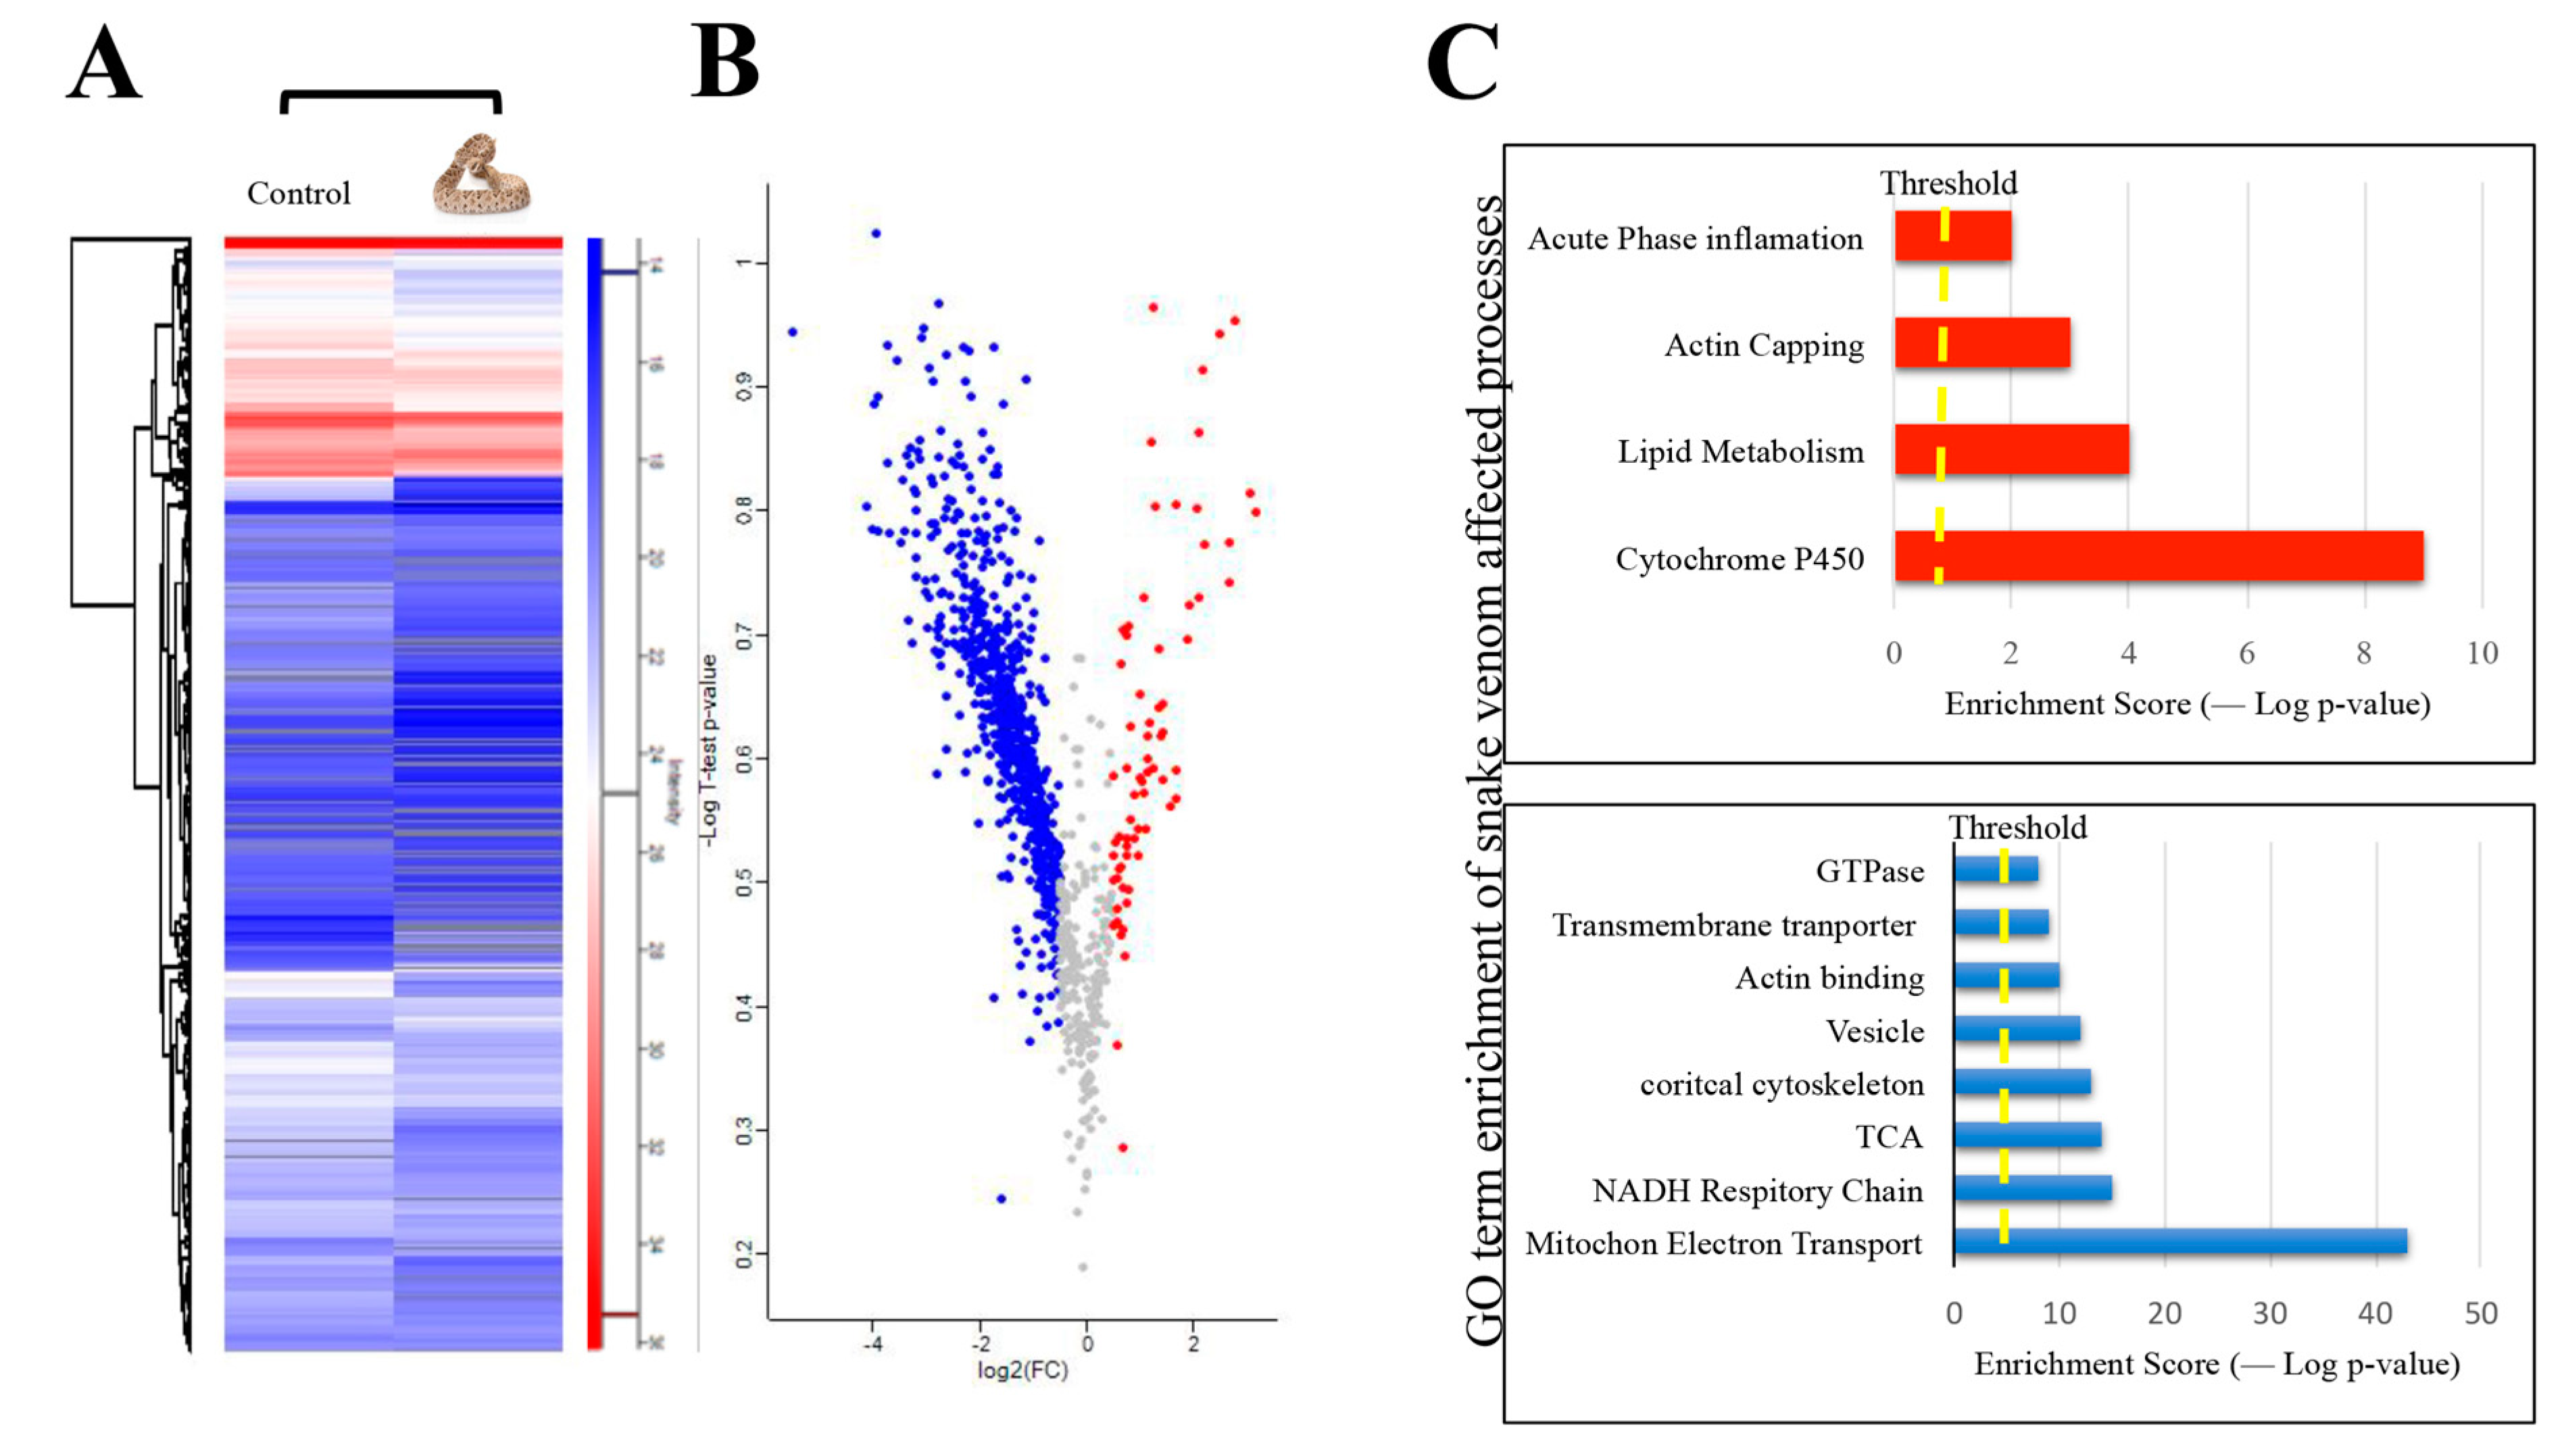
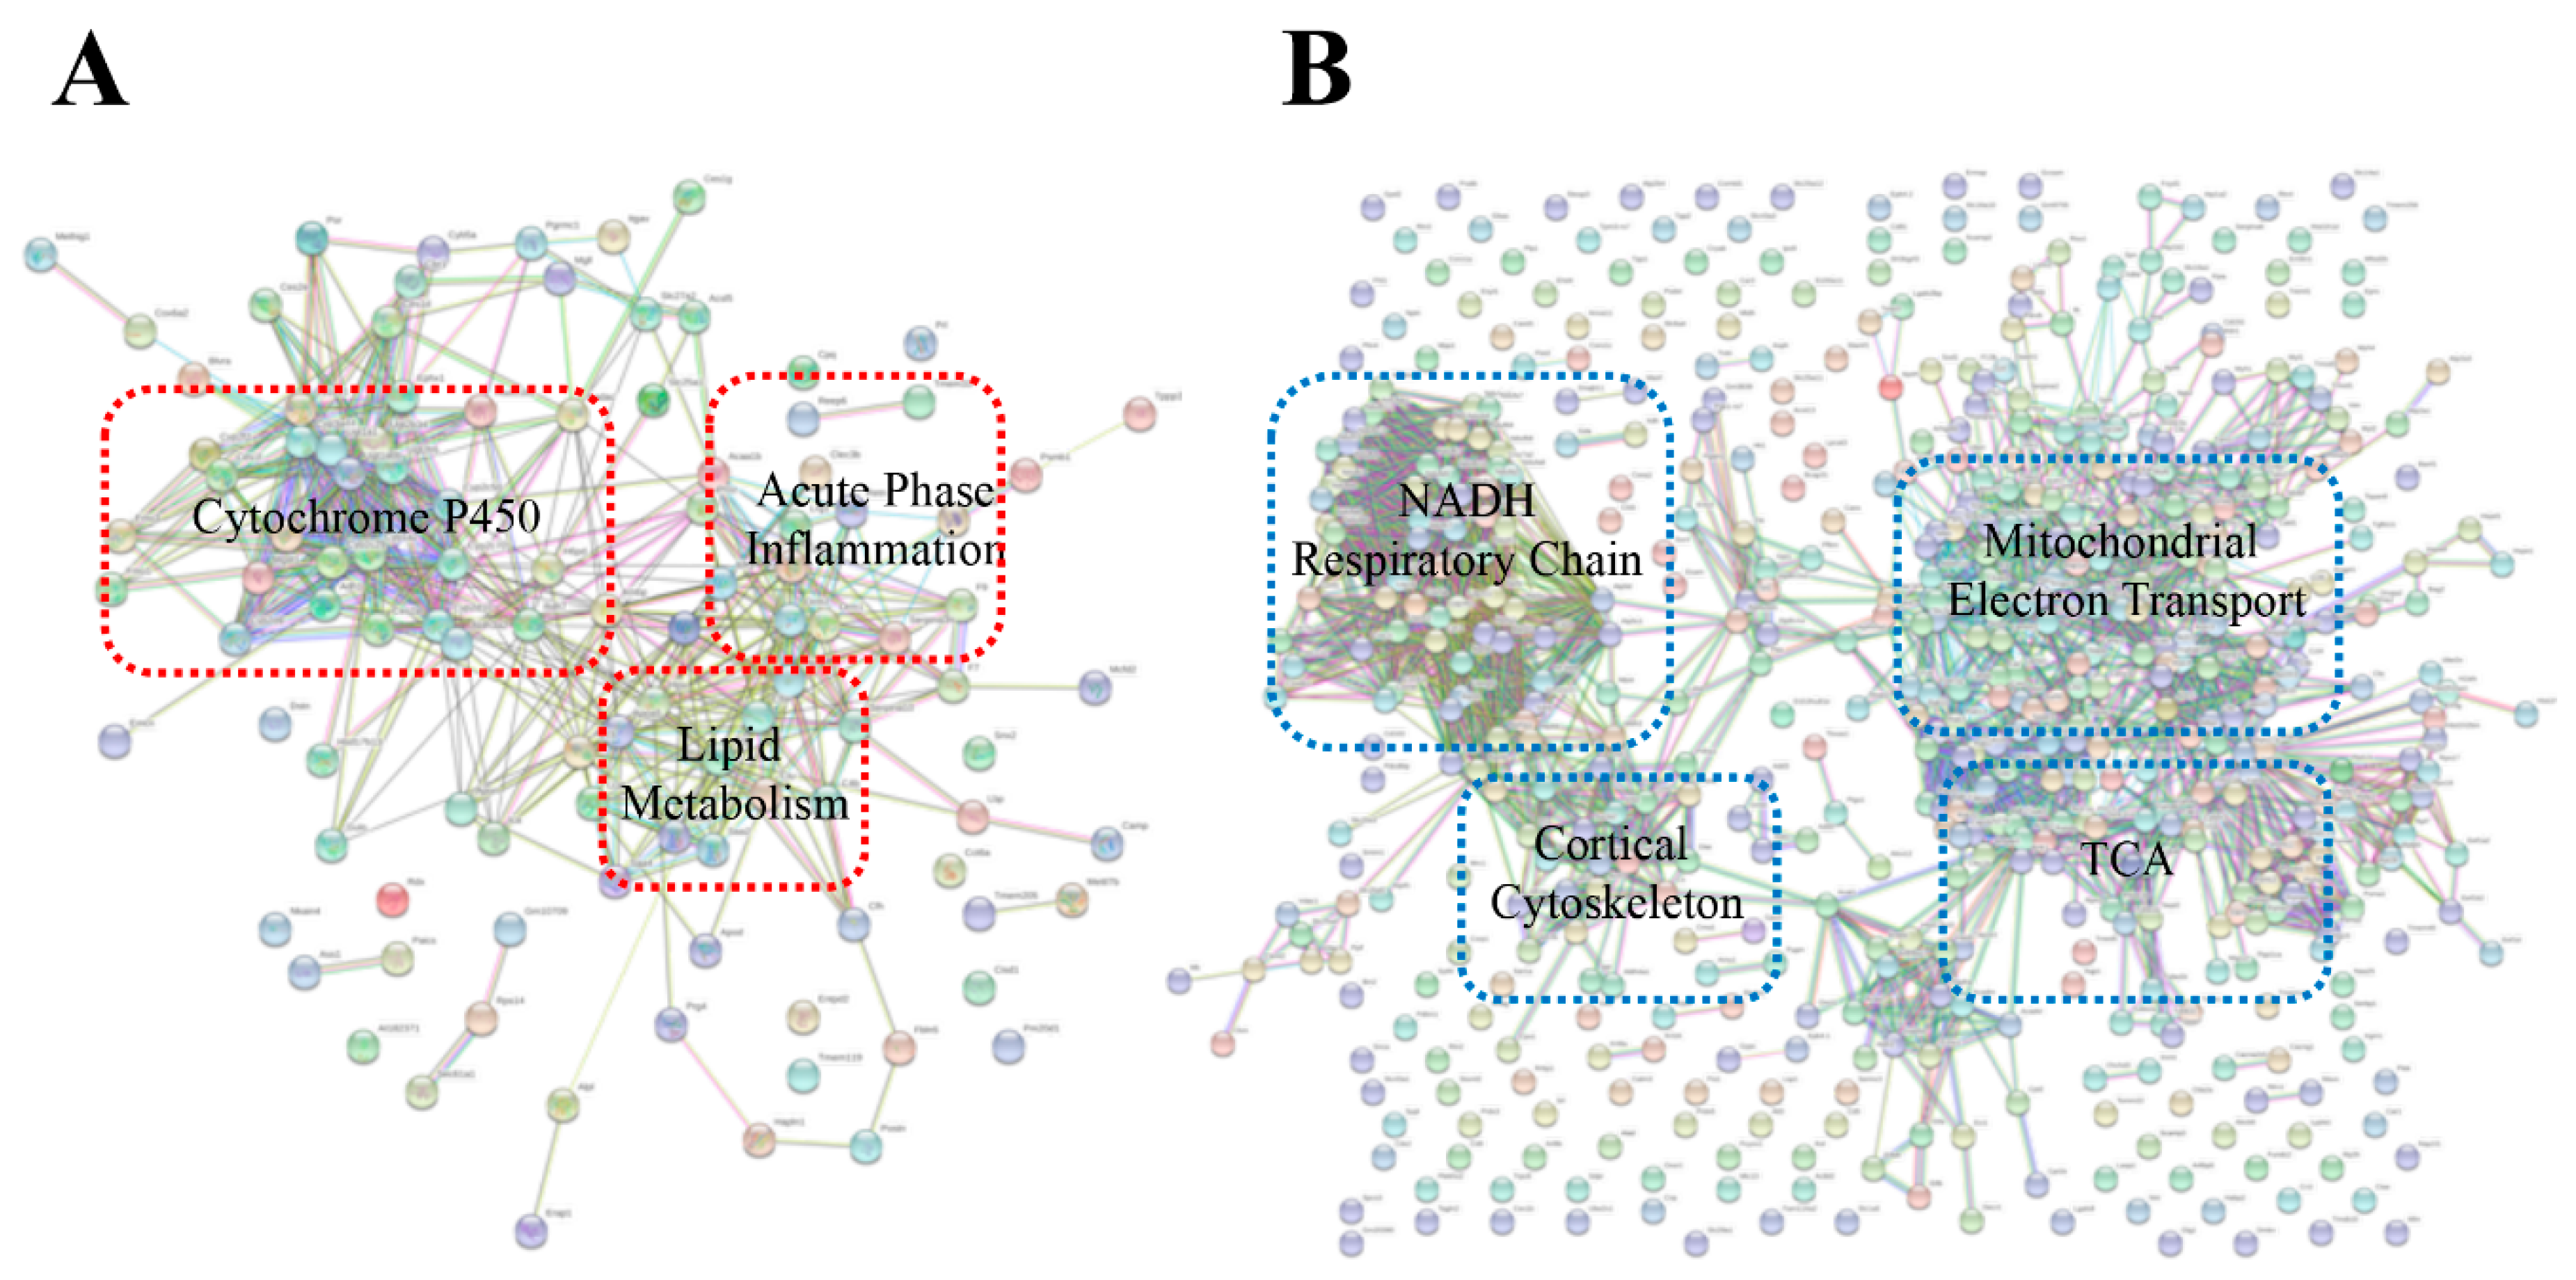
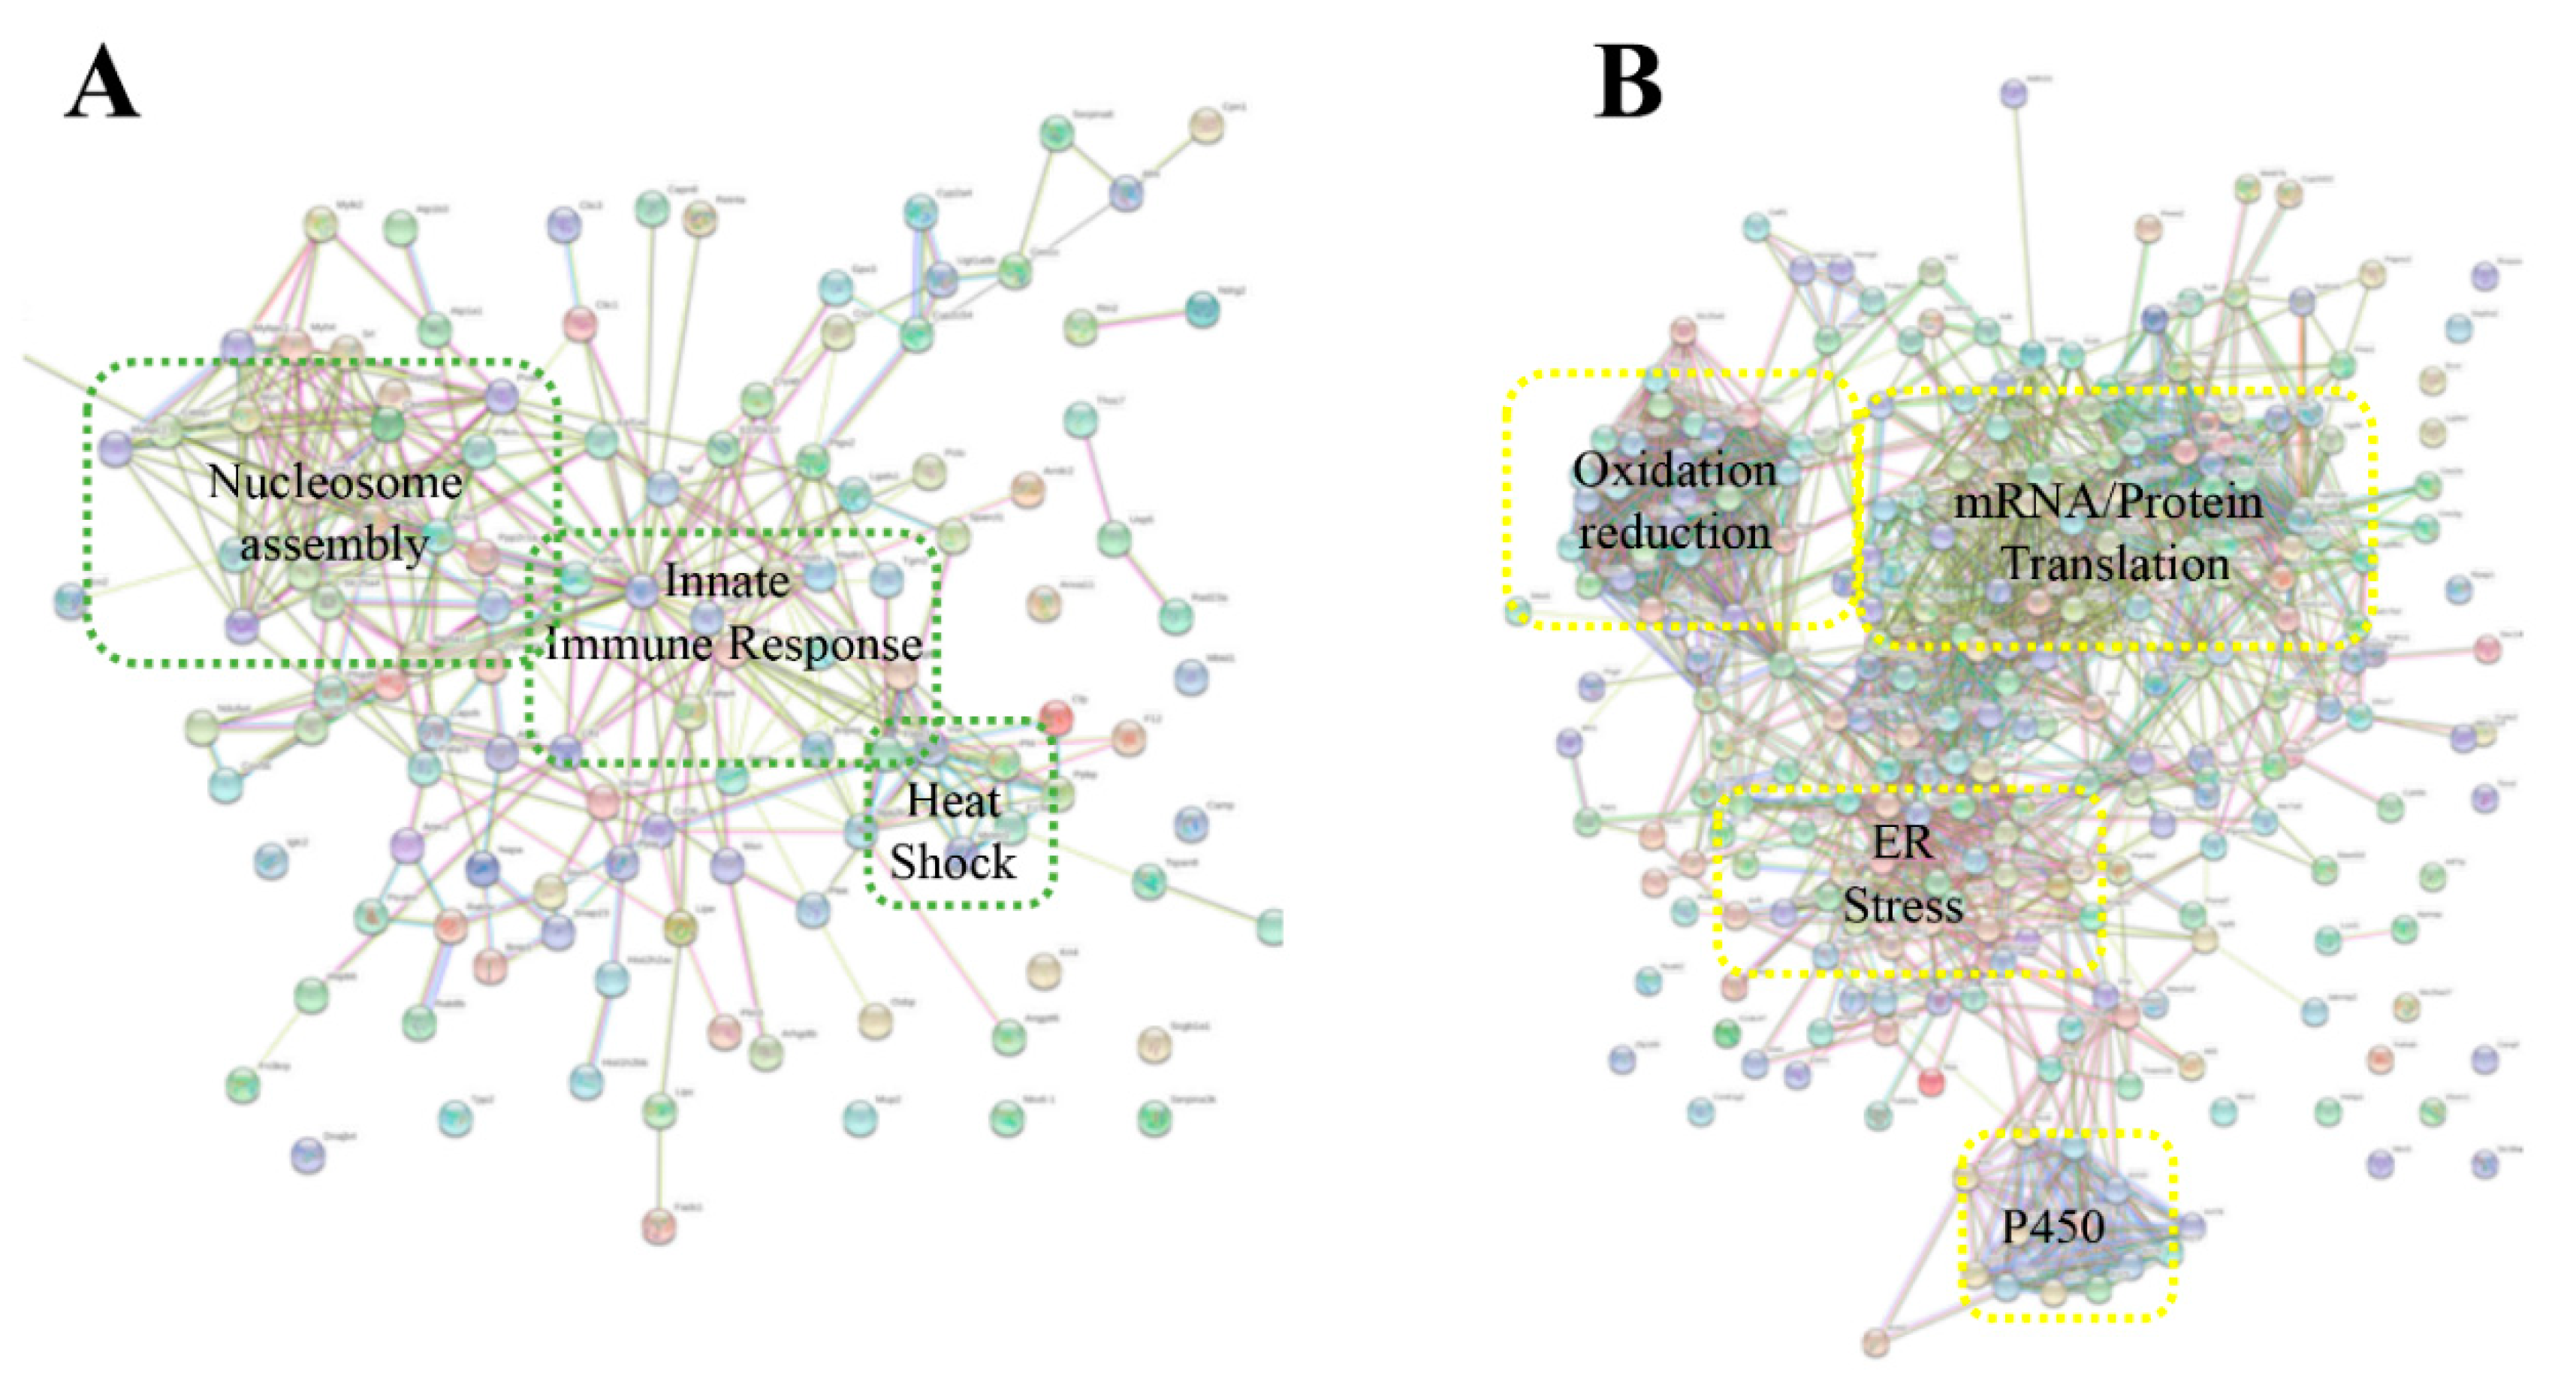
2. Results and Discussion

This study explored the proteomic identification and quantification of snake venoms and their biomarkers in extracellular vesicles utilizing mass spectrometry and quantitative proteomic approaches for the detection of svEVs and global systemic signature of snake envenomation. C. atrox and C. o. helleri were designated as medically important snakes contributing to the most bites and envenomations resulting in skin/tissue damage, muscle necrosis, perturbations in hemostasis, and possible limb loss due to the presence of highly abundant LAAO, svMPs, svSPs, and PLA2s [12,31] (Figure 1, Supplemental Tables S1A and S1B). The relative abundance of venom proteins was first established for both C. atrox and C. o. helleri by LC–MS/MS analysis. When compared, both venom proteomes had the following components: svMPs (C. atrox 31%, C. o. helleri 24%), svSPs (C. atrox 21%, C. o. helleri 14%), svPLA2s (C. atrox 11%, C. o. helleri 8%), C-type lectins (C. atrox 6%, C. o. helleri 15%), LAAO (C. atrox 6%, C. o. helleri 6%), and disintegrins (C. atrox 1%, C. o. helleri 1%) (Figure 1). As expected, and typical of Crotalus species, the most abundant protein family found in both C. atrox and C. o. helleri crude venoms were svMP, which primarily degrade structural extracellular matrix substrates such as collagen and fibrinogen and svSP, which are responsible for anticoagulant effects [2]. Both of these major venom constituents promote tissue damage and hemorrhaging [30].
To further highlight the complexity of the C. atrox and C. o. helleri anion exchange, DEAE chromatography was utilized to fractionate crude C. atrox and C. o. helleri venoms. Electrophoretic profiles of these crude venom fractions were then developed via non-reduced SDS-PAGE for further characterization (Figure 2). The analysis revealed less complexity within the C. atrox venom than C. o. helleri when the two profiles were compared. The most prominent bands for the C. atrox crude venom gel fell in the range between 15 and 30 kDa, while those for C. o. helleri were observed from a broader range between 6 and 50 kDa (Figure 2). The LD50 for the C. atrox and C. o. helleri in our study was 5 mg/kg (0.95 mg/mL) and 3.3 mg/kg (0.62 mg/mL), respectively.
To address the identification and composition of svEVs using EVtrap and proteomics, the isolation and analysis of snake crude venoms from C. atrox and C. o. helleri was performed following the proteomic workflow outlined in Figure 3; then, further analyzed using high-resolution LC–MS/MS (Figure 4). In our analysis of svEVs (Figure 4 and Supplemental Table S2A,B), there was a significant enrichment in LAAO (C. atrox 17%, C. o. helleri 13%) and ecto-5′-nucleotidase (C. atrox 12%, C. o. helleri 9%). These results were similar to the work by Souza-Imberg et al. (2017), where the use of size exclusion chromatography found the enrichment of LAAO and ecto-5′-nucleotidase (9–12%) [28]. In a snake bite, LAAOs have an apoptotic function and, through complementary mechanisms with the serine proteases, disrupt the envenomated organism’s ability to maintain hemostasis [32,33], suggesting a possible function within the svEVs. In addition, as an oxidoreductase, these enzymes function as hemorrhagic and hemostasis-impairing toxins. It has been reported in vipers, rattlesnakes, and elapids that ecto-5′-nucleotidase aids in immobilizing and killing prey [34], as well as having anticoagulant activities [35]. SVMP- VAP2B was also identified and is well described in C. atrox venom. This family of toxic proteins function by impairing cell adhesion, hemostasis, the and inhibition of platelet aggregation [36,37].
Additionally, present in svEVs was phosphodiesterase, which has been well established in snake venom and whose functions include the induction of hypotension, inhibition of platelet aggregation, edema and paralysis [38]. The dipeptidylpeptidase family of enzymes was also found and has been previously reported in Crotalus venoms [39] as contributing to the activity of snake venom proteases and inactivating immune-modulating repair mechanisms. Interestingly, in svEVs, we found an angiotensin-converting enzyme, which is well-known to cleave bradykinin and promote inflammation [40]. Indeed, the svEVs contained a vesicle and transmembrane proteins which promote endocytosis to membranes in other cells [19,41] and may indirectly contribute to svEV toxicity. For example, in our analysis of svEVs, we found Myosin-Id-like and EH Domain-Containing Protein 4-like protein with a calcium-binding domain, both of which function in membrane mobility and may have an impact on cell communication [42]. We identified Fer-1-like Protein 4, which can have apoptotic characteristics in cancer, suppress epithelial-mesenchymal transition, e-cadherin, vimentin, and fibronectin; all of which participate in cell adhesion, communication, growth, and migration [43]. It is not unreasonable to speculate that svEVs contribute to toxic perturbations of major signaling molecules and pathways. For example, in pit vipers, adenosine can be released by dipeptidyl peptidase, ecto-5′-nucleotidase phosphodiesterase, and can suppress cardiac function [39].
Interestingly, svEVs may have evolved as a mechanism for long-term toxicity to aid in digestion, which can last months, but when humans are envenomated, this presents serious long-term complications such as pain, swelling, chronic kidney disease, and neurological effects [44]. Moreover, the svEVs could be unique to the family and species venom gland they originate from, presenting a diverse set of functions and signaling modes after envenomation. More studies are needed to explore the snake venom proteome and svEVs in parallel. These data shed light on a possible novel mode of snake envenomation. One can postulate that the venom toxicity and lethality aids in prey immobilization and digestion, and svEVs may also be facilitating these processes. These data demonstrate that protein families within the crude venom and snake venom extracellular vesicles differ and could have different effects on an envenomated organism. Moreover, these data are encouraging for further studies on svEVs in order to fully understand their function and role in snake envenomation. The venom toxins and contributing svEV components not only present an interesting hypothesis for toxicity and lethality, but also long-term effects seen in snake envenomation patients.
Currently, the identification, composition, and role of circulating extracellular vesicles in snake bite envenomation victims remain unknown. Circulating extracellular vesicles have been reported in hemostatic disorders and pathophysiological thrombosis from the analysis of several cell-derived extracellular vesicles found in systemic circulation (such as red blood cells, platelets, leukocytes, and endothelial cells) [17]. Snake bite envenomation often results in mild to severe coagulopathy and alterations of physiological hemostasis and thrombosis [45,46], raising the possibility of circulating extracellular vesicles being present in victims. In order to address this question, as well as exploit the cellular features and capability of extracellular vesicles to harbor acute or chronic biomarkers of disease, EVtrap was utilized for the identification and quantification of biomarkers from EVs in plasma samples taken after snake bite envenomation. Exosomes derived from BALB/c mice treated with a sublethal dose of C. atrox and C. o. helleri crude venoms and purified via EVtrap were analyzed in a discovery-based initial screen to explore the venom-reactome following the proteomic workflow depicted in Figure 5.
An analysis of C. atrox-treated mouse plasma EVs revealed 1194 identifiable and quantifiable proteins. A total of 15,722 peptides were detected from EV-enriched mouse plasma. After label-free quantification, 1350 unique peptides with pairs (control and venom) were quantified, representing 1194 proteins (Figure 6A,B) (Supplemental Table S3A). The quantified results of these two experiments were volcano-plotted (Supplemental Table S4A) and a hierarchical cluster (Figure 7) using statistical methods. The resultant plots provided a depiction of the regulation of proteins based on a fold change. The analysis of C. atrox-treated groups found 123 upregulated and 621 downregulated proteins after venom treatment compared with the control (short list in Table 1 and Table 2; full list in Supplemental Table S5A).
The analysis of C. o. helleri-treated mouse plasma EVs revealed 840 identifiable and quantifiable proteins. A total of 15,072 peptides were detected from EV enriched mouse plasma. After label-free quantification, 1160 unique peptides with pairs (control and venom) were quantified, representing 840 proteins (Figure 6C,D). After removing proteins that were only represented in one group, there were 770 proteins remaining, which were, subsequently, used for a bioinformatics analysis (Supplemental Table S3B). There were 137 proteins commonly identified to both venom treatments (Figure 6E).
The quantified results of C.atrox-treated proteomic data were mapped into a volcano plot (Supplemental Table S4A) and hierarchal clustering (Figure 7A–C). The resultant plots provided a depiction of the regulation of proteins based on a fold change. The DAVID and STRING bioinformatics software analysis showed that many of the upregulated response proteins were involved with cytochrome P450, lipid metabolism, and acute phase inflammation (Figure 8A), while downregulated proteins indicated an involvement with mitochondrial electron transport, NADH respiratory chain, the Tricarboxylic acid/citric acid cycle (TCA), and the cortical cytoskeleton (Figure 8B). It has been reported that snake venom can increase the formation of lipid droplets as part of inflammation mediation in snake envenomation [47]. Moreover, envenomation can result in a decrease of 60–70% in NADH and NADPH, suggesting snake venom proteins could directly affect mitochondrial levels and rates of the biosynthesis of NAD+ and NADP+, which may deplete the energy of the cell and, ultimately, lead to cell death [48].
The quantified results of C.o. helleri -treated proteomic data were mapped into a volcano plot (Supplemental Table S4B) and hierarchal clustering (Figure 9A–C). The resultant plots provided a depiction of the regulation of proteins based on a fold change. An analysis of C. o. helleri-treated groups found 306 upregulated and 152 downregulated proteins after venom treatment (short list in Table 3 and Table 4 full list in Supplemental Table S5B). Thus, one could postulate that the genetic composition was similar to a small extent, showing how close the snakes are related and, possibly, why the pathophysiological symptoms may seem similar. The snakes herein induce homeostatic disruption; however, the unique specificity details a novel mode of action. svEV’s may reduce or dampen the signaling to feedback mechanisms or reduce the energy; thus, limiting requirements for sustained cell survival. However, more studies are needed to test these observations.
A bioinformatics software analysis showed that many of the upregulated responses were involved with cytochrome nucleosome assembly, an innate immune response, and heat shock (Figure 10A), while downregulated proteins indicated an involvement in oxidation reduction, protein translation, Endoplasmic Reticulum stress, and Cytochrome P450 (Figure 10B). Crotalus venoms have been well documented to be immunogenic [47], and have been shown to block the redox sites of myoglobin [49]. Further experiments are warranted to confirm these responses. These results may indicate unexplored and underlying cellular mechanisms of cell perturbation caused by svEVs in the pathophysiology of the snakebite. Indeed, snakebites from Crotalus species have similar clinical envenomation profiles such as in C. atrox and C. o. helleri. As expected, our data showed similarities in their EV content and systems level responses to envenomation. However, we identified potential modes of cell perturbation that may be unique to each snake.

3. Conclusions

A continued exploration into snake bite pathophysiology requires the use of multi-omics approaches to characterize the venom as well as the systemic response to venom as it enters the epidermis and blood stream of an organism. Venomics, the transcriptomics and proteomics of venoms, has led to recent advancements in the comprehension of snake venom composition both interspecies and intraspecies. As such, svEVs as a part of the sub-proteome of snake venom may be contributing to the envenomation process. More experiments are needed to test the function of svEVs. While these omics approaches give insights into the venom proteome, no method exists to analyze the reaction to venom after systemic circulation from the blood to explore the potential “venom-reactome”. Plasma is complex and may offer a rich source for analysis of potential snake venom biomarkers. A proteomic analysis of plasma cannot be easily carried out due to the large dynamic range, which spans 1012 of orders magnitude. However, disease biomarkers in endosomes and extracellular vesicles, which are purified from plasma, have shown exciting results. These technologies and analyses can be utilized to monitor the time course venom-reactome to snake envenomation, as well as the administration of antivenom after envenomation, giving a complete global signature of a snake bite and antivenom efficacy.

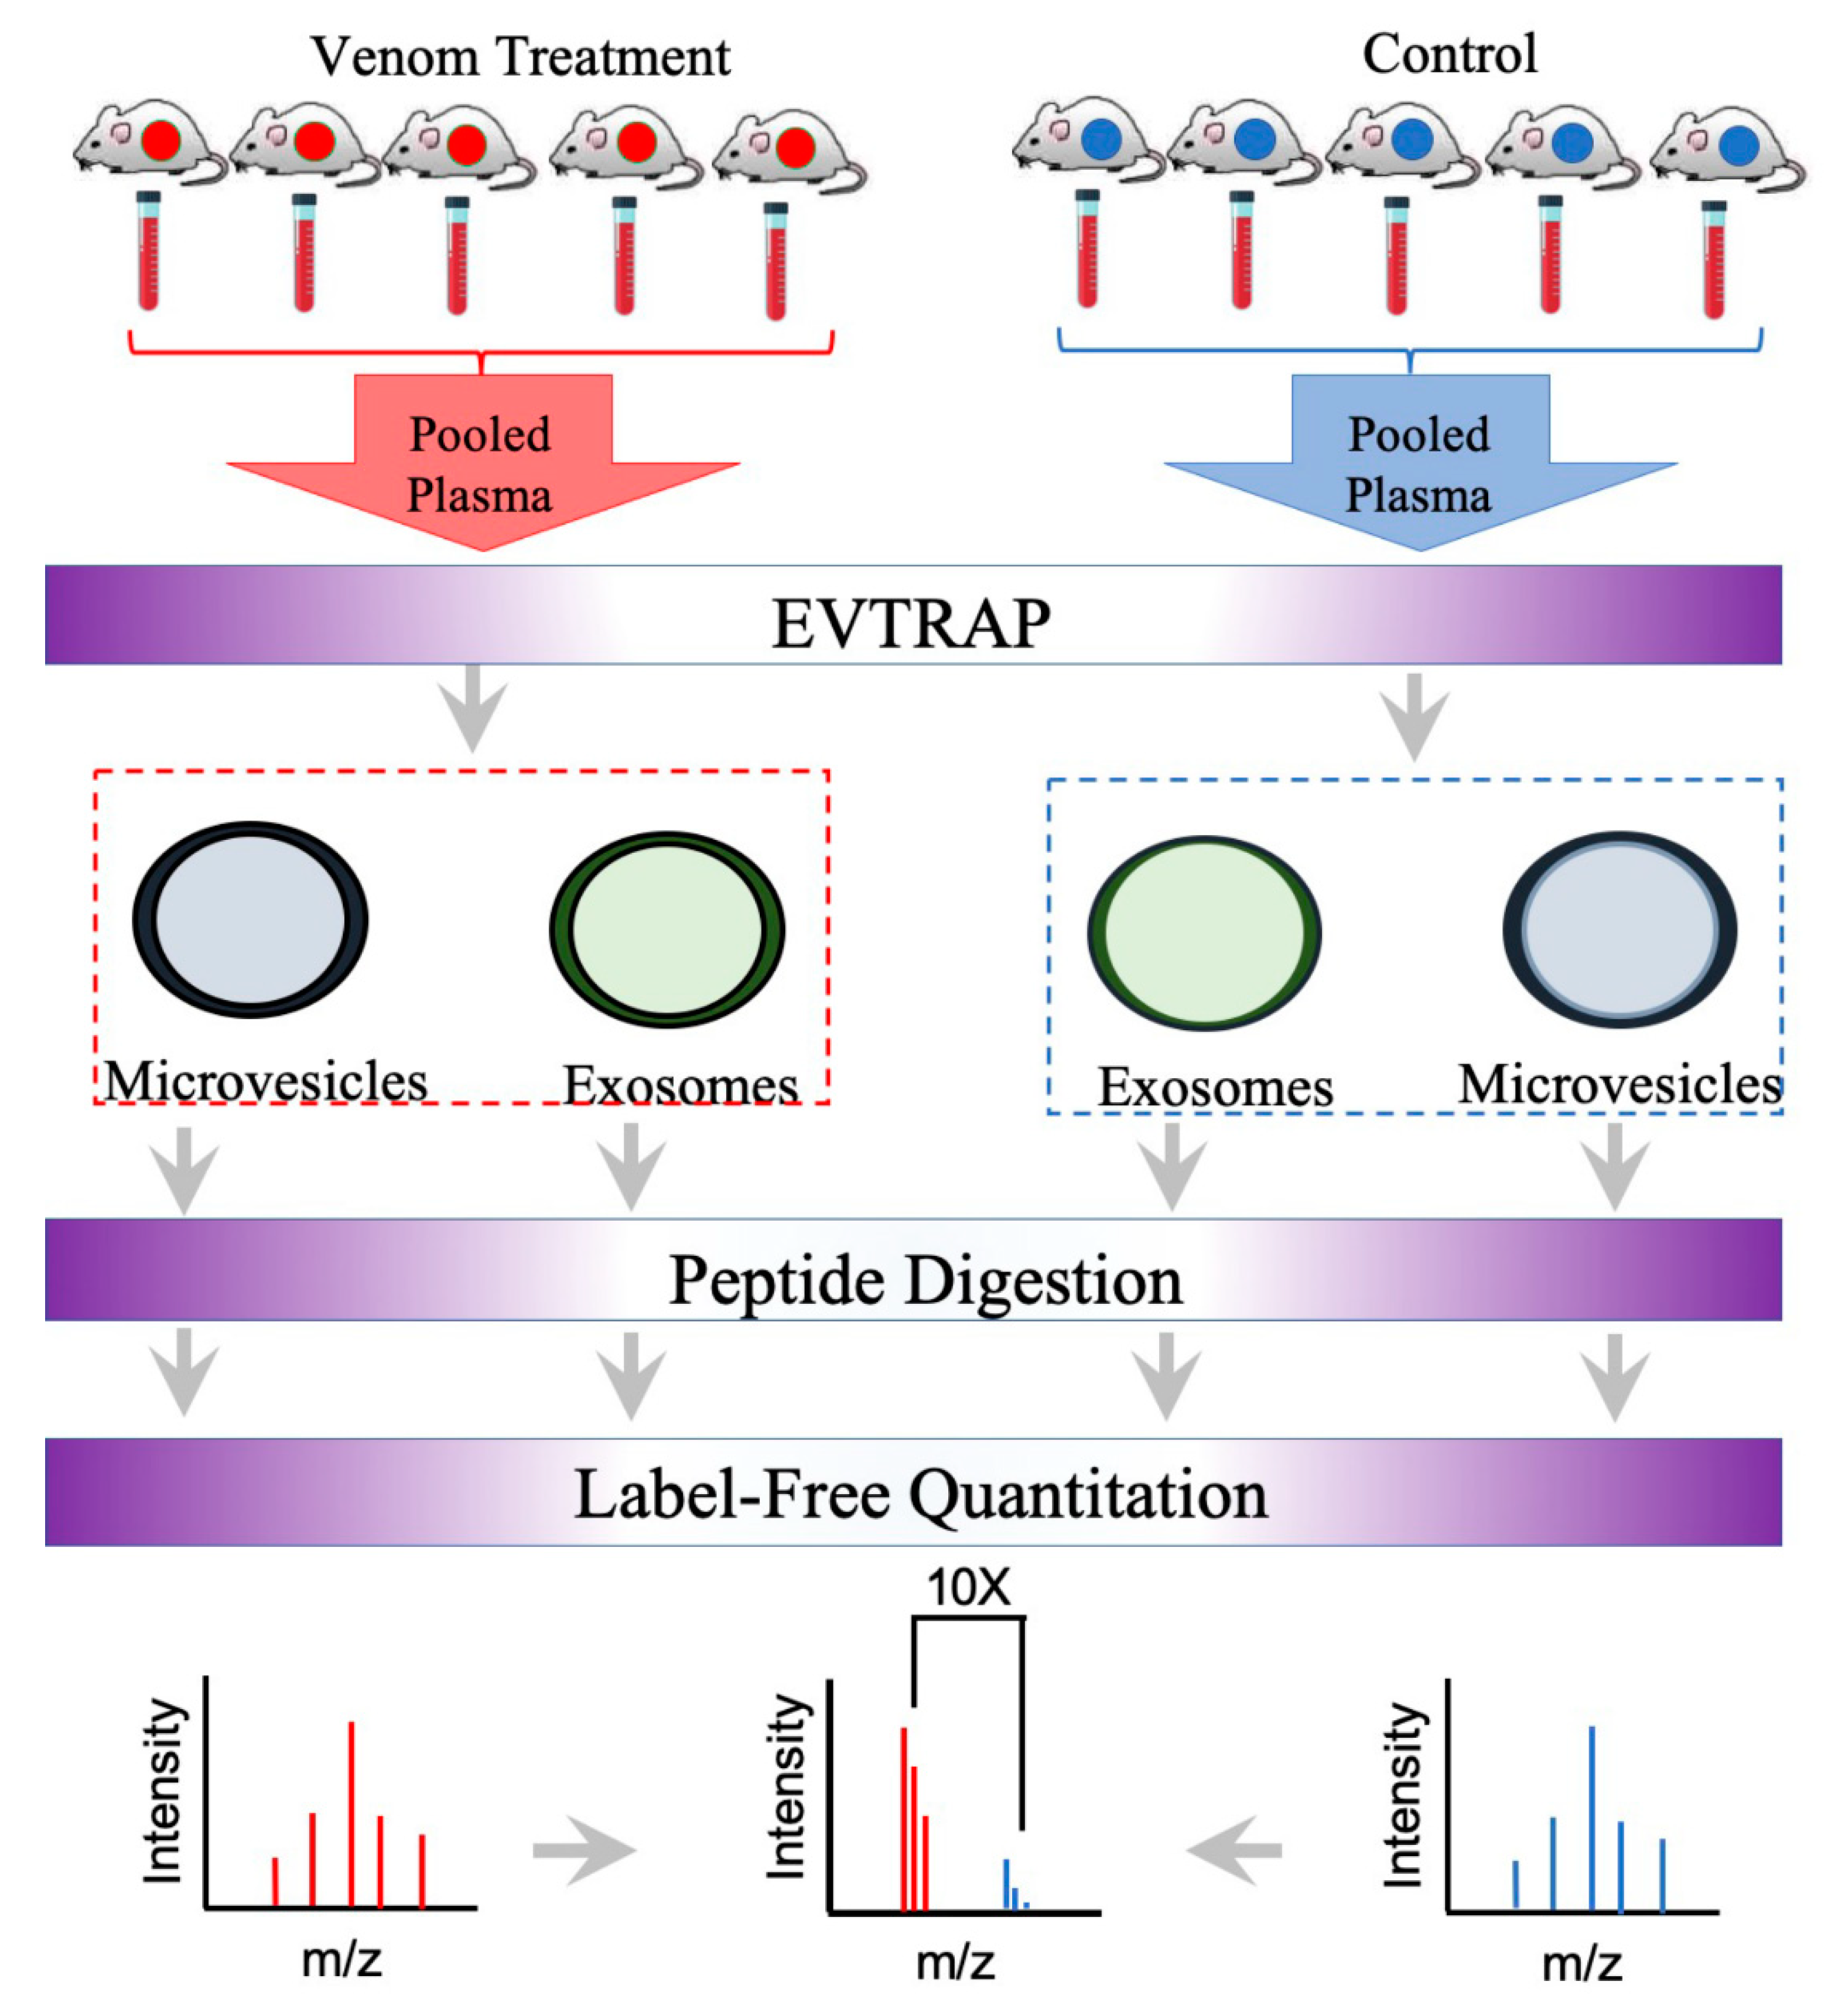
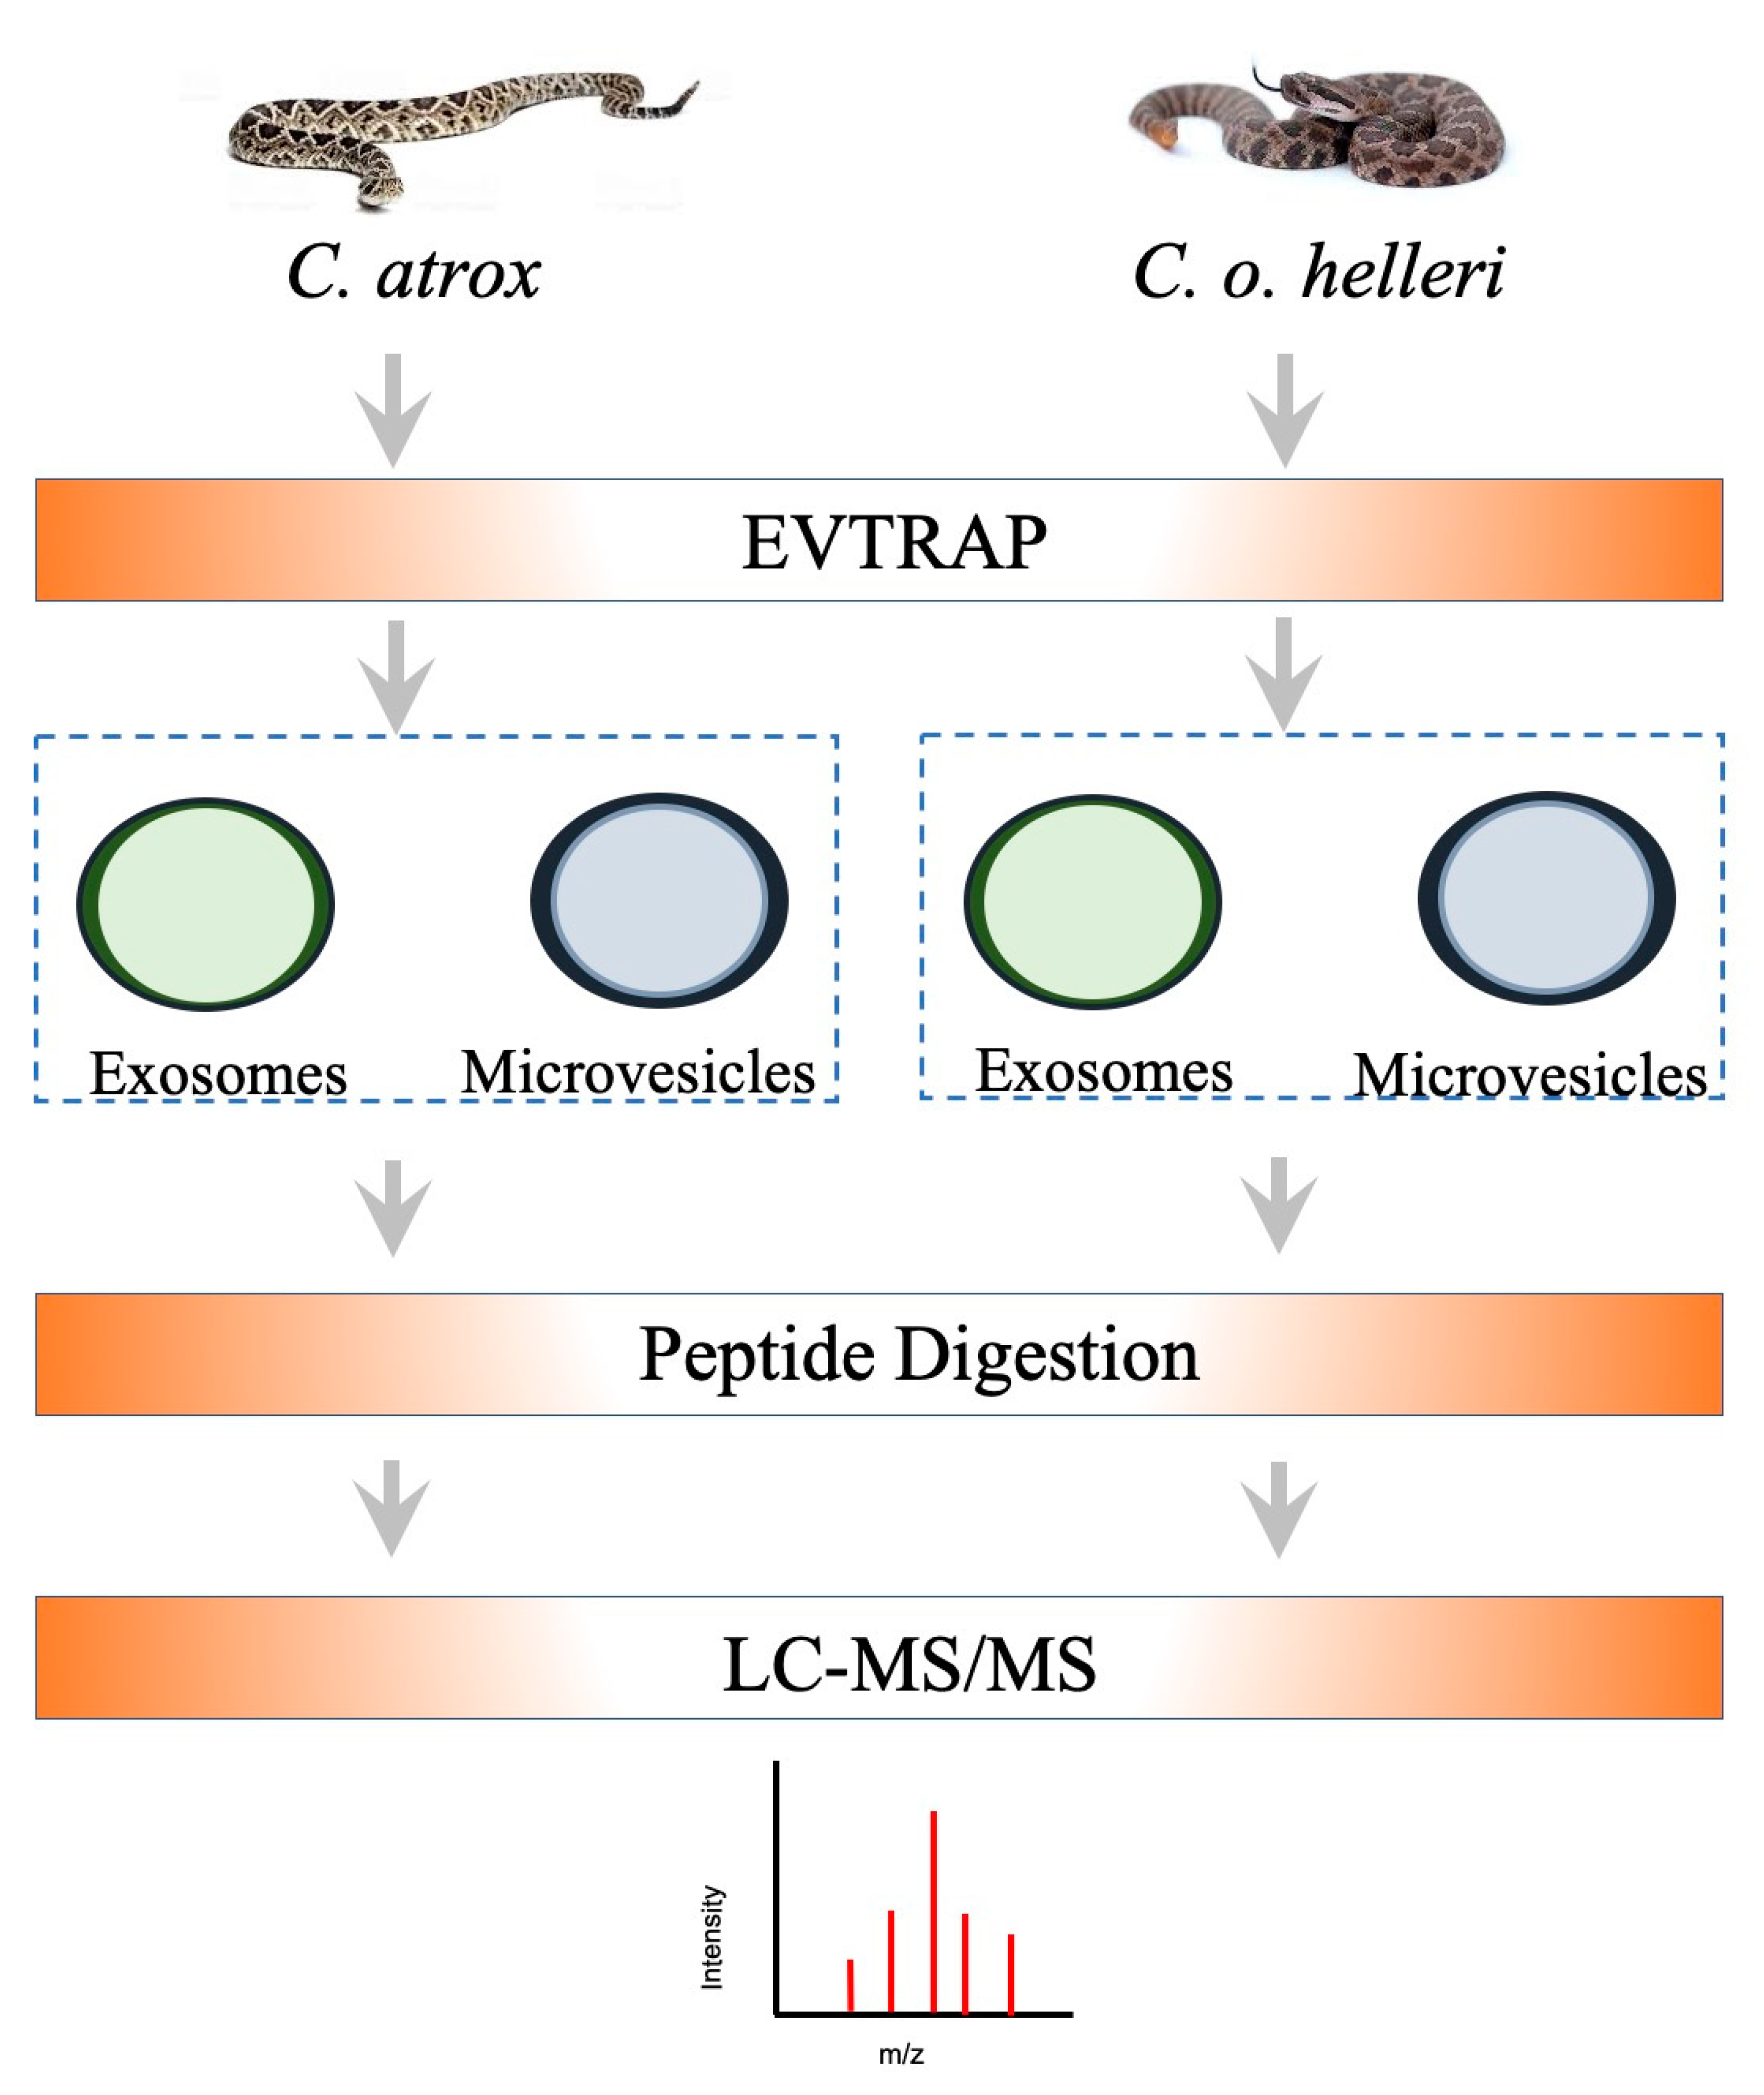
4. Materials and Methods

4.1. Venom Collection

Lyophilized Western Diamondback Rattlesnake (C. atrox) and Southern Pacific Rattlesnake (C. o. helleri) venom was obtained from the National Natural Toxins Research Center serpentarium located at Texas A&M University Kingsville, Kingsville, TX, and were designated as C. atrox vial 53 (AVID# 010-287-337) and C. o. helleri vial 792 (AVID# 046-536-058). Protein concentrations were determined by standard methods at 280 nm using an extinction coefficient of 1.

4.2. Snake Venom and Mouse Plasma Extracellular Vesicles Enrichment

svEVs were isolated using EVtrap [29,30]. Fifty milligrams of lyophilized venom were diluted in 1 mL of PBS and centrifuged at 10,000 rpm for 10 min to remove cellular debris. For non-lyophilized extracted venom, concentrated venom was diluted to 50 mg/mL, and 1 mL was centrifuged as stated above. The cleared venom was collected leaving the pellet behind. Samples were stored at −80 °C until ready to process. Magnetic EVtrap beads were provided by Tymora Analytical as a suspension in water. The EVtrap beads were added to the venom or plasma samples at 1:100 v/v ratio, and the samples incubated by shaking or end-over-end rotation for 1 h, according to manufacturer’s instructions. After supernatant removal using a magnetic separator rack, the beads were washed once with PBS and the EVs eluted by two 10 min incubations with 100 mM of fresh triethylamine (TEA, EMD Millipore, Burlington, MA, USA). The eluted samples were dried completely using a vacuum centrifuge.

4.3. Anion Exchange DEAE Chromatography

Crude venom from C. atrox and C. o. helleri was fractionated by anion exchange DEAE chromatography. A total of 200 µL (8 mg) was fractioned using a WATERS™ Protein-Pak™ DEAE 5PW column (7.5 × 75 mm) (Milford, MA, USA). The column was equilibrated with 0.02 M Tris-HCl buffer, pH 8.0, and the fractions were eluted using 0.02 M Tris-HCl buffer containing 0.5 M NaCl, pH 8.0 over a period of 60 min with a flow rate of 1 mL/min. Eluted proteins were collected in 15 mL tubes, and a Breeze2 computer software system was used to generate the chromatogram. The absorbances of the fractions were read at 280 nm, and the tubes containing the fractions were stored at −20 °C until further use.

4.4. Sodium Dodecyl-Sulfate Polyacrylamide Gel Electrophoresis (SDS-PAGE)

To identify the protein present in each fraction, all the fractions from all of the HPLC separation methods were ran using SDS-PAGE. Venom fractions were subjected to electrophoresis by NuPAGE® Novex Bis-Tris gels (Invitrogen™, Carlsbad, CA, USA) under non-reducing conditions in an XCell SureLock Mini-Cell (Invitrogen Life Technologies, Waltham, MA, USA). A total of 5 µg of venom fractions were separated on a non-reduced NuPAGE® Novex 4–12% (w/v) Bis-Tris gel for 95 min at a 100 V using an XCell SureLock® Mini-Cell system (Invitrogen Life Technologies, USA). Current was moderated using a Bio-Rad PowerPack power supply. Gels were stained with 50 mL SimplyBlue SafeStain (Invitrogen Life Technologies, USA) for 24 h and distained overnight with 18 megaOhm water. SeeBlue Plus2 markers, ranging from 3 to 210 kDa, were used as standards.

4.5. Subcutaneous Mouse Injection

Male BALB/c mice (18–20 g) were subcutaneously injected in groups (n = 5) with 200 µL saline solution (control) or 0.95 mg/mL of C. atrox or 0.62 mg/mL of C. o. helleri crude venom (1 LD50). After 48 h, mice were sacrificed by cervical dislocation and blood was drawn by cardiac puncture and collected using 1% EDTA as anti-coagulant. Samples were processed within 60 min after blood extraction. Plasma was obtained by centrifugation at 4000 rpm for 10 min to remove platelets, debris, and large apoptotic bodies. The cleared plasma was collected leaving the pellet behind. Samples were stored at −80 °C until ready to process.

4.6. Ethical Procedures

All animal handling procedures were approved by the Texas A&M University Kingsville Institute of Animal Care and Use Committee (IACUC approval from hemorrhagic protocol (09-11-2018) #s 2018-11-09-A3).

4.7. Snake Venom and svEV Proteomic Analysis

Snake venom: one micrograms of snake venom proteins were denatured in 0.1% RapiGest (Waters, Milford, MA, USA) and reduced with 5 mM dithiothreitol for 30 min at 50 °C. Proteins were alkylated in 15 mM iodoacetamide for 1 h in the dark at room temperature and then digested with proteomics-grade trypsin at a 1:100 ratio overnight at 37 °C. The pH was adjusted below 3 and the sample was incubated for 45 min at 37 °C. The sample was centrifuged at 16,000× g to remove RapiGest. The supernatant was collected. The peptides were dissolved in 5 μL of 0.25% formic acid (FA) with 3% ACN. svEV: The isolated and dried EV samples were lysed to extract proteins using the phase-transfer surfactant (PTS)-aided procedure [50]. The proteins were reduced and alkylated by incubation in 10 mM trisphosphine (TCEP) and 40 mM chloroacetamide (CAA) for 10 min at 95 °C. The samples were diluted five-fold with 50 mM triethylammonium bicarbonate (TMAB) and digested with Lys-C (Wako, Richmond, VA, USA) at 1:100 (wt/wt) enzyme-to-protein ratio for 3 h at 37 °C. Trypsin was added to a final 1:50 (wt/wt) enzyme-to-protein ratio for overnight digestion at 37 °C. To remove the PTS surfactants from the samples, the samples were acidified with trifluoroacetic acid (TFA) to a final concentration of 1% TFA, and ethyl acetate solution was added at 1:1 ratio. The mixture was vortexed for 2 min and then centrifuged at 16,000× g for 2 min to obtain aqueous and organic phases. The organic phase (top layer) was removed, and the aqueous phase was collected. This step was repeated once more. The samples were dried in a vacuum centrifuge and desalted using Top-Tip C18 tips (GlyGen, Columbia, MD, USA) according to manufacturer’s instructions.

4.8. LC–MS–MS

The samples were dried completely in a vacuum centrifuge and stored at −80 °C. One microgram of each dried peptide sample was dissolved in 10.5 μL of 0.05% trifluoroacetic acid with 3% (vol/vol) acetonitrile. In total, 10 μL of each sample was injected into an Ultimate 3000 nano UHPLC system (Thermo Fisher Scientific, Vantaa, Finland). Peptides were captured on a 2 cm Acclaim PepMap trap column and separated on a heated 50 cm column packed with ReproSil Saphir 1.8 μm C18 beads (Dr. Maisch GmbH, Ammerbuch, Germany). The mobile phase buffer consisted of 0.1% formic acid in ultrapure water (buffer A) with an eluting buffer of 0.1% formic acid in 80% (vol/vol) acetonitrile (buffer B) ran with a linear 60 min gradient of 6–30% buffer B at flow rate of 300 nL/min. The UHPLC was coupled online with a Q Exactive HF-X mass spectrometer (Thermo Fisher Scientific). The mass spectrometer was operated in the data-dependent mode, in which a full-scan MS (from m/z 375 to 1500 with the resolution of 60,000) was followed by MS/MS of the 15 most intense ions (30,000 resolution; normalized collision energy—28%; automatic gain control target (AGC)—2E4: maximum injection time—200 ms; 60 s exclusion).The raw files were searched directly against the Crotalus or Mus musculus available in UniProt with no redundant entries, using Byonic (Protein Metrics) and SEQUEST search engines loaded into Proteome Discoverer 2.3 software (Thermo Fisher Scientific). MS1 precursor mass tolerance was set at 10 ppm and MS2 tolerance was set at 20 ppm. Search criteria included a static carbamidomethylation of cysteines (+57.0214 Da) and variable modifications of oxidation (+15.9949 Da) on methionine residues and acetylation (+42.011 Da) at N-terminus of proteins. Search was performed with full trypsin/P digestion and allowed a maximum of two missed cleavages on the peptides analyzed from the sequence database. The false-discovery rates of proteins and peptides were set at 0.01. All protein and peptide identifications were grouped, and any redundant entries were removed. Only unique peptides and unique master proteins were reported.

4.9. Data Acquisition, Quantification, and Bioinformatics

All data were quantified using the label-free quantitation node of Precursor Ions Quantifier through the Proteome Discoverer v2.3 (Thermo Fisher Scientific, Vantaa, Finland). For the quantification of proteomic data, the intensities of peptides were extracted with initial precursor mass tolerance set at 10 ppm, minimum number of isotope peaks as 2, maximum ΔRT of isotope pattern multiplets—0.2 min—, PSM confidence FDR of 0.01, with hypothesis test of ANOVA, maximum RT shift of 5 min, pairwise ratio-based ratio calculation, and 100 as the maximum allowed fold change. The abundance levels of all peptides and proteins were normalized using the total peptide amount normalization node in the Proteome Discoverer. For calculations of fold change between the groups of proteins, total protein abundance values were added together and the ratios of these sums were used to compare proteins within different samples. To infer biological significance, all ratios showing a 1.5-fold change (ratio ≥ 1.5 or ratio ≤ 0.65) were required. Peptide distributions were analyzed with Excel. Perseus software (Version 1.6.2.1) was used to visualize the data from Excel. In the “Main” box, the abundance ratios, as well as the individual abundances of the venom and the control of the snake venoms, were inserted. In the “Text” box, protein accession and description were inserted. A log2 transformation was performed on the abundance ratio and individual abundances. All of the “NaN” values were removed from the abundance ratio. A minimum of three valid values in total were selected, and the heat map was generated. A one sample t-test was performed between the control and venom sample with a false discovery rate of 1%. The negative log t-test p-value and abundance ratio was used to create the volcano plot. Bioinformatics analysis was performed with DAVID and STRING Analysis tools described [51,52,53].

Supplementary Materials

The following are available online at https://www.mdpi.com/article/10.3390/toxins13090654/s1, Supplemental Data S1: venom composition, Supplemental Data S2: venom EV composition, Supplemental Data S3: heatmap, Supplemental Data S4: plasma EV quantification.

Author Contributions

Conceptualization, J.A.G.; methodology, E.E.S., M.S., E.S., A.I. and J.A.G.; software, J.S.O. and C.S.W.; validation, C.S.W., R.P.P. and A.I.; formal analysis, J.A.G.; investigation, J.A.G., C.S.W. and J.S.O.; resources, J.A.G.; data curation, C.S.W., N.K.W., J.S.O. and M.C.; writing—original draft preparation, C.S.W., J.S.O., M.C., N.K.W., F.A.O. and J.A.G. writing—review and editing, R.P.P., H.M., A.I., M.S. and E.S.; visualization, J.A.G.; supervision, J.A.G.; project administration, J.A.G.; funding acquisition, M.S., E.E.S. and J.A.G. All authors have read and agreed to the published version of the manuscript.

Funding

This research was funded by a grant from the NIH/ORIP, Viper Resource Grant #P40OD01960-18, Elda E. Sánchez, NIH/SCGM136606-02, Jacob Galan and NIH/R15HL137134-02, Dr. Montamas Suntravat, and the Robert A. Welch Foundation, grant # AC-0006 (TAMUK—Department of Chemistry).

Institutional Review Board Statement

The study was conducted according to the guidelines of the Declaration of Helsinki and approved by the Institutional Review Board (or Ethics Committee) of Texas A&M University Kingsville (IACUC approval (09-11-2018) #s 2018-11-09-A3).

Informed Consent Statement

Not applicable.

Data Availability Statement

Not applicable.

Acknowledgments

We also thank Mark Hockmuller and Juan Salinas, the curator, and animal room technician of the NNTRC and Nora Diaz De Leon for her administrative assistance.

Conflicts of Interest

The authors declare no conflict of interest.

References

  1. Perez, J.C.; Sanchez, E.E. Natural protease inhibitors to hemorrhagins in snake venoms and their potential use in medicine. Toxicon 1999, 37, 703–728. [Google Scholar] [CrossRef]
  2. Tasoulis, T.; Isbister, G.K. A Review and database of snake venom proteomes. Toxins 2017, 9, 290. [Google Scholar] [CrossRef] [PubMed] [Green Version]
  3. Williams, D.J.; Faiz, M.A.; Abela-Ridder, B.; Ainsworth, S.; Bulfone, T.C.; Nickerson, A.D.; Habib, A.G.; Junghanss, T.; Fan, H.W.; Turner, M.; et al. Strategy for a globally coordinated response to a priority neglected tropical disease: Snakebite envenoming. PLoS Negl. Trop. Dis. 2019, 13, e0007059. [Google Scholar] [CrossRef] [PubMed] [Green Version]
  4. Gutierrez, J.M. Global availability of antivenoms: The relevance of public manufacturing laboratories. Toxins 2018, 11, 5. [Google Scholar] [CrossRef] [PubMed] [Green Version]
  5. Seifert, S.A.; Boyer, L.V.; Benson, B.E.; Rogers, J.J. AAPCC database characterization of native U.S. venomous snake exposures, 2001–2005. Clin. Toxicol (Phila) 2009, 47, 327–335. [Google Scholar] [CrossRef]
  6. Ernst, C.H.; Ernst, E.M. Venomous Reptiles of the United States, Canada, and Northern Mexico; John Hopkins University Press: Baltimore, MD, USA, 2012. [Google Scholar]
  7. Klauber, L.M. Their Habits, Life Histories, and Influence on Mankind; University of California Press: Berkeley, CA, USA, 1956. [Google Scholar]
  8. Campbell, J.; Lamar, W.W. Venomous Reptiles of the Western Hemisphere; Cornell University Press: Ithaca, NY, USA, 2004. [Google Scholar]
  9. Lavonas, E.J.; Khatri, V.; Daugherty, C.; Bucher-Bartelson, B.; King, T.; Dart, R.C. Medically significant late bleeding after treated crotaline envenomation: A systematic review. Ann. Emerg. Med. 2014, 63, 71–78. [Google Scholar] [CrossRef]
  10. Boyer, L.V.; Seifert, S.A.; Clark, R.F.; McNally, J.T.; Williams, S.R.; Nordt, S.P.; Walter, F.G.; Dart, R.C. Recurrent and persistent coagulopathy following pit viper envenomation. Arch. Intern. Med. 1999, 159, 706–710. [Google Scholar] [CrossRef] [Green Version]
  11. Dart, R.C.; McNally, J. Efficacy, safety, and use of snake antivenoms in the United States. Ann. Emerg. Med. 2001, 37, 181–188. [Google Scholar] [CrossRef]
  12. Calvete, J.J.; Fasoli, E.; Sanz, L.; Boschetti, E.; Righetti, P.G. Exploring the venom proteome of the western diamondback rattlesnake, Crotalus atrox, via snake venomics and combinatorial peptide ligand library approaches. J. Proteome Res. 2009, 8, 3055–3067. [Google Scholar] [CrossRef] [Green Version]
  13. Calvete, J.J.; Juarez, P.; Sanz, L. Snake venomics. Strategy and applications. J. Mass Spectrom. 2007, 42, 1405–1414. [Google Scholar] [CrossRef]
  14. Moura-da-Silva, A.M.; Almeida, M.T.; Portes-Junior, J.A.; Nicolau, C.A.; Gomes-Neto, F.; Valente, R.H. Processing of Snake Venom Metalloproteinases: Generation of Toxin Diversity and Enzyme Inactivation. Toxins 2016, 8, 183. [Google Scholar] [CrossRef]
  15. Keller, S.; Sanderson, M.P.; Stoeck, A.; Altevogt, P. Exosomes: From biogenesis and secretion to biological function. Immunol. Lett. 2006, 107, 102–108. [Google Scholar] [CrossRef] [PubMed]
  16. Johnstone, R.M. Exosomes biological significance: A concise review. Blood Cells Mol. Dis. 2006, 36, 315–321. [Google Scholar] [CrossRef]
  17. Yanez-Mo, M.; Siljander, P.R.; Andreu, Z.; Zavec, A.B.; Borras, F.E.; Buzas, E.I.; Buzas, K.; Casal, E.; Cappello, F.; Carvalho, J.; et al. Biological properties of extracellular vesicles and their physiological functions. J. Extracell Vesicles 2015, 4, 27066. [Google Scholar] [CrossRef] [PubMed] [Green Version]
  18. Baranyai, T.; Herczeg, K.; Onodi, Z.; Voszka, I.; Modos, K.; Marton, N.; Nagy, G.; Mager, I.; Wood, M.J.; El Andaloussi, S.; et al. Isolation of exosomes from blood plasma: Qualitative and quantitative comparison of ultracentrifugation and size exclusion chromatography methods. PLoS ONE 2015, 10, e0145686. [Google Scholar] [CrossRef] [PubMed] [Green Version]
  19. Thery, C.; Zitvogel, L.; Amigorena, S. Exosomes: Composition, biogenesis and function. Nat. Rev. Immunol. 2002, 2, 569–579. [Google Scholar] [CrossRef]
  20. Peinado, H.; Aleckovic, M.; Lavotshkin, S.; Matei, I.; Costa-Silva, B.; Moreno-Bueno, G.; Hergueta-Redondo, M.; Williams, C.; Garcia-Santos, G.; Ghajar, C.; et al. Melanoma exosomes educate bone marrow progenitor cells toward a pro-metastatic phenotype through MET. Nat. Med. 2012, 18, 883–891. [Google Scholar] [CrossRef] [PubMed] [Green Version]
  21. Ciregia, F.; Urbani, A.; Palmisano, G. Extracellular vesicles in brain tumors and neurodegenerative diseases. Front. Mol. Neurosci. 2017, 10, 276. [Google Scholar] [CrossRef] [Green Version]
  22. Ibrahim, A.; Marban, E. Exosomes: Fundamental biology and roles in cardiovascular physiology. Annu. Rev. Physiol. 2016, 78, 67–83. [Google Scholar] [CrossRef] [Green Version]
  23. Raposo, G.; Nijman, H.W.; Stoorvogel, W.; Liejendekker, R.; Harding, C.V.; Melief, C.J.; Geuze, H.J. B lymphocytes secrete antigen-presenting vesicles. J. Exp. Med. 1996, 183, 1161–1172. [Google Scholar] [CrossRef]
  24. Warshawsky, H.; Haddad, A.; Goncalves, R.P.; Valeri, V.; De Lucca, F.L. Fine structure of the venom gland epithelium of the South American rattlesnake and radioautographic studies of protein formation by the secretory cells. Am. J. Anat. 1973, 138, 79–119. [Google Scholar] [CrossRef] [PubMed]
  25. Ogawa, Y.; Murayama, N.; Fujita, Y.; Yanoshita, R. Characterization and cDNA cloning of aminopeptidase A from the venom of Gloydius blomhoffi brevicaudus. Toxicon 2007, 49, 1172–1181. [Google Scholar] [CrossRef] [PubMed]
  26. Carneiro, S.M.; Fernandes, W.; Sant’Anna, S.S.; Yamanouye, N. Microvesicles in the venom of Crotalus durissus terrificus (Serpentes, Viperidae). Toxicon 2007, 49, 106–110. [Google Scholar] [CrossRef]
  27. Souza-Imberg, A.; Carneiro, S.M.; Giannotti, K.C.; Sant’Anna, S.S.; Yamanouye, N. Origin and characterization of small membranous vesicles present in the venom of Crotalus durissus terrificus. Toxicon 2017, 136, 27–33. [Google Scholar] [CrossRef]
  28. Carregari, V.C.; Rosa-Fernandes, L.; Baldasso, P.; Bydlowski, S.P.; Marangoni, S.; Larsen, M.R.; Palmisano, G. Snake Venom Extracellular vesicles (SVEVs) reveal wide molecular and functional proteome diversity. Sci Rep. 2018, 8, 12067. [Google Scholar] [CrossRef] [PubMed]
  29. Wu, X.; Li, L.; Iliuk, A.; Tao, W.A. Highly efficient phosphoproteome capture and analysis from urinary extracellular vesicles. J. Proteome Res. 2018, 17, 3308–3316. [Google Scholar] [CrossRef] [PubMed]
  30. Iliuk, A.; Wu, X.; Li, L.; Sun, J.; Hadisurya, M.; Boris, R.S.; Tao, W.A. Plasma-derived extracellular vesicle phosphoproteomics through chemical affinity purification. J. Proteome Res. 2020, 19, 2563–2574. [Google Scholar] [CrossRef] [PubMed]
  31. Calvete, J.J.; Sanz, L.; Angulo, Y.; Lomonte, B.; Gutierrez, J.M. Venoms, venomics, antivenomics. FEBS Lett. 2009, 583, 1736–1743. [Google Scholar] [CrossRef] [Green Version]
  32. Ayres, L.R.; Recio Ados, R.; Burin, S.M.; Pereira, J.C.; Martins, A.C.; Sampaio, S.V.; de Castro, F.A.; Pereira-Crott, L.S. Bothrops snake venoms and their isolated toxins, an L-amino acid oxidase and a serine protease, modulate human complement system pathways. J. Venom. Anim. Toxins Incl. Trop. Dis. 2015, 21, 29. [Google Scholar] [CrossRef] [PubMed] [Green Version]
  33. Burin, S.M.; Menaldo, D.L.; Sampaio, S.V.; Frantz, F.G.; Castro, F.A. An overview of the immune modulating effects of enzymatic toxins from snake venoms. Int. J. Biol. Macromol. 2018, 109, 664–671. [Google Scholar] [CrossRef]
  34. Sales, P.B.; Santoro, M.L. Nucleotidase and DNase activities in Brazilian snake venoms. Comp. Biochem. Physiol. C Toxicol. Pharmacol. 2008, 147, 85–95. [Google Scholar] [CrossRef] [PubMed]
  35. Arun, R.; Arafat, A.S.; D’Souza, C.J.; Sivaramakrishnan, V.; Dhananjaya, B.L. Vanillin analog–vanillyl mandelic acid, a novel specific inhibitor of snake venom 5′-nucleotidase. Arch. Pharm. (Weinheim) 2014, 347, 616–623. [Google Scholar] [CrossRef] [PubMed]
  36. Igarashi, T.; Araki, S.; Mori, H.; Takeda, S. Crystal structures of catrocollastatin/VAP2B reveal a dynamic, modular architecture of ADAM/adamalysin/reprolysin family proteins. FEBS Lett. 2007, 581, 2416–2422. [Google Scholar] [CrossRef] [PubMed] [Green Version]
  37. Williams, H.F.; Mellows, B.A.; Mitchell, R.; Sfyri, P.; Layfield, H.J.; Salamah, M.; Vaiyapuri, R.; Collins-Hooper, H.; Bicknell, A.B.; Matsakas, A.; et al. Mechanisms underpinning the permanent muscle damage induced by snake venom metalloprotease. PLoS Negl. Trop. Dis. 2019, 13, e0007041. [Google Scholar] [CrossRef] [Green Version]
  38. Ullah, A.; Ullah, K.; Ali, H.; Betzel, C.; Ur Rehman, S. The sequence and a three-dimensional structural analysis reveal substrate specificity among snake venom phosphodiesterases. Toxins 2019, 11, 625. [Google Scholar] [CrossRef] [PubMed] [Green Version]
  39. Aird, S.D. Snake venom dipeptidyl peptidase IV: Taxonomic distribution and quantitative variation. Comp. Biochem. Physiol. B Biochem. Mol. Biol. 2008, 150, 222–228. [Google Scholar] [CrossRef]
  40. Peterfi, O.; Boda, F.; Szabo, Z.; Ferencz, E.; Baba, L. Hypotensive Snake Venom Components–A Mini-Review. Molecules 2019, 24, 2778. [Google Scholar] [CrossRef] [Green Version]
  41. Dreyer, F.; Baur, A. Biogenesis and Functions of Exosomes and Extracellular Vesicles. Methods Mol. Biol. 2016, 1448, 201–216. [Google Scholar] [CrossRef]
  42. Tang, H.Y.; Cai, M. The EH-domain-containing protein Pan1 is required for normal organization of the actin cytoskeleton in Saccharomyces cerevisiae. Mol. Cell Biol. 1996, 16, 4897–4914. [Google Scholar] [CrossRef] [Green Version]
  43. Ma, L.; Zhang, L.; Guo, A.; Liu, L.C.; Yu, F.; Diao, N.; Xu, C.; Wang, D. Overexpression of FER1L4 promotes the apoptosis and suppresses epithelial-mesenchymal transition and stemness markers via activating PI3K/AKT signaling pathway in osteosarcoma cells. Pathol. Res. Pract. 2019, 215, 152412. [Google Scholar] [CrossRef] [PubMed]
  44. Waiddyanatha, S.; Silva, A.; Siribaddana, S.; Isbister, G.K. Long-term Effects of Snake Envenoming. Toxins 2019, 11, 193. [Google Scholar] [CrossRef] [Green Version]
  45. Enjeti, A.K.; Lincz, L.F.; Seldon, M.; Isbister, G.K. Circulating microvesicles in snakebite patients with microangiopathy. Res. Pract. Thromb. Haemost. 2019, 3, 121–125. [Google Scholar] [CrossRef]
  46. Matsui, T.; Fujimura, Y.; Titani, K. Snake venom proteases affecting hemostasis and thrombosis. Biochim. Biophys. Acta 2000, 1477, 146–156. [Google Scholar] [CrossRef]
  47. de Carvalho, A.E.Z.; Giannotti, K.; Junior, E.L.; Matsubara, M.; Santos, M.C.D.; Fortes-Dias, C.L.; Teixeira, C. Crotalus durissus ruruima Snake Venom and a Phospholipase A2 Isolated from This Venom Elicit Macrophages to Form Lipid Droplets and Synthesize Inflammatory Lipid Mediators. J. Immunol. Res. 2019, 2019, 2745286. [Google Scholar] [CrossRef] [Green Version]
  48. Ghneim, H.K.; Al-Sheikh, Y.A.; Aboul-Soud, M.A. The effect of Walterinnesia aegyptia venom proteins on TCA cycle activity and mitochondrial NAD(+)-redox state in cultured human fibroblasts. Biomed. Res. Int. 2015, 2015, 738147. [Google Scholar] [CrossRef] [PubMed] [Green Version]
  49. de Souza, T.P.; Abreu, D.S.; Carepo, M.S.P.; Silva, M.A.S.; Zampieri, D.; Eberlin, M.N.; Paulo, T.F.; Sousa, E.H.S.; Longhinotti, E.; Diogenes, I.C.N. Effect of Crotalus basiliscus snake venom on the redox reaction of myoglobin. J. Biol. Inorg. Chem. 2019, 24, 171–178. [Google Scholar] [CrossRef]
  50. Masuda, T.; Tomita, M.; Ishihama, Y. Phase transfer surfactant-aided trypsin digestion for membrane proteome analysis. J. Proteome Res. 2008, 7, 731–740. [Google Scholar] [CrossRef] [PubMed]
  51. Szklarczyk, D.; Gable, A.L.; Nastou, K.C.; Lyon, D.; Kirsch, R.; Pyysalo, S.; Doncheva, N.T.; Legeay, M.; Fang, T.; Bork, P.; et al. The STRING database in 2021: Customizable protein-protein networks, and functional characterization of user-uploaded gene/measurement sets. Nucleic Acids Res. 2021, 49, D605–D612. [Google Scholar] [CrossRef]
  52. Huang, D.W.; Sherman, B.T.; Lempicki, R.A. Bioinformatics enrichment tools: Paths toward the comprehensive functional analysis of large gene lists. Nucleic Acids Res. 2009, 37, 1–13. [Google Scholar] [CrossRef] [PubMed] [Green Version]
  53. Sherman, B.T.; Lempicki, R.A. Systematic and integrative analysis of large gene lists using DAVID bioinformatics resources. Nat. Protoc. 2009, 4, 44–57. [Google Scholar] [CrossRef]
Figure 1. Proteomic analysis of the relative abundance of venom proteins in (A) C. atrox and (B) C. o. helleri venoms.
Toxins 13 00654 g001
Figure 2. SDS-PAGE analysis of venom from Anion Exchange DEAE chromatography. A total of 5 μg of samples were run on a 4–12% Bis-Tris (MES) Gel (Novex®) at 100 V for 95 min. (A) C. atrox: Lane 1: SeeBlue® Plus 2 prestained standard (1×); Lane 2: F1; Lane 3: F2; Lane 4: F3; Lane 5: F4; Lane 6: F5; Lane 7: F6; Lane 8: F7; Lane 9: F8; Lane 10: F9; Lane 11: F10; Lane 12: F13; Lane 13: F14. (B) C. o. helleri: Lane 1: SeeBlue® Plus 2 pre-stained standard (1×); Lane 2: F1; Lane 3: F2; Lane 4: F3; Lane 5: F4; Lane 6: F6; Lane 7: F7; Lane 8: F8; Lane 9: F9; Lane 10: F10; Lane 11: F11; Lane 12: F12; Lane 13: F13; Lane 14: F14; Lane 15: F15; Lane 16: F16.
Toxins 13 00654 g002
Figure 3. The proteomics workflow for svEVs isolation and analysis of venom from C. atrox and C. o. helleri. EVs, including microvesicles and exosomes, were isolated using EVtrap, followed by protein extraction, digestion, and enrichment for LC–MS analyses.
Toxins 13 00654 g003
Figure 4. The proteomic analysis and the relative abundance of svEVs isolated from (A) C. atrox and (B) C. o. helleri venoms.
Toxins 13 00654 g004
Figure 5. The proteomics workflow for plasma Evs from mice injected with venom from C. o. helleri and C. atrox. Evs were isolated using Evtrap, followed by protein extraction, digestion, and enrichment for LC–MS analyses.
Toxins 13 00654 g005
Figure 6. Schematic representation of the proteomic data form all experimental conditions. (A) Total proteins and peptides from C. atrox proteomic dataset. (B) Changes identified from label-free quantification in C. atrox dataset. (C) Total proteins and peptides from C. o. helleri proteomic dataset. (D) Changes identified from label-free quantification in C. o. helleri dataset. (E) The overlap of protein found between both snake envenomation C. atrox and C. o. helleri datasets.
Toxins 13 00654 g006
Figure 7. (A) The heat map of normalized abundances for differentially expressed proteins from plasma EVs between control sample of mice injected with PBS and mice injected with C. atrox venom. (B) Volcano plots showing the statistically differentially expressed proteins (t-test; FDR 0.05). The red represents a fold change greater than 0.1 and is considered upregulated, the blue represents a fold change of less than −0.5 and is considered downregulated, and the grey is unregulated proteins. (C) Gene ontology term enrichment of affected processes; the chart in red represents the most affected upregulated processes, and the bottom chart in blue represents the most affected downregulated processes.
Toxins 13 00654 g007
Figure 8. Analysis of protein–protein interactions (PPIs) against the STRING database for (A) upregulated proteins and (B) downregulated proteins from plasma EVs of mice injected with C. atrox venom.
Toxins 13 00654 g008
Figure 9. (A) The heat map of normalized abundances for differentially expressed proteins from plasma EVs between control sample of mice injected with PBS and mice injected with C. o. helleri venom. (B) Volcano plots showing the statistically differentially expressed proteins (t-test; FDR 0.05). The green represents a fold change greater than 0.1 and is considered upregulated, the yellow represents a fold change of less than −0.5 and is considered downregulated, and the grey is unregulated proteins. (C) Gene ontology term enrichment of affected processes; the chart in green represents the most affected upregulated processes, and the bottom chart in yellow represents the most affected downregulated processes.
Toxins 13 00654 g009
Figure 10. Analysis of protein–protein interactions (PPIs) against the STRING database for (A) upregulated proteins and (B) downregulated proteins plasma EVs of mice injected with C. o. helleri venom.
Toxins 13 00654 g010
Table 1. Up-regulation of potential biomarkers from mouse plasma after C. atrox envenomation.
Accession No.ProteinFold Change
Q05421Cytochrome P450 2E1>100
O88451Retinol dehydrogenase 7>100
Q4VAA2Protein CDV3>100
Q9CQW3Vitamin K-dependent protein Z>100
Q61316Heat shock 70 kDa protein 4>100
Q99KC8von Willebrand factor A domain-containing protein 5A>100
P50172Corticosteroid 11-beta-dehydrogenase isozyme 1>100
O88587Catechol O-methyltransferase>100
Q64152Transcription factor BTF3>100
A0A0R4IZY2Cytochrome P450 2D26>100
Q20BD0Heterogeneous nuclear ribonucleoprotein A/B>100
Q9R0H2Endomucin>100
P06880Somatotropin>100
P97429Annexin A4>100
P56654Cytochrome P450 2C37>100
P70296Phosphatidylethanolamine-binding protein 1>100
P56656Cytochrome P450 2C39>100
Q8K0C5Zymogen granule membrane protein 16>100
H3BKH6S-formylglutathione hydrolase>100
Table 2. Down-regulation of potential biomarkers from mouse plasma after C. atrox envenomation.
Accession No.ProteinFold Change
Q9QYG0Protein NDRG2>100
B7ZW98Ank1 protein>100
Q9Z239Phospholemman>100
Q8BYH8Chromodomain-helicase-DNA-binding protein 9>100
P22437Prostaglandin G/H synthase 1>100
Q9CZE3Ras-related protein Rab-32>100
Q8BP47Asparagine--tRNA ligase, cytoplasmic>100
A0A0A6YVW3Protein Ighv1-23 (Fragment)>100
Q80XI4Phosphatidylinositol 5-phosphate 4-kinase type-2 beta>100
Q91YE6Importin-9>100
D3YZZ5Protein Tmed7>100
Q9CR86Calcium-regulated heat stable protein 1>100
O70435Proteasome subunit alpha type-3>100
P61953Guanine nucleotide-binding protein G(I)/G(S)/G(O) subunit gamma-11>100
P01748Ig heavy chain V region 23>100
Q9Z1P6NADH dehydrogenase (ubiquinone) 1 alpha subcomplex subunit 7>100
Q3TVI8Pre-B-cell leukemia transcription factor-interacting protein 1>100
P56393Cytochrome c oxidase subunit 7B, mitochondrial>100
D3Z2F8Actin-related protein 2/3 complex subunit 3>100
O08795Glucosidase 2 subunit beta>100
A6PWS5Gelsolin (Fragment)>100
P6233426S protease regulatory subunit 10B>100
P55821Stathmin-2>100
Table 3. Up-regulation of potential biomarkers from mouse plasma after C. o. helleri envenomation.
Accession No.ProteinFold Change
A8DUK4Beta-globin>100
A0A0R4J0I9Low-density lipoprotein receptor-related protein 1>100
P01644Ig kappa chain V–V region>100
G3UXX3Sepiapterin reductase>100
A0A1W2P7F1Complement component 1, s subcomponent 2>100
B2RT14UDP-glucuronosyltransferase>100
Q01279Epidermal growth factor receptor>100
Q8R0Y6Cytosolic 10-formyltetrahydrofolate dehydrogenase>100
P55258Ras-related protein Rab-8A>100
Q9D1D4Transmembrane emp24 domain-containing protein 10>100
Q9QXF8Glycine N-methyltransferase>100
Q3TNA1Xylulose kinase>100
Q91YI0Argininosuccinate lyase>100
Q9R257Heme-binding protein 1>100
D3YYS6Monoglyceride lipase>100
P47738Aldehyde dehydrogenase, mitochondrial>100
Q91X52L-xylulose reductase>100
A0A0G2JDE1Immunoglobulin-heavy variable V8-12 (Fragment)>100
A0A1L1SSA8Transmembrane protein 205 (Fragment)>100
Table 4. Down-regulation of potential biomarkers from mouse plasma after C. o. helleri envenomation.
Accession No.ProteinFold Change
Q64514Tripeptidyl-peptidase 2>100
A0A140LHR4Serpin H1 (Fragment)>100
Q1XH17Tripartite motif-containing protein 72>100
P11404Fatty acid-binding protein, heart>100
Q8K274Ketosamine-3-kinase>100
E9Q4M2Hormone-sensitive lipase>100
Q9JHK5Pleckstrin>100
H3BKL6Melanoma inhibitory activity protein 2>100
Q64314Hematopoietic progenitor cell antigen CD34>100
Q920L1Acyl-CoA (8-3)-desaturase>100
Q9CVB6Actin-related protein 2/3 complex subunit 2>100
P08207Protein S100-A10>100
Q3B7Z2Oxysterol-binding protein 1>100
Q99MA9Homeobox protein Nkx-6.1>100
Q7TMY4THO complex subunit 7 homolog>100
F7BJH9Predicted gene 21970 (Fragment)>100
Publisher’s Note: MDPI stays neutral with regard to jurisdictional claims in published maps and institutional affiliations.

