Article

Identification of Two Novel Peanut Genotypes Resistant to Aflatoxin Production and Their SNP Markers Associated with Resistance

1
Key Laboratory of Biology and Genetic Improvement of Oil Crops, Ministry of Agriculture, Oil Crop Research Institute (OCRI) of Chinese Academy of Agricultural Sciences (CAAS), Wuhan 430062, China
2
International Crops Research Institute of the Semi-Arid Tropics (ICRISAT), Hyderabad 502324, India
*
Author to whom correspondence should be addressed.
Toxins 2020, 12(3), 156; https://doi.org/10.3390/toxins12030156
Submission received: 12 February 2020 / Revised: 20 February 2020 / Accepted: 28 February 2020 / Published: 1 March 2020
(This article belongs to the Special Issue Novel Strategy to Prevent Post-Harvest Mycotoxin Contamination)

Abstract

:
Aflatoxin B1 (AFB1) and aflatoxin B2 (AFB2) are the most common aflatoxins produced by Aspergillus flavus in peanuts, with high carcinogenicity and teratogenicity. Identification of DNA markers associated with resistance to aflatoxin production is likely to offer breeders efficient tools to develop resistant cultivars through molecular breeding. In this study, seeds of 99 accessions of a Chinese peanut mini-mini core collection were investigated for their reaction to aflatoxin production by a laboratory kernel inoculation assay. Two resistant accessions (Zh.h0551 and Zh.h2150) were identified, with their aflatoxin content being 8.11%–18.90% of the susceptible control. The 99 peanut accessions were also genotyped by restriction site-associated DNA sequencing (RAD-Seq) for a genome-wide association study (GWAS). A total of 60 SNP (single nucleotide polymorphism) markers associated with aflatoxin production were detected, and they explained 16.87%–31.70% of phenotypic variation (PVE), with SNP02686 and SNP19994 possessing 31.70% and 28.91% PVE, respectively. Aflatoxin contents of accessions with “AG” (existed in Zh.h0551 and Zh.h2150) and “GG” genotypes of either SNP19994 or SNP02686 were significantly lower than that of “AA” genotypes in the mean value of a three-year assay. The resistant accessions and molecular markers identified in this study are likely to be helpful for deployment in aflatoxin resistance breeding in peanuts.
Key Contribution: This article identified novel peanut germplasms and related association SNP markers for aflatoxin production resistance.

1. Introduction

As an important source of edible oil and protein for humans and livestock, the peanut (Arachis hypogaea L.) is widely grown in more than 100 countries, with China, India, and the United States being the largest producers [1]. Cultivated peanuts (A. hypogaea, AABB, 2n = 4x = 40) are believed to be derived from the diploid wild species A. duranensis (AA genome) and A. ipaensis (BB genome), originating in South America through heterologous hybridization and long-term domestication [2]. Peanuts are widely planted in China as an important oil crop. In recent years, China has witnessed continuous enhanced peanut productivity, which reached 17.33 million tons in 2018 [3]. The peanut has become the largest oilseed crop in terms of annual production for more than one decade; however, peanut farmers and industries in China, as well as in many developing countries, are facing serious challenges of an increased risk of aflatoxin contamination.
Aflatoxin B1, B2, G1, and G2 (AFB1, AFB2, AFG1, and AFG2) are the most toxic and carcinogenic naturally occurring mycotoxins produced by Aspergillus in peanuts. Aspergillus flavus is able to produce AFB1 and AFB2, while Aspergillus parasiticus can produce all four aflatoxins [4,5,6]. Restrictions on levels of aflatoxins in agricultural and food products have been set up in many countries in the world. China and the U.S. have set limits on levels of aflatoxin at 20 μg/g in food and feed, while the European Union has imposed stringent regulations on levels of aflatoxin at 2–4 μg/g [7]. Aflatoxin contamination can directly affect food safety, international trade, and market competitiveness of peanut products, resulting in enormous economic losses. Various measures, such as bio-control agents, good agricultural practices, and genetic improvement in host plants have been used to prevent and control aflatoxin contamination in peanuts [8,9,10,11]. It is well-known that risk of aflatoxin contamination can be effectively controlled by planting resistant peanut varieties combined with necessary crop management [12].
However, efforts at breeding for aflatoxin resistance in peanuts are highly limited by many factors, such as complex interactions among the peanut varieties, Aspergillus fungal strains, and environmental factors. Lack of desirable parental genotypes with reliable and high-level resistance has been a common constraint in peanut breeding programs. Besides, a lack of rapid and accurate methods for phenotypic identification of aflatoxin contamination is also a common technical drawback worldwide. Therefore, more precise identification of peanut materials resistant to aflatoxin contamination and development of molecular markers applicable for marker-assisted selection (MAS) in breeding are of great significance to reduce the risk of aflatoxin.
According to the flowering and branching characteristics, peanut germplasms have been divided into six botanical varieties or types. Peanut germplasm accessions and breeding lines, including GFA-1, GFA-2, AR-3, AR-4, Yueyou 9, and Zhonghua 6 were identified to be resistant to aflatoxins [13,14]. However, the improved peanut varieties with aflatoxin resistance that are available have only been used in relatively limited regions, due to their relatively low yield or other undesirable agronomic traits. In order to develop better aflatoxin-resistant peanut varieties, more systematic identification is needed to screen germplasms for resistance. Although over 8000 peanut germplasm accessions have been assembled in China, it is difficult to screen all of them for complex traits like aflatoxin resistance, which can only be accessed using complicated and dear cost method. Under such circumstances, phenotyping for aflatoxin resistance in the manageable peanut germplasm set, like the Chinese mini-mini core collection consisting of 99 diverse accessions, would be feasible [15].
The molecular mechanisms of the biosynthesis of aflatoxins have been well-investigated. The initial stage of aflatoxin biosynthesis is similar to that of fatty acid biosynthesis, where acetyl CoA acts as the start unit, and malonate monoacyl CoA acts as the extension unit to form aflatoxin’s polyketone skeleton, catalyzed by polyketide synthase (PksA) [16,17]. More than 18 enzymes, such as Nor-1 (oxidoreductase), AvnA (monooxygenase), AdhA (dehydrogenase), FAD (Flavin adenine dinucleotide)-containing monooxygenase, EstA (esterase), and VerB (versicolorin B desaturase) have been identified to be involved in the biosynthesis of aflatoxins [18]. Advances in plant proteomics and fungal genomics partly reveal the resistance mechanisms of aflatoxin contamination in host plants [19]. Three types of plant factors that may influence fungal growth and aflatoxin contamination have been involved in the processes of resistance mechanisms: The first type is seed proteins that act as fungal cell wall degrading enzymes; the second type is proteins or secondary metabolites from the host seed that could directly influence fungal growth and/or aflatoxin synthesis; and the third type is plant stress responsive proteins that are synthesized by the host in large amounts after infection by A. flavus [20]. Research on these resistance mechanisms may promote genetic improvement of aflatoxin contamination resistance in peanuts.
Advances in next-generation sequencing (NGS) have made genome-scale population genetic studies more straightforward and economical [12,21,22,23,24,25]. Restriction-site-associated DNA sequencing (RAD-Seq) is a fractional genome sequencing strategy that can identify large numbers of genetic variations, such as single nucleotide polymorphism (SNP), through sequencing genomes digested by restriction nuclease [26]. In peanuts, SNP markers obtained by RAD-seq have been successfully used for genetic linkage map construction and bulk segregant analysis (BSA) [27,28,29]. Resistance to aflatoxin accumulation in peanuts is a complex trait affected by several environmental factors. Strong interaction has been detected between environment factors and the genotype for aflatoxin contamination [20]. In our previous study, four major and six minor QTLs (quantitative trait locus) were identified for aflatoxin resistance through genome-wide QTL analysis with a genetic linkage map constructed by SSR (simple sequence repeats) markers [30]. Due to the limitation of the genetic linkage map’s resolution, the confidence interval’s genetic distance of these major QTLs was >7 cM (centimorgan). It is difficult to identify related candidate genes by such a large confidence interval. However, the genome-wide association study (GWAS) is an effective trait-mapping approach for identifying candidate genes that underlie complex phenotypic traits, and it has been applied in identifying associated markers and candidate genes for several important agronomic traits in peanuts [15,19,31], but has not yet focused on aflatoxin resistance. Therefore, the present study was performed to conduct GWAS in 99 accessions of the Chinese peanut mini-mini core collection, using RAD-Seq-based, high-density genotyping and phenotyping data for AFB1 and AFB2 contents from three environments via inoculation with A. flavus under laboratory conditions. This study successfully identified SNP markers and candidate genes associated with aflatoxin content in peanut seeds, which may open up further opportunities in developing a genomic solution for aflatoxin production resistance in peanuts.

2. Results

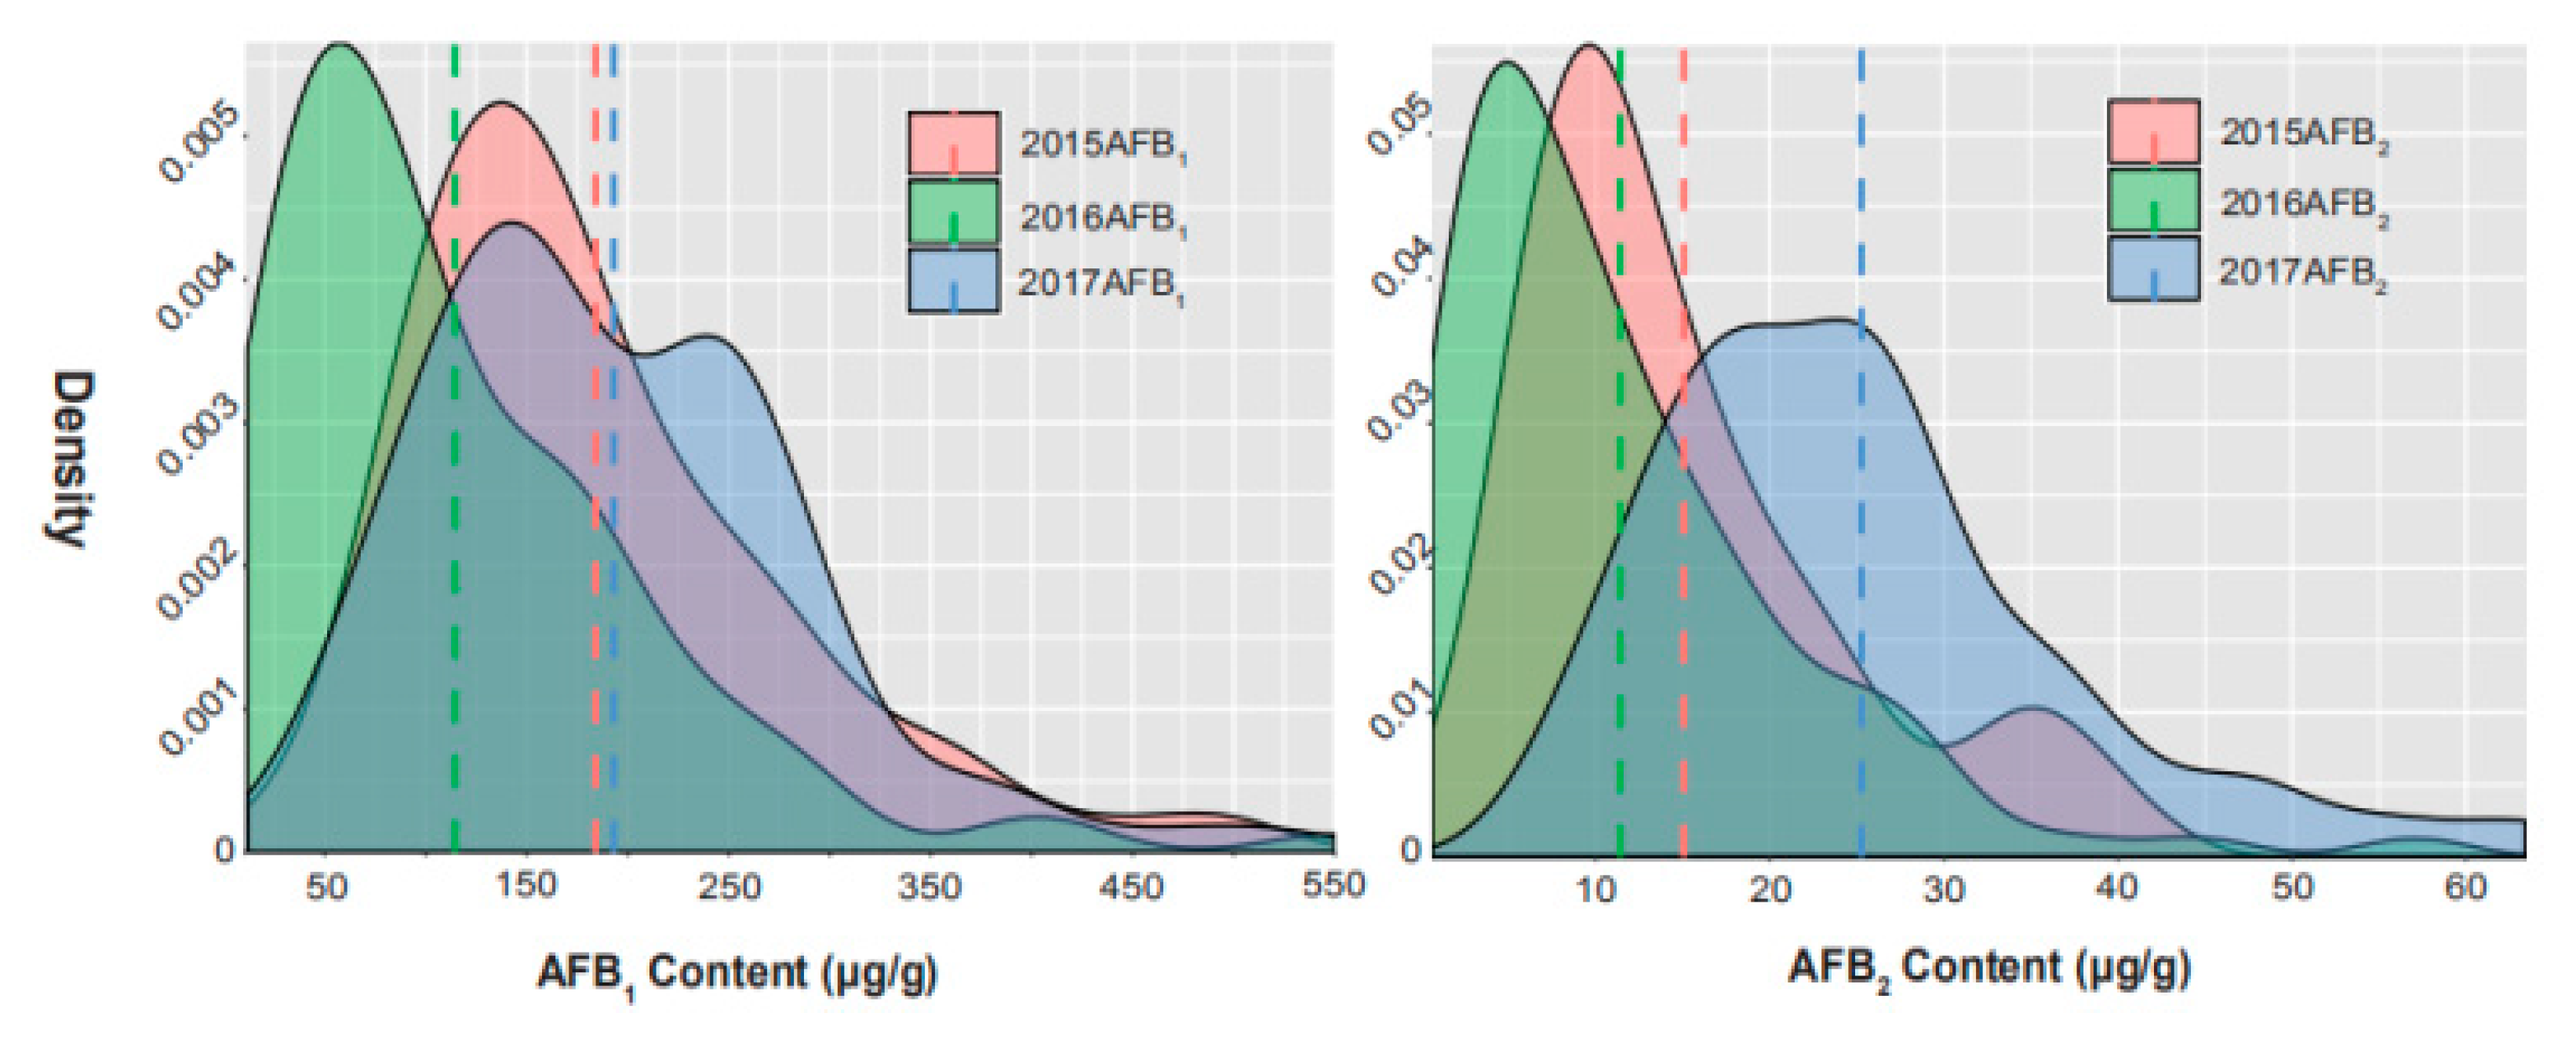
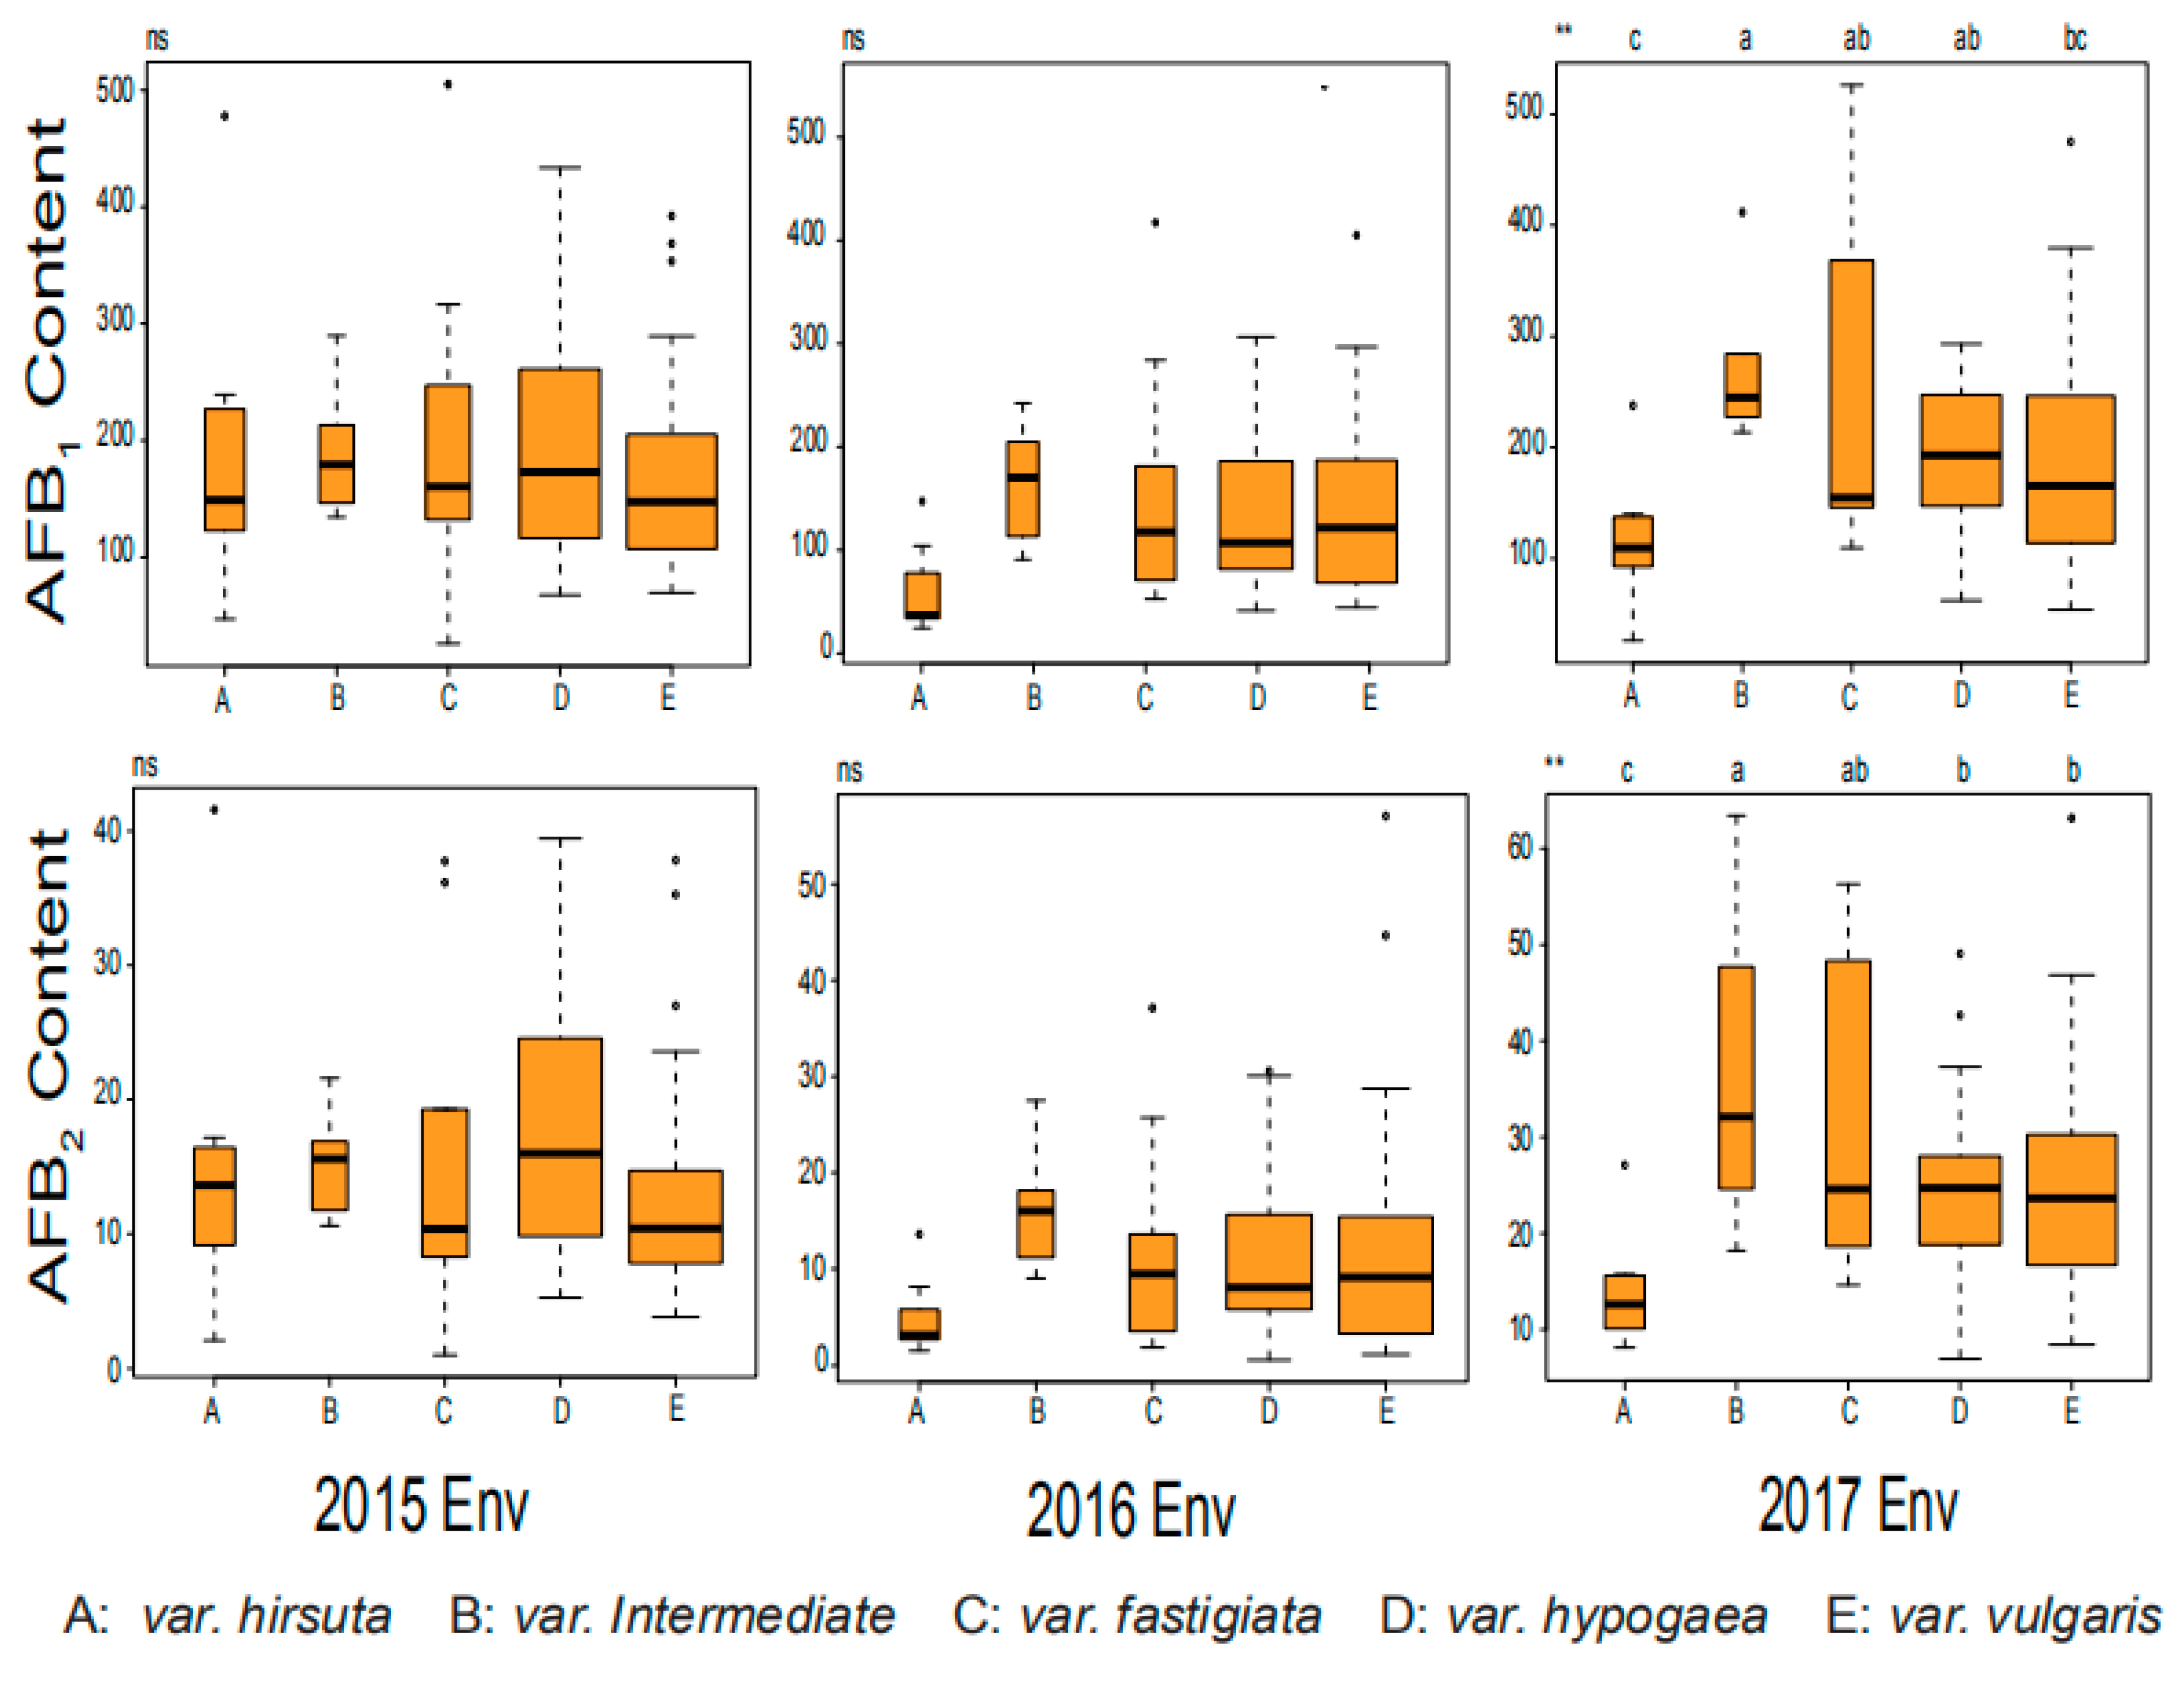
2.1. Phenotypic Variation for AFB1 and AFB2 in Chinese Mini-Mini Core

The phenotypic evaluation revealed a broad range of variations in aflatoxin production under the artificial inoculation assay among the 99 accessions of the Chinese peanut mini-mini core across 3 years (Figure 1, Table 1). The descriptive statistics of the phenotypic variations of three traits have been listed in Table 1. Across the three environments, the AFB1 and AFB2 content of the 99 accessions showed a continuous variation and approximated a normal distribution. AFB1 content ranged from 25.92 to 550.17 μg/g, with an average of 184.08 μg/g in 2015, from 11.69 to 505.01 μg/g, with an average of 114.45 μg/g in 2016 and from 26.08 to 526.21 μg/g, with an average of 193.01 μg/g in 2017. For AFB2, the content ranged from 0.98 to 41.60 μg/g, with an average of 15.06 μg/g in 2015, from 0.58 to 57.08 μg/g, with an average of 11.40 μg/g in 2016 and from 7.00 to 63.42 μg/g, with an average of 25.25 μg/g in 2017. The coefficient of variation (CV) of AFB1 in the environments of 2015, 2016, and 2017 were 0.51, 0.82, and 0.48, respectively, and for AFB2 it was 0.63, 0.88, and 0.47, respectively. Broad-sense heritability was estimated to be 0.57 for AFB1 content and 0.51 for AFB2 content (Table 2), indicating that both AFB1 and AFB2 content were partly controlled by genetic factors and affected by environmental factors. Variance analysis across the three trials also revealed that the genetic, environmental effects, and genotype × environment interaction significantly affected aflatoxin content.
Correlation coefficients between AFB1 and AFB2 were 0.88 (p < 0.001) in 2015, 0.99 (p < 0.001) in 2016, and 0.78 (p < 0.001) in the 2017 environment (Table 3). The significantly positive correlation between AFB1 and AFB2 suggests that resistance to AFB1 and AFB2 production in peanuts was controlled by the same genomic loci.
Two cultivated peanut accessions, Zh.h0551 and Zh.h2150, showed that extremely low content of both AFB1 and AFB2 and belonged to var.hirsuta and var.vulgaris, respectively (Table 4). The least significant difference (LSD) analysis was performed to compare the differences in AFB1 and AFB2 content among five botanical varieties involved, where the var.intermediate proved relatively higher than other varieties in both AFB1 and AFB2, and the var.hirsuta proved relatively lower than the other four varieties in both AFB1 and AFB2. In the 2017 environment, var.hirsuta proved to have a significantly lower level of AFB1 than the other three varieties (var.intermediate, var.fastigiata, and var.hypogea), and the var.intermediate proved to have a significantly higher AFB1 level than var.hypogea (Figure 2).

2.2. SNP Genotyping and Genetic Diversity

After filtering the SNPs with a call rate of <90% or with minor allele frequencies (MAFs) <5%, 36,058 polymorphic SNP markers were finally screened out and used to assess the population structure (Q), PCA analysis, relative kinship (K), and GWAS analysis. The filtered SNPs provided a 2.4 Gb genome-wide coverage with a mean distance of 118.44 Mb. Numbers of these SNPs ranged from 599 in A08, to 2387 in A03. The density of SNPs in each chromosome ranged from 49.93 kb/SNP in A10 to 87.85 kb/SNP in B01, with a mean density of 67.23 kb/SNP (Table 5).

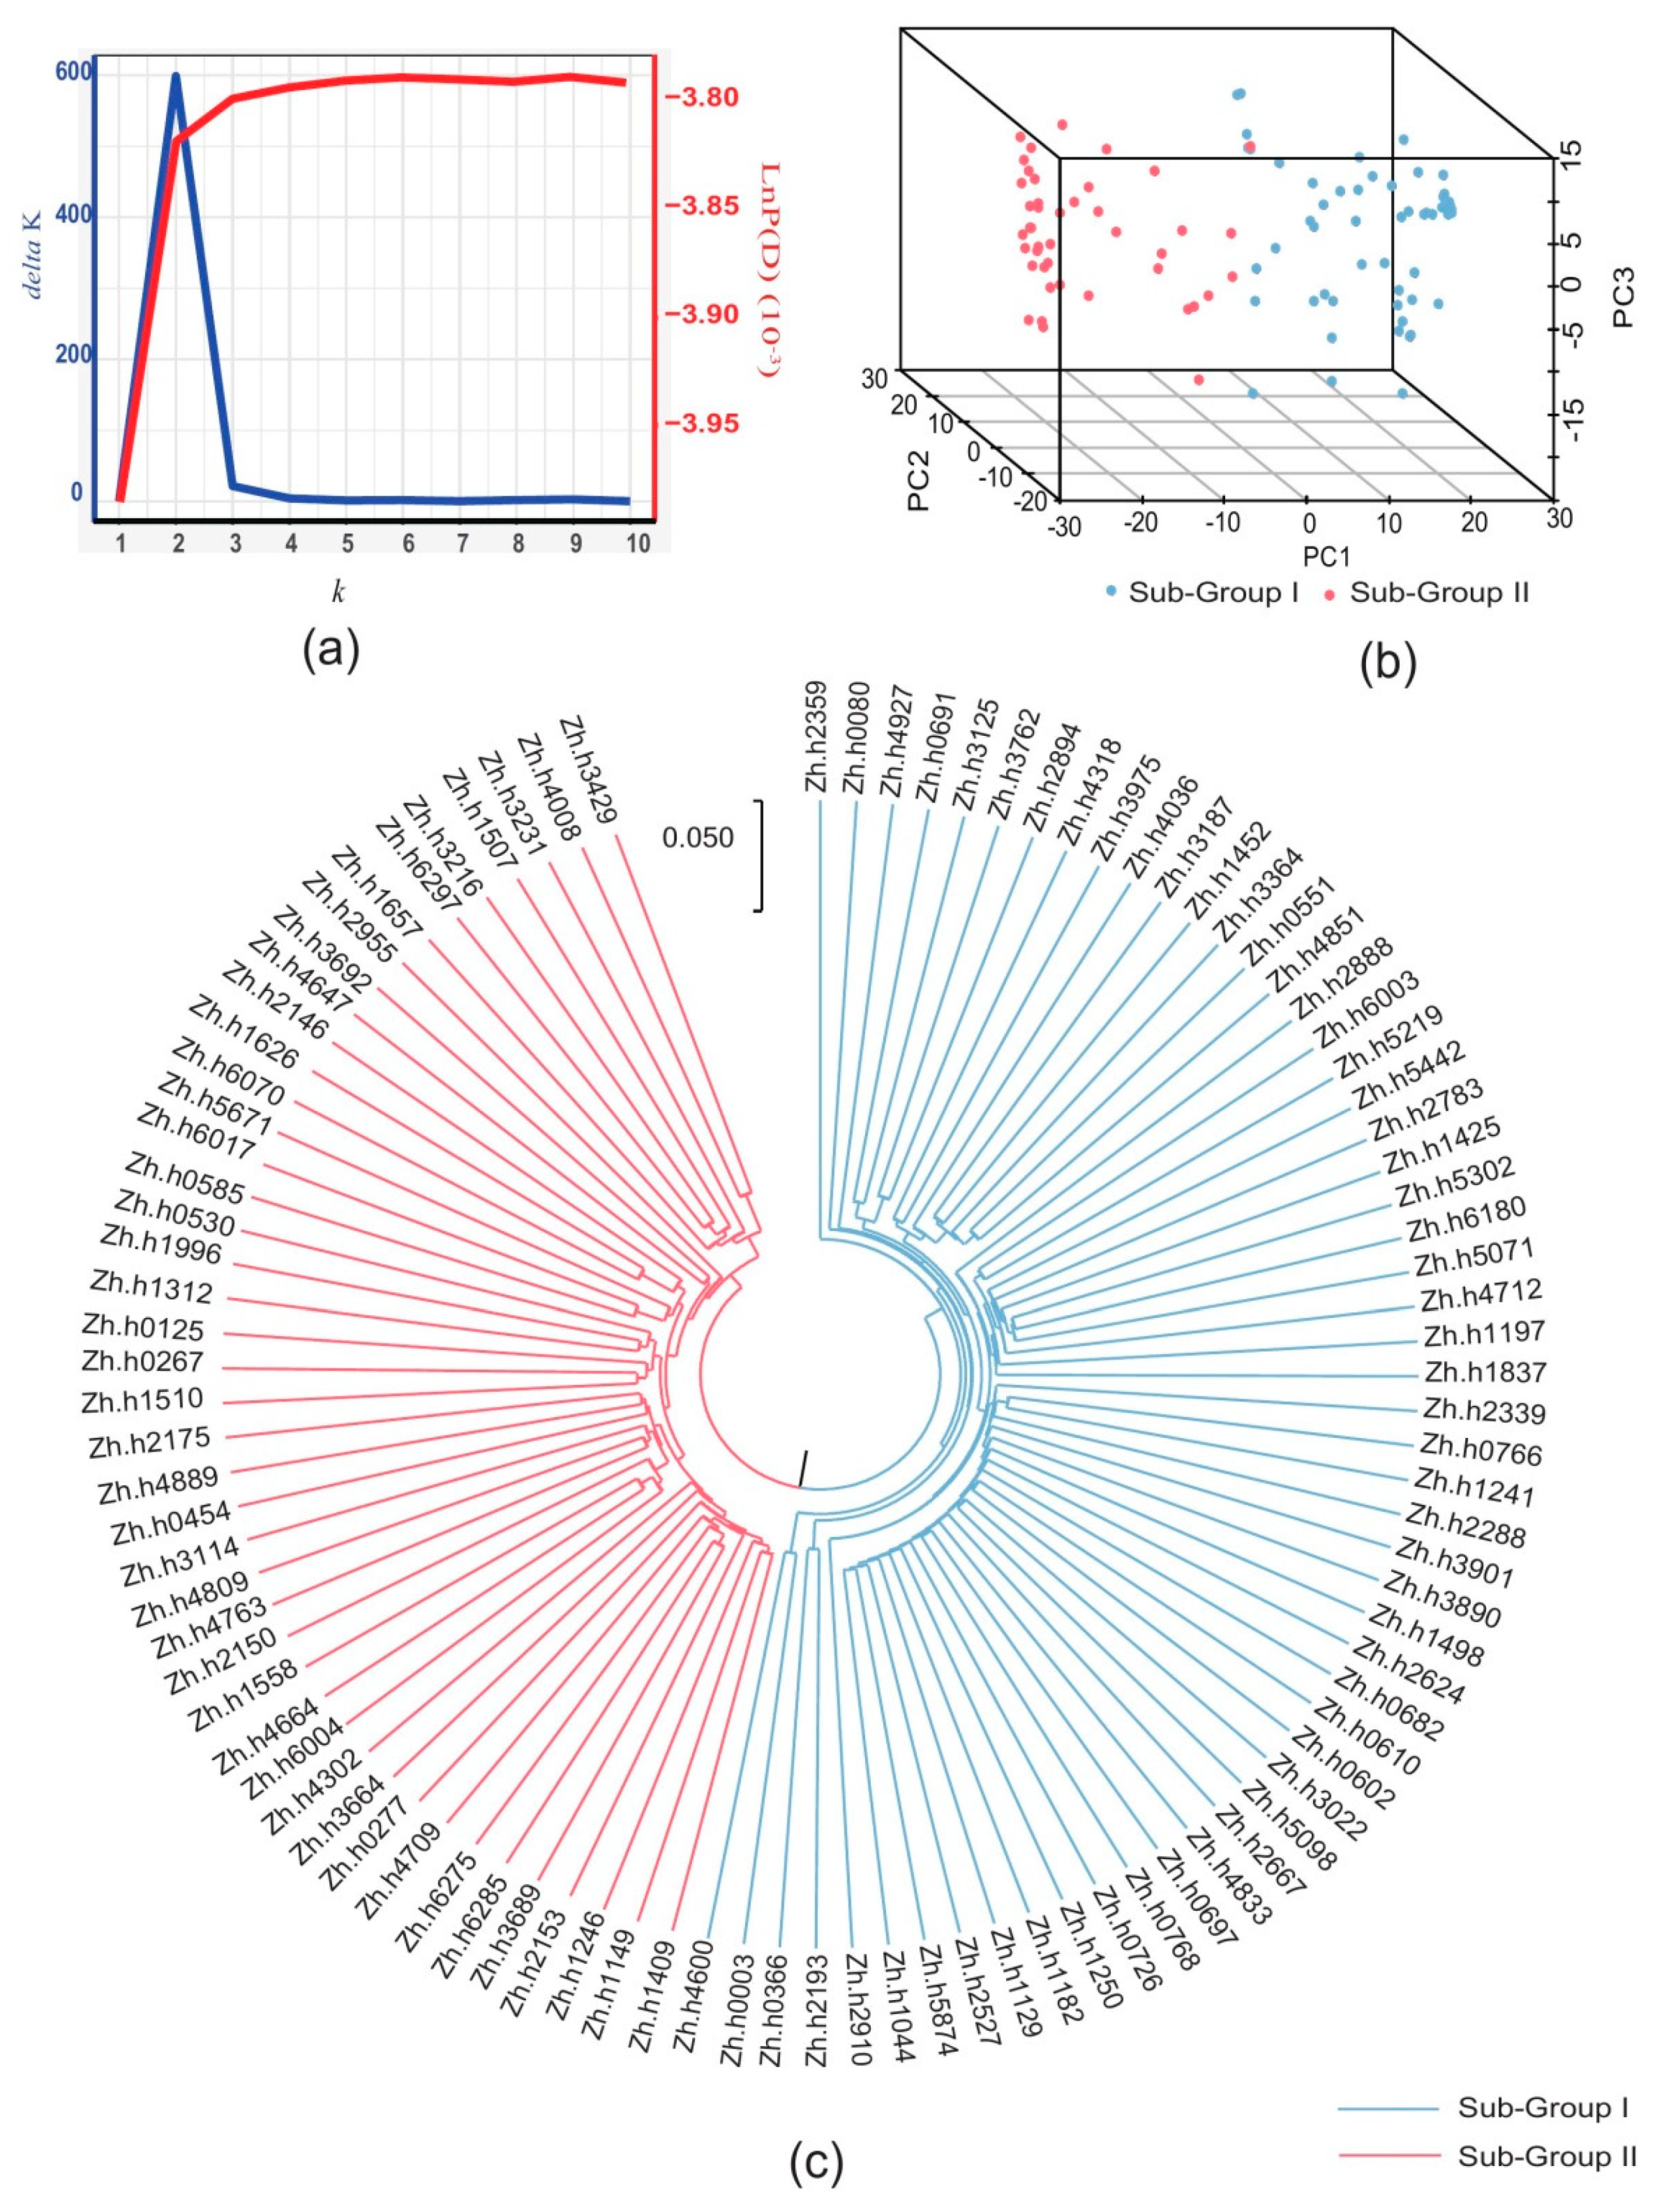
2.3. Population Structure and Relative Kinship

The number of sub-populations of the 99 accessions was estimated based on the genotypic data. Bayesian clustering was performed for k = 1–10 with five repetitions, and significant changes were observed in both delta k value and LnP(D) value when k = 2 (Figure 3a). The UPGMA (unweighted pair group method using arithmetic average) phylogeny tree based on Nei’s genetic distances divided the 99 accessions into two subgroups (Figure 3c). The genotypic PCA three-dimensional plot also showed that the population was grouped into two major clusters, with few overlap regions (Figure 3b). The relative kinship between 99 genotypes was estimated based on the 36,058 SNP markers. A kinship coefficient less than 0.25 accounted for 98.60% of the association panel, indicating that the majority of the genotypes had a weak relationship with each other (Figure S1). The K matrix was visualized using a heat map, in which the two subgroups were clearly separated (Figure S2). Overall, these results suggested that the population of the Chinese mini-mini core collection could be divided into two subgroups: subgroup I and subgroup II. Subgroup I contained 55 accessions, of which 32 accessions (58.1%) belonged to ssp.hypogaea. Forty-five accessions were classified into Subgroup II, where 33 accessions (75%) belonged to ssp.fastigiata (Table S1).

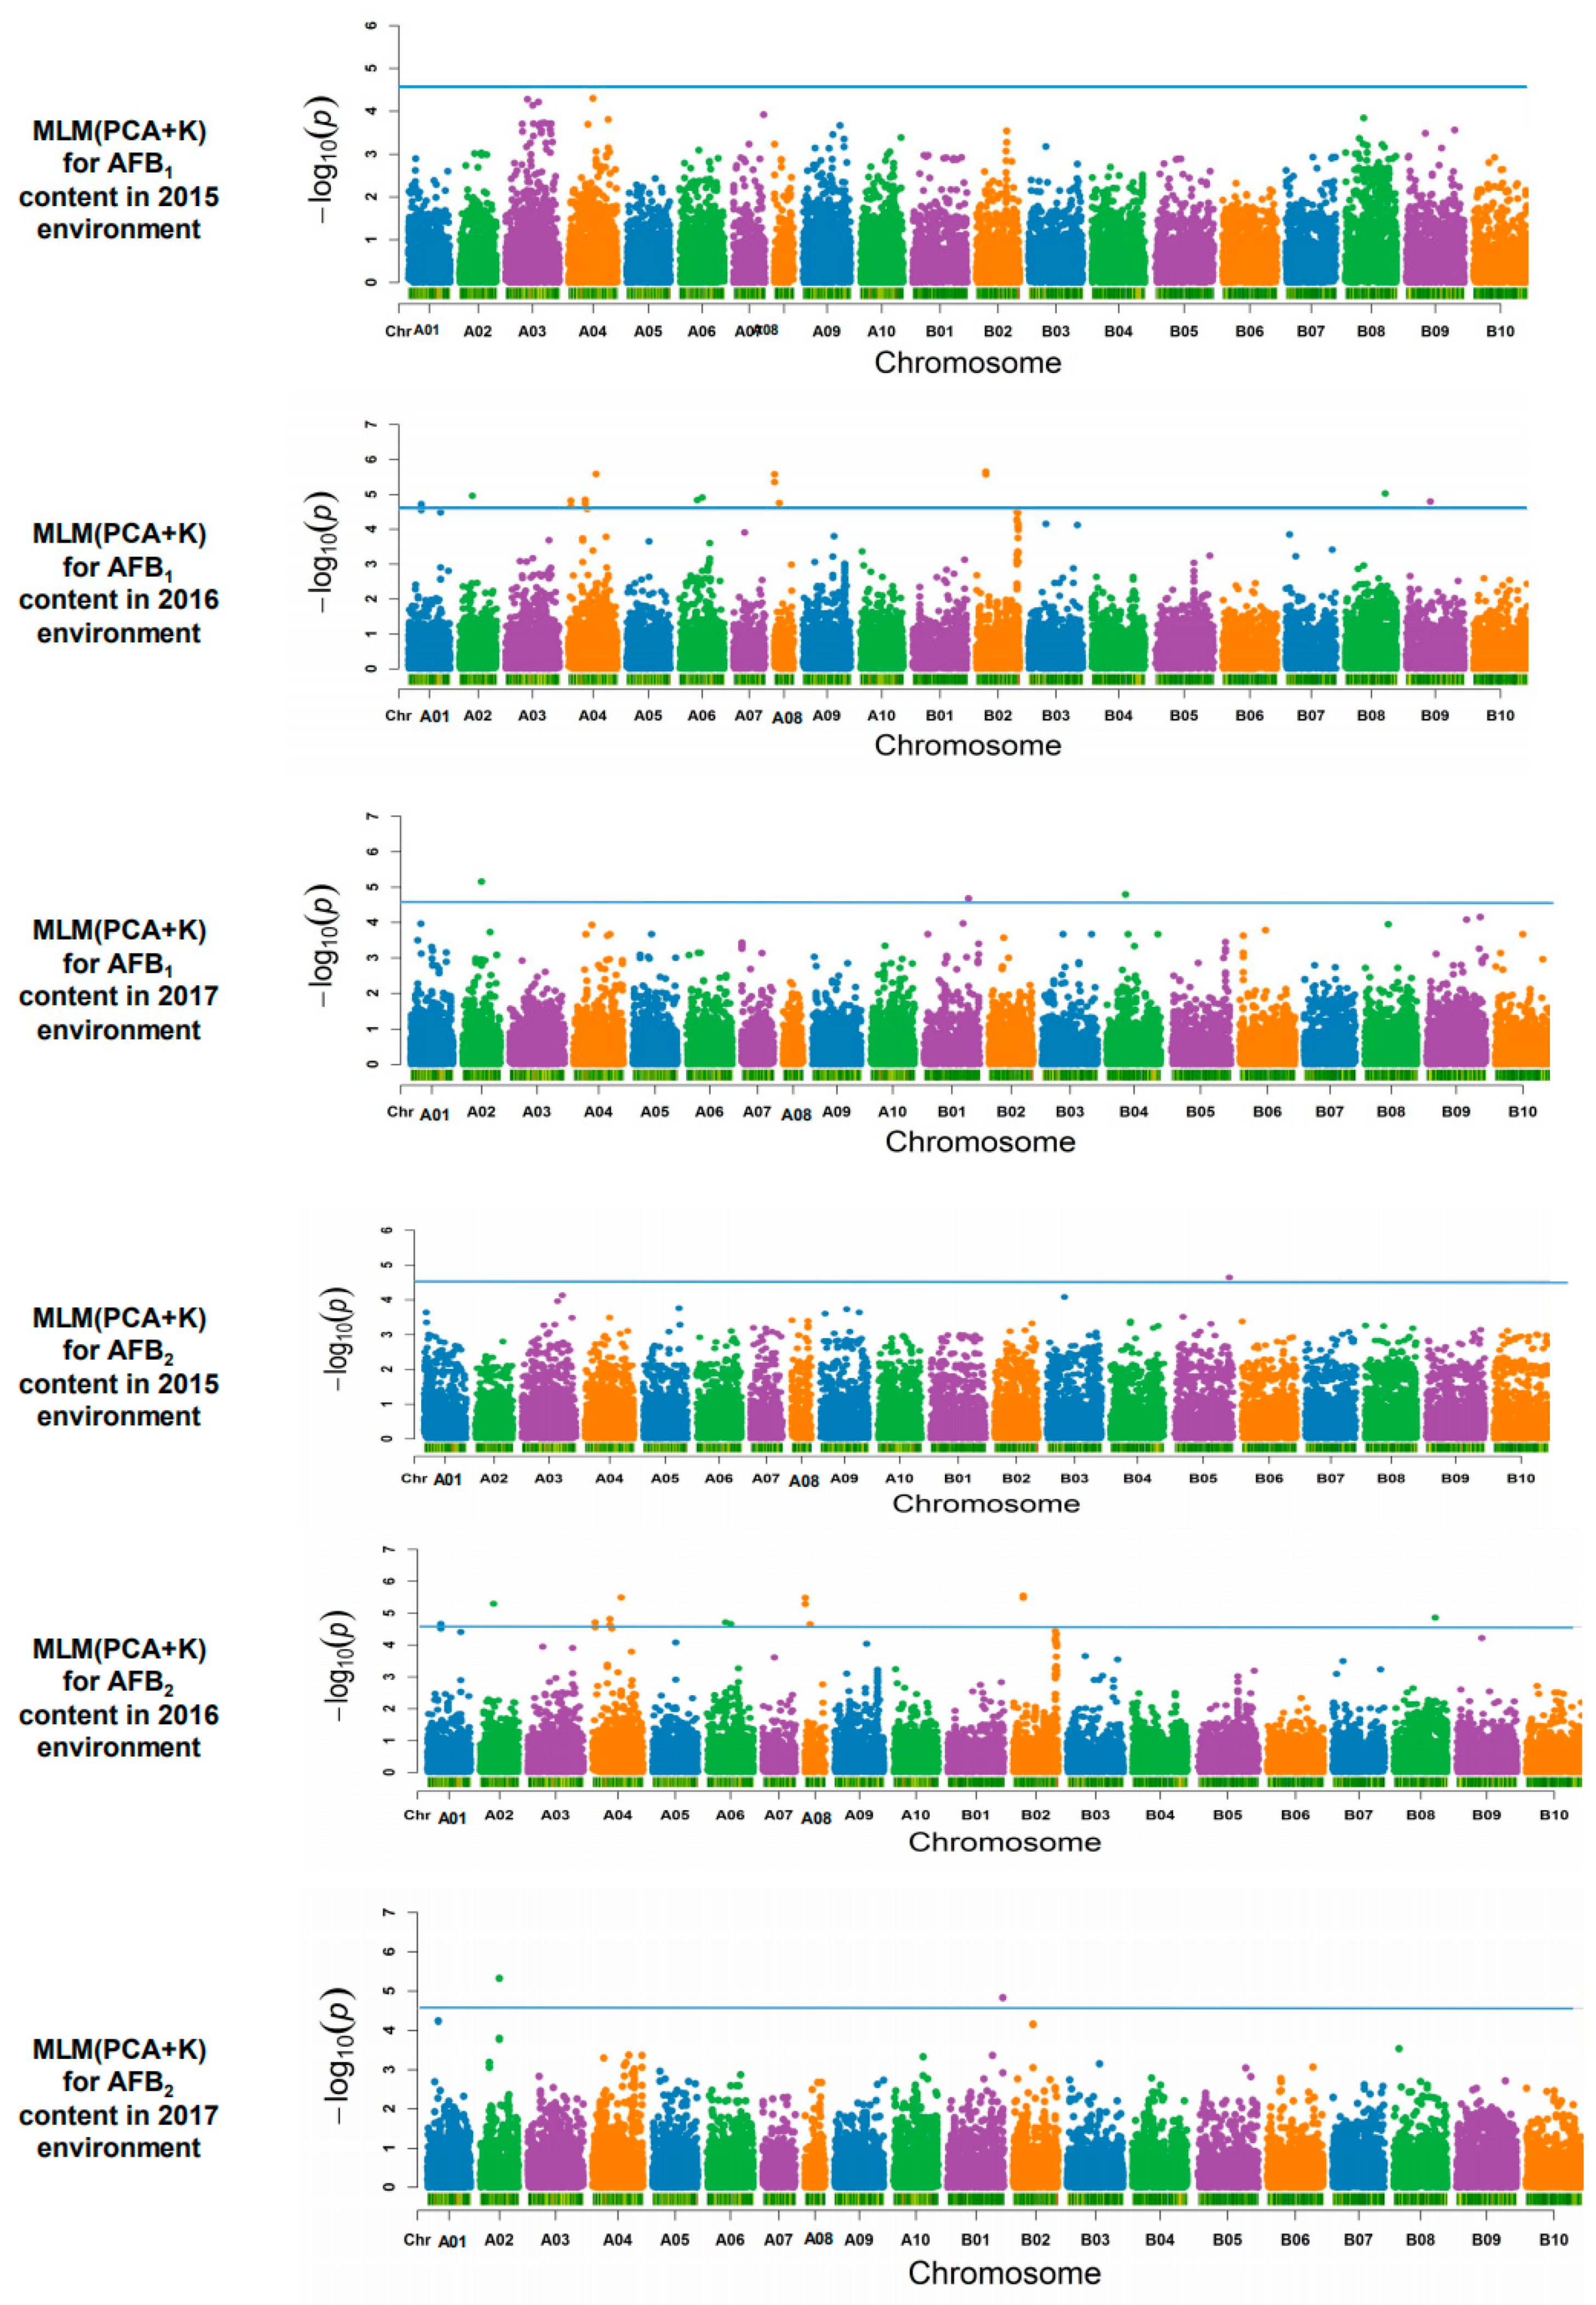
2.4. Association Analysis and Candidate Genes

Five association analysis models, namely, the GLM (PCA), the GLM (Q), the MLM (Q + K), the MLM (PCA + K), and the MLM (K) model were compared and shown using a quantile quantile (QQ) plot to determine the most suitable model for association analysis. Based on the results of the QQ plot, the MLM (PCA + K) model was selected for GWAS (Figure S3).
A total of 60 SNP markers associated with AFB1 and AFB2 reached the corrected p-value threshold (−log10 (p) > 4.55). For AFB1, 32 significant SNP markers were detected in 10 chromosomes, with the PVE ranging from 16.87% to 28.83%. Among these markers, 28 associated SNP markers were detected in the 2016 environment, and four in the 2017 environment. Among these associated markers, SNP02428 in chromosome A02 which was detected in the 2016 environment showed the largest effect on AFB1 (PVE = 28.83%). For AFB2, 28 significant SNP markers were detected in nine chromosomes, with the PVE ranging from 22.27% to 31.70%. Among these associated markers, one marker was detected in the 2015 environment, 25 in the 2016 environment, and two in the 2017 environment. SNP02686 in chromosome A02, which was detected in the 2017 environment, had the largest effect on AFB2 content (PVE = 31.70%), and was also significantly associated with AFB1 (Table S2, Figure 4). Besides, as shown in Table 6, accessions with genotype “GG” or “GA” of SNP02686 accumulated significantly lower AFB1 and AFB2 than other “AA” genotypes in the mean value of three environments (Table 6). In addition, a total of 26 SNP markers were found to be associated with both AFB1 and AFB2 in the 2016 and 2017 environment (Table S2, Figure 4).
The whole genome was analyzed for the linkage disequilibrium (LD) block, where the size of the larger LD Block was mostly distributed around 200 kb (Figure S4). Based on this, a 100 kb candidate region on each side of the peak SNP marker associated with AFB1 and AFB2 was subsequently analyzed for identification of candidate genes. As a result, a total of 99 genes were identified in 15 candidate regions annotated in A. duranensis (A sub-genome) and A. ipaensis (B sub-genome). Aradu.WOPPM, located in the candidate region of the peak SNP marker SNP02686, was annotated as ATP-citrate lyase (ACLY), which is responsible for generating cytosolic acetyl-CoA and oxaloacetate. Acetyl-CoA is the substrate for the synthesis of aflatoxin. Genes coding WRKY transcript factors and proteins with a leucine-rich repeat domain were identified in the candidate region of the peak SNP marker SNP19994, which were reported as responsible for disease resistance in plants (Table S3).

3. Discussion

Occurrence of aflatoxin contamination in peanuts can have serious impacts on economies and human health worldwide. Development of peanut varieties with aflatoxin contamination resistance through genetic improvement is the most efficient solution to reduce risks of aflatoxin. This study is the first report to systematically identify associated molecular markers for aflatoxin accumulation resistance in peanuts. A total of 18 association peaks were identified for AFB1 and AFB2, with PVE ranging from 16.87% to 31.70%, including four peaks specific to AFB1, and two peaks specific to AFB2 (Table S2). According to annotation information of two ancestor wild Arachis species of cultivated peanuts (A. duranensis and A. ipaensis), 99 candidate genes were identified in 15 candidate genomic regions (Table S3).
Significant effects were detected in the genotype, environment, and genotype × environment interaction by a two-way ANOVA (Table 2). Several research reports indicated that the content of aflatoxin in peanut seeds was greatly affected by environmental factors during seed development. Fountain et al. (2017) pointed out that high temperature and drought stress had significant effects on the interaction between maize and A. flavus and the production of aflatoxin [32]. The same phenomenon was also observed in peanuts [33,34,35]. The reduced capacity of seeds to produce phytoalexins as the seed moisture content decreases during drought environment is believed to be an important factor for aflatoxin contamination [20]. In this study, as aflatoxin content is a trait that is highly affected by the environment, the phenotype of seeds harvested in the field varied greatly in different environments (Table 1, Table 2). Based on these reasons, no duplicate association SNP markers were found in different environments, neither for AFB1 nor for AFB2 (Table S2). However, except for 2015AFB2 vs. 2017AFB2, the Pearson correlations between the same phenotype in different environments were significant (Table S4). The selected set of peanut lines in our association panel showed stable performance for extreme phenotypes across three environments, with a 4- to 10-fold difference in aflatoxin content between resistant and susceptible genotypes (Table 4). These results indicated that screening aflatoxin-resistant materials through rapid identification of the mini core germplasm method is effective and that the identified resistant lines can be used for breeding aflatoxin contamination-resistant varieties.
In this study, only AFB1 and AFB2 were detected in peanut seeds, after artificial inoculation of AF2202 (A. flavus). The mean content of AFB1 in each sample was about ten folds of AFB2 (Table 1). The value of phenotypic correlations between AFB1 and AFB2 ranged from 0.78 to 0.99, with there being a significant level (p < 0.01) (Table 3). As a result, of the 19 SNP peaks detected in GWAS, 12 peaks were detected to be associated with both AFB1 and AFB2 (Table S2). It is noteworthy that both AFB1 and AFB2 are downstream products of versicolorin B (VB) in the aflatoxin metabolic pathway of A. flavus [36]. These results indicated that the mechanism of aflatoxin resistance in peanuts occurs mainly in the upstream metabolic pathway of VB production. Besides, in the AFB1 synthesis pathway, versicolorin A (VA) is the downstream product of VB, which contains the 2, 3 double bond in the dihydrobisfuran ring. This double bound can be oxidized in the host organism [18]. These studies could explain why the content of AFB1 is much higher than that of AFB2 in each sample of this study.
GWAS is considered to be an efficient genetic analysis method for complex traits. There are several elements that affect the precision of GWAS, such as population size, marker density, and statistical methods. In theory, an association population with large number accessions that encompasses the genetic diversity as much as possible is an optimal choice for association analysis. However, the operation of this experiment is relatively tedious, and systematic errors are easily introduced in seed sample selection, pre-treatment, artificial inoculation, and liquid chromatography measurements during the use of large populations. Hence, a mini core collection is a useful strategy [15]. The population structure and relative kinship were calculated by the genotype of association panel, and then used in five GWAS statistical methods to control false-positive results. Similar to other studies using peanuts [37,38], the 99 accessions of the Chinese mini-mini core collection in this study were classified into two subgroups (Figure 3).
Breeding for peanut varieties for resistance to aflatoxin contamination is the most effective approach for reducing hazards by aflatoxin. In a previous study, major QTLs for aflatoxin contamination resistance in peanuts were identified in chromosome A07 and B06 by linkage analysis with a genetic linkage map developed by a SSR marker [30]. However, because of the limited density of SSR markers in the genetic map, the confidence intervals of these QTLs are very large (7–16 cM). It is difficult to identify related resistance candidate genes by such a large confidence interval. In this study, a total of 18 association peaks distributed in 11 chromosomes were identified as associated with aflatoxin content in peanut seeds across multiple environments, 12 of which were associated with both AFB1 and AFB2, four were associated with AFB1, and two were associated with AFB2 (Table S2). These results imply that the resistances to AFB1 and AFB2 in peanut seeds largely share the same mechanism controlled by multiple genes. In plants, proteins with a leucine-rich repeat (LRR) domain have been confirmed to be involved in processes of plant disease resistance. These proteins work as the first point of pathogen defense, where the innate immune response is initiated through the sensing of pathogen-associated molecular patterns (PAMPs). Two genes encoding a LRR domain were identified in chromosome B01 in a 50 kb candidate genomic region of the SNP marker SNP19994; besides, a gene encoding WRKY transcription factor was also identified in this genomic region. The SNP marker SNP02686, which has shown the largest PVE for AFB2, was also associated with AFB1 in the 2017 environment. The Aradu.WAPPM gene was located 33.18 kb from SNP02686 in chromosome A02, which was predicated to encode ATP-citrate lyase (ACLY), responsible for generating cytosolic acetyl-CoA and oxaloacetate (Table S3). In A. flavus, acetyl-CoA is the key substrate of the aflatoxin biosynthesis pathway. Although there is no direct evidence that acetyl-CoA produced in peanuts is involved in the biosynthesis of aflatoxin in A. flavus, the findings of this study can provide ideas for further research. Peanut accessions with “AG” (contained in Zh.h0551 and Zh.h2150) and “GG” genotypes of either SNP19994 or SNP02686 possessed significantly lower aflatoxin content than that of the “AA” genotype. Further study of these markers may contribute to the development of aflatoxin production diagnostic molecular markers.

4. Conclusions

The present study reported the phenotyping of aflatoxin resistance in the Chinese peanut mini-mini core collection, followed by genotyping using the RAD-Seq approach and association mapping. Two peanut accessions (Zh.h0551 and Zh.h2150) were identified as resistant to aflatoxin contamination, with stable performance in multiple environments. The identified SNP markers for resistance to aflatoxin contamination along with the resistant materials would be helpful for peanut breeding for aflatoxin resistance.

5. Materials and Methods

5.1. Peanut Plant Materials

The 99 peanut accessions of the Chinese mini-mini core collection were planted in an experimental field (sandy soil) of the Oil Crops Research Institute of Chinese Academy of Agricultural Sciences (OCRI-CAAS) in Wuhan over three consecutive years (2015, 2016, and 2017), using a randomly complete block design with three replications. Each accession was planted in three rows with 10–15 plants in each row. The distance between each row was 30 cm, and there was 10 cm between plants in each row. Field management followed the standard agricultural practices. Continuously meteorological data in the field (including air temperature, relative humidity, monthly precipitation, and soil temperature) were observed by the Dynamet Weather 2 Station (Table S5). Soil pH, soil organic matter (SOM) content, soil total nitrogen (STN) content, soil available phosphorous (SAP) content, and soil available potassium (SAK) in the field were collected before sowing (Table S6). The Soil pH was determined by pH meter (STARTER 3100M, OHAUS, Newark, NJ, USA); SOM content was determined using the Walkley–Black oxidation method [39]; STN content was measured using the Kjeldahl procedure (UDK140 Atomatic Steam Distilling Unit, VELP Scientifica, Milan, Italy) [40]; SAP content was determined using the molybdenum antimony colorimetric method, after digestion by NaHCO3 (0.5 mol/L) [40]; and SAK content was determined by the flame spectrometry method, after extraction with NH4OAc (1 mol/L) [40]. After harvesting, all peanuts were dried immediately and the moisture content of the seeds was controlled to 5%–8%. Healthy and mature peanut seeds were artificially selected for further analysis.

5.2. Phenotyping for Aflatoxin Production

The toxigenic Aspergillus flavus strain AF2202 was maintained in 20% glycerol at conditions of −80 °C in OCRI-CAAS, China. The A. flavus AF2202 strain spores from vial stocks were cultured on fresh potato dextrose agar medium in a 90 mm petri dish at 30 °C for 7 days. Conidia were collected from Petri dishes and then suspended in sterile water containing 0.05% Tween-80 (Sigma-Aldrich, Munich, Germany) in a flask. The spore suspension was then diluted to 2 × 10⁶ CFU/mL in 0.05% Tween solution. For each accession of association panel, about 80 healthy and mature seeds were selected and sterilized with 75% ethanol for 1 min, followed by three washes with sterile water. The sterilized peanut seeds were randomly and evenly assigned to four sterilized Petri dishes as three repeated inoculation groups and one blank control group. The inoculation groups were inoculated by applying 1 mL of the above conidial suspension in sterile Petri dishes. The control groups were treated by the same inoculation method, and 1 mL of 0.05% Tween-80 instead of 1 mL conidial suspension was applied. In order to ensure the consistency of water absorption in different accessions, the contact time between peanut seeds and liquid during sterilization and inoculation was strictly controlled at 13 min. After inoculation, all Petri dishes were cultured in an artificial climate incubator (RZH-500A, Huier, Hangzhou, China) for 7 days with 85% relative humidity, 30 °C air temperature, and a dark environment.
After being co-cultured with A.flavus, all peanut seeds were dried at 110 °C for 2 h, grounded to fine powder using a coffee blender, and then filtered by a 20-mesh sieve. About 10 g of peanut powder was transferred into a 500 mL erlenmeyer flask with stopper capacity, mixed with 50 mL methanol (analytically pure grade, Xilong, Shantou, China)/water (55:45 v/v) and 15 mL petroleum ether (analytically pure grade, Xilong, Shantou, China), and shaken at 200 rpm at room temperature for 30 min. The crude extraction was filtered through qualitative filter paper (medium speed, Whatman, General Electric Company, Boston, MA, USA) and then diluted 10 times by 55% methanol. Separation and quantitation of aflatoxins was performed using a HPLC instrument (Agilent Technologies 1200 series, Santa Clara, CA, USA) equipped with a HPLC C18 4.6 mm × 250 mm, 5 μm column (Agilent, Santa Clara, CA, USA). The column was maintained at 30 °C in the system column heater. The mobile phase was composed of a methanol/ water (45:55) mixture, where the flow rate was 0.7 mL/min. The injection volume was 10 μL, and the injection time was 25 min. Concentration of aflatoxins were determined by peak areas with regression equations:
y 1 = 1.4906 x 1 0.0524 1000
y 2 = 0.5618 x 2 + 0.0866 1000
(y1 for concentration of AFB1, x1 for peak area of AFB1, y2 for concentration of AFB2, and x2 for peak area of AFB2) based on standard curves. The standard curves were established by the afaltoxin standard solution (CRM46304, Sigma-Aldrich, Munich, Germany). The lowest detection limit was 0.003 μg/g for AFB1 and 0.001 μg/g for AFB2.

5.3. RAD-Seq and SNP Calling

The genomic DNA of the 99 accessions were isolated from the young leaves of a single plant using a QIAGEN DNAeasy Plant mini kit (Dusseldorf, Germany), and operated according to the product manual. A total of 150 ng of genomic DNA of each accession was digested by 5 U of SacI and MseI (Thermo Fisher, Waltham, MA, USA). The digest react condition was set at 37 °C for 6 h and then 65 °C for 90 min. For each sample, 10 pmol of SacI and MseI adaptors (Table S7) together with 1000 U of T4 ligase (New England Biolabs, Ipswich, MA, USA) were used for ligation reaction in a 50 μL reaction system at 16 °C overnight. The ligation products of each sample were amplified by PCR (Polymerase Chain Reaction) in a 50 μL reaction system with 4 pmol of two overhang primers (Table S8), 1rHF buffer, 3.5 mM Mgcl2, 0.4 mM dNTPs, and 0.5 U of iproof polymerase (Bio-Red, Berkeley, CA, USA). PCR amplification was performed as follows: 98 °C for 2 min, followed by 12 cycles at 98 °C for 30 s, 65 °C for 30 s, and 72 °C for 15 s, and a final extension at 72 °C for 5 min. These PCR products (300–500 bp) were extracted after agarose gel electrophoresis using a Gel Extraction Kit (Qiagen, Dusseldorf, Germany) and then quantified by Agilent 2100 Bioanalyzer (Agilent Technologies, Santa Clara, CA, USA). Finally, these products were submitted for sequencing on the Illumina Hiseq2000 platform (Illumina, San Diego, CA, USA).
After quality control and filtering, all reads were mapped on the reference genome (A-subgenome, Arachis duranensis; B-subgenome, Arachis ipaensis, https://peanutbase.org/home) [41]. SNPs were identified by GATK and SAMtools, and filtered with minor allele frequency (MAF) and integrity (genotyped rate) [42,43].

5.4. Population Structure, Relative Kinship, Phylogenetic Tree Construction, and Linkage Disequilibrium

Population structure (Q-matrix) was calculated using Structure 2.2 software [44]. The number of possible subgroups (k) was pre-defined as 1–10 to explore the population structure of the tested accessions. The maximum likelihood estimates were applied to achieve reliable subgroups (k) with each k being run five times. The optimum k-value was obtained by the methods described by Evanno et al. [45]. The relative kinship, phylogenetic trees, principal component analysis (PCA), and linkage disequilibrium (LD) estimate were performed using Tassel 5 software based on the SNP genotype of the 99 accessions [46].

5.5. GWAS for Aflatoxin Production in Peanut Seeds

GWAS was conducted using Tassel 5 software [46] with a general linear model (GLM) and mixed linear model (MLM). An adjusted Bonferroni method was used to correct the multiple tests of GWAS, in which the p-value threshold was at p = 2.77 × 10⁻⁵ (1/n, n was the number of markers for GWAS) [47]. The genomic region of 100 kb upstream or downstream from a peak SNP marker was used for candidate gene identification.

Supplementary Materials

The following are available online at https://www.mdpi.com/2072-6651/12/3/156/s1, Figure S1: Distribution of pairwise relative kinship estimates, Figure S2: Heat-map of pairwise relative kinship estimates Figure S3: QQ plot for AFB1 and AFB2, Figure S4: LD decay, Table S1: Information for the 99 accessions used in this study, Table S2: Significant markers detected for AFB1 and AFB2 content in peanut seed, Table S3: Candidate genes information, Table S4: Pearson correlation for AFB1 and AFB2. Table S5: Meteorological data of peanut cultivation. Table S6: Soil nutrient content in the experimental field. Table S7, Sequences of adapters used in ligation reaction. Table S8, Overhang primers for polymerase chain rection.

Author Contributions

Conceptualization, B.Y., H.J. and B.L.; Funding acquisition, H.J. and B.L.; Investigation, B.Y., Y.K., W.C., J.G., W.L., Y.D. and Y.J.; Resources, H.J., X.Z., X.R. and Y.L.; Validation, B.Y.; Writing—original draft, B.Y.; Writing—review & editing, B.Y., H.J., M.K.P., L.H., D.H., X.Z., R.K.V., H.K.S., H.L., N.L. and B.L. All authors have read and agreed to the published version of the manuscript.

Funding

This research was funded by National Natural Science Foundation of China (31461143022 and 31761143005), National Key R&D Program of China (2018YFD0201000), Crop Germplasm Resources Protection Project of Ministry of Agriculture and Rural Affairs of the People’s Republic of China (2017NWB033), Plant Germplasm Resources Sharing Platform (NICGR2017-36) and China Agriculture Research System (SARS-13).

Conflicts of Interest

The authors declare no conflict of interest.

References

  1. Toomer, O.T. Nutritional chemistry of the peanut (Arachis hypogaea L.). Crit. Rev. Food Sci. Nutr. 2018, 58, 3042–3053. [Google Scholar] [CrossRef] [PubMed]
  2. Zhuang, W.; Chen, H.; Yang, M.; Wang, J.; Pandey, M.K.; Zhang, C.; Chang, W.; Zhang, L.; Zhang, X.; Tang, R.; et al. The genome of cultivated peanut provides insight into legume karyotypes, polyploid evolution and crop domestication. Nat. Genet. 2019, 51, 865–876. [Google Scholar] [CrossRef] [PubMed]
  3. Yield of Major Crop Products in China. Available online: http://data.stats.gov.cn/easyquery.htm?cn=C01 (accessed on 2 November 2019).
  4. Perrone, G.; Gallo, A. Mycotoxigenic Fungi: Methods and Protocols; Springer International Publishing: New York, NY, USA, 2017; pp. 33–49. [Google Scholar]
  5. Payne, G.A.; Brown, M.P. Genetics and physiology of aflatoxin biosynthesis. Annu. Rev. Phytopathol. 1998, 36, 329–362. [Google Scholar] [CrossRef] [PubMed]
  6. Kowalska, A.; Walkiewicz, K.; Koziel, P.; Muc-Wierzgon, M. Aflatoxins: Characteristics and impact on human health. Postepy Hig Med. Dosw. 2017, 71, 315–327. [Google Scholar] [CrossRef]
  7. Moretti, A.; Logrieco, A.F.; Susca, A. Mycotoxins: An underhand food problem. Methods Mol. Biol. 2016, 1542, 3–12. [Google Scholar]
  8. Chulze, S.N.; Palazzini, J.M.; Torres, A.M.; Barros, G.; Ponsone., M.L.; Geisen, R.; Schmidt-Heydt, M.; Kohl, J. Biological control as a strategy to reduce the impact of mycotoxins in peanuts, grapes and cereals in Argentina. Food Addit Contam, A 2015, 32, 471–479. [Google Scholar] [CrossRef] [PubMed]
  9. Palumbo, J.D.; Baker, J.L.; Mahoney, N.E. Isolation of bacterial antagonists of Aspergillus flavus from almonds. Microb Ecol. 2006, 52, 45–52. [Google Scholar] [CrossRef]
  10. Nesci, A.V.; Bluma, R.V.; Etcheverry, M.G. In vitro selection of maize rhizobacteria to study potential biological control of aspergillus section flavi and aflatoxin production. Eur. J. Plant. Pathol. 2005, 113, 159–171. [Google Scholar] [CrossRef]
  11. Dorner, J.W. Management and prevention of mycotoxins in peanuts. Food Addit Contam. 2008, 25, 203–208. [Google Scholar] [CrossRef]
  12. Pandey, M.K.; Kumar, R.; Pandey, A.K.; Soni, P.; Gangurde, S.S.; Sudini, H.K.; Fountain, J.C.; Liao, B.; Desmae, H.; Okori, P.; et al. Mitigating aflatoxin contamination in groundnut through a combination of genetic resistance and post-harvest management practices. Toxins 2019, 11, 315. [Google Scholar] [CrossRef] [Green Version]
  13. Asare-Bediako, K.; Ofori, K.; Offei, S.K.; Dzidzienyo, D.; Asibuo, J.Y.; Adu-Amoah, R. Aflatoxin contamination of groundnut (Arachis hypogaea L.): Predisposing factors and management interventions. Food Control 2019, 98, 61–67. [Google Scholar] [CrossRef]
  14. Liao, B.; Zhuang, W.; Tang, R.; Zhang, X.; Shan, S.; Jiang, H.; Huang, J. Peanut aflatoxin and genomics research in China: Progress and perspectives. Peanut Sci. 2009, 36, 21–28. [Google Scholar] [CrossRef]
  15. Zhao, J.; Huang, L.; Ren, X.; Pandey, M.K.; Wu, B.; Chen, Y.; Zhou, X.; Chen, W.; Xia, Y.; Li, Z.; et al. Genetic variation and association mapping of seed-related traits in cultivated peanut (Arachis hypogaea L.) using single-locus simple sequence repeat markers. Front. Plant. Sci. 2017, 8, 2105. [Google Scholar] [CrossRef] [PubMed] [Green Version]
  16. Mahanti, N.; Bhatnagar, D.; Cary, J.W.; Joubran, J.; Linz, J.E. Structure and function of fas-1A, a gene encoding a putative fatty acid synthetase directly involved in aflatoxin biosynthesis in Aspergillus parasiticus. Appl Environ. Microbiol. 1996, 62, 191–195. [Google Scholar] [CrossRef] [Green Version]
  17. Minto, R.E.; Townsend, C.A. Enzymology and molecular biology of aflatoxin biosynthesis. Chem. Rev. 1997, 97, 2537–2556. [Google Scholar] [CrossRef]
  18. Roze, L.V.; Hong, S.Y.; Linz, J.E. Aflatoxin biosynthesis: Current frontiers. Annu. Rev. Food Sci. Technol. 2013, 4, 293–311. [Google Scholar] [CrossRef]
  19. Bhatnagar, D.; Rajasekaran, K.; Payne, G.; Brown, R.; Yu, J.; Cleveland, T. The ‘omics’ tools: Genomics, proteomics, metabolomics and their potential for solving the aflatoxin contamination problem. World MycotoxinJ. 2008, 1, 3–12. [Google Scholar] [CrossRef]
  20. Bhatnagarmathur, P.; Sunkara, S.; Bhatnagarpanwar, M.; Waliyar, F.; Sharma, K.K. Biotechnological advances for combating Aspergillus flavus and aflatoxin contamination in crops. Plant. Sci. 2015, 234, 119–132. [Google Scholar] [CrossRef] [Green Version]
  21. Huang, L.; Liu, X.; Pandey, M.K.; Ren, X.; Chen, H.; Xue, X.; Liu, N.; Huai, D.; Chen, Y.; Zhou, X.; et al. Genome-wide expression quantitative trait locus analysis in a recombinant inbred line population for trait dissection in peanut. Plant. Biotechnol. J. 2019. [Google Scholar] [CrossRef] [Green Version]
  22. Luo, H.; Pandey, M.K.; Khan, A.W.; Wu, B.; Guo, J.; Ren, X.; Zhou, X.; Chen, Y.; Chen, W.; Huang, L.; et al. Next-generation sequencing identified genomic region and diagnostic markers for resistance to bacterial wilt on chromosome B02 in peanut (Arachis hypogaea L.). Plant. Biotechnol. J. 2019, 17, 2356–2369. [Google Scholar] [CrossRef] [Green Version]
  23. Wang, L.; Zhou, X.; Ren, X.; Huang, L.; Luo, H.; Chen, Y.; Chen, W.; Liu, N.; Liao, B.; Lei, Y.; et al. A major and stable QTL for bacterial wilt resistance on chromosome B02 Identified using a high-density SNP-based genetic linkage map in cultivated peanut Yuanza 9102 derived population. Front. Genet. 2018, 9, 652. [Google Scholar] [CrossRef] [PubMed]
  24. Luo, H.; Pandey, M.K.; Khan, A.W.; Guo, J.; Wu, B.; Cai, Y.; Huang, L.; Zhou, X.; Chen, Y.; Chen, W.; et al. Discovery of genomic regions and candidate genes controlling shelling percentage using QTL-seq approach in cultivated peanut (Arachis hypogaea L.). Plant. Biotechnol. J. 2019, 17, 1248–1260. [Google Scholar] [CrossRef] [Green Version]
  25. Wan, L.; Li, B.; Lei, Y.; Yan, L.; Huai, D.; Kang, Y.; Jiang, H.; Tan, J.; Liao, B. Transcriptomic profiling reveals pigment regulation during peanut testa development. Plant. Physiol. Biochem. 2018, 125, 116–125. [Google Scholar] [CrossRef]
  26. Davey, J.W.; Blaxter, M.L. RADSeq: Next-generation population genetics. Brief. Funct Genom. 2010, 9, 416–423. [Google Scholar] [CrossRef] [PubMed]
  27. Zhou, X.; Xia, Y.; Ren, X.; Chen, Y.; Huang, L.; Huang, S.; Liao, B.; Lei, Y.; Yan, L.; Jiang, H.; et al. Construction of a SNP-based genetic linkage map in cultivated peanut based on large scale marker development using next-generation double-digest restriction-site-associated DNA sequencing (ddRADseq). Bmc Genom. 2014, 15, 351. [Google Scholar] [CrossRef] [PubMed] [Green Version]
  28. Zhao, Y.; Zhang, C.; Chen, H.; Yuan, M.; Nipper, R.; Prakash, C.S.; Zhuang, W.; He, G. QTL mapping for bacterial wilt resistance in peanut (Arachis hypogaea L.). Mol. Breed. 2016, 36, 13. [Google Scholar] [CrossRef] [Green Version]
  29. Liu, N.; Guo, J.; Zhou, X.; Wu, B.; Huang, L.; Luo, H.; Chen, Y.; Chen, W.; Lei, Y.; Huang, Y.; et al. High-resolution mapping of a major and consensus quantitative trait locus for oil content to a ~ 0.8-Mb region on chromosome A08 in peanut (Arachis hypogaea L.). Appl. Genet. 2019. [Google Scholar] [CrossRef] [Green Version]
  30. Yu, B.; Huai, D.; Huang, L.; Kang, Y.; Ren, X.; Chen, Y.; Zhou, X.; Luo, H.; Liu, N.; Chen, W.; et al. Identification of genomic regions and diagnostic markers for resistance to aflatoxin contamination in peanut (Arachis hypogaea L.). BMC Genet 2019, 20, 32. [Google Scholar] [CrossRef] [Green Version]
  31. Jiang, H.; Huang, L.; Ren, X.; Chen, Y.; Zhou, X.; Xia, Y.; Huang, J.; Lei, Y.; Yan, L.; Wan, L.; et al. Diversity characterization and association analysis of agronomic traits in a Chinese peanut (Arachis hypogaea L.) mini-core collection. J. Integr. Plant. Biol 2014, 56, 159–169. [Google Scholar] [CrossRef]
  32. Fountain, J.C.; Scully, B.T.; Ni, X.; Kemerait, R.C.; Lee, R.D.; Chen, Z.Y.; Guo, B. Environmental influences on maize-Aspergillus flavus interactions and aflatoxin production. Front. Microbiol. 2014, 5, 40. [Google Scholar] [CrossRef]
  33. Arunyanark, A.; Jogloy, S.; Wongkaew, S.; Akkasaeng, C.; Vorasoot, N.; Wright, G.C.; Rachaputi, R.C.N.; Patanothai, A. Association between aflatoxin contamination and drought tolerance traits in peanut. Field Crop. Res. 2009, 114, 14–22. [Google Scholar] [CrossRef]
  34. Girdthai, T.; Jogloy, S.; Vorasoot, N.; Akkasaeng, C.; Wongkae, S.; Holbrook, C.C.; Patanothai, A. Associations between physiological traits for drought tolerance and aflatoxin contamination in peanut genotypes under terminal drought. Plant. Breed. 2010, 129, 693–699. [Google Scholar] [CrossRef]
  35. Kebede, H.; Abbas, H.K.; Fisher, D.K.; Bellaloui, N. Relationship between Aflatoxin contamination and physiological responses of corn plants under drought and heat stress. Toxins 2012, 4, 1385–1403. [Google Scholar] [CrossRef] [PubMed]
  36. Yabe, K.; Nakajima, H. Enzyme reactions and genes in aflatoxin biosynthesis. Appl. Microbiol. Biotechnol. 2004, 64, 745–755. [Google Scholar] [CrossRef] [PubMed]
  37. Zhang, X.; Zhang, J.; He, X.; Wang, Y.; Ma, X.; Yin, D. Genome-wide association study of major agronomic traits related to domestication in peanut. Front. Plant. Sci. 2017, 8, 1611. [Google Scholar] [CrossRef] [Green Version]
  38. Wang, X.; Xu, P.; Yin, L.; Ren, Y.; Li, S.; Shi, Y.; Alcock, T.D.; Xiong, Q.; Qian, W.; Chi, X.; et al. Genomic and transcriptomic analysis identified gene clusters and candidate genes for oil content in peanut (Arachis hypogaea L.). Plant. Mol. Biol. Rep. 2018, 36, 518–529. [Google Scholar] [CrossRef] [Green Version]
  39. Nelson, D.; Sommers, L. Methods of Soil Analysis; American Society of Agronomy: Madison, WI, USA, 1982; pp. 539–577. Available online: https://dl.sciencesocieties.org/publications/books/pdfs/agronomymonogra/methodsofsoilan2/frontmatter (accessed on 2 February 2020).
  40. ISSCAS (Institute of Soil Science, Chinese Academy of Science). Physical and Chemical Analysis Methods of Soils; Shanghai Science and Technology Press: Shanghai, China, 1978; pp. 7–59, (In Chinese). Available online: http://www.irgrid.ac.cn/handle/1471x/112649# (accessed on 2 February 2020).
  41. Bertioli, D.J.; Cannon, S.B.; Froenicke, L.; Huang, G.; Farmer, A.D.; Cannon, E.K.S.; Liu, X.; Gao, D.; Clevenger, J.; Dash, S.; et al. The genome sequences of Arachis duranensis and Arachis ipaensis, the diploid ancestors of cultivated peanut. Nat.Genet. 2016, 48, 438. [Google Scholar] [CrossRef]
  42. Li, H.; Handsaker, B.; Wysoker, A.; Fennell, T.; Ruan, J.; Homer, N.; Marth, G.; Abecasis, G.; Durbin, R. The sequence alignment/map format and SAMtools. Bioinformatics 2009, 25, 2078–2079. [Google Scholar] [CrossRef] [Green Version]
  43. McKenna, A.; Hanna, M.; Banks, E.; Sivachenko, A.; Cibulskis, K.; Kernytsky, A.; Garimella, K.; Altshuler, D.; Gabriel, S.; Daly, M.; et al. The genome analysis toolkit: A map reduce framework for analyzing next-generation DNA sequencing data. Genome Res. 2010, 20, 1297–1303. [Google Scholar] [CrossRef] [Green Version]
  44. Pritchard, J.K.; Stephens, M.; Donnelly, P. Inference of population structure using multilocus genotype data. Genet. 2000, 155, 945–959. [Google Scholar]
  45. Evanno, G.; Regnaut, S.; Goudet, J. Detecting the number of clusters of individuals using the software structure: A simulation study. Mol. Ecol. 2005, 14, 2611–2620. [Google Scholar] [CrossRef] [PubMed] [Green Version]
  46. Bradbury, P.J.; Zhang, Z.; Kroon, D.; Casstevens, T.M.; Ramdoss, Y.; Buckler, E.S. TASSEL: Software for association mapping of complex traits in diverse samples. Bioinformatics 2007, 23, 2633–2635. [Google Scholar] [CrossRef] [PubMed]
  47. Wei, L.; Jian, H.; Lu, K.; Filardo, F.; Yin, N.; Liu, L.; Qu, C.; Li, W.; Du, H.; Li, J. Genome-wide association analysis and differential expression analysis of resistance to Sclerotinia stem rot in Brassica napus. Plant. Biotechnol. J. 2016, 14, 1368–1380. [Google Scholar] [CrossRef] [PubMed] [Green Version]
Figure 1. Phenotypic distribution of aflatoxin production in a three-year observation.
Toxins 12 00156 g001
Figure 2. Box plot and multiple comparisons of aflatoxin production in five botanical types.
Toxins 12 00156 g002
Figure 3. (a) Two different methods for determining the optimal value of K; (b) scatter plot of first three principal components of association panel; and (c) dendrogram of association panel based on genotype data.
Toxins 12 00156 g003
Figure 4. Genome-wide association for AFB1 and AFB2 content in peanut seeds.
Toxins 12 00156 g004
Table 1. Phenotypic variations of AFB1 and AFB2 of the association panel.
TraitsEnv cRangeMeanSD dCV e
AFB1 (μg/g) a201525.92–550.17184.0893.140.51
201611.69–505.01114.4594.390.82
201726.08–526.21193.0191.840.48
AFB2 (μg/g) b20150.98–41.6015.069.420.63
20160.58–57.0811.409.990.88
20177.00–63.4225.2511.880.47
a aflatoxin B1 content; b aflatoxin B2 content; c environment; d standard deviation; e coefficient of variation.
Table 2. Analysis of variance for AFB1 and AFB2 in the association panel across three environments.
TraitsSourceDF cSS dMS eF Valuep Valueб2fh2g
AFB1 aGenotype984106986 41908 9.18 <0.0012667.69 0.57
Environment21077196 539598 117.97 <0.0011756.56
Genotype × Environment1963508164 17899 3.92 <0.0014444.76
Error5942711315 4565 4564.50
AFB2 bGenotype9848863 499 5.96 <0.00128.52 0.51
Environment230454 15227 182.19 <0.00150.45
Genotype × Environment19647409 242 1.20 <0.00152.77
Error59449644 84 83.58
a aflatoxin B1 content; b aflatoxin B2 content; c degree of freedom; d sum of squares; e mean square; f variance; g broad-sense heritability.
Table 3. Pearson correlation between AFB1 and AFB2.
Env aPearson Correlation between AFB1 and AFB2p-Value
20150.88<0.01
20160.99<0.01
20170.78<0.01
a environment.
Table 4. Extreme peanut accessions with aflatoxin production resistance.
TraitsGroupAccession NumberVar Type2015Env c2016Env2017EnvAverage
AFB1(μg/g) aSusceptible controlZh.h4600var.vulgaris392.31450.17310.45384.31
Zh.h3231var.fastigiata247.43409.57368.59341.86
Low contentZh.h0551var.hirsuta39.0021.4233.0831.17
Zh.h2150var.vulgaris49.7420.7131.1033.85
AFB2(μg/g) bSusceptible controlZh.h4600var.vulgaris37.8345.0825.5536.15
Zh.h3231var.fastigiata28.2732.1344.3234.91
Low contentZh.h0551var.hirsuta8.335.196.326.61
Zh.h2150var.vulgaris5.274.139.576.32
a aflatoxin B1 content; b aflatoxin B2 content; c environment.
Table 5. The number and density of SNP markers detected across peanut chromosomes.
ChromosomeSNP NumberMarker Start Loci (Kb)Marker End Loci (Mb)Reference Length (Mb)Density of Markers (kb/SNP)
A0118561621.08106.90105.2856.72
A021512165.4093.5393.3661.75
A03238769.80134.58134.5156.35
A042317277.02123.31123.0353.10
A052019252.20109.66109.4154.19
A061774302.81112.63112.3263.32
A071116201.9779.0978.8970.69
A08599519.8949.0948.5781.09
A092125276.41120.36120.0856.51
A102184156.37109.21109.0549.93
B011560136.00137.19137.0587.85
B021635137.78108.93108.7966.54
B031967101.11135.70135.6068.94
B042000176.67133.52133.3566.67
B0517573440.92149.75146.3183.27
B061743124.59135.87135.7577.88
B071608247.60126.20125.9578.33
B081864578.78129.60129.0269.22
B092373135.20146.85146.7261.83
B10168934.68135.89135.8680.44
Table 6. Phenotypic effect of SNP02686 and SNP19994 in association panel.
SNP MarkerGenotypenAFB1AFB2
SNP02686AA3312.57 ± 21.93 a38.15 ± 1.59 a
GG6195.35 ± 37.99 b19.20 ± 7.24 b
GA80159.88 ± 62.86 b16.57 ± 6.54 b
SNP19994AA9223.56 ± 38.64 a25.37 ± 9.12 a
GG3160.75 ± 34.74 b16.62 ± 4.76 b
GA79145.08 ± 31.12 b14.25 ± 2.67 b
n: number of genotypes.

