Human Biomonitoring of Mycotoxins in Blood, Plasma and Serum in Recent Years: A Review


Abstract
1. Introduction
2. Results
2.1. Human Biomonitoring of Mycotoxin Exposure
2.2. Mycotoxin Determination in Human Blood, Plasma and Serum
2.3. Mycotoxin Biomarkers in Human Blood, Plasma and Serum
2.3.1. Single-Biomarker Studies.
2.3.2. Multi-Biomarker Studies
2.4. Risk Characterization
3. Conclusions
4. Materials and Methods
Author Contributions
Funding
Conflicts of Interest
Abbreviations
| 3-ADON | 3-acetyldeoxynivalenol |
| 15-ADON | 15-acetyldeoxynivalenol |
| 10-OH-OTA | 10-hydroxyochratoxin A |
| 2’R-OTA | 2’R-ochratoxin A |
| ACN | acetonitrile |
| ADON | acetyldeoxynivalenol |
| AF-adducts | adducts of aflatoxins |
| AFB1 | aflatoxin B1 |
| AFB1-alb | adduct of AFB1 with albumin |
| AFB1-lys | adduct of AFB1 with lysine |
| AFB2 | aflatoxin B2 |
| AFG1 | aflatoxin G1 |
| AFG2 | aflatoxin G2 |
| AFM1 | aflatoxin M1 |
| AFM2 | aflatoxin M2 |
| AFOH | aflatoxicol |
| AFs | aflatoxins |
| ALT | altenuene |
| AME | alternariol monomethyl ether: |
| AOH | alternariol |
| APCI | atmospheric pressure chemical ionization |
| ARfD | acute reference dose |
| ASD | autism spectrum disorder |
| BEA | beauvericin |
| bw | body weight |
| CHB | chronic hepatitis B |
| CLB | chronic liver disease |
| CIT | citrinin |
| CRC | colorectal cancer |
| DAS | diacetoxyscirpenol |
| DH-CIT | dihydrocitrinone |
| DOM-1 | deepoxy-deoxynivalenol |
| DON | deoxynivalenol |
| DON-3-GlcA | deoxynivalenol-3-glucuronide |
| DON-15-GlcA | deoxynivalenol-15-glucuronide |
| EDI | estimated daily intake |
| EFSA | European Food Safety Authority |
| ELISA | Enzyme-Linked Immunosorbent Assay |
| EnA | enniatin A |
| EnA1 | enniatin A1 |
| EnB | enniatin B |
| EnB1 | enniatin B1 |
| Ens | enniatins |
| ESI | electrospray ionization |
| EtOAc | ethylacetate |
| FB1 | fumonisin B1 |
| FB2 | fumonisin B2 |
| FBs | fumonisins |
| FDA | Food and Drug Administration |
| FLD | fluorescence detector |
| FUS-X | fusarenon-X |
| GBC | gallbladder cancer |
| GLIO | gliotoxin |
| HBGV | health-based guidance values |
| HBM | human biological monitoring |
| HCC | hepatocellular carcinoma |
| HRMS | high-resolution mass spectrometry |
| HT-2 | HT-2 toxin |
| HT-2-4-GlcA | HT-2-toxin-4-glucuronide |
| IAC | immunoaffinity columns |
| IARC | International Agency for Research on Cancer |
| ID-MS | isotope dilution mass spectrometry |
| JECFA | Joint FAO/WHO Expert Committee on Food Additives |
| LC | liquid chromatography |
| LC-FLD | LC coupled with fluorescence detector |
| LC-HRMS | LC coupled with High-resolution mass spectrometry |
| LC-MS/MS | LC coupled with tandem mass spectrometry |
| LLE | liquid-liquid extraction |
| LOD | limit of detection |
| LOQ | limit of quantification |
| MeOH | methanol |
| MOE | margin of exposure |
| MRM | multiple reaction monitoring |
| MS | mass spectrometer |
| NIV | nivalenol |
| OTα | ochratoxin α |
| OTA | ochratoxin A |
| PAT | patulin |
| PBS | phosphate buffer solution |
| QqQ | triple quadrupole |
| QTrap | quadrupole-ion trap |
| QuEChERS | Quick Easy Cheap Effective Rugged and Safe |
| SRM | selective reaction monitoring |
| SAM | severe acute malnutrition |
| SPE | solid-phase extraction |
| STER | sterigmatocystin |
| T-2 | T-2 toxin |
| TDI | tolerable daily intake |
| TWI | tolerable weekly intake |
| UHPLC | ultra-LC |
| ZAL | zearalanol |
| ZAN | zearalanone |
| ZAN-14-GlcA | zearalanone-14- glucuronide |
| ZEA | zearalenone |
| ZEA-14-GlcA | zearalenone-14- glucuronide |
| ZEL | zearalenol |
References
- Sulyok, M.; Krska, R.; Schuhmacher, R. A liquid chromatography/tandem mass spectrometric multi-mycotoxin method for the quantification of 87 analytes and its application to semi-quantitative screening of moldy food samples. Anal. Bioanal. Chem. 2007, 389, 1505–1523. [Google Scholar] [CrossRef] [PubMed]
- Pulina, G.; Battacone, G.; Brambilla, G.; Cheli, F.; Danieli, P.P.; Masoero, F.; Pietri, A.; Ronchi, B. An Update on the Safety of Foods of Animal Origin and Feeds. Ital. J. Anim. Sci. 2014, 13, 3571. [Google Scholar] [CrossRef]
- Turner, N.W.; Bramhmbhatt, H.; Szabo-Vezse, M.; Poma, A.; Coker, R.; Piletsky, S.A. Analytical methods for determination of mycotoxins: An update (2009–2014). Anal. Chim. Acta 2015, 901, 12–33. [Google Scholar] [CrossRef] [PubMed]
- Alshannaq, A.; Yu, J.-H. Occurrence, Toxicity, and Analysis of Major Mycotoxins in Food. Int. J. Environ. Res. Public Health 2017, 14, 632. [Google Scholar] [CrossRef]
- Binder, E.M. Managing the risk of mycotoxins in modern feed production. Anim. Feed Sci. Technol. 2007, 133, 149–166. [Google Scholar] [CrossRef]
- Battilani, P.; Toscano, P.; Van Der Fels-Klerx, H.J.; Moretti, A.; Camardo Leggieri, M.; Brera, C.; Rortais, A.; Goumperis, T.; Robinson, T. Aflatoxin B 1 contamination in maize in Europe increases due to climate change. Sci. Rep. 2016, 6, 1–7. [Google Scholar] [CrossRef]
- Battilani, P.; Rossi, V.; Giorni, P.; Pietri, A.; Gualla, A.; van der Fels-Klerx, H.J.; Booij, C.J.H.; Moretti, A.; Logrieco, A.; Miglietta, F.; et al. Modelling, predicting and mapping the emergence of aflatoxins in cereals in the EU due to climate change. EFSA Support. Publ. 2012, 9, 1–172. [Google Scholar] [CrossRef]
- Schaarschmidt, S.; Fauhl-Hassek, C. The Fate of Mycotoxins During the Processing of Wheat for Human Consumption. Compr. Rev. Food Sci. Food Saf. 2018, 17, 556–593. [Google Scholar] [CrossRef]
- Eskola, M.; Kos, G.; Elliott, C.T.; Hajšlová, J.; Mayar, S.; Krska, R. Worldwide contamination of food-crops with mycotoxins: Validity of the widely cited ‘FAO estimate’ of 25%. Crit. Rev. Food Sci. Nutr. 2019, 1–17. [Google Scholar] [CrossRef]
- International Agency for Research on Cancer (IARC). Improving Public Health through Mycotoxin Control; Pitt, J.I., Wild, C.P., Baan, R.A., Gelderblom, W.C.A., Miller, J., Riley, R.T., Wu, F., Eds.; IARC: Lyon, France, 2012; ISBN 978-92-832-2214-9. [Google Scholar]
- Cano-Sancho, G.; Sanchis, V.; Marín, S.; Ramos, A.J. Occurrence and exposure assessment of aflatoxins in Catalonia (Spain). Food Chem. Toxicol. 2013, 51, 188–193. [Google Scholar] [CrossRef]
- Pfliegler, W.P.; Pusztahelyi, T.; Pócsi, I. Mycotoxins - prevention and decontamination by yeasts. J. Basic Microbiol. 2015, 55, 805–818. [Google Scholar] [CrossRef] [PubMed]
- Pinotti, L.; Ottoboni, M.; Giromini, C.; Dell’Orto, V.; Cheli, F. Mycotoxin Contamination in the EU Feed Supply Chain: A Focus on Cereal Byproducts. Toxins 2016, 8, 45. [Google Scholar] [CrossRef] [PubMed]
- Bryden, W.L. Mycotoxin contamination of the feed supply chain: Implications for animal productivity and feed security. Anim. Feed Sci. Technol. 2012, 173, 134–158. [Google Scholar] [CrossRef]
- Hussein, H.S.; Brasel, J.M. Toxicity, metabolism, and impact of mycotoxins on humans and animals. Toxicology 2001, 167, 101–134. [Google Scholar] [CrossRef]
- Zachariasova, M.; Dzuman, Z.; Veprikova, Z.; Hajkova, K.; Jiru, M.; Vaclavikova, M.; Zachariasova, A.; Pospichalova, M.; Florian, M.; Hajslova, J. Occurrence of multiple mycotoxins in European feedingstuffs, assessment of dietary intake by farm animals. Anim. Feed Sci. Technol. 2014, 193, 124–140. [Google Scholar] [CrossRef]
- Waseem, A.; Ahmad Shah, S.; Sajjad, A.; Rauf Siddiqi, A.; Nafees, M.; Shah, S.A.; Sajjad, A.; Siddiqi, A.R.; Nafees, M. Human Exposure to Mycotoxins: A Retrospective Review of Leading Toxins and Metabolites in Human Biological Matrices. J. Chem. Soc. Pakistan 2014, 36, 1196–1214. [Google Scholar]
- Streit, E.; Schatzmayr, G.; Tassis, P.; Tzika, E.; Marin, D.; Taranu, I.; Tabuc, C.; Nicolau, A.; Aprodu, I.; Puel, O.; et al. Current Situation of Mycotoxin Contamination and Co-occurrence in Animal Feed—Focus on Europe. Toxins 2012, 4, 788–809. [Google Scholar] [CrossRef]
- International Agency for Research on Cancer (IARC). Some Naturally Occurring Substances: Food Items and Constituents, Heterocyclic Aromatic Amines and Mycotoxins; IARC: Lyon, France, 1993; Volume 56, ISBN 978-92-832-1256-0. [Google Scholar]
- Norbäck, D.; Hashim, J.H.; Cai, G.-H.; Hashim, Z.; Ali, F.; Bloom, E.; Larsson, L. Rhinitis, Ocular, Throat and Dermal Symptoms, Headache and Tiredness among Students in Schools from Johor Bahru, Malaysia: Associations with Fungal DNA and Mycotoxins in Classroom Dust. PLoS ONE 2016, 11, e0147996. [Google Scholar] [CrossRef]
- Abdulrazzaq, Y.M.; Osman, N.; Ibrahim, A. Fetal exposure to aflatoxins in the United Arab Emirates. Ann. Trop. Paediatr. 2002, 22, 3–9. [Google Scholar] [CrossRef]
- Al-Jaal, B.A.; Jaganjac, M.; Barcaru, A.; Horvatovich, P.; Latiff, A. Aflatoxin, fumonisin, ochratoxin, zearalenone and deoxynivalenol biomarkers in human biological fluids: A systematic literature review, 2001–2018. Food Chem. Toxicol. 2019, 129, 211–228. [Google Scholar] [CrossRef]
- Degen, G.H.; Ali, N.; Gundert-Remy, U. Preliminary data on citrinin kinetics in humans and their use to estimate citrinin exposure based on biomarkers. Toxicol. Lett. 2018, 282, 43–48. [Google Scholar] [CrossRef] [PubMed]
- Coronel, M.B.; Sanchis, V.; Ramos, A.J.; Marin, S. Review. Ochratoxin A: Presence in Human Plasma and Intake Estimation. Food Sci. Technol. Int. 2010, 16, 5–18. [Google Scholar] [CrossRef] [PubMed]
- Solfrizzo, M.; Gambacorta, L.; Visconti, A. Assessment of Multi-Mycotoxin Exposure in Southern Italy by Urinary Multi-Biomarker Determination. Toxins 2014, 6, 523–538. [Google Scholar] [CrossRef]
- Heyndrickx, E.; Sioen, I.; Huybrechts, B.; Callebaut, A.; De Henauw, S.; De Saeger, S. Human biomonitoring of multiple mycotoxins in the Belgian population: Results of the BIOMYCO study. Environ. Int. 2015, 84, 82–89. [Google Scholar] [CrossRef] [PubMed]
- Rushing, B.R.; Selim, M.I. Aflatoxin B1: A review on metabolism, toxicity, occurrence in food, occupational exposure, and detoxification methods. Food Chem. Toxicol. 2019, 124, 81–100. [Google Scholar] [CrossRef] [PubMed]
- Rychlik, M.; Humpf, H.-U.; Marko, D.; Dänicke, S.; Mally, A.; Berthiller, F.; Klaffke, H.; Lorenz, N. Proposal of a comprehensive definition of modified and other forms of mycotoxins including “masked” mycotoxins. Mycotoxin Res. 2014, 30, 197–205. [Google Scholar] [CrossRef]
- Gurusankar, R.; Yenugadhati, N.; Krishnan, K.; Hays, S.; Haines, D.; Zidek, A.; Kuchta, S.; Kinniburgh, D.; Gabos, S.; Mattison, D.; et al. The role of human biological monitoring in health risk assessment. Int. J. Risk Assess. Manag. 2017, 20, 136–197. [Google Scholar] [CrossRef]
- Turner, P.C.; Flannery, B.; Isitt, C.; Ali, M.; Pestka, J. The role of biomarkers in evaluating human health concerns from fungal contaminants in food. Nutr. Res. Rev. 2012, 25, 162–179. [Google Scholar] [CrossRef]
- Escrivá, L.; Font, G.; Manyes, L.; Berrada, H. Studies on the Presence of Mycotoxins in Biological Samples: An Overview. Toxins 2017, 9, 251. [Google Scholar] [CrossRef]
- Shephard, G.S. Aflatoxin analysis at the beginning of the twenty-first century. Anal. Bioanal. Chem. 2009, 395, 1215–1224. [Google Scholar] [CrossRef]
- Fromme, H.; Gareis, M.; Völkel, W.; Gottschalk, C. Overall internal exposure to mycotoxins and their occurrence in occupational and residential settings – An overview. Int. J. Hyg. Environ. Health 2016, 219, 143–165. [Google Scholar] [CrossRef] [PubMed]
- Malir, F.; Ostry, V.; Pfohl-Leszkowicz, A.; Malir, J.; Toman, J. Ochratoxin A: 50 Years of Research. Toxins 2016, 8, 191. [Google Scholar] [CrossRef] [PubMed]
- Soto, J.B.; Ruiz, M.-J.; Manyes, L.; Juan-García, A. Blood, breast milk and urine: Potential biomarkers of exposure and estimated daily intake of ochratoxin A: A review. Food Addit. Contam. Part A 2015, 33, 313–328. [Google Scholar] [CrossRef] [PubMed]
- Ropejko, K.; Twarużek, M. The occurrence of ochratoxin A in human body fluids – review. Toxin Rev. 2019, 38, 1–14. [Google Scholar] [CrossRef]
- Leong, Y.-H.; Latiff, A.A.; Ahmad, N.I.; Rosma, A. Exposure measurement of aflatoxins and aflatoxin metabolites in human body fluids. A short review. Mycotoxin Res. 2012, 28, 79–87. [Google Scholar] [CrossRef]
- Marín, S.; Cano-Sancho, G.; Sanchis, V.; Ramos, A.J. The role of mycotoxins in the human exposome: Application of mycotoxin biomarkers in exposome-health studies. Food Chem. Toxicol. 2018, 121, 504–518. [Google Scholar] [CrossRef]
- Tesfamariam, K.; De Boevre, M.; Kolsteren, P.; Belachew, T.; Mesfin, A.; De Saeger, S.; Lachat, C. Dietary mycotoxins exposure and child growth, immune system, morbidity, and mortality: A systematic literature review. Crit. Rev. Food Sci. Nutr. 2019, 59, 1–21. [Google Scholar] [CrossRef]
- Duarte, S.C.; Pena, A.; Lino, C.M. Human ochratoxin A biomarkers—From exposure to effect. Crit. Rev. Toxicol. 2011, 41, 187–212. [Google Scholar] [CrossRef]
- Degen, G. Tools for investigating workplace-related risks from mycotoxin exposure. World Mycotoxin J. 2011, 4, 315–327. [Google Scholar] [CrossRef]
- Choi, J.; Aarøe Mørck, T.; Polcher, A.; Knudsen, L.E.; Joas, A. Review of the state of the art of human biomonitoring for chemical substances and its application to human exposure assessment for food safety. EFSA Support. Publ. 2015, 12, EN-724. [Google Scholar] [CrossRef]
- Vidal, A.; Mengelers, M.; Yang, S.; De Saeger, S.; De Boevre, M. Mycotoxin Biomarkers of Exposure: A Comprehensive Review. Compr. Rev. Food Sci. Food Saf. 2018, 17, 1127–1155. [Google Scholar] [CrossRef]
- Freire, L.; Sant’Ana, A.S. Modified mycotoxins: An updated review on their formation, detection, occurrence, and toxic effects. Food Chem. Toxicol. 2018, 111, 189–205. [Google Scholar] [CrossRef] [PubMed]
- Broekaert, N.; Devreese, M.; De Baere, S.; De Backer, P.; Croubels, S. Modified Fusarium mycotoxins unmasked: From occurrence in cereals to animal and human excretion. Food Chem. Toxicol. 2015, 80, 17–31. [Google Scholar] [CrossRef] [PubMed]
- Berthiller, F.; Crews, C.; Dall’Asta, C.; De Saeger, S.; Haesaert, G.; Karlovsky, P.; Oswald, I.P.; Seefelder, W.; Speijers, G.; Stroka, J. Masked mycotoxins: A review. Mol. Nutr. Food Res. 2013, 57, 165–186. [Google Scholar] [CrossRef]
- McCormick, S.P.; Kato, T.; Maragos, C.M.; Busman, M.; Lattanzio, V.M.T.; Galaverna, G.; Dall-Asta, C.; Crich, D.; Price, N.P.J.; Kurtzman, C.P. Anomericity of T-2 Toxin-glucoside: Masked Mycotoxin in Cereal Crops. J. Agric. Food Chem. 2015, 63, 731–738. [Google Scholar] [CrossRef] [PubMed]
- Slobodchikova, I.; Vuckovic, D. Liquid chromatography – high resolution mass spectrometry method for monitoring of 17 mycotoxins in human plasma for exposure studies. J. Chromatogr. A 2018, 1548, 51–63. [Google Scholar] [CrossRef]
- McMillan, A.; Renaud, J.B.; Burgess, K.M.N.; Orimadegun, A.E.; Akinyinka, O.O.; Allen, S.J.; Miller, J.D.; Reid, G.; Sumarah, M.W. Aflatoxin exposure in Nigerian children with severe acute malnutrition. Food Chem. Toxicol. 2018, 111, 356–362. [Google Scholar] [CrossRef]
- Solfrizzo, M.; Gambacorta, L.; Lattanzio, V.M.T.; Powers, S.; Visconti, A. Simultaneous LC–MS/MS determination of aflatoxin M1, ochratoxin A, deoxynivalenol, de-epoxydeoxynivalenol, α and β-zearalenols and fumonisin B1 in urine as a multi-biomarker method to assess exposure to mycotoxins. Anal. Bioanal. Chem. 2011, 401, 2831–2841. [Google Scholar] [CrossRef]
- Ahn, J.; Kim, D.; Kim, H.; Jahng, K.-Y. Quantitative determination of mycotoxins in urine by LC-MS/MS. Food Addit. Contam. Part A 2010, 27, 1674–1682. [Google Scholar] [CrossRef]
- Barr, D.B.; Wilder, L.C.; Caudill, S.P.; Gonzalez, A.J.; Needham, L.L.; Pirkle, J.L. Urinary Creatinine Concentrations in the U.S. Population: Implications for Urinary Biologic Monitoring Measurements. Environ. Health Perspect. 2005, 113, 192–200. [Google Scholar] [CrossRef]
- Ouhibi, S.; Vidal, A.; Martins, C.; Gali, R.; Hedhili, A.; De Saeger, S.; De Boevre, M. LC-MS/MS methodology for simultaneous determination of patulin and citrinin in urine and plasma applied to a pilot study in colorectal cancer patients. Food Chem. Toxicol. 2020, 136, 110994. [Google Scholar] [CrossRef] [PubMed]
- Malir, F.; Louda, M.; Ostry, V.; Toman, J.; Ali, N.; Grosse, Y.; Malirova, E.; Pacovsky, J.; Pickova, D.; Brodak, M.; et al. Analyses of biomarkers of exposure to nephrotoxic mycotoxins in a cohort of patients with renal tumours. Mycotoxin Res. 2019, 35, 391–403. [Google Scholar] [CrossRef] [PubMed]
- Ali, N.; Hossain, K.; Degen, G.H. Blood plasma biomarkers of citrinin and ochratoxin A exposure in young adults in Bangladesh. Mycotoxin Res. 2018, 34, 59–67. [Google Scholar] [CrossRef] [PubMed]
- Ali, N.; Degen, G.H. Citrinin biomarkers: A review of recent data and application to human exposure assessment. Arch. Toxicol. 2019, 93, 3057–3066. [Google Scholar] [CrossRef] [PubMed]
- Aydın, M.; Aydın, S.; Bacanlı, M.; Başaran, N. Aflatoxin levels in chronic hepatitis B patients with cirrhosis or hepatocellular carcinoma in Balıkesir, Turkey. J. Viral Hepat. 2015, 22, 926–935. [Google Scholar] [CrossRef]
- De Santis, B.; Brera, C.; Mezzelani, A.; Soricelli, S.; Ciceri, F.; Moretti, G.; Debegnach, F.; Bonaglia, M.C.; Villa, L.; Molteni, M.; et al. Role of mycotoxins in the pathobiology of autism: A first evidence. Nutr. Neurosci. 2019, 22, 132–144. [Google Scholar] [CrossRef]
- Osteresch, B.; Viegas, S.; Cramer, B.; Humpf, H.-U. Multi-mycotoxin analysis using dried blood spots and dried serum spots. Anal. Bioanal. Chem. 2017, 409, 3369–3382. [Google Scholar] [CrossRef]
- Viegas, S.; Osteresch, B.; Almeida, A.; Cramer, B.; Humpf, H.-U.; Viegas, C. Enniatin B and ochratoxin A in the blood serum of workers from the waste management setting. Mycotoxin Res. 2018, 34, 85–90. [Google Scholar] [CrossRef]
- Osteresch, B.; Cramer, B.; Humpf, H.-U. Analysis of ochratoxin A in dried blood spots – Correlation between venous and finger-prick blood, the influence of hematocrit and spotted volume. J. Chromatogr. B 2016, 1020, 158–164. [Google Scholar] [CrossRef]
- Cramer, B.; Osteresch, B.; Muñoz, K.A.; Hillmann, H.; Sibrowski, W.; Humpf, H.-U. Biomonitoring using dried blood spots: Detection of ochratoxin A and its degradation product 2’R-ochratoxin A in blood from coffee drinkers. Mol. Nutr. Food Res. 2015, 59, 1837–1843. [Google Scholar] [CrossRef]
- Sueck, F.; Cramer, B.; Czeschinski, P.; Humpf, H.-U. Human Study on the Kinetics of 2′ R -Ochratoxin A in the Blood of Coffee Drinkers. Mol. Nutr. Food Res. 2019, 63, 1801026. [Google Scholar] [CrossRef] [PubMed]
- Cao, X.; Li, X.; Li, J.; Niu, Y.; Shi, L.; Fang, Z.; Zhang, T.; Ding, H. Quantitative determination of carcinogenic mycotoxins in human and animal biological matrices and animal-derived foods using multi-mycotoxin and analyte-specific high performance liquid chromatography-tandem mass spectrometric methods. J. Chromatogr. B 2018, 1073, 191–200. [Google Scholar] [CrossRef] [PubMed]
- Fan, K.; Xu, J.; Jiang, K.; Liu, X.; Meng, J.; Di Mavungu, J.D.; Guo, W.; Zhang, Z.; Jing, J.; Li, H.; et al. Determination of multiple mycotoxins in paired plasma and urine samples to assess human exposure in Nanjing, China. Environ. Pollut. 2019, 248, 865–873. [Google Scholar] [CrossRef] [PubMed]
- Arce-López, B.; Lizarraga, E.; Flores-Flores, M.; Irigoyen, Á.; González-Peñas, E. Development and validation of a methodology based on Captiva EMR-lipid clean-up and LC-MS/MS analysis for the simultaneous determination of mycotoxins in human plasma. Talanta 2020, 206, 120193. [Google Scholar] [CrossRef]
- Flores-Flores, M.E.; González-Peñas, E. An LC–MS/MS method for multi-mycotoxin quantification in cow milk. Food Chem. 2017, 218, 378–385. [Google Scholar] [CrossRef]
- Mauro, T.; Hao, L.; Pop, L.C.; Buckley, B.; Schneider, S.H.; Bandera, E.V.; Shapses, S.A. Circulating zearalenone and its metabolites differ in women due to body mass index and food intake. Food Chem. Toxicol. 2018, 116, 227–232. [Google Scholar] [CrossRef]
- Fleck, S.C.; Churchwell, M.I.; Doerge, D.R.; Teeguarden, J.G. Urine and serum biomonitoring of exposure to environmental estrogens II: Soy isoflavones and zearalenone in pregnant women. Food Chem. Toxicol. 2016, 95, 19–27. [Google Scholar] [CrossRef]
- McCoy, L.F.; Scholl, P.F.; Sutcliffe, A.E.; Kieszak, S.M.; Powers, C.D.; Rogers, H.S.; Gong, Y.Y.; Groopman, J.D.; Wild, C.P.; Schleicher, R.L. Human Aflatoxin Albumin Adducts Quantitatively Compared by ELISA, HPLC with Fluorescence Detection, and HPLC with Isotope Dilution Mass Spectrometry. Cancer Epidemiol. Biomarkers Prev. 2008, 17, 1653–1657. [Google Scholar] [CrossRef]
- Warth, B.; Braun, D.; Ezekiel, C.N.; Turner, P.C.; Degen, G.H.; Marko, D. Biomonitoring of Mycotoxins in Human Breast Milk: Current State and Future Perspectives. Chem. Res. Toxicol. 2016, 29, 1087–1097. [Google Scholar] [CrossRef]
- Mwanza, M.; Abdel-Hadi, A.; Ali, A.M.; Egbuta, M. Evaluation of analytical assays efficiency to detect aflatoxin M1 in milk from selected areas in Egypt and South Africa. J. Dairy Sci. 2015, 98, 6660–6667. [Google Scholar] [CrossRef]
- Chu, Y.-J.; Yang, H.-I.; Wu, H.-C.; Lee, M.-H.; Liu, J.; Wang, L.-Y.; Lu, S.-N.; Jen, C.-L.; You, S.-L.; Santella, R.M.; et al. Aflatoxin B1 exposure increases the risk of hepatocellular carcinoma associated with hepatitis C virus infection or alcohol consumption. Eur. J. Cancer 2018, 94, 37–46. [Google Scholar] [CrossRef]
- Chu, Y.-J.; Yang, H.-I.; Wu, H.-C.; Liu, J.; Wang, L.-Y.; Lu, S.-N.; Lee, M.-H.; Jen, C.-L.; You, S.-L.; Santella, R.M.; et al. Aflatoxin B 1 exposure increases the risk of cirrhosis and hepatocellular carcinoma in chronic hepatitis B virus carriers. Int. J. Cancer 2017, 141, 711–720. [Google Scholar] [CrossRef]
- Hernandez-Vargas, H.; Castelino, J.; Silver, M.J.; Dominguez-Salas, P.; Cros, M.-P.; Durand, G.; Le Calvez-Kelm, F.; Prentice, A.M.; Wild, C.P.; Moore, S.E.; et al. Exposure to aflatoxin B 1 in utero is associated with DNA methylation in white blood cells of infants in The Gambia. Int. J. Epidemiol. 2015, 44, 1238–1248. [Google Scholar] [CrossRef] [PubMed]
- Saad-Hussein, A.; Taha, M.; Fadl, N.; Awad, A.-H.; Mahdy-Abdallah, H.; Moubarz, G.; Aziz, H.; El-Shamy, K. Effects of airborne Aspergillus on serum aflatoxin B1 and liver enzymes in workers handling wheat flour. Hum. Exp. Toxicol. 2016, 35, 3–9. [Google Scholar] [CrossRef] [PubMed]
- Seetha, A.; Monyo, E.S.; Tsusaka, T.W.; Msere, H.W.; Madinda, F.; Chilunjika, T.; Sichone, E.; Mbughi, D.; Chilima, B.; Matumba, L. Aflatoxin-lysine adducts in blood serum of the Malawian rural population and aflatoxin contamination in foods (groundnuts, maize) in the corresponding areas. Mycotoxin Res. 2018, 34, 195–204. [Google Scholar] [CrossRef] [PubMed]
- Watson, S.; Chen, G.; Sylla, A.; Routledge, M.N.; Gong, Y.Y. Dietary exposure to aflatoxin and micronutrient status among young children from Guinea. Mol. Nutr. Food Res. 2016, 60, 511–518. [Google Scholar] [CrossRef] [PubMed]
- Watson, S.; Moore, S.E.; Darboe, M.K.; Chen, G.; Tu, Y.-K.; Huang, Y.-T.; Eriksen, K.G.; Bernstein, R.M.; Prentice, A.M.; Wild, C.P.; et al. Impaired growth in rural Gambian infants exposed to aflatoxin: A prospective cohort study. BMC Public Health 2018, 18, 1247. [Google Scholar] [CrossRef]
- Gerding, J.; Ali, N.; Schwartzbord, J.; Cramer, B.; Brown, D.L.; Degen, G.H.; Humpf, H.-U. A comparative study of the human urinary mycotoxin excretion patterns in Bangladesh, Germany, and Haiti using a rapid and sensitive LC-MS/MS approach. Mycotoxin Res. 2015, 31, 127–136. [Google Scholar] [CrossRef]
- Díaz de León-Martínez, L.; Díaz-Barriga, F.; Barbier, O.; Ortíz, D.L.G.; Ortega-Romero, M.; Pérez-Vázquez, F.; Flores-Ramírez, R. Evaluation of emerging biomarkers of renal damage and exposure to aflatoxin-B1 in Mexican indigenous women: A pilot study. Environ. Sci. Pollut. Res. 2019, 26, 12205–12216. [Google Scholar] [CrossRef]
- De Santis, B.; Raggi, M.; Moretti, G.; Facchiano, F.; Mezzelani, A.; Villa, L.; Bonfanti, A.; Campioni, A.; Rossi, S.; Camposeo, S.; et al. Study on the Association among Mycotoxins and other Variables in Children with Autism. Toxins 2017, 9, 203. [Google Scholar] [CrossRef]
- Jager, A.V.; Tonin, F.G.; Baptista, G.Z.; Souto, P.C.M.C.; Oliveira, C.A.F. Assessment of aflatoxin exposure using serum and urinary biomarkers in São Paulo, Brazil: A pilot study. Int. J. Hyg. Environ. Health 2016, 219, 294–300. [Google Scholar] [CrossRef] [PubMed]
- Xie, L.; Chen, M.; Ying, Y. Development of Methods for Determination of Aflatoxins. Crit. Rev. Food Sci. Nutr. 2016, 56, 2642–2664. [Google Scholar] [CrossRef] [PubMed]
- Woo, C.; El-Nezami, H. Maternal-Fetal Cancer Risk Assessment of Ochratoxin A during Pregnancy. Toxins 2016, 8, 87. [Google Scholar] [CrossRef] [PubMed]
- Ferri, F.; Brera, C.; De Santis, B.; Fedrizzi, G.; Bacci, T.; Bedogni, L.; Capanni, S.; Collini, G.; Crespi, E.; Debegnach, F.; et al. Survey on Urinary Levels of Aflatoxins in Professionally Exposed Workers. Toxins 2017, 9, 117. [Google Scholar] [CrossRef] [PubMed]
- Koshiol, J.; Gao, Y.-T.; Dean, M.; Egner, P.; Nepal, C.; Jones, K.; Wang, B.; Rashid, A.; Luo, W.; Van Dyke, A.L.; et al. Association of Aflatoxin and Gallbladder Cancer. Gastroenterology 2017, 153, 488–494. [Google Scholar] [CrossRef]
- Kang, M.-S.; Nkurunziza, P.; Muwanika, R.; Qian, G.; Tang, L.; Song, X.; Xue, K.; Nkwata, A.; Ssempebwa, J.; Lutalo, T.; et al. Longitudinal evaluation of aflatoxin exposure in two cohorts in south-western Uganda. Food Addit. Contam. Part A 2015, 32, 1322–1330. [Google Scholar] [CrossRef]
- Mohd Redzwan, S.; Abd Mutalib, M.S.; Wang, J.-S.; Ahmad, Z.; Kang, M.-S.; Abdul Rahman, N.A.; Nikbakht Nasrabadi, E.; Jamaluddin, R. Effect of supplementation of fermented milk drink containing probiotic Lactobacillus casei Shirota on the concentrations of aflatoxin biomarkers among employees of Universiti Putra Malaysia: A randomised, double-blind, cross-over, placebo-controlled study. Br. J. Nutr. 2016, 115, 39–54. [Google Scholar] [CrossRef]
- Lauer, J.M.; Duggan, C.P.; Ausman, L.M.; Griffiths, J.K.; Webb, P.; Wang, J.; Xue, K.S.; Agaba, E.; Nshakira, N.; Ghosh, S. Maternal aflatoxin exposure during pregnancy and adverse birth outcomes in Uganda. Matern. Child Nutr. 2019, 15, e12701. [Google Scholar] [CrossRef]
- Leroy, J.L.; Sununtnasuk, C.; García-Guerra, A.; Wang, J. Low level aflatoxin exposure associated with greater linear growth in southern Mexico: A longitudinal study. Matern. Child Nutr. 2018, 14, e12619. [Google Scholar] [CrossRef]
- Leroy, J.L.; Wang, J.-S.; Jones, K. Serum aflatoxin B 1 -lysine adduct level in adult women from Eastern Province in Kenya depends on household socio-economic status: A cross sectional study. Soc. Sci. Med. 2015, 146, 104–110. [Google Scholar] [CrossRef]
- Pohanka, M.; Jun, D.; Kuca, K. Mycotoxin assays using biosensor technology: A review. Drug Chem. Toxicol. 2007, 30, 253–261. [Google Scholar] [CrossRef]
- Alhamoud, Y.; Yang, D.; Fiati Kenston, S.S.; Liu, G.; Liu, L.; Zhou, H.; Ahmed, F.; Zhao, J. Advances in biosensors for the detection of ochratoxin A: Bio-receptors, nanomaterials, and their applications. Biosens. Bioelectron. 2019, 141, 111418. [Google Scholar] [CrossRef]
- Badie Bostan, H.; Danesh, N.M.; Karimi, G.; Ramezani, M.; Mousavi Shaegh, S.A.; Youssefi, K.; Charbgoo, F.; Abnous, K.; Taghdisi, S.M. Ultrasensitive detection of ochratoxin A using aptasensors. Biosens. Bioelectron. 2017, 98, 168–179. [Google Scholar] [CrossRef] [PubMed]
- Jiang, C.; Lan, L.; Yao, Y.; Zhao, F.; Ping, J. Recent progress in application of nanomaterial-enabled biosensors for ochratoxin A detection. TrAC Trends Anal. Chem. 2018, 102, 236–249. [Google Scholar] [CrossRef]
- Chauhan, R.; Singh, J.; Sachdev, T.; Basu, T.; Malhotra, B.D. Recent advances in mycotoxins detection. Biosens. Bioelectron. 2016, 81, 532–545. [Google Scholar] [CrossRef]
- Mahmoudpour, M.; Ezzati Nazhad Dolatabadi, J.; Torbati, M.; Pirpour Tazehkand, A.; Homayouni-Rad, A.; de la Guardia, M. Nanomaterials and new biorecognition molecules based surface plasmon resonance biosensors for mycotoxin detection. Biosens. Bioelectron. 2019, 143, 111603. [Google Scholar] [CrossRef] [PubMed]
- Abnous, K.; Danesh, N.M.; Alibolandi, M.; Ramezani, M.; Sarreshtehdar Emrani, A.; Zolfaghari, R.; Taghdisi, S.M. A new amplified π-shape electrochemical aptasensor for ultrasensitive detection of aflatoxin B1. Biosens. Bioelectron. 2017, 94, 374–379. [Google Scholar] [CrossRef]
- Beheshti-Marnani, A.; Hatefi-Mehrjardi, A.; Es’haghi, Z. A sensitive biosensing method for detecting of ultra-trace amounts of AFB1 based on “Aptamer/reduced graphene oxide” nano-bio interaction. Colloids Surfaces B Biointerfaces 2019, 175, 98–105. [Google Scholar] [CrossRef]
- Nameghi, M.A.; Danesh, N.M.; Ramezani, M.; Hassani, F.V.; Abnous, K.; Taghdisi, S.M. A fluorescent aptasensor based on a DNA pyramid nanostructure for ultrasensitive detection of ochratoxin A. Anal. Bioanal. Chem. 2016, 408, 5811–5818. [Google Scholar] [CrossRef]
- Wang, Q.; Chen, M.; Zhang, H.; Wen, W.; Zhang, X.; Wang, S. Enhanced electrochemiluminescence of RuSi nanoparticles for ultrasensitive detection of ochratoxin A by energy transfer with CdTe quantum dots. Biosens. Bioelectron. 2016, 79, 561–567. [Google Scholar] [CrossRef]
- Jiang, K.; Nie, D.; Huang, Q.; Fan, K.; Tang, Z.; Wu, Y.; Han, Z. Thin-layer MoS2 and thionin composite-based electrochemical sensing platform for rapid and sensitive detection of zearalenone in human biofluids. Biosens. Bioelectron. 2019, 130, 322–329. [Google Scholar] [CrossRef] [PubMed]
- Wieling, J. LC-MS-MS experiences with internal standards. Chromatographia 2002, 55, S107–S113. [Google Scholar] [CrossRef]
- Furey, A.; Moriarty, M.; Bane, V.; Kinsella, B.; Lehane, M. Ion suppression; A critical review on causes, evaluation, prevention and applications. Talanta 2013, 115, 104–122. [Google Scholar] [CrossRef] [PubMed]
- Kruve, A.; Rebane, R.; Kipper, K.; Oldekop, M.-L.; Evard, H.; Herodes, K.; Ravio, P.; Leito, I. Tutorial review on validation of liquid chromatography–mass spectrometry methods: Part II. Anal. Chim. Acta 2015, 870, 8–28. [Google Scholar] [CrossRef]
- European Commission Commission Decision of 12 August 2002 implementing Council Directive 96/23/EC concerning the performance of analytical methods and the interpretation of results (2002/657/EC). Off. J. Eur. Communities 2002, 221, 8–36.
- European Commission Commission Recommendation 401/2006 of 23 February 2006 laying down the methods of sampling and analysis for the official control of the levels of mycotoxins in foodstuffs. Off. J. Eur. Union 2006, 70, 12–34.
- Center for Drug Evaluation and Research (FDA). Bioanalytical Method Validation Guidance for Industry; 2018. Available online: https://www.fda.gov/files/drugs/published/Bioanalytical-Method-Validation-Guidance-for-Industry.pdf (accessed on 20 November 2019).
- EMA Committee for Medicinal Products for Human Use. Guideline on Bioanalytical Method Validation. Available online: https://www.ema.europa.eu/en/documents/scientific-guideline/guideline-bioanalytical-method-validation_en.pdf (accessed on 20 November 2019).
- Serrano, A.; Capriotti, A.; Cavaliere, C.; Piovesana, S.; Samperi, R.; Ventura, S.; Laganà, A. Development of a Rapid LC-MS/MS Method for the Determination of Emerging Fusarium mycotoxins Enniatins and Beauvericin in Human Biological Fluids. Toxins 2015, 7, 3554–3571. [Google Scholar] [CrossRef]
- Smith, J.W.; Kroker-Lobos, M.F.; Lazo, M.; Rivera-Andrade, A.; Egner, P.A.; Wedemeyer, H.; Torres, O.; Freedman, N.D.; McGlynn, K.A.; Guallar, E.; et al. Aflatoxin and viral hepatitis exposures in Guatemala: Molecular biomarkers reveal a unique profile of risk factors in a region of high liver cancer incidence. PLoS ONE 2017, 12, e0189255. [Google Scholar] [CrossRef]
- Chen, C.; Mitchell, N.J.; Gratz, J.; Houpt, E.R.; Gong, Y.; Egner, P.A.; Groopman, J.D.; Riley, R.T.; Showker, J.L.; Svensen, E.; et al. Exposure to aflatoxin and fumonisin in children at risk for growth impairment in rural Tanzania. Environ. Int. 2018, 115, 29–37. [Google Scholar] [CrossRef]
- Mitchell, N.J.; Hsu, H.-H.; Chandyo, R.K.; Shrestha, B.; Bodhidatta, L.; Tu, Y.-K.; Gong, Y.-Y.; Egner, P.A.; Ulak, M.; Groopman, J.D.; et al. Aflatoxin exposure during the first 36 months of life was not associated with impaired growth in Nepalese children: An extension of the MAL-ED study. PLoS ONE 2017, 12, e0172124. [Google Scholar] [CrossRef]
- Mahfuz, M.; Alam, M.A.; Fahim, S.M.; Gazi, M.A.; Raihan, M.J.; Hossain, M.; Egner, P.A.; Bessong, P.O.; Petri, W.A.; Groopman, J.D.; et al. Aflatoxin exposure in children living in Mirpur, Dhaka: Data from MAL-ED companion study. J. Expo. Sci. Environ. Epidemiol. 2019, 29, 655–662. [Google Scholar] [CrossRef] [PubMed]
- Shirima, C.P.; Kimanya, M.E.; Kinabo, J.L.; Routledge, M.N.; Srey, C.; Wild, C.P.; Gong, Y.Y. Dietary exposure to aflatoxin and fumonisin among Tanzanian children as determined using biomarkers of exposure. Mol. Nutr. Food Res. 2013, 57, 1874–1881. [Google Scholar] [CrossRef] [PubMed]
- Shirima, C.P.; Kimanya, M.E.; Routledge, M.N.; Srey, C.; Kinabo, J.L.; Humpf, H.-U.; Wild, C.P.; Tu, Y.-K.; Gong, Y.Y. A Prospective Study of Growth and Biomarkers of Exposure to Aflatoxin and Fumonisin during Early Childhood in Tanzania. Environ. Health Perspect. 2015, 123, 173–178. [Google Scholar] [CrossRef] [PubMed]
- Prati, G.M.; Cicognini, F.M.; Rossi, F.; Bertuzzi, T.; Pietri, A.; Casali, M.; Stasi, M.; Stasi, B.; Fornari, F. Ochratoxin A and Liver Damage: A Case-Control Study. EC Gastroenterol. Dig. Syst. 2016, 1.3, 66–75. [Google Scholar]
- di Giuseppe, R.; Bertuzzi, T.; Rossi, F.; Rastelli, S.; Mulazzi, A.; Capraro, J.; de Curtis, A.; Iacoviello, L.; Pietri, A. Plasma ochratoxin A levels, food consumption, and risk biomarkers of a representative sample of men and women from the Molise region in Italy. Eur. J. Nutr. 2012, 51, 851–860. [Google Scholar] [CrossRef]
- Scholl, P.F.; Groopman, J.D. Long-term Stability of Human Aflatoxin B1 Albumin Adducts Assessed by Isotope Dilution Mass Spectrometry and High-Performance Liquid Chromatography-Fluorescence. Cancer Epidemiol. Biomarkers Prev. 2008, 17, 1436–1439. [Google Scholar] [CrossRef]
- Wang, J.-S.; Abubaker, S.; He, X.; Sun, G.; Strickland, P.T.; Groopman, J.D. Development of Aflatoxin B1-Lysine Adduct Monoclonal Antibody for Human Exposure Studies. Appl. Environ. Microbiol. 2001, 67, 2712–2717. [Google Scholar] [CrossRef]
- McCoy, L.F.; Scholl, P.F.; Schleicher, R.L.; Groopman, J.D.; Powers, C.D.; Pfeiffer, C.M. Analysis of aflatoxin B1-lysine adduct in serum using isotope-dilution liquid chromatography/tandem mass spectrometry. Rapid Commun. Mass Spectrom. 2005, 19, 2203–2210. [Google Scholar] [CrossRef]
- Scholl, P.F.; Turner, P.C.; Sutcliffe, A.E.; Sylla, A.; Diallo, M.S.; Friesen, M.D.; Groopman, J.D.; Wild, C.P. Quantitative Comparison of Aflatoxin B1 Serum Albumin Adducts in Humans by Isotope Dilution Mass Spectrometry and ELISA. Cancer Epidemiol. Biomarkers Prev. 2006, 15, 823–826. [Google Scholar] [CrossRef]
- Schleicher, R.L.; McCoy, L.F.; Powers, C.D.; Sternberg, M.R.; Pfeiffer, C.M. Serum concentrations of an aflatoxin-albumin adduct in the National Health and Nutrition Examination Survey (NHANES) 1999–2000. Clin. Chim. Acta 2013, 423, 46–50. [Google Scholar] [CrossRef]
- Yard, E.E.; Daniel, J.H.; Lewis, L.S.; Rybak, M.E.; Paliakov, E.M.; Kim, A.A.; Montgomery, J.M.; Bunnell, R.; Abudo, M.U.; Akhwale, W.; et al. Human aflatoxin exposure in Kenya, 2007: a cross-sectional study. Food Addit. Contam. Part A 2013, 30, 1322–1331. [Google Scholar] [CrossRef] [PubMed]
- Jolly, P.; Akinyemiju, T.; Jha, M.; Aban, I.; Gonzalez-Falero, A.; Joseph, D. Temporal Variation and Association of Aflatoxin B1 Albumin-Adduct Levels with Socio-Economic and Food Consumption Factors in HIV Positive Adults. Toxins 2015, 7, 5129–5140. [Google Scholar] [CrossRef] [PubMed]
- Piekkola, S.; Turner, P.C.; Abdel-Hamid, M.; Ezzat, S.; El-Daly, M.; El-Kafrawy, S.; Savchenko, E.; Poussa, T.; Woo, J.C.S.; Mykkänen, H.; et al. Characterisation of aflatoxin and deoxynivalenol exposure among pregnant Egyptian women. Food Addit. Contam. Part A 2012, 29, 962–971. [Google Scholar] [CrossRef] [PubMed]
- Partanen, H.A.; El-Nezami, H.S.; Leppänen, J.M.; Myllynen, P.K.; Woodhouse, H.J.; Vähäkangas, K.H. Aflatoxin B1 Transfer and Metabolism in Human Placenta. Toxicol. Sci. 2010, 113, 216–225. [Google Scholar] [CrossRef] [PubMed]
- Groopman, J.D.; Egner, P.A.; Schulze, K.J.; Wu, L.S.F.; Merrill, R.; Mehra, S.; Shamim, A.A.; Ali, H.; Shaikh, S.; Gernand, A.; et al. Aflatoxin exposure during the first 1000 days of life in rural South Asia assessed by aflatoxin B1-lysine albumin biomarkers. Food Chem. Toxicol. 2014, 74, 184–189. [Google Scholar] [CrossRef] [PubMed]
- Gong, Y.Y.; Wilson, S.; Mwatha, J.K.; Routledge, M.N.; Castelino, J.M.; Zhao, B.; Kimani, G.; Kariuki, H.C.; Vennervald, B.J.; Dunne, D.W.; et al. Aflatoxin Exposure May Contribute to Chronic Hepatomegaly in Kenyan School Children. Environ. Health Perspect. 2012, 120, 893–896. [Google Scholar] [CrossRef]
- Wild, C.P. The toxicology of aflatoxins as a basis for public health decisions. Mutagenesis 2002, 17, 471–481. [Google Scholar] [CrossRef]
- Miraglia, M.; Brera, C.; Colatosti, M. Application of Biomarkers to Assessment of Risk to Human Health from Exposure to Mycotoxins. Microchem. J. 1996, 54, 472–477. [Google Scholar] [CrossRef]
- Muñoz, K.; Blaszkewicz, M.; Degen, G.H. Simultaneous analysis of ochratoxin A and its major metabolite ochratoxin alpha in plasma and urine for an advanced biomonitoring of the mycotoxin. J. Chromatogr. B 2010, 878, 2623–2629. [Google Scholar] [CrossRef]
- Medina, Á.; Mateo, E.M.; Roig, R.J.; Blanquer, A.; Jiménez, M. Ochratoxin A levels in the plasma of healthy blood donors from Valencia and estimation of exposure degree: Comparison with previous national Spanish data. Food Addit. Contam. Part A 2010, 27, 1273–1284. [Google Scholar] [CrossRef]
- Studer-Rohr, I.; Schlatter, J.; Dietrich, D.R. Kinetic parameters and intraindividual fluctuations of ochratoxin A plasma levels in humans. Arch. Toxicol. 2000, 74, 499–510. [Google Scholar] [CrossRef] [PubMed]
- JECFA Safety evaluation of certain food additives and contaminants. Sixty-eighth meeting of the Joint FAOlWHO Expert Committee on Food Additives (JECFA) Food. World Heal. Organ.-Tech. Rep. Ser. 2008, 1–472. [Google Scholar]
- Pillay, D.; Chuturgoon, A.A.; Nevines, E.; Manickum, T.; Deppe, W.; Dutton, M.F. The Quantitative Analysis of Zearalenone and Its Derivatives in Plasma of Patients with Breast and Cervical Cancer. Clin. Chem. Lab. Med. 2002, 40, 946–951. [Google Scholar] [CrossRef] [PubMed]
- Capriotti, A.L.; Caruso, G.; Cavaliere, C.; Foglia, P.; Samperi, R.; Laganà, A. Multiclass mycotoxin analysis in food, environmental and biological matrices with chromatography/mass spectrometry. Mass Spectrom. Rev. 2012, 31, 466–503. [Google Scholar] [CrossRef] [PubMed]
- Zhang, K.; Wong, J.W.; Krynitsky, A.J.; Trucksess, M.W. Determining Mycotoxins in Baby Foods and Animal Feeds Using Stable Isotope Dilution and Liquid Chromatography Tandem Mass Spectrometry. J. Agric. Food Chem. 2014, 62, 8935–8943. [Google Scholar] [CrossRef] [PubMed]
- EFSA Panel on Contaminants in the Food Chain (CONTAM); Schrenk, D.; Bodin, L.; Chipman, J.K.; del Mazo, J.; Grasl-Kraupp, B.; Hogstrand, C.; Hoogenboom, L.; Jean-Charles, L.; Nebbia, C.S.; et al. Public consultation: Scientific Opinion on the risks to public health related to the presence of ochratoxin A in food. 2019. Available online: https://www.efsa.europa.eu/en/consultations/call/public-consultation-scientific-opinion-risks-public-health-related (accessed on 25 November 2019).
- Metzler, M.; Pfeiffer, E.; Hildebrand, A. Zearalenone and its metabolites as endocrine disrupting chemicals. World Mycotoxin J. 2010, 3, 385–401. [Google Scholar] [CrossRef]
- Mukherjee, D.; Royce, S.G.; Alexander, J.A.; Buckley, B.; Isukapalli, S.S.; Bandera, E.V.; Zarbl, H.; Georgopoulos, P.G. Physiologically-Based Toxicokinetic Modeling of Zearalenone and Its Metabolites: Application to the Jersey Girl Study. PLoS ONE 2014, 9, e113632. [Google Scholar] [CrossRef]
- Jubert, C.; Mata, J.; Bench, G.; Dashwood, R.; Pereira, C.; Tracewell, W.; Turteltaub, K.; Williams, D.; Bailey, G. Effects of chlorophyll and chlorophyllin on low-dose aflatoxin B 1 pharmacokinetics in human volunteers. Cancer Prev. Res. 2009, 2, 1015–1022. [Google Scholar] [CrossRef]
- EFSA Panel on Contaminants in the Food Chain(CONTAM); Schrenk, D.; Bignami, M.; Bodin, L.; Chipman, J.K.; del Mazo, J.; Grasl-Kraupp, B.; Hogstrand, C.; Laurentius, H.; Leblanc, J.-C.; et al. Scientific Opinion on the risks to public health related to the presence of aflatoxins in food. Available online: https://images.engormix.com/externalFiles/6_Aflatoxins_Draft_Opinion_for_public_consultation.pdf (accessed on 30 November 2019).
- Mupunga, I.; Izaaks, C.D.; Shai, L.J.; Katerere, D.R. Aflatoxin biomarkers in hair may facilitate long-term exposure studies. J. Appl. Toxicol. 2017, 37, 395–399. [Google Scholar] [CrossRef]
- EFSA Panel on Contaminants in the Food Chain (CONTAM). Scientific Opinion on the risks to human and animal health related to the presence of beauvericin and enniatins in food and feed. EFSA J. 2014, 12, 3802. [Google Scholar] [CrossRef]
- Knutsen, H.K.; Alexander, J.; Barregård, L.; Bignami, M.; Brüschweiler, B.; Ceccatelli, S.; Cottrill, B.; Dinovi, M.; Grasl-Kraupp, B.; Hogstrand, C.; et al. Risk to human and animal health related to the presence of 4,15-diacetoxyscirpenol in food and feed. EFSA J. 2018, 16, 5367. [Google Scholar]
- Degen, G.H.; Partosch, F.; Muñoz, K.; Gundert-Remy, U. Daily uptake of mycotoxins—TDI might not be protective for nursed infants. Toxicol. Lett. 2017, 277, 69–75. [Google Scholar] [CrossRef] [PubMed]
- World Health Organization & Joint FAO/WHO Expert Committee on Food Additives Evaluation of certain contaminants in food: Eighty-third report of the Joint FAO/WHO Expert Committee on Food Additives. In World Health Organization Technical Report Series; World Health Organization: Geneva, Switzerland, 2017; pp. 1–182. ISBN 9789241210027.
- EFSA Panel on Contaminants in the Food Chain (CONTAM); Knutsen, H.; Barregård, L.; Bignami, M.; Brüschweiler, B.; Ceccatelli, S.; Cottrill, B.; Dinovi, M.; Edler, L.; Grasl-Kraupp, B.; et al. Appropriateness to set a group health-based guidance value for fumonisins and their modified forms. EFSA J. 2018, 16, 5172. [Google Scholar]
- Mol, H.G.J.; Pietri, A.; MacDonald, S.J.; Anagnostopoulos, C.; Spanjere, M. Survey on sterigmatocystin in food. EFSA Support. Publ. 2015, 12, EN-774. [Google Scholar]
- EFSA Panel on Contaminants in the Food Chain (CONTAM). Appropriateness to set a group health-based guidance value for zearalenone and its modified forms. EFSA J. 2016, 14, 4425. [Google Scholar]
- Knutsen, H.K.; Alexander, J.; Barregård, L.; Bignami, M.; Brüschweiler, B.; Ceccatelli, S.; Cottrill, B.; Dinovi, M.; Grasl-Kraupp, B.; Hogstrand, C.; et al. Risks to human and animal health related to the presence of deoxynivalenol and its acetylated and modified forms in food and feed. EFSA J. 2017, 15, 4718. [Google Scholar]
- EFSA CONTAM Panel (EFSA Panel on Contaminants in the Food Chain); Knutsen, H.K.; Barregård, L.; Bignami, M.; Brüschweiler, B.; Ceccatelli, S.; Cottrill, B.; Dinovi, M.; Edler, L.; Grasl-Kraupp, B.; et al. Scientific Opinion on the appropriateness to set a group health based guidance value for nivalenol and its modified forms. EFSA J. 2017, 15, 4751. [Google Scholar]
- Knutsen, H.; Barregård, L.; Bignami, M.; Brüschweiler, B.; Ceccatelli, S.; Cottrill, B.; Dinovi, M.; Edler, L.; Grasl-Kraupp, B.; Hogstrand, C.; et al. Appropriateness to set a group health based guidance value for T2 and HT2 toxin and its modified forms. EFSA J. 2017, 15, 4655. [Google Scholar]
- EFSA Panel on Contaminants in the Food Chain (CONTAM). Scientific Opinion on the risks for public and animal health related to the presence of citrinin in food and feed. EFSA J. 2012, 10, 2605. [Google Scholar]
- Minute Statement on Patulin Expressed by the Scientific Committee on Food during the plenary meeting on 8 March 2000. Available online: https://ec.europa.eu/food/sites/food/files/safety/docs/cs_contaminants_catalogue_patulin_out55_en.pdf (accessed on 25 November 2019).
- International Agency for Research on Cancer (IARC). Chemical Agents and Related Occupations. A Review of Human Carcinogens; IARC: Lyon, France, 2012; Volume 100 F, ISBN 978 92 832 1323 9. [Google Scholar]
- International Agency for Research on Cancer (IARC). Some Traditional Herbal Medicines, Some Mycotoxins, Naphthalene and Styrene; IARC: Lyon, France, 2002; Volume 82, ISBN 92 832 1282 7. [Google Scholar]
- International Agency for Research on Cancer (IARC). Overall Evaluations of Carcinogenicity: An Updating of IARC Monographs Volumes 1 to 42 (Supplement 7); World Health Organization: Geneva, Switzerland, 1987; Volume 46. [Google Scholar]
- Omotayo, O.P.; Omotayo, A.O.; Mwanza, M.; Babalola, O.O. Prevalence of Mycotoxins and Their Consequences on Human Health. Toxicol. Res. 2019, 35, 1–7. [Google Scholar] [CrossRef]
- Williams, J.H.; Phillips, T.D.; Jolly, P.E.; Stiles, J.K.; Jolly, C.M.; Aggarwal, D. Human aflatoxicosis in developing countries: A review of toxicology, exposure, potential health consequences, and interventions. Am. J. Clin. Nutr. 2004, 80, 1106–1122. [Google Scholar] [CrossRef] [PubMed]
- Leong, Y.-H.; Rosma, A.; Latiff, A.A.; Izzah, A.N. Associations of serum aflatoxin B1–lysine adduct level with socio-demographic factors and aflatoxins intake from nuts and related nut products in Malaysia. Int. J. Hyg. Environ. Health 2012, 215, 368–372. [Google Scholar] [CrossRef] [PubMed]
- Moher, D.; Liberati, A.; Tetzlaff, J.; Altman, D.G. Preferred Reporting Items for Systematic Reviews and Meta-Analyses: The PRISMA Statement. PLoS Med. 2009, 6, e1000097. [Google Scholar] [CrossRef] [PubMed]


| Biomarker | Molecular Formula | CAS Number | Molar Mass (g/mol) | Log P | Water Solubility (25 °C) (mg/L) |
|---|---|---|---|---|---|
| C17H12O6 | 1162-65-8 | 312.4 | 1.23b | 16.14b | |
| AFB1 | |||||
| AFB2 | C17H14O6 | 7220-81-7 | 314.3 | 1.45 | 24.9 |
| AFG1 | C17H12O7 | 1165-39-5 | 328.3 | 0.5 | 477 |
| AFG2 | C17H14O7 | 7241-98-7 | 330.3 | 0.71 | 3.73 × 10³ |
| AFM1 | C17H12O7 | 6795-23-9 | 328.3 | 1.21a | 0.99 g/La |
| AFM2 | C17H14O7 | 6885-57-0 | 330.3 | 1.16a | 2.16 g/La |
| AFOH | C17H14O6 | 29611-03-8 | 314.3 | 1.19b | 0.56 g/Lb |
| ALT | C15H16O6 | 29752-43-0 | 292.3 | 1.12 c | 5692 c |
| AME | C15H12O5 | 23452-05-3 | 272.2 | 2.25b | 0.09 g/Lb |
| AOH | C14H10O5 | 641-38-3 | 258.2 | 2.49a | 0.23 g/La |
| BEA | C45H57N3O9 | 26048-05-5 | 783.9 | 5..25b | 0.00088 g/Lb |
| CIT | C13H14O5 | 518-75-2 | 250.2 | 0.45 | Practically insoluble |
| DH-CIT | C13H14O6 | 65718-85-6 | 266.2 | 3.61 c | 59.67 c |
| DAS | C19H26O7 | 2270-40-8 | 366.4 | 1.40a | 1.03 g/La |
| DOM-1 | C15H20O5 | 88054-24-4 | 280.3 | 0.16 c | 2.17 × 10⁴c |
| DON | C15H20O6 | 51481-10-8 | 296.3 | 0.71 | 5.5 × 10⁴ |
| 3-ADON | C17H22O7 | 50722-38-8 | 338.4 | 0.61a | 5.99 g/La |
| 15-ADON | C17H22O7 | 88337-96-6 | 338.4 | 0.54a | 6.31 g/La |
| DON-3-GlcA | C21H28O12 | 1000000-13-4 | 472.4 | n.i. | n.i. |
| DON-15-GlcA | C21H28O12 | 1372859-16-9 | 472.4 | n.i. | n.i. |
| EnA | C36H63N3O9 | 2503-13-1 | 681.9 | 4.79b | 0.011 g/Lb |
| EnA1 | C35H61N3O9 | 4530-21-6 | 667.9 | 4.39b | 0.012 g/Lb |
| EnB | C33H57N3O9 | 917-13-5 | 639.8 | 3.81b | 0.018 g/Lb |
| EnB1 | C34H59N3O9 | 19914-20-6 | 653.8 | 4.06b | 0.018 g/Lb |
| FB1 | C34H59NO15 | 116355-83-0 | 721.8 | 0.81a | 0.043 g/La |
| FB2 | C34H59NO14 | 116355-84-1 | 705.8 | 0.28a | 0.015 g/La |
| FUS-X | C17H22O8 | 23255-69-8 | 354.4 | 1.24 | 6.67x10⁴ |
| GLIO | C13H14N2O4S2 | 67-99-2 | 326.4 | 0.36b | 12.9 g/Lb |
| HT-2 | C22H32O8 | 26934-87-2 | 424.5 | 0.52a | 1 g/La |
| HT-2-4-GlcA | C22H40O14 | 1400867-48-2 | 600.6 | n.i. | n.i. |
| NIV | C15H20O7 | 23282-20-4 | 312.3 | 2.24 | 3.54 × 10⁵ |
| OTA | C20H18ClNO6 | 303-47-9 | 403.8 | 4.74 | 0.4246 |
| OTB | C20H19NO6 | 4825-86-9 | 369.4 | 3.77 | 4.4 |
| OTα | C11H9ClO5 | 19165-63-0 | 256.6 | 3.77 c | 49.35 c |
| 10-OH-OTA | C20H18ClNO7 | 86072-87-9 | 419.8 | 3.20 c | n.i. |
| PAT | C7H6O4 | 149-29-1 | 154.1 | 0.27a | 163 g/La |
| STER | C18H12O6 | 10048-13-2 | 324.3 | 3.81 | 1.44 |
| T-2 | C24H34O9 | 21259-20-1 | 466.5 | 2.27 | 95.9 |
| ZAN | C18H24O5 | 5975-78-0 | 320.4 | 4.86 c | 2.53 c |
| ZAN-14-GlcA | C24H32O11 | n.i. | 496.5 | n.i. | n.i. |
| ZEA | C18H22O5 | 17924-92-4 | 318.4 | 3.04a | 0.12 g/La |
| ZEA-14-GlcA | C24H30O11 | 1032558-19-2 | 494.5 | n.i. | n.i. |
| α−ZΕL | C18H24O5 | 36455-71-7 | 320.4 | 3.27a | 0.15 g/La |
| β−ZΕL | C18H24O5 | 5916-52-9 | 320.4 | 3.27a | 0.15 g/La |
| α−ZAL | C18H26O5 | 26538-44-3 | 322.4 | 3.23a | 0.16 g/La |
| β-ZAL | C18H26O5 | 42422-68-4 | 322.4 | 3.23a | 0.16 g/La |
| Analyte/s | LOD (µg/L) ( *pg/mg Albumin) | Sample Preparation | Separation and Detection Technique | Year | Ref. |
|---|---|---|---|---|---|
| AFs (B1, B2, G1, G2, M1), OTA, OTB, T-2, HT-2, DOM-1, ZEA, STER NIV, DON, 3-ADON, 15-ADON, NEO, FUS-X, DAS | 0.04–2.7 0.15–9.1 | SPE 400 µL plasma + 1.2 mL ACN (1% formic acid) + SPE (Captiva® EMR-Lipid cartridges). Evaporate to dryness (60 °C) + 200 µL MeOH/H2O with 5 mM ammonium formate (40:60) SPE 400 µL plasma + 1.2 mL ACN (1% formic acid) + SPE (Captiva® EMR-Lipid cartridges). Evaporate to dryness (60 °C) + 200 µL MeOH/H2O with 5 mM ammonium formate (5:95) | LC-MS/MS Column: C18 (150 × 2.1 mm × 2.7μm) at 45 °C Flow: 0.4 mL/min Mobile phase: (A) MeOH (5mM ammonium formate with 0.1% formic acid); (B) H2O (5mM ammonium formate with 0.1% formic acid in 5:95 MeOH/ H2O) in gradient conditions Detector: ESI (+), QqQ, MRM | 2020 | [66] |
| PAT CIT | 1.10 0.04 | QuEChERS 1 mL plasma + 9 mL extraction solvent (53/44/3, ACN/ H2O /formic acid) + 2 mg MgSO4 + 0.5g NaCl. Shaking and extract using an agitator decanter (30 min). Centrifuge, evaporate supernatant to dryness (N2 and 40 °C) and reconstitute with 500 µL H2O /MeOH (90/10) | LC-MS/MS Column: C18 (100 × 2.1 mm × 1.8μm) at 45 °C Flow: 0.4 mL/min Mobile phase: (A) H2O /ACN (95.5/0.05); (B) MeOH/ACN (95.5/0.05) both with 5mM ammonium acetate in gradient conditions Detector: ESI (-), QqQ, MRM | 2020 | [53] |
| OTA, 2’R-OTA | 0.006 | LLE 100 µL dried blood spots + 10 µL d5-OTA i.s.+ 900 µL H2O/acetone/ACN (30:35:35). Sonicate. Evaporate (60 °C, reduced pressure). Reconstitute with 80 µL H2O/ACN/acetic acid (97:3:0.1) | LC-MS/MS Column: C18 (100 × 2.0 mm × 3 μm) at 40 °C Flow: 0.3 mL/min Mobile phase: (A) ACN (2% acetic acid); (B) H2O (0.1% acetic acid) in gradient conditions Detector: ESI (+), QTrap, MRM | 2019 | [63] |
| CIT | 0.02 | LLE 1 mL plasma + 1 mL ACN (1:1). Centrifuge. Evaporate (N2, 40 °C). Reconstitute in 350 µL MeOH. Filter | LC-MS/MS Column: C18 HD (125 × 3 mm) at 21 °C Flow: 0.2 mL/min Mobile phase (A) H2O; (B) MeOH both with 1mM ammonium formate in gradient conditions Detector: ESI (-), QTrap, MRM | 2019 | [54] |
| OTA | 0.04 | IAC 3 mL acidified serum + IAC column Ochraprep® (Biopharm) | LC-FLD Column: C18 (150 × 4.6 mm × 5 μm) Flow: 1.5 mL/min Mobile phase: MeOH/ ACN/ 0.05 mM sodium acetate/ acetic acid (300/300/400/14) Detector: 333/465 nm (λex/λem) | 2019 | [54] |
| AFs (B1, B2, G1, G2, M1, M2), OTA, OTα, FB1, T-2, HT-2 DON, 3-ADON, 15-ADON, DON-3-GlcA, DON-15-GlcA, FUS-X, ZEA, ZAN,α-ZEL, β-ZEL, α-ZAL, β-ZAL, ZEA-14-GlcA, ZAN-14-GlcA | 0.03–0.5 | LLE 200 µL plasma + 1 mL ACN/formic acid (99/1). Centrifuge, evaporate supernatant (N2) + 200 µL ACN/H2O with 5 mM ammonium acetate (20:80) | LC-MS/MS Column:C18 (100 × 3 mm × 2.7 μm) at 40 °C Flow: 0.4 mL/min Mobile phase: (A) MeOH; (B) H2O/ 5mM ammonium acetate in gradient conditions Detector: ESI (±), QTrap, MRM | 2019 | [65] |
| GLIO, OTA | 0.05–25 | LLE Serum + EtOAc. Evaporate (N2). Redissolve in MeOH/H2O (50:50), 2% acetic acid | LC-FLD Column: C18 (100 × 2.1 mm × 1.7 μm) at 40 °C Flow: 0.4 mL/min Mobile phase: H2O/MeOH (50:50), 2% acetic acid Detector: 333/460 nm (λex/λem) | 2019 | [58] |
| ZEA, α and β-ZEL | n.i | LLE Serum + 2 mL diethylether. Centrifuge. Evaporate (N2, 40 °C) | LC-MS/MS Column: (100 × 2.1 mm × 1.7 μm) at 40 °C Flow: 0.4 mL/min Mobile phase: H2O/MeOH (50:50), 2% acetic acid Detector: ESI (-), QqQ, MRM | 2019 | [58] |
| CIT, DH-CIT | 0.02 | LLE 750 µL plasma + 1 mL ACN. Centrifuge. Evaporate (N2, 40 °C). Reconstitute with 350 µL MeOH | LC-MS/MS Column: C18 HD (125 × 3 mm) at 30 °C Flow: 0.2 mL/min Mobile phase: (A) H2O; (B) MeOH both with 1mM ammonium formate in gradient conditions Detector: ESI (-), QTrap, MRM | 2019 2018 | [23,56] |
| NIV, DON, FUS-X, 3-ADON, 15-ADON, T-2, HT-2, AFs (B1, B2, G1, G2), ZEA, α-ZEL, β-ZEL, OTA, ZAN, α-ZAL, β-ZAL | 0.04–1.5 | LLE 100 µL plasma + 150 µL EtOAc. Centrifuge. Evaporate organic phase (dryness). Reconstitute in 200 µL MeOH | LC-HRMS Column: C18 (50 × 2.1 mm × 2.6 μm) at 30 °C Flow: 0.3 mL/min Mobile phase: (A) H2O; (B) MeOH/0.1% (or 0.02%) acetic acid in gradient conditions Detector: ESI (±), Orbitrap | 2018 | [48] |
| AFs (B1, B2, G1, G2, M1), STER, PAT, CIT, FB1, FB2, OTA | 0.05–0.41 | LLE 200 µL plasma + 50 µL β-glucuronidase (overnight 37 °C) + 1 mL ACN/acetic acid (99/1). Centrifuge. Evaporate (N2). Reconstitute in 200 µL ACN/H2O. Filter | LC-MS/MS Column: C18 (100 × 2.1 mm × 2.6 μm) at 40 °C Flow: 0.2 mL/min Mobile phase: (A) H2O (ammonium acetate, acetic or formic acid); (B) ACN (MeOH for FB1) in gradient conditions Detector: ESI (±), QqQ, MRM | 2018 | [64] |
| CIT, DH-CIT | 0.07–0.15 | LLE 1 mL plasma + 1 mL ACN. Centrifuge. Evaporate (N2, 40 °C). Reconstitute in 350 µL MeOH. Filter | LC-MS/MS Column: C18 HD (125 × 3 mm) at 21 °C Flow: 0.2 mL/min Mobile phase: (A) H2O; (B) MeOH both with 1mM ammonium formate in gradient conditions Detector: ESI (-), QqQ, MRM | 2018 | [55] |
| OTA, OTα | 0.05 | LLE 0.5 mL plasma + 100 µL hydrolysis buffer (pH 5) + 100 µL β-Gluc/ArylS enzyme (overnight, 37°) + 3 mL 1% NaHCO3 (+ H3PO4) + 2 mL chloroform/isopropanol (97:3). Centrifuge. Evaporate (N2, 45 °C). Reconstitute in 250 µL MeOH/H2O (1:1). Filter | LC-FLD Column: C18 (250 × 3 mm × 5 μm) at 40 °C Flow: 0.8 mL/min Mobile phase: (A) MeOH/2% acetic acid (66:34); (B) MeOH/isopropanol (90:10) in gradient conditions Detector: 333/450 nm (λex/λem) | 2018 | [55] |
| ZEA, α-ZEL, β-ZEL, ZAL, ZAN, β-ZAL | 0.07 | SPE 0.5 mL serum + 10 µL β-glucuronidase + 0.25 mL sodium acetate buffer (overnight, 37 °C) + 1 mL ChemElutTM cartridge. Elute with methyltertbutylether. Evaporate and redissolve in 35 µL of H2O/MeOH/ACN (2:1:1) | LC-MS/MS Column: C18 (50 × 2.1 mm × 1.9 μm) Flow: 0.2 mL/min Mobile phase: (A) MeOH; (B) H2O; (C) ACN in gradient conditions Detector: APCI (-), QqQ, MRM | 2018 | [68] |
| EnB, OTA, 2’R-OTA | 0.01–0.04 | LLE 100 µL dried serum spots + 1 mL H2O/acetone/ACN (30:35:35). Sonicate. Evaporate. Reconstitute with H2O/ACN/acetic acid (95:5:0.1) | LC-MS/MS Column: C18 (100 × 2 mm × 3 μm) at 45 °C Flow: 0.3 mL/min Mobile phase: (A) ACN (2% acetic acid); (B) H2O (0.1% acetic acid) in gradient conditions Detector: ESI (±), QTrap, MRM | 2018 | [60] |
| AFs (B1, B2, G1, G2, M1), ALT, AME, AOH, BEA, CIT, DH-CIT, DON, DON-3-GlcA, En (A, A1, B, B1), FB1, 10-OH-OTA, HT-2, HT-2-4-GlcA, OTA, 2’R-OTA, OTα, T-2, ZAN, ZEA | 0.0012-1.34 | LLE 100 µL dried blood or serum spots + 1 mL H2O/acetone/ACN (30:35:35). Sonicate. Evaporate (50 °C, low pressure). Reconstitute with H2O/ACN/acetic acid (95:5:0.1) | LC-MS/MS Column: C18 (100 × 2 mm × 3 μm) at 45 °C Flow: 0.75–0.85 mL/min Mobile phase: (A) ACN (2% acetic acid); (B) H2O (0.1% acetic acid) in gradient conditions Detector: ESI (±), QTrap, MRM | 2017 | [59] |
| AFB1, AFM1, DON, ZEA, DOM-1, FB1, GLIO, OTA | 0.005-5.5 | QuEChERS 1 mL serum + 1 mL PBS + Pronase®, (overnight, 37°) + 2 mL EtOAC (1% formic acid). Centrifuge, evaporate (N2) + 1 mL of ACN + 1.6 g QuEChERS (DisQUE®). Centrifuge, evaporate (N2) and reconstitute with 0.3 mL MeOH/H2O 3% formic acid and 5 mM ammonium formate (50/50) | LC-MS/MS Column: C18 (50 × 3 mm × 2.6 μm) at 40 °C Flow: 0.3 mL/min Mobile phase: (A) ACN/H2O (50/50); (B) MeOH/H2O (50/50) both with 5mM ammonium formate and 3% formic acid in gradient conditions Detector: ESI (+), QqQ, MRM | 2017 | [82] |
| AFB1, AFB2 AFG1, AFG2 AFM1, AFOH | 0.006-0.025 | IAC 5 mL serum + 400 µL PBS + IAC column (AFLAPREP®) | LC-FLD Column: C18 (150 × 2.1 mm × 5 μm) Flow: 1.2 mL/min Mobile phase: MeOH/H2O/ACN (20:20:60) (derivatizing agent: 100 µL HNO3 65% and 119 mg KBr) Detector: 365/440 nm (λex/λem) | 2017 | [86] |
| ZEA | n.i. | SPE 100 µL serum + β-glucuronidase/sulfatase (24 h) + Novum SLE plate. Elute with methyltertbutylether. Evaporate and redissolve in 100 µL of H2O/MeOH (50/50) | LC-MS/MS Column: C18 (100 × 2.1 mm × 1.9 μm) at 50 °C Flow: 5 mL/min Mobile phase: (A) H2O; (B) ACN in gradient conditions Detector: ESI (±), QqQ, MRM | 2016 | [69] |
| OTA | 0.2 | SPE 0.5 mL serum + 15 µL acetic acid + SPE cartridge (Stata-C18). Elute with acidified MeOH (MeOH/acetic acid, 95/5). Evaporate and reconstitute with 0.5 mL MeOH | LC-FLD Column: C18 (250 × 4.6 mm × 5 μm) at 30 °C Flow: 1 mL/min Mobile phase: ACN/ H2O/ acetic acid (50/49/1) Detector: 310/465 nm (λex/λem) | 2016 | [85] |
| OTA, 2’R-OTA | 0.006 | LLE 100 µL dried blood spots + 1 mL H2O/acetone/ACN (30:35:35). Sonicate. Evaporate (60 °C, reduced pressure). Reconstitute with 100 µL H2O/MeOH/formic acid (60:40:0.1) | LC-MS/MS Column: C18 (150 × 2 mm × 5 μm) at 40 °C Flow: 0.3 mL/min Mobile phase: (A) MeOH; (B) H2O both with 0.1% formic acid in gradient conditions Detector: ESI (±), QTrap, MRM | 2016 2015 | [61,62] |
| AFB1, AFB2 AFG1, AFG2 | 0.025–0.05 | LLE 1 mL serum + 2 mL hexane. Centrifuge. Supernatant + 1 mL chloroform. Shake. Centrifuge. Evaporate (N2) + derivatize with trifluoroacetic acid (TFA) | LC-FLD Column: C18 (250 × 3.8 mm × 5 μm) Flow: 1 mL/min Mobile phase: H2O/ACN/MeOH (62:16:22) Detector: 360/430 nm (λex/λem) | 2015 | [57] |
| Ens (A, A1, B, B1) and BEA | 0.01–0.02 | SPE 250 µL plasma + 25 mL MeOH/H2O (40:60) + Carbograph clean up | LC-MS/MS Column: C18 (150 × 2.1 mm × 3 μm) at 30 °C Flow: 0.75–0.85 mL/min Mobile phase: (A) H2O; (B) MeOH both with 5 mM ammonium formate and 0.1% formic acid in gradient conditions Detector: ESI (+), QqQ, MRM | 2015 | [111] |
| AFB1-lys | 0.5 | Pronase® + SPE 250 µL serum + Pronase® (5 h, 37°) + SPE column (Oasis® MAX). Elute with 2% formic acid in MeOH | LC-MS/MS Column: C18 (100 × 3 mm × 2.7μm) at 40 °C Flow: 0.3 mL/min Mobile phase: (A) MeOH; (B) H2O/0.1% formic acid in gradient conditions Detector: ESI (+), QqQ, MRM | 2019 | [65] |
| AFB1-lys | 0.35 | Pronase® + SPE 250 µL serum + Pronase® (4.5 h, 40°) +500 µL H2O + SPE column (Oasis® MAX). Elute with 2% formic acid in MeOH | LC-FLD Column: C18 (150 x 4.6 mm x 2.6 μm) at 25ºC Flow: 0.4 mL/min Mobile phase: (A) H2O/ MeOH (95:5) with 1% acetic acid; (B) MeOH/ H2O (95:5) with 1% acetic acid; (C) ACN in gradient conditions Detector: 370/470 nm (λex/λem) LC-MS/MS Column: C18 (50 × 2.1 μm × 2.7μm) at 40 °C Flow: 0.6 mL/min Mobile Phase: (A) H2O (0.06% formic acid); (B) ACN (0.06% formic acid) in gradient conditions Detector: ESI (+), TOF | 2019 | [81] |
| AFB1-lys | 0.022 | Pronase® + SPE 230 µL plasma + 805 µL MeOH:H2O (8:2). Centrifuge. Supernatant + 230 µL PBS + 13C i.s. + 230 µL Pronase® (overnight, 37°) + 460 µL H2O + SPE column (OASIS® MAX). Elute with 2% formic acid in MeOH | nanoLC-HRMS Column: C18 (75 µm × 15 cm) Flow: 0.3 mL/min Mobile phase: (A) H2O; (B) ACN both with 0.1% formic acid in gradient conditions Detection: nanospray, Orbitrap, full MS | 2018 | [49] |
| AFB1-lys | 0.2–0.4 * | Pronase® + SPE 150 µL serum + Pronase® (3 h, 37°) + SPE column (OASIS® MAX). Elute with 2% formic acid in MeOH. Evaporate and dissolve in MeOH | LC-FLD Column: C18 (250 x 4.6 mm x 5μm) at 25 °CFlow: 1 mL/minMobile phase: (A) 20 mM NH4H2PO4;(B) MeOH in gradient conditionsDetector: 405/470 nm (λex/λem) | 2019 2018 2016 2015 | [89,90,91,92] |
| AFB1-lys | 0.4–0.5 * | Pronase® + SPE 200 µL plasma + 10 µL x 0.1ng AFB1-D4-lys i.s. + Pronase® (18 h, 37°) + SPE column (OASIS® MAX). Elute with 2% formic acid in MeOH | LC-MS/MS Column: C18 (150 × 2 mm × 3μm) at 35 °C Flow: 0.25 mL/min Mobile phase: (A) H2O; (B) ACN; (C) 0.6% formic acid in gradient conditions Detector: ESI (+), QqQ, SRM | 2019 2018 2017 | [87,112,113,114,115] |
| AFB1-lys | 6.0 * | Pronase® + SPE 250 µL serum + Pronase® (5 h, 37º) + SPE column (Oasis® MAX). Elute with 2% formic acid in MeOH. Evaporation. Dilute in 200 µL MeOH/H2O (25:75) | LC-MS/MS Column: C18 (50 × 2.1 mm × 1.7μm) at 40 °C Flow: 0.5 mL/min Mobile phase: (A) H2O; (B) ACN both with 0.1% formic acid in gradient conditions Detector: ESI (+), QqQ, MRM | 2016 | [83] |
| AFB1-alb | 0.6–1.0 * | Pronase® + SPE 200 µg albumin + proteinase | ELISA | 2018 2017 2015 | [73,74,75] |
| AFB1-alb | 2.5–3 * | Pronase® + SPE 2 mg albumin + proteinase (overnight) + Sep-Pak C18 | ELISA | 2018 2016 | [77,78,79] |
| AFB1-alb | n.i | IAC EASI-Extract® Aflatoxin | ELISA Ridascreen® AFB1 30/15 | 2016 | [76] |
| Country | Analyte | Matrix | Total Samples | Positive Samples (%) | LOD LOQ (µg/L) or (pg/mg Albumin *) | Detection Technique | Mean (μg/L) and/or [Range] (μg/L or pg/mg Albumin *) | Year/Ref | |
|---|---|---|---|---|---|---|---|---|---|
| Tunisia | PAT CIT | Plasma | 50/50 50/50 | 20/30 34/38 | 1.10 0.04 | 2.30 0.09 | LC-MS/MS | 11.62a 0.49 a | 2020 [53] |
| China | OTA FB1 DON ZEA ZAN | Plasma | 260 | 27.7 2.7 2.3 6.5 1.2 | 0.04 0.2 0.5 0.05 0.03 | 0.1 0.51 0.1 0.1 | LC-MS/MS | 1.21 [0.312–9.18] 0.69 [0.305–0.993] 2.60 [1.39–5.53] 0.16 [0.063–0.418] 0.26 [0.164–0.346] | 2019 [65] |
| Italy | GLIO OTA | Serum | 110 (52/31/27) ASD/CS/C | 31/55/30 33/65/74 | 25 0.005 | 50 0.01 | LC-FLD | 0.24/0.41/0.27 0.40/0.36/0.65 | 2019 [58] |
| China | AFB1 AFB2 AFG1 AFG2 AFM1 STER CIT FB1 FB2 OTA | Plasma | 60 (30/30)C/HCC | 13/33 17/23 3/3 3/3 3/0 13/40 0/3 3/7 3/3 0/3 | 0.07 0.05 0.13 0.15 0.16 0.05 0.18 0.41 0.39 0.15 | 0.25 0.21 0.43 0.38 0.41 0.22 0.44 0.92 0.87 0.46 | LC-MS/MS | [0.95–1.78]/[1.23–4.56] [1.37–3.89]/[1.16–3.75] 0.61/0.55 0.43/0.46 0.57/n.d. [0.88–2.05]/[1.06–3.23] n.d./0.63 1.92/[1.35–2.78 ]2.03/1.57 n.d./0.83 | 2018 [64] |
| Italy | AFB1 AFM1 DON DOM-1 FB1 GLIO OTA ZEA | Serum | 213 | 22.9 50.2 19.5 13.1 13.7 21.2 82.9 5.4 | 0.005 0.11 2.5 2.5 1.5 5.5 0.08 0.5 | 0.01 0.22 5.0 5.0 3.011 0.16 1.0 | LC-MS/MS | 0.01 [0–0.73] 0.11 [0–1.91] 1.0 [0–27.9] 0.3 [0–12.7] 0.7 [0–5.6] 2.3 [0–28.4] 0.36 [0–1.76] 0.1 [0–3.9] | 2017 [82] |
| Portugal | OTA2’R-OTAEnB | Serum | 42 | 100 81 100 | 0.012 0.012 0.0012 | 0.05 0.05 0.01 | LC-MS/MS | 0.76 [0.36–4.99] 0.32 [0.08–0.51] 0.048 [0.01–0.15] | 2018 [60] |
| Germany | OTAEnB | Blood | 50 | 100 100 | 0.012 0.0012 | 0.05 0.01 | LC-MS/MS | 0.204 0.036 [0.014–0.11] | 2017 [59] |
| Spain | Ens (A,A1,B,B1) BEA | Plasma | 10 | 0 0 | 0.01-0.04 0.02 | 0.02-0.04 0.04 | LC-MS/MS | n.d. n.d. | 2015 [111] |
| Germany | OTA | Blood | 16 | 100 | n.i. | n.i. | LC-MS/MS | 0.157 [0.079–0.262] | 2019 [63] |
| Czech Republic | OTA | Serum | 50 | 48 | 0.04 | 0.10 | LC-FLD | 0.14 [LOD–0.83] | 2019 [54] |
| Bangladesh | OTA OTα | Plasma | 104 | 10098 | 0.050.05 | 0.100.10 | LC-FLD | 0.72 [LOD–6.63]0.38 [LOD–0.99] | 2018 [55] |
| Egypt | OTA | Serum | 98 | 81.6 | 0.2 | n.i. | LC-FLD | 0.33 [0.20–1.53] | 2016 [85] |
| Italy | OTA | Serum | 105 (62 C/43 CLD) | 54.8/44.2 | 0.25 | 0.50 | LC-FLD | 0.26/0.27 | 2016 [118] |
| Germany | OTA | Blood | 50 | 100 | 0.006 | 0.021 | LC-MS/MS | 0.211 [0.071–0.383] | 2016 [61] |
| Germany | OTA 2’R-OTA | Blood | 50 34 | 100 100 | 0.005 0.005 | 0.021 0.021 | LC-MS/MS | 0.21 [0.071–0.383] 0.11 [0.021–0.414] | 2015 [62] |
| Bangladesh | CIT DH-CIT | Plasma | 2 | 100 100 | 0.07 0.15 | 0.15 0.30 | LC-MS/MS | 0.47 [0.15–0.66] 0.96 [0.14–1.41] | 2019 [56] |
| Czech Republic | CIT | Plasma | 50 | 98 | 0.02 | 0.15 | LC-MS/MS | 0.05 [0.02–0.18] | 2019 [54] |
| Bangladesh | CIT DH-CIT | Plasma | 104 | 90 85 | 0.07 0.15 | 0.15 0.30 | LC-FLD | 0.34 [LOD–2.70] 0.38 [LOD–1.44] | 2018 [55] |
| Italy | ZEA α-ZEL β-ZEL | Serum | 110 (52 ASD/31 CS /27C) | n.d. n.d. n.d. | 2.5 2.5 2.5 | 5 5 5 | LC-MS/MS | <LOQ <LOQ <LOQ | 2019 [58] |
| USA | ZEA α-ZEL β-ZEL ZAL ZAN | Serum | 48 | (free/conjugate) 85.4/100 6.3/62.5 35.4/39.6 16.7/75.03 1.3/93.8 | 0.07 0.07 0.07 0.07 0.07 | n.i. n.i. n.i. n.i. n.i. n.i. | LC-MS/MS | (free/conjugate) 0.087/0.641 n.d./0.444 0.089/0.231 0/0.30 0102/0.203 | 2018 [68] |
| USA | ZEA | Serum | 11 | 9 | 0.4 nM | n.i. | LC-MS/MS | 0.39 nM | 2016 [69] |
| Italy | AFs total (B1,B2,G1, G2, M1) | Serum | 46 | 0 | 0.006-0.025 | n.i. | LC-FLD | n.d. | 2017 [86] |
| Turkey | AFs (B1,B2,G1,G2) | Serum | C: 49 CHB: 38 Cirr: 26 HCC: 35 | 26.5 21.1 26.9 35.0 | 0.025-0.05 | 0.021-0.06 | LC-FLD | [0.005–0.018] [0.009–0.054] [0.010–0.041] [0.009–0.054] | 2015 [57] |
| China | AFB1-lys | Plasma | 260 | 19.6 | 0.5 | 1 | LC-MS/MS | 31.2 [10.5–74.5] * | 2019 [65] |
| Mexico | AFB1-lys | Serum | 34 | 83 | 0.35 | 0.47 | LC-FLDLC-MS/MS | 2.08 [1.08–102.6] * | 2019 [81] |
| Bangladesh | AFB1-lys | Plasma | 167 | 62 | 0.5 * | n.i. | LC-MS/MS | 1.07 [0.04–123.5] * | 2019 [115] |
| Uganda | AFB1-lys | Serum | 220 | 100 | 0.2 * | n.i. | LC-FLD | 5.83 [0.71–95.6] * | 2019 [90] |
| Gambia | AFB1-lys | Plasma | 374 | 95 | 3E | n.i. | ELISA | n.i. | 2018 [79] |
| Malawi | AFB1-lys | Serum | 230 | 67 | 2.5E | n.i. | ELISA | 20.5 * | 2018 [77] |
| Tanzania | AFB1-lys | Plasma | 60 | 72 | 0.4 * | n.i. | LC-MS/MS | 5.1 [3.5–6.6] * | 2018 [113] |
| Mexico | AFB1-lys | Serum | 347 | 99.4 | 0.2 * | n.i. | LC-FLD | 0.82 * | 2018 [91] |
| Nigeria | AFB1-lys | Plasma | 58 (11 C/47 SAM) | 19/81 | 0.022 | 0.022 | LC-Orbitrap | 0.8/4.3 [0.2–59.2] * | 2018 [49] |
| Nepal | AFB1-lys | Plasma | 85 | n.i. | 0.4 * | n.i. | LC-MS/MS | 3.62 * | 2017 [114] |
| Guatemala | AFB1-lys | Serum | 461 | 100 | n.i. | 0.2 * | LC-MS | 8.4 [0.2–814.8] * | 2017 [112] |
| China | AFB1-lys | Plasma | 459 (250 C/209 GBC) | 15/32 | 0.5 * | n.i. | LC-MS | 1.2/5.4 * | 2017 [87] |
| Egypt | AFB1-lys | Serum | 290 | n.i. | n.i | n.i. | ELISA | [0.04-0.10] * | 2016 [76] |
| Guinea | AFB1-lys | Serum | 305 | 88.2 | 3E | n.i. | ELISA | 12.1 * | 2016 [78] |
| Malaysia | AFB1-lys | Serum | 160 | 61 | 0.05 | n.i. | LC-FLD | 6.80 [0.80–20.24] * | 2016 [89] |
| Uganda | AFB1-lys | Serum | 713 | 90 | 0.4 * | n.i. | LC-FLD | 1.58 [0.40–168] * | 2015 [88] |
| Kenya | AFB1-lys | Serum | 884 | 100 | 0.2 * | n.i. | LC-FLD | 7.47 [6.04–8.90] * | 2015 [92] |
| Gambia | AFB1-alb | Plasma | 115 | 100 | 0.6E | n.i. | ELISA | 3.6 [3.9–458.4] * | 2015[75] |
| Tanzania | AFB1-lys | Plasma | 166 | 67-98 | 3E | n.i. | ELISA | [4.7–23.5] * | 2015 [117] |
| Mycotoxin | IARC Classification * | TDI Value |
|---|---|---|
| AFs | Group 1 | Not established (genotoxic, carcinogen) [149] |
| FBs | Group 2B | 1 µg/kg bw per day [150] |
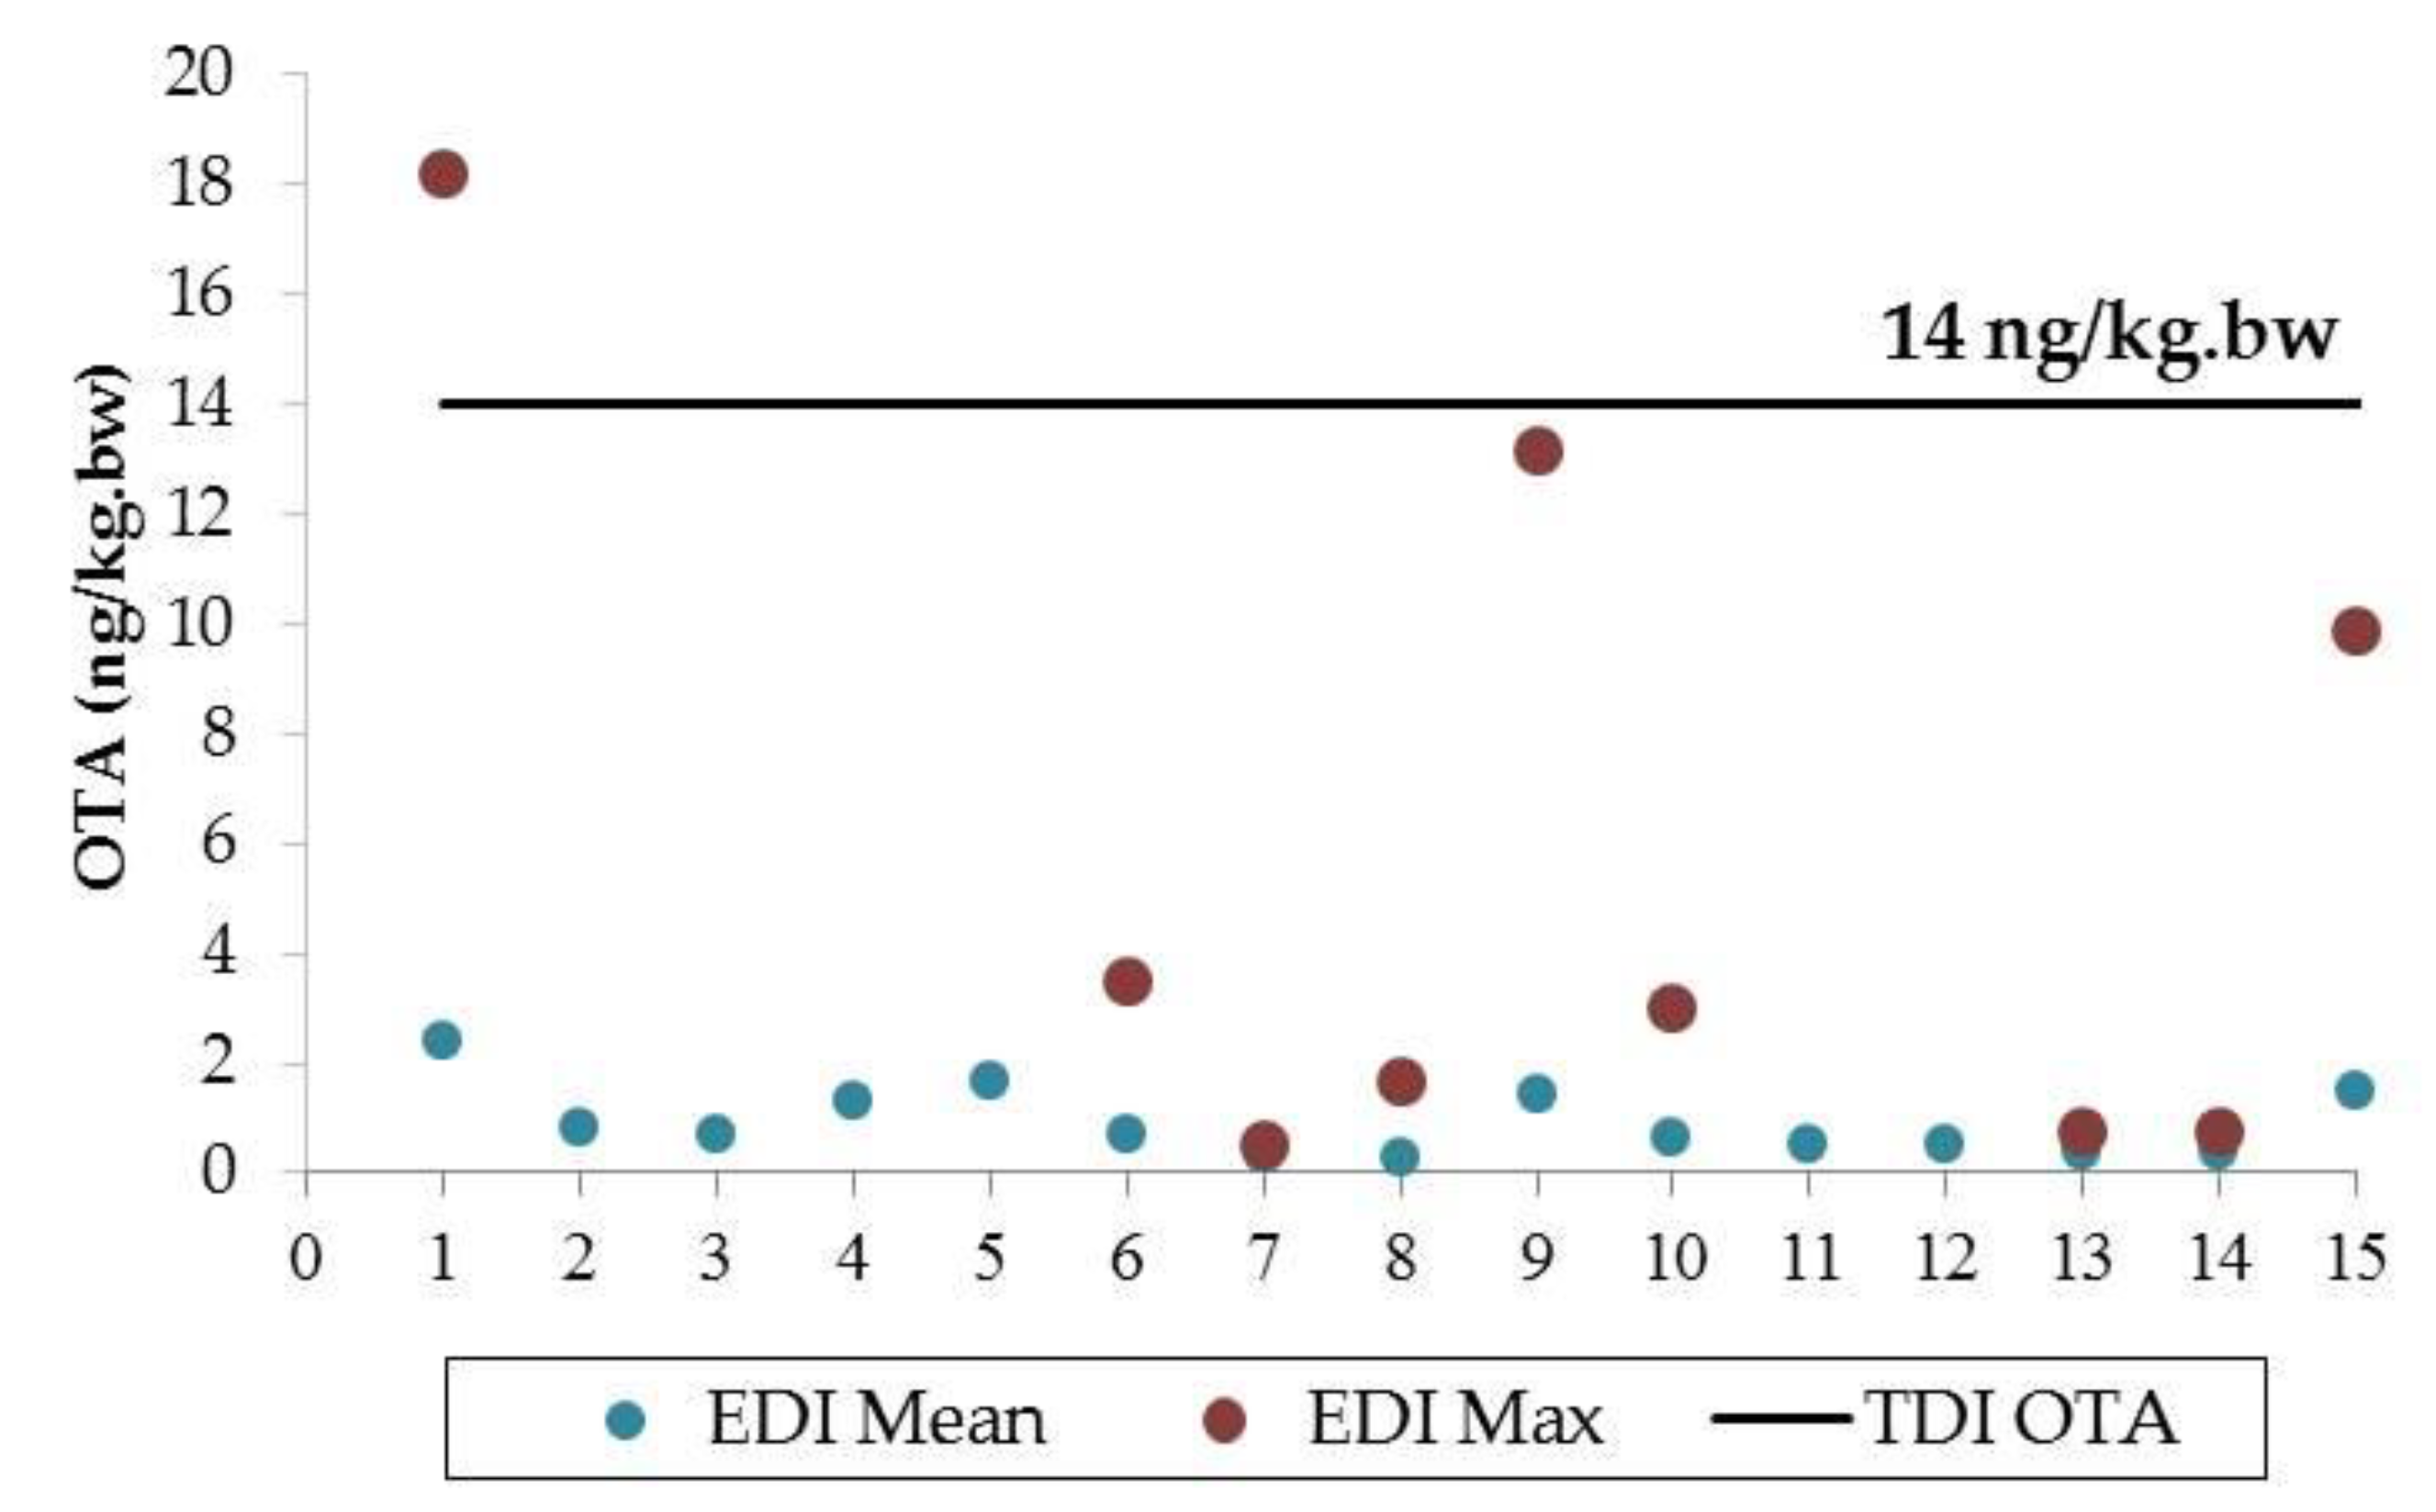
| OTA | Group 2B | TWI: 100 ng/kg.bw per week [136] corresponds to 14 ng/kg.bw per day Note: on- going (draft) scientific opinion, considered not appropriate to establish a TDI and that MOE approach needs to be applied (genotoxic, carcinogen)[140] |
| STER | Group 2B | Not established (genotoxic, carcinogen) [151] |
| ZEA | Group 3 | 0.25 µg/kg.bw [152] |
| DON (including ADON and DON-glucoside) | Group 3 | 1 µg/kg.bw [153] |
| NIV | Group 3 | 1.2 µg/kg.bw ARfD: 14 µg/kg.bw [154] |
| T-2/HT-2 | Group 3 | 0.02 µg/kg.bw ARfD: 0.3 µg/kg.bw [155] |
| CIT | Group 3 | Level of no concern: 0.2 µg/kg.bw (large uncertainties, genotoxicity and carcinogenicity not excluded) [156] |
| PAT | Group 3 | 0.017 µg/kg.bw [157] |
| Ens and BEA | Not evaluated | Insufficient data to establish TDI or ARfD [146] |
© 2020 by the authors. Licensee MDPI, Basel, Switzerland. This article is an open access article distributed under the terms and conditions of the Creative Commons Attribution (CC BY) license (http://creativecommons.org/licenses/by/4.0/).
Share and Cite
Arce-López, B.; Lizarraga, E.; Vettorazzi, A.; González-Peñas, E. Human Biomonitoring of Mycotoxins in Blood, Plasma and Serum in Recent Years: A Review. Toxins 2020, 12, 147. https://doi.org/10.3390/toxins12030147
Arce-López B, Lizarraga E, Vettorazzi A, González-Peñas E. Human Biomonitoring of Mycotoxins in Blood, Plasma and Serum in Recent Years: A Review. Toxins. 2020; 12(3):147. https://doi.org/10.3390/toxins12030147
Chicago/Turabian StyleArce-López, Beatriz, Elena Lizarraga, Ariane Vettorazzi, and Elena González-Peñas. 2020. "Human Biomonitoring of Mycotoxins in Blood, Plasma and Serum in Recent Years: A Review" Toxins 12, no. 3: 147. https://doi.org/10.3390/toxins12030147
APA StyleArce-López, B., Lizarraga, E., Vettorazzi, A., & González-Peñas, E. (2020). Human Biomonitoring of Mycotoxins in Blood, Plasma and Serum in Recent Years: A Review. Toxins, 12(3), 147. https://doi.org/10.3390/toxins12030147