Article

Polyphasic Assessment of Aflatoxin Production Potential in Selected Aspergilli

by
Stephen Abiola Akinola
1,
Collins Njie Ateba
1 and
Mulunda Mwanza
2,*
1
Bacteriophage Therapy and Phage Bio-control Laboratory, Department of Microbiology, Faculty of Natural and Agricultural Sciences, North-West University, Private Bag X2046, Mmabatho 2745, South Africa
2
Center for Animal Health Studies, Faculty of Natural and Agricultural Sciences, North-West University, Private Bag X2046, Mmabatho 2745, South Africa
*
Author to whom correspondence should be addressed.
Toxins 2019, 11(12), 692; https://doi.org/10.3390/toxins11120692
Submission received: 24 September 2019 / Revised: 10 November 2019 / Accepted: 15 November 2019 / Published: 26 November 2019

Abstract

:
This study investigated the aflatoxin production potentials of selected fungi using a polyphasic approach. Internally transcribed spacer region of the fungi was amplified using the polymerase chain reaction. Forty-five Aspergillus strains were further assessed for aflatoxin production using the conventional methods such as growth on yeast extract sucrose, β-cyclodextrin neutral red desiccated coconut agar (β-CNRDCA); expression of the aflatoxin regulatory genes and the use of both thin-layer chromatography (TLC) and high-performance liquid chromatography (HPLC). A large proportion (82.22%) of the isolates harbored the Nor-1 gene while 55.56%, 68.89%, and 80% possessed the ver-1, omt-A, and aflR genes, respectively. All 100% the isolates harbored the aflJ gene. Twenty-three isolates were positive for aflatoxin production based on the yeast extract sucrose medium (YES) test; ammonium vapor test (51%), yellow pigment production (75.5%), and β-CNRDCA tests; and blue/green fluorescence (57.7%). Based on TLC detection 42.2% produced aflatoxins while in the HPLC, total aflatoxin (AFTOT) production concentrations ranged from 6.77–71,453 µg/g. Detectable aflatoxin B1 (AFB1) concentrations obtained from the HPLC ranged between 3.76 and 70,288 µg/g; 6.77 and 242.50 µg/g for aflatoxin B2 (AFB2); 1.87 and 745.30 µg/g for aflatoxin G1 (AFG1); and 1.67 and 768.52 µg/g for aflatoxin G2 (AFG2). AFTOT contamination levels were higher than European Union tolerable limits (4 µg/kg). The regression coefficient was one (R2 = 1) while significant differences exist in the aflatoxin concentrations of Aspergillus (p ≤ 0.05). This study reports the potentials of Aspergillus oryzae previously known as a non-aflatoxin producer to produce AFG1, AFG2, AFB1, and AFB2 toxins. Aspergillus species in feedlots of animals reared for food are capable of producing aflatoxins which could pose hazards to health.
Key Contribution: This study reports for the first time the potentials of previously known atoxigenic strains of Aspergilli (Aspergillus oryzae) to produce aflatoxin. A multi-faceted approach is necessary to aid the identification of aflatoxin producing fungi.

Graphical Abstract

1. Introduction

Fungi are normal flora in the soil, hays, silage, and grains which exercise decay activities when conditions are favorable for growth [1]. Fungal growth on food and feed substrates does not culminate directly into the release of toxins that may persist in the medium even after the death of fungal pathogens but can be triggered by stress factors in the environment [2]. Mycotoxins are secondary metabolites produced by fungi in food and feed substrates [3]. Mycotoxin contamination could emanate either from the farm or during harvest and post-harvest stages along the food value chains [2]. Mycotoxin production in food and animal feed is influenced by the type of colonizing fungi, climatic conditions, environmental factors such as pH, type of food, or feed substrate, and types of agronomic practices employed in a specific locality [4,5]. Mycotoxins have thus been detected in different food substrates that include; sorghum, millet, maize, rice, wheat, peanuts, sunflower, soybean, turmeric, ginger, black pepper, almonds, walnuts, coconut, and animal feeds [6,7]. When consumed by humans or animals, mycotoxins can pose serious health hazards ranging from acute to chronic toxicity. Specific complications resulting from the consumption of food or feeds contaminated with mycotoxins includes; liver damage, hepatocarcinoma, hepatitis, cirrhosis, and DNA mutations [8,9]. Aflatoxins, fumonisins, trichothecenes, ochratoxins, deoxynivalenol, and zearalenone are among the list of fungal toxins that exist, of which aflatoxin is the most studied across the world [8]. Aflatoxicosis is a disease condition that results from direct or indirect exposure to aflatoxin through food or animals and their related food products [10].
Aflatoxins are a group of mycotoxins produced by the Aspergillus group of fungi [2]. Aflatoxins are long-lived as they are cannot be destroyed by heat treatment during the processing of agricultural commodities [4]. Aflatoxins have carcinogenic, mutagenic, and teratogenic effects in hosts [11] and this makes them the most widely researched fungal toxins globally [12]. Aflatoxins are difuranocoumaric compounds [13] produced along the polyketide pathway. The European Commission 1525/98 regulations [14] as well as the World Health Organization (WHO) and the Food and Agricultural Organization (FAO) standards stipulate that the maximum tolerable limits of aflatoxins in food products are 4–20 ng/g for total aflatoxins, 2–5 ng/g for aflatoxin B1 (AFB1), and 0.05 ng/g for the metabolizing form of aflatoxin (AFM1) [13]. In addition, the concentrations 0.05–10 µg/kg are the recommended limits in baby foods while 5 µg/kg is the maximum limit in animal feed as described by Codex Alimentarius Commission [15]. Although these standard limits may vary between countries, in most countries, the maximum limits for AFB1 in foods are within the range of 0–20 μg/kg [16]. Despite these recommended limits, the rate of aflatoxin contaminations in food and animal feed has risen dramatically and has become a menace to food safety, food security, and socioeconomic livelihood in both developed and developing countries [17]. In light of this, most developed nations and developing countries, such as South Africa, have established legislative standards to assist in the regulation of aflatoxins in both food and feed [18]. Aflatoxins are produced by some toxigenic strains belonging to the Flavi group in the genus Aspergillus [19]. Out of the over 180 species within this genus, Aspergillus flavus, Aspergillus parasiticus, and Aspergillus nomius have been reported as the major producers of aflatoxins in agricultural commodities [20]. In recent times, more fungal strains have been implicated in aflatoxin production. This includes; Aspergillus oryzae, A. bombycis, A. ochraceoroseus, A. pseudotamarii, A. tamarii, A. parvisclerotigenus, A. rambellii, A. nidulans, A. niger, A. arachidicola, and A. minisclerotigenes sp. Nov, and some newly emerging strains; Emericella venezualensis and E. astellata from the genera Emericella [21,22,23].
Out of the 20 known aflatoxins produced by Aspergillus strains, AFB1, aflatoxin B2(AFB2), aflatoxin G1 (AFG1), aflatoxin G2 (AFG2), and the metabolizing forms of aflatoxin (AFM1 and AFM2) are the most common form of mycotoxins in food that are associated with mycotoxicosis [24]. Previous reports have documented the presence of aflatoxins in food and animal feed components in several countries [4,20,21,24]. For instance, in developing countries such as Nigeria, South Africa, China, and Zimbabwe, aflatoxins have been detected in maize, peanuts, Bambara nuts, beans, spices, cashew nuts, rice, milk, and corn-starch while in Argentina, soybean and maize are the most implicated food products [25]. Also, in the United States of America, Portugal, the United Kingdom, and Sweden aflatoxin contaminations have been reported in almonds, spices, and Brazil nuts [4,20,21,24]. Despite the increasing awareness on the occurrence of aflatoxin in food and feeds, the proliferation of toxigenic fungal strains has continued to increase, thus creating opportunities for previously non-toxigenic strains to acquire determinants that afford them the potential to produce aflatoxins. In addition, the difficulty in clearly differentiating aflatoxin producing fungi from the non-producers amplifies the need for this study. In this study, we therefore investigated the potential of Aspergilli colonizing feedlots of animals reared for food production in Mafikeng, South Africa to produce aflatoxins using a polyphasic approach.

2. Results and Discussion

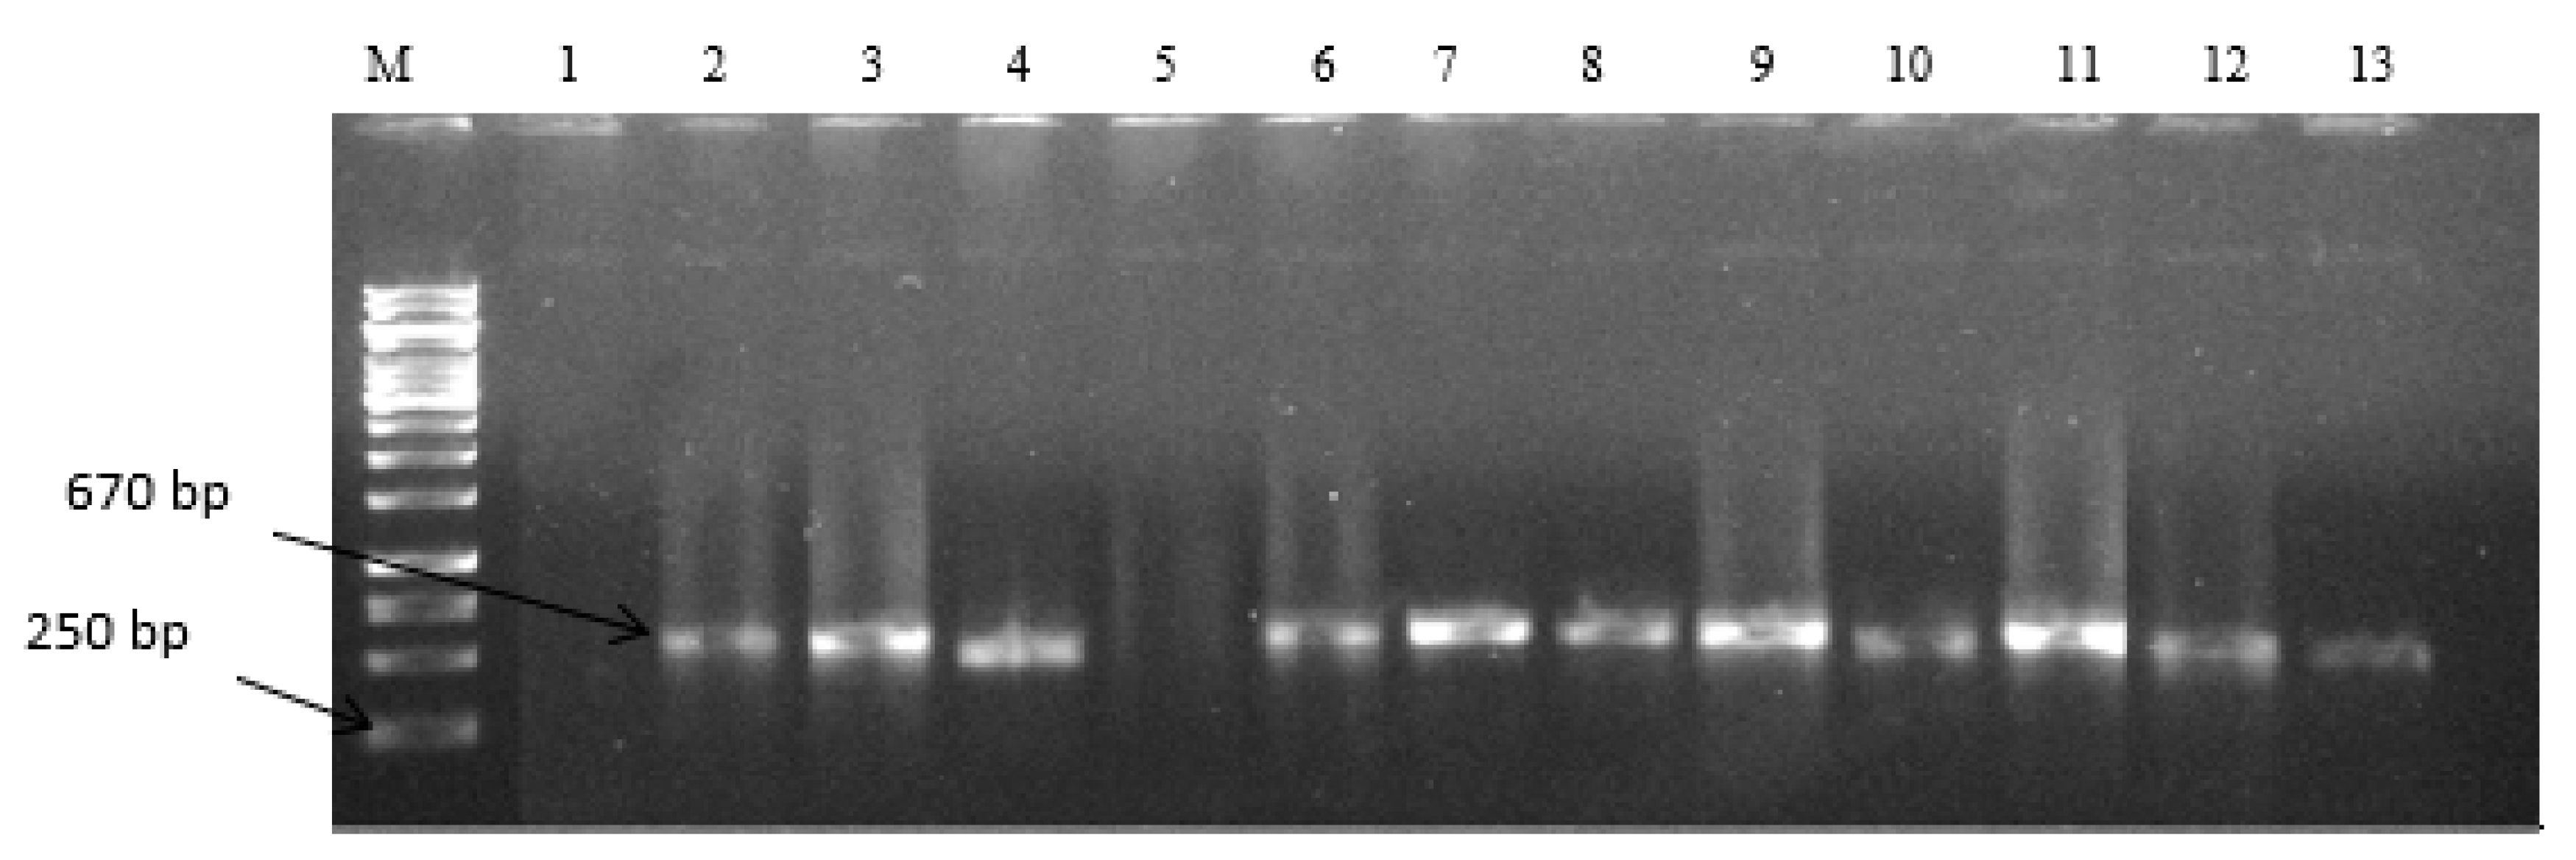
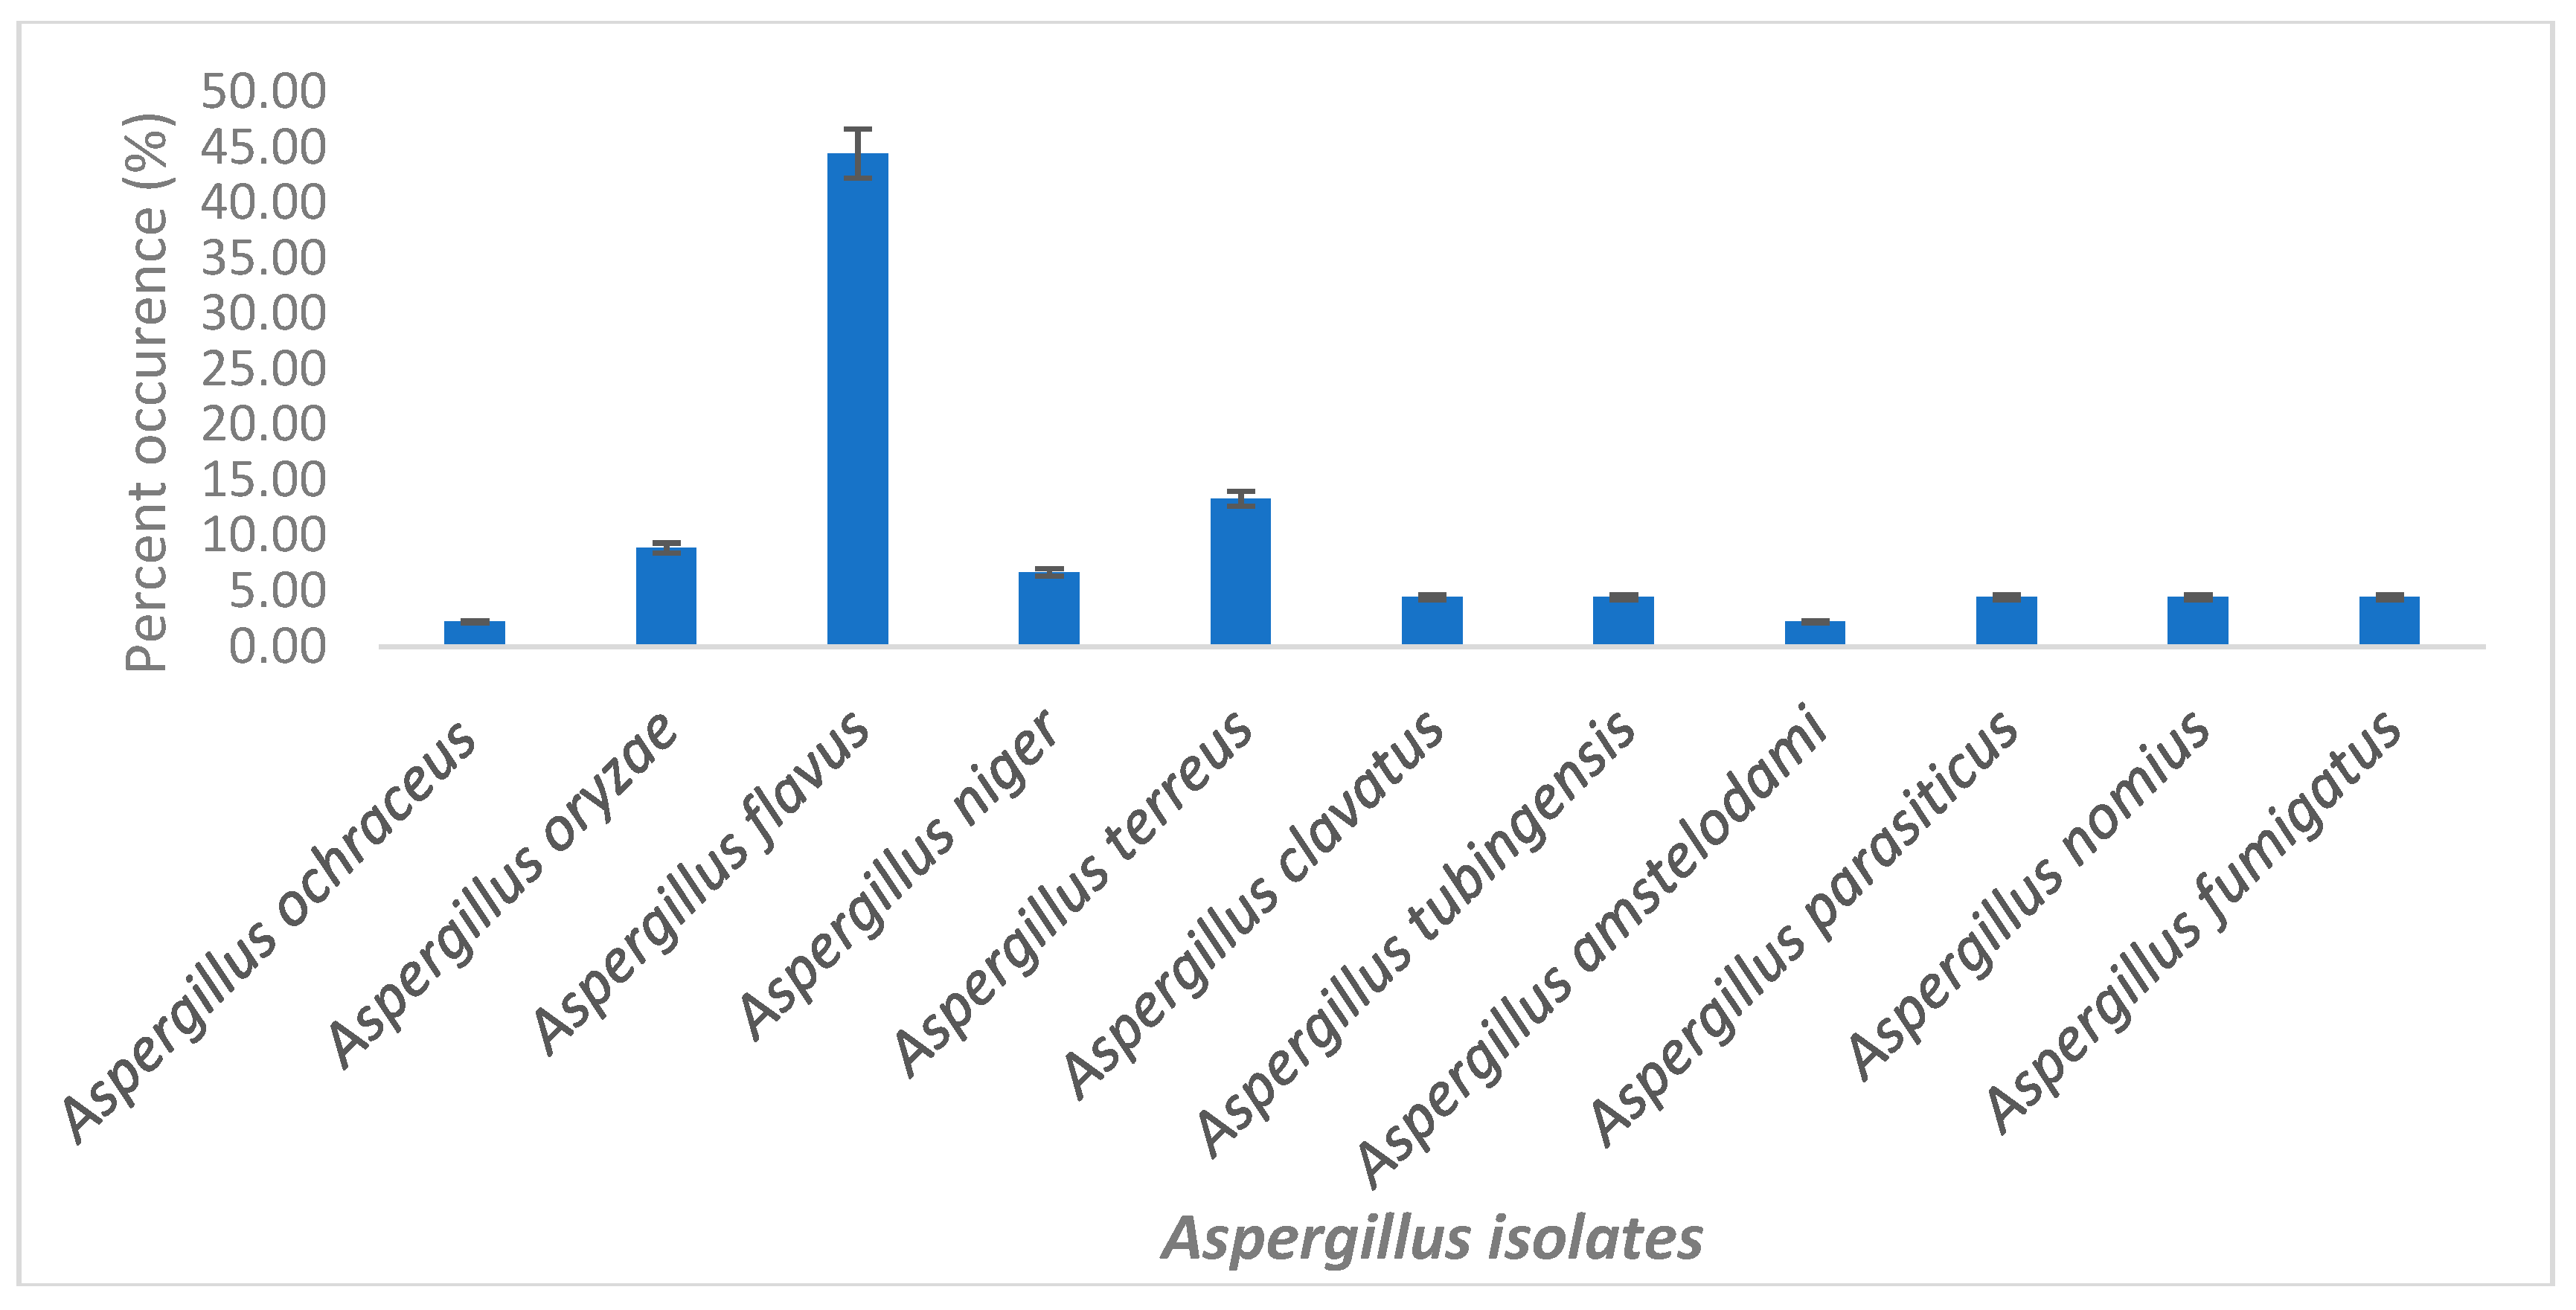
2.1. Characterization of Selected Aspergilli

The morphological characteristics of selected Aspergilli isolates are presented in Table 1. The pigment variation observed on media plates of isolates ranged from light green, deep green to blue-green, and black pigments. Mycelia were well developed and the identification based on molecular characterization confirms their identity as belonging to the Flavi family. A total of 45 representative fungi isolates had amplification at an expected band size of 670 bp as shown in Figure 1 and these were further used in the investigations. There was a positive amplification of the internally transcribed spacer region (ITS)1 and ITS4 regions which are known as conserved regions in fungi and are often used in their discrimination. The blasted sequences of fungal isolates showed high homology (90–100%) to known strains in the NCBI gene bank and helped to further identify the selected fungi strains as belonging to the Aspergillus genera. The percent diversity of selected fungi strains is as presented in Figure 2. The percentage occurrence of different species of Aspergilli ranged from 2.2–44.4%. Aspergillus flavus had the highest occurrence (44.4%) while Aspergillus ochraceoroseus, Aspergillus tubingensis, and Aspergillus amstelodami (2.2%) had the lowest. Other identified strains include; Aspergillus oryzae (8.8%), Aspergillus niger (6.67%), Aspergillus terreus (13.3%), Aspergillus clavatus, Aspergillus tubingensis, Aspergillus nomius, Aspergillus fumigatus, and Aspergillus parasiticus (4.44%).

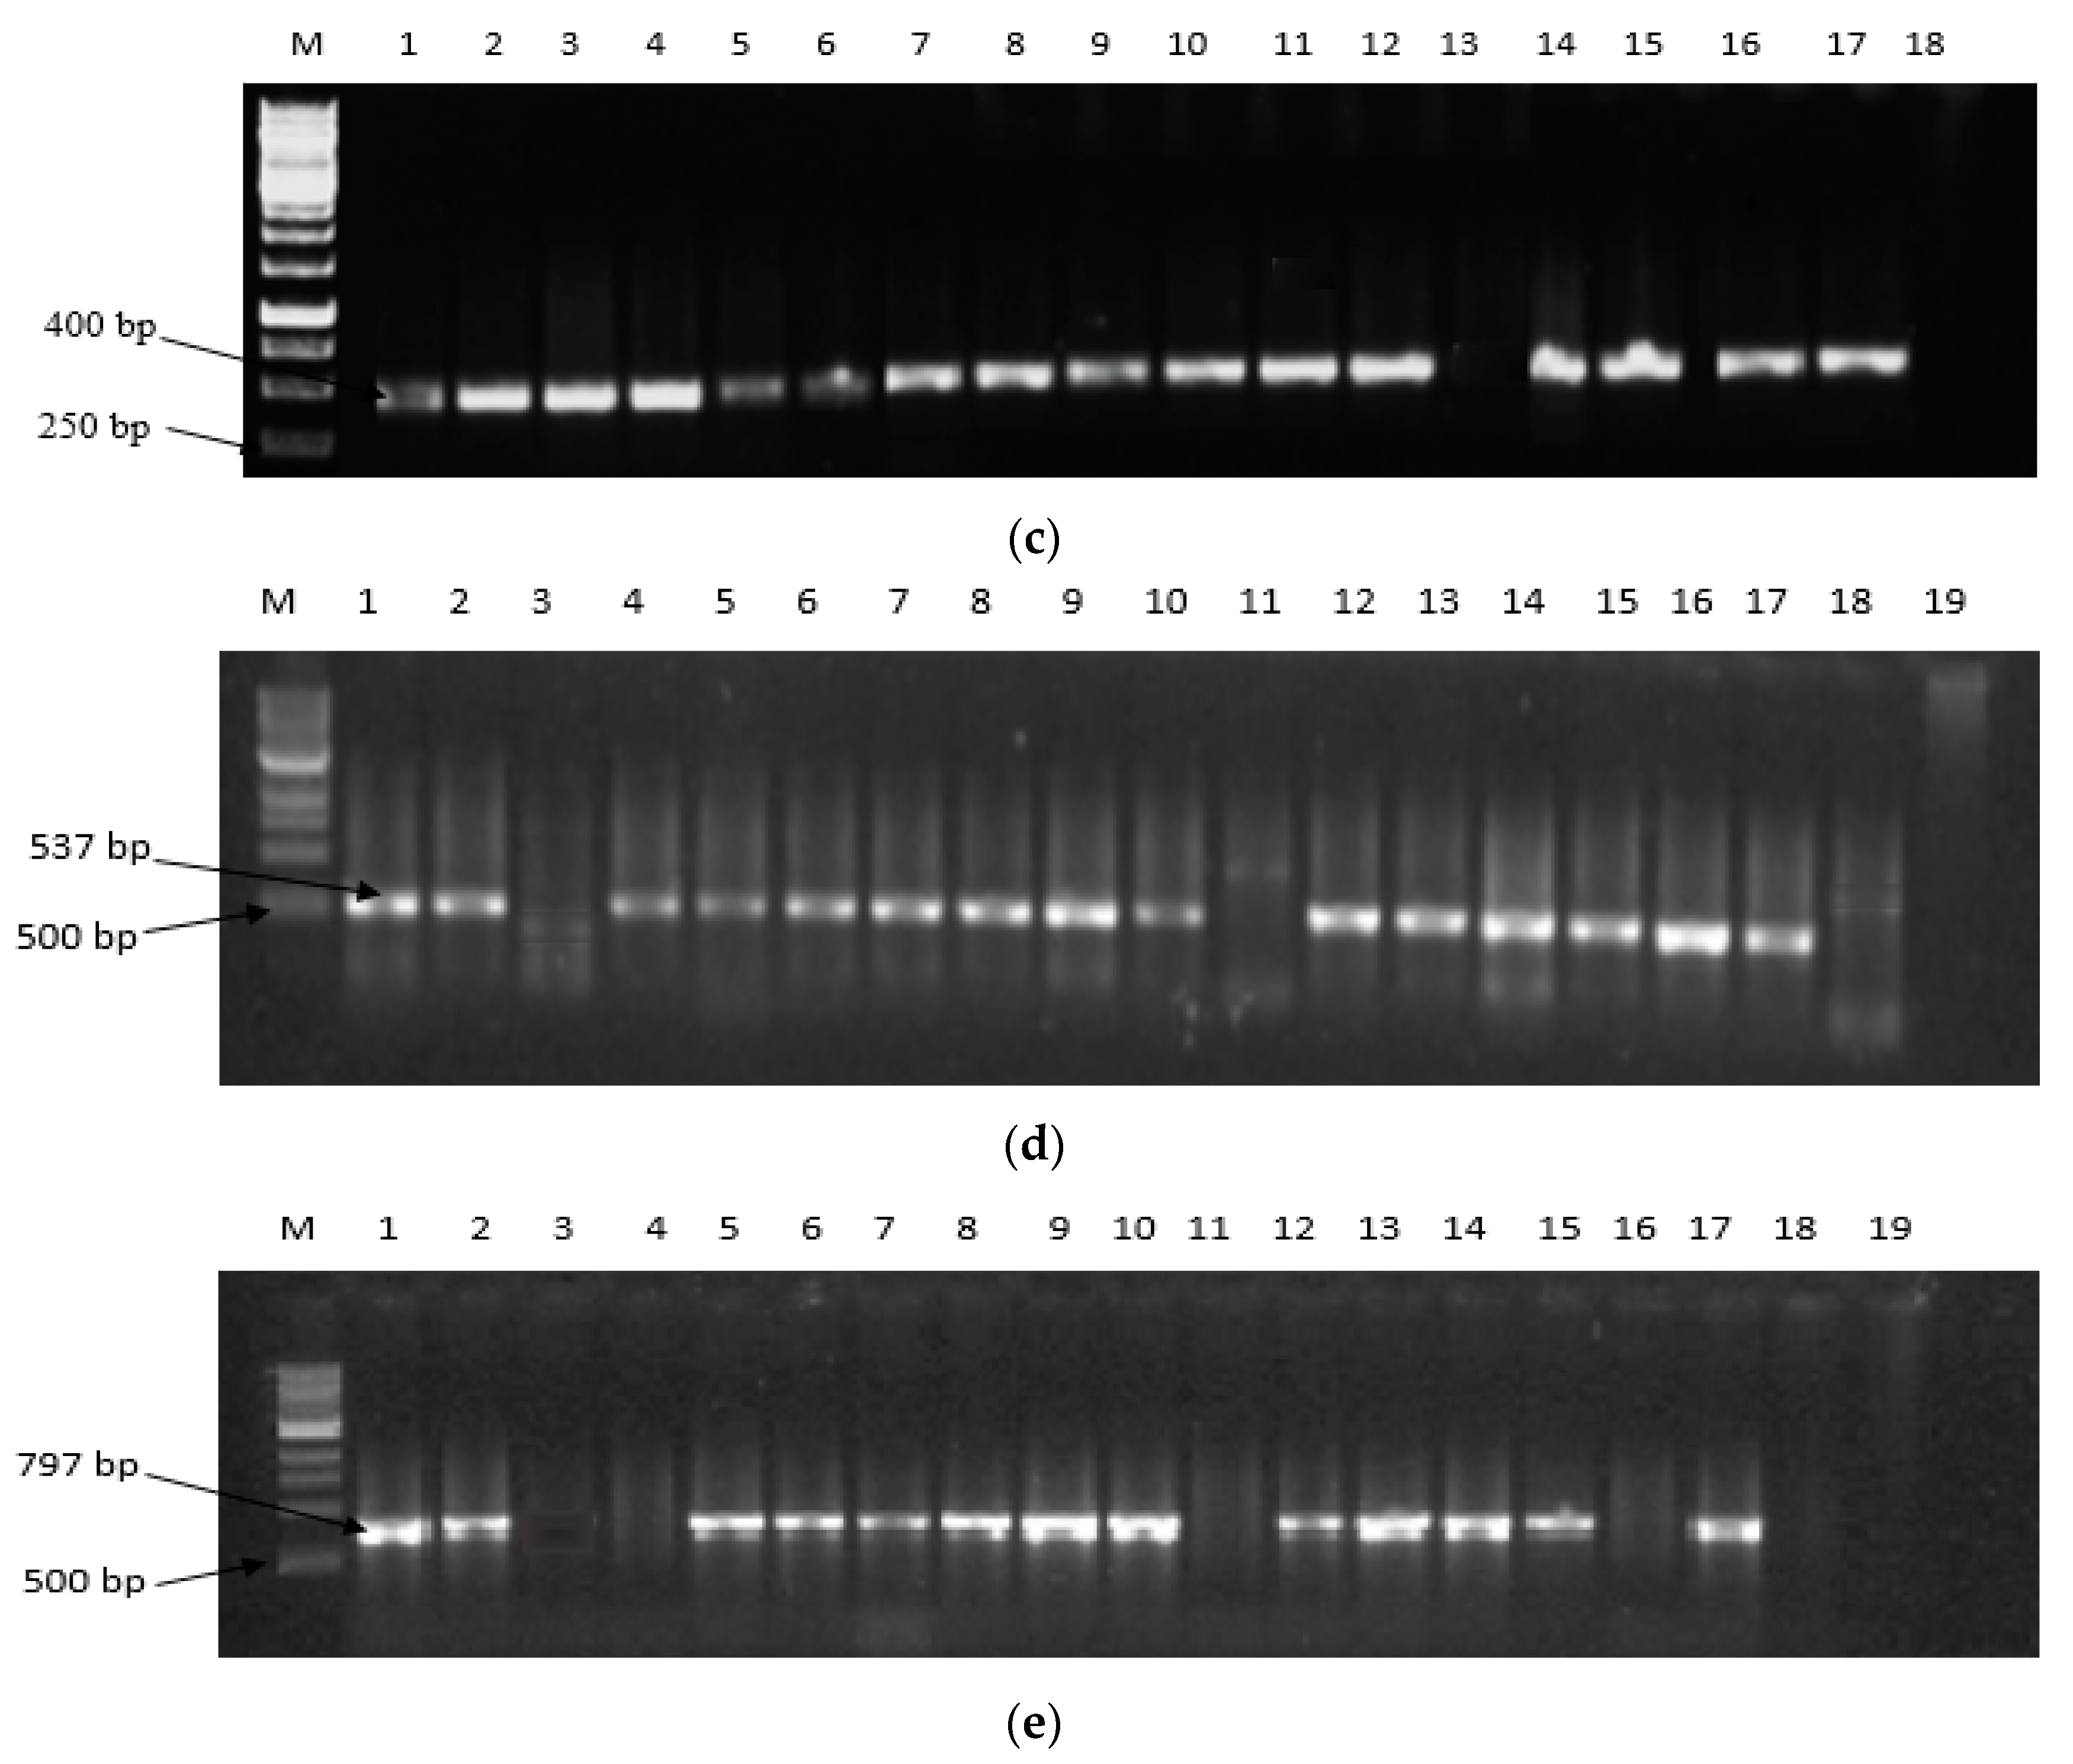
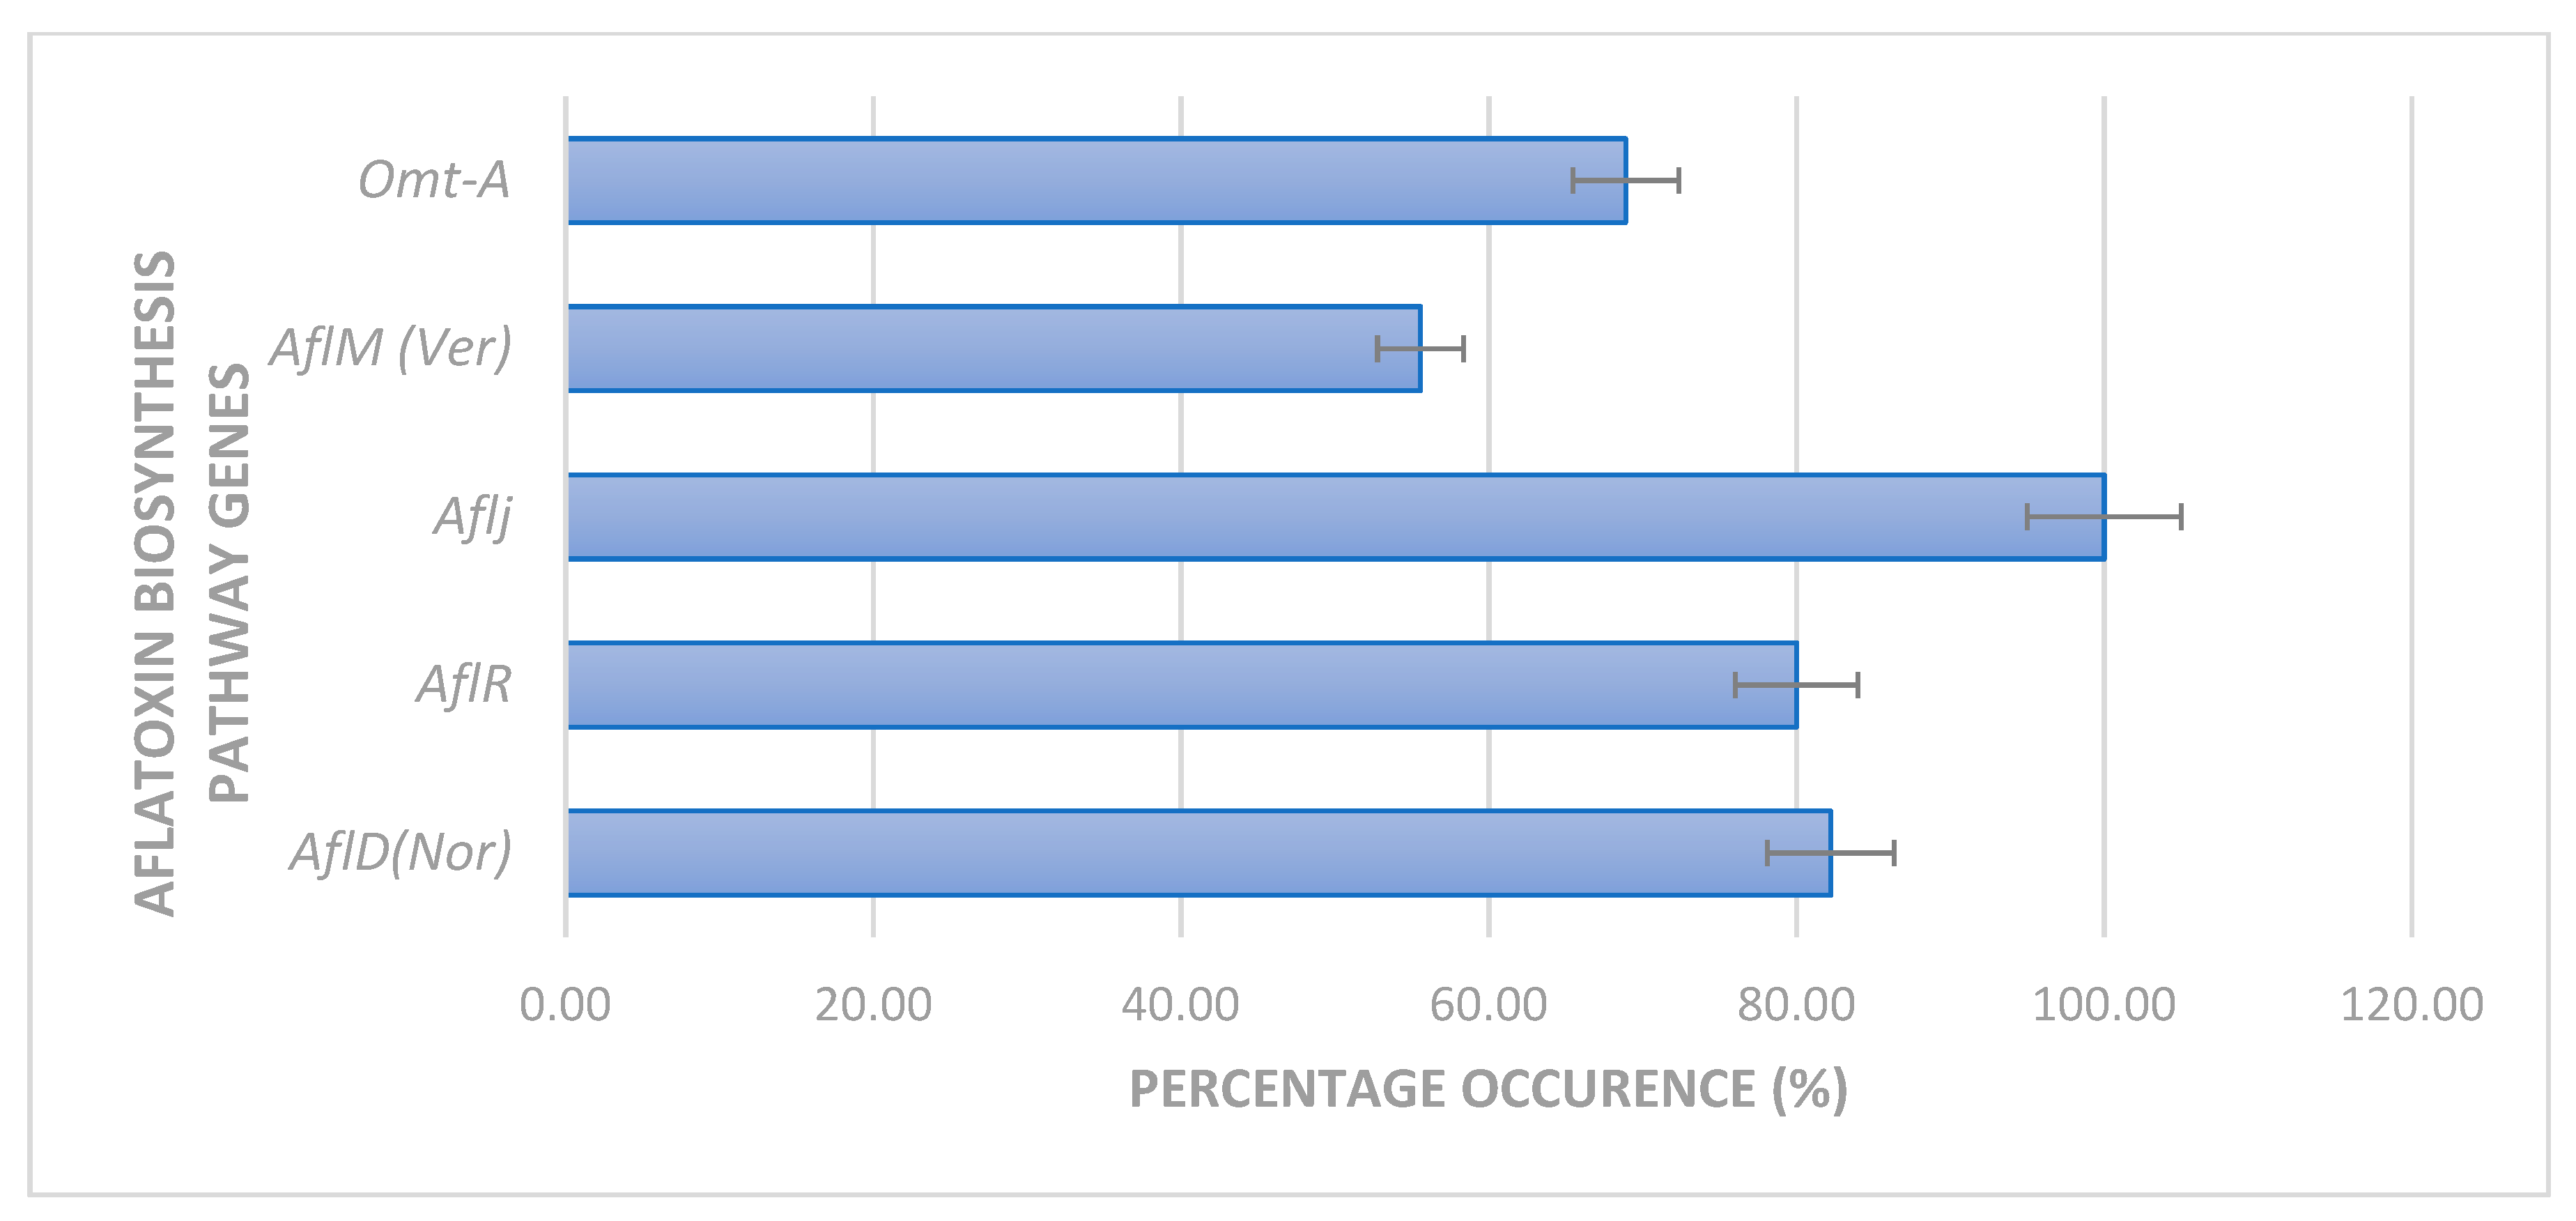
2.2. Expression of Aflatoxin Biosynthesis Pathway Genes

Figure 3a–e presents the gel electrophoresis pattern of amplified aflatoxin regulatory genes in representative Aspergilli. Figure 3a presents a representative gel electrophoresis pattern of the amplified aflR gene. Successful amplification was obtained at an amplicon band size of 1032 bp in the representative Aspergillus strains and was comparable to the positive control (Aspergillus flavus ATCC 259622TM) while the negative control (Saccharomyces cerevisiae) had no amplification. However, some isolates had no amplification (FG1, FG7, FG8, FG16, FG29, and FG40). As shown in Figure 4, a total of 88.8% of the isolates had the aflR gene while no amplification was obtained in the negative internal control (DNA free water) and the other isolates. Figure 3b presents the gel electrophoresis patterns of aflJ gene amplification in selected representative Aspergilli. Contrary to that in the aflR gene, 100% amplification was obtained in aflJ in selected Aspergillus strains at 737 bp.
Furthermore, Figure 3c presents the gel electrophoresis patterns from the amplification of aflD (Nor-A) gene. A total of 86.4% had positive amplification (Figure 4) at an expected band size of 400 bp. The positive control was amplified while the negative controls was not. Nor-A gene was not detected in Aspergillus sp. (FG2), Aspergillus terreus (FG6 and FG11), Aspergillus amstelodami (FG13), and Aspergillus tubingensis (FG16) despite the expression of either aflR or aflJ genes. Figure 3d presents the gel pattern for the amplification of aflM (ver-1) gene in representative Aspergilli. There was a total of 24 (58%) positive amplifications as shown in Figure 4. Amplification was observed at an expected band size of 735 bp except in the negative control and some Aspergillus strains; Aspergillus flavus, Aspergillus niger, Aspergillus terreus, Aspergillus clavatus, Aspergillus amstelodami, Aspergillus fumigatus, and Aspergillus tubingensis. Also, the gel electrophoresis pattern for the amplification of omt-A gene is as presented in Figure 3e. A total of 73% (Figure 4) of the Aspergilli had positive amplification at the expected amplicon size of 797 bp. However, no amplification was observed in 28% of the isolates and, as expected, in the negative control.
The detection of aflatoxins produced in selected fungal isolates was evaluated by the ammonium vapor test using the yeast extract sucrose medium. The production of yellow pigment around the colony, and detection of fluorescence under UV-light in the β-CDNRDCA media. As presented in Table 2, a total of 29 of the test isolates had a positive reaction to the ammonium vapor test, as shown by the production of a reddish brown ring around the fungal colony while 75.5% had yellow pigment production around the fungal colony in β-CDNRDCA. Twenty-six (57.7%) out of the total isolates had blue to blue-green fluorescence in β-CDNRDCA media when viewed under the UV-light at a wavelength of 365 nm. The degree of fluorescence in β-CDNRDCA ranged from no fluorescence (44.4%) to low (6.6%), mild (15.5%), high (20%), and very high fluorescence (4.44%). Aspergillus nomius (FG15) and Aspergillus flavus (FG14) were found to produce a very high fluorescence under the UV-light.
Furthermore, Aspergillus clavatus (FG27, FG35), Aspergillus terreus (FG37, FG38), and Aspergillus flavus (FG32 and FG45) had yellow pigment produced but failed to produce fluorescence in β-CDNRDCA under the UV-light despite the aflatoxin regulatory genes were positively expressed. Aspergillus niger (FG21) produced a yellow pigment and fluorescence while it produced no red pigment on ammonium vapor test. Aspergillus flavus (FG39) had a positive reaction in ammonium vapor test but failed in the production of yellow pigment on the yeast extract sucrose medium (YES) medium. Aspergillus oryzae (FG1) and Aspergillus flavus (FG2) had positive reaction in ammonium vapor test, produced a yellow pigment but failed to fluoresce on β-CDNRDCA.
The thin-layer chromatography (TLC) detection was conducted on all selected Aspergillus isolates. Nineteen (42.2%) out of the 45 selected strains tested positive for the production of aflatoxins. AFB1 and AFB2 production were shown by a blue fluorescence while AFG1 and AFG2 were confirmed by a blue-green fluorescence at a similar migration pattern to the standards. Figure 5 presents the results of aflatoxin detection in wheat flour inoculated with presumptive toxigenic species of Aspergilli using the TLC. The production of aflatoxins (AFB1, AFB2, AFG1, and AFG2) was detected in the Aspergillus species inoculated in wheat flour. Lanes 5 and 8 showed detection of another toxin aside those assayed (AFB1, AFB2, AFG2, or AFG1) in this study. No toxin was detected in the negative and the internal controls while there was the detection of AFB1 and AFB2 in the positive control (Aspergillus flavus) thus signifying a reliable result.
Aspergillus flavus (FG4) and Aspergillus oryzae (FG34 and FG36) isolates that have shown capabilities to produce aflatoxins through the ammonium vapor test and fluorescence on β-CDNRDCA were not detected on the TLC. Also, the non-detection of aflatoxin in Aspergillus flavus (FG9 and FG4) and Aspergillus oryzae (FG34 and FG36) on TLC and YES medium despite the potentials displayed in the molecular assay could be due to the low concentration of aflatoxin, below the optimum level of detection on the TLC plates.
A total of 23 isolates were selected for further aflatoxin quantification using the high-performance liquid chromatography (HPLC). Presumptive toxigenic Aspergillus strains were selected based on the revealed potentials for aflatoxin production through the molecular, conventional, and TLC assays. Table 3 presents the quantity of aflatoxins produced by selected Aspergilli inoculated in wheat flour substrate (µg/g). The concentration of AFG2 produced by selected Aspergilli ranged from 0.00 to 769 µg/g, AFG1 (0.00–745 µg/g), AFB2 (0.00–243 µg/g), AFB1 (0.00–7029 µg/g), and total aflatoxin (AFTOT) (0.00–71,454 µg/g). The AFG2 production was highest in Aspergillus nomius (FG15) while AFG1 was highest in Aspergillus parasiticus (FG12). Similarly, Aspergillus parasiticus (FG12) produced the highest AFB2 concentration (243 µg/g) while Aspergillus nomius (FG15) produced the highest AFB1 (70,289 µg/g) and AFTOT (71,454 µg/g). AFB2, AFG2, and a negligible amount of AFG1 and AFB1 was produced by Aspergillus ochraceoroseus. Furthermore, Aspergillus oryzae (FG25) produced both AFG2 and AFB2 only while Aspergillus nomius (FG43) and Aspergillus ochraceoroseus (FG44) produced all the aflatoxins assayed.
The standard calibration curves for AFB1, AFB2, AFG1, AFG2, and AFTOT gave an excellent linearity with the highest coefficient of regression (R2) of one. The limit of detection (LOD) was 10 µg/g, the limit of quantification (LOQ) was 20 µg/g while the per cent recovery calculated from the matrix-effect and slope was 85%. The assayed aflatoxins were eluted at the following retention time; AFG2 (5.5–6.5 min), AFG1 (6.5–8.0 min), AFB2 (8.0–9.5 min), and AFB1 (10.0–11.5 min). The AFG1 quantification on linearization followed the regression equation y = 3E + 06x while AFG2 (y = 9E + 06x), AFB2 (y = 4E + 06x), AFB1 (y = 7E + 06x), and AFTOT (y = 2E + 07x). The aflatoxin production by different Aspergillus strains was significant at a 95% confidence interval. AFG2 production among the Aspergillus spp. showed a significant difference (p ≤ 0.05) in the isolates compared to the controls. Also, a significant difference existed between the AFG1 concentration of FG12, FG15, FG10, FG31, FG 44, FG22, and FG43 isolates while no significant difference was obtained in the control and other isolates.
Furthermore, FG10 and FG4 were not significantly different from each other in terms of total aflatoxin production (AFTOT). Likewise, FG22 and FG7, FG24 and FG14, and FG20 and FG42 had no significant difference at p ≤ 0.05 but differs with reference to aflatoxin production in the controls and other Aspergillus species investigated. The isolates FG7, FG19, FG22, FG40, FG42, and positive control (Aspergillus flavus) had AFG2 concentration below the limit of detection while isolates FG10, FG22, FG31, FG43, and FG44 had AFG1 concentrations below the LOD. Similarly, isolates FG4 and FG44 had AFB2 and AFB1 concentrations below the LOD, respectively.

3. Discussion

Fungi belonging to the group Aspergillus, Penicillium, and Fusarium [29] have been implicated for mycotoxin production in food and feed. This could be as a result of their supposed dominance in agricultural commodities which serves as food for both humans and animals. It is noteworthy that prior to mycotoxin production in food/feed substrate, spore growth of fungal colonies having the capacity to produce mycotoxin is critical. Notably, some Aspergillus species that have been reported to have the ability to produce aflatoxin includes; A. flavus, A. parasiticus, A. nomius, A. bombycis, A. ochraceoroseus, A. pseudotamarii, A. parvisclerotigenus, A. rambellii, and A. tamarii [22]. However, some other groups of fungi have recently been implicated to produce aflatoxin of which many fungi of the genus Aspergillus are the most abundant in the tropical part of the world [30,31] and are readily involved in food spoilage. Furthermore, animal feeds, such as hay and straw, can be contaminated with pathogenic fungi which are abundant in the environment during pre- or post-harvest operations [1]. As obtained in this study, a large portion of Aspergilli obtained from feedlots of animals belongs to the species A. flavus (42.2%). This supports the report on A. flavus as the most common and prevalent Aspergillus species in nature, and has been described as the main fungal contaminants in African foods and feeds [30].
The amplification of the aflR and aflJ genes in Aspergillus species is indicative of the presence of aflatoxin regulatory genes. The aflR gene has been reported to mediate in the initiation of the transcript for aflatoxin biosynthesis pathway. However, the presence of aflR and aflJ gene does not necessarily imply the capability of fungi to produce aflatoxin as the AF pathway is governed by many mechanisms [21]. Some previously known atoxigenic strains such as A. oryzae and A. sojae have been reported to possess the aflR gene [32] and similar morphological characteristics to Aspergillus flavus and Aspergillus parasiticus [21].
Furthermore, aflJ is another regulatory gene in the aflatoxin biosynthesis pathway that is important for the expression of other aflatoxin biosynthesis genes which are responsible for the conversion of primary metabolites to aflatoxin [33]. However, despite the presence of aflJ in the aflatoxin biosynthesis pathway, its role is still unclear. aflR and aflJ are two genes with individual promoters that could be separately expressed in fungi. A similar observation was observed in this study in that some Aspergillus species were found to possess both the aflR and aflJ aflatoxin regulatory genes. This observation corroborates the report on the expression of aflR and aflJ in some Aspergillus isolates from Cashew nut [21]. The expression of aflR or aflJ gene still calls for concern as these genes are indicative that such fungi could later acquire and express some other aflatoxin genes. Unfavorable conditions such as substrate, pH, temperature, water activity, plant metabolites, and light are factors that predisposes aflatoxin biosynthesis [34,35] likewise evolution and competition within the eco-system.
Also, the non-amplification of Nor-A gene in FG2, FG6, FG11, FG13, and FG16 may be due to the presence of a non-functional aflR or aflJ genes, mutation as a result of insertion or deletion in the promoters needed for reads in Nor-A gene amplification. Nor-A gene is made up of a protein known as ketoreductase which converts AFB1 intermediate (Norsolorinic acid) into averantin. This protein is found in the cytosol of the fungal vegetative cell. The aflD gene is responsible for the expression of some other aflatoxin intermediates (averantin, verscolorin, and sterigmatocystin) along the AF’s pathway [36]. The none amplification of the Ver-1 gene in some Aspergillus species could be due to a frame shift in the genome or gene mutation which could be a function of exposure to adverse environmental condition [32]. The aflM is a gene known for the conversion of averantin to versicolorin-A in the aflatoxin biosynthesis pathway [37]. However, some isolates portrayed the ability to produce other metabolites in the flour substrates hence, further investigation on the metabolomic profiles of the Aspergilli inoculated into flour substrates could be necessary. Several studies have reported the links between the sterigmatocystin, aflatoxin production, and fungal growth. The omt-A gene in Aspergillus strains is crucial to aflatoxin production especially in toxigenic Aspergillus species except in Aspergillus nidulans and Aspergillus terreus [34,38]. The omt-A gene is responsible for the conversion of sterigmatocystin to o-methylsterigmatocystin [21] which is critical to aflatoxin production. Furthermore, some isolates have been evaluated to possess all the aflatoxin regulatory genes and the necessary enzymatic processes leading to sterigmatocystin production but yet having no ability to produce o-methylsterigmatocystin [33]. A similar observation was obtained in this study (Table 2) where Aspergillus flavus (FG45 and FG39) and Aspergillus oryzae (FG1) possess aflR, aflJ, aflD, and aflM but lack the omt-A gene leading to sterigmatocystin production. Therefore, this study affirms that the presence of o-methylsterigmatocystein does not necessarily confirms aflatoxin production.
Notably, in Aspergillus terreus (FG17) aflM (ver-1) and omt-A gene were not detected, this could be due to inadequate environmental conditions which could have caused a mutation of the omt-A and aflM gene in the fungal pathogen. This observation might be due to a distortion in the order of enzyme production leading to aflatoxin biosynthesis. The several transcription factors such as pH, carbon, or nitrogen source hold the ability to affects chromatin organization by either inhibiting or activating gene expression. These factors could either support the binding or mismatching of sequence-specific primers to sites in the promoter regions of the target genes thereby forming complexes that aid another form of transcription process [38]. Another factor that could affect the expression of aflatoxin biosynthesis genes is the location of the chromosome in the genome of presumptive toxigenic fungi [39]. The presence of hexose utilization gene cluster next to the aflatoxin biosynthesis pathway could interfere with the aflatoxin production pathway since aflatoxin can be induced by simple sugars such as glucose and sucrose [40].
As observed in this study, the conventional method (YES and β-CDNRDCA) aided the effective discrimination of the toxigenic strains of Aspergilli compared to the sole use of the molecular assay. However, this observation is in agreement with the previous reports on the inadequacy of the use of only molecular method in the identification of aflatoxin producers [21,29,41,42]. The formation of only yellow pigment and fluorescence by Aspergillus strains have been reported not to be a reliable means of identifying aflatoxin-producing strains of Aspergilli. Hence, the need to combine both the conventional with the molecular method. The observation of the failure of isolates FG27, FG35, FG37, FG38, FG32, and FG45 to produce fluorescence under UV-light despite the positive expression of aflatoxin biosynthesis pathway genes is in conformity with previous reports [21,42] where authors reported a similar observation in some Aspergillus strains isolated from Cashew nuts, millet, and sesame grains in Nigeria, respectively. A bright blue fluorescence is usually achieved when a reaction exists between a produced aflatoxin and hydrophobic β-cyclodextrin which is capable of fluorescing under UV-light [43]. The non-fluorescence of fungal isolates in β-CDNRDCA might be due to low concentration of aflatoxin produced in the test medium making its capture under the UV-light insignificant. Some atoxigenic strains of Aspergilli have been reported to show the ability to produce yellow pigment while not possessing the ability to produce aflatoxins [44]. The yellow pigment and ammonium hydroxide vapor observed on the reverse side of the β-CDNRDCA and YES plates respectively is an anthraquinone biosynthetic intermediates (Averufin) which are produced along the aflatoxin biosynthesis pathway often found between norsolorinic acid (Nor) and versicolorin A [45].
Also, the non-detection of aflatoxin in Aspergillus flavus (FG9 and FG4) and Aspergillus oryzae (FG34 and FG36) on TLC and YES medium could be due to unsuitable substrates that could aid the production of the secondary metabolites. Source of nutrient (carbon or nitrogen) could affect the growth rate of fungal species which could alter the aflatoxin production kinetics in toxigenic strains [39]. Aspergillus flavus is known to be a chief producer of AFB1 and/or AFB2 toxins, however, in this study Aspergillus flavus (FG9) was found not to produce either of the two toxins in wheat flour substrate. This could either be due to the low level of aflatoxin production below the level of detection or lack of favorable conditions such as a substrate for growth, moisture content, temperature, and pH to aid growth and production of aflatoxins. The variation in the aflatoxin-producing ability of Aspergillus flavus (FG9) supports the findings of Abbas, Zablotowicz [44] on Aspergillus flavus.
Furthermore, Aspergillus oryzae (FG34 and FG36) did not produce aflatoxin as shown in Table 3 despite its ability shown in the conventional assays. This finding supports the previous report that Aspergillus oryzae are a domesticated type of Aspergillus flavus and are known to be atoxigenic. There exists a positive correlation between the TLC and HPLC methods used in the detection of aflatoxin in selected fungi. In recent times, the occurrence of aflatoxin producers among the Aspergillus genera has been on the increased giving rooms to some strains not previously characterized as aflatoxin producers. Aspergillus nomius, Aspergillus bombycis, Aspergillus ochraceoroseus, and Aspergillus pseudotamarii has been described to produce aflatoxin occasionally [22], thus supporting the findings in this study. Aflatoxin production is an undesirable activity of the Aspergillus genera that poses a huge threat to the safety and health of humans and veterinary. In this study, it was observed that some Aspergillus flavus isolates (FG18, FG19, FG20, FG24, and FG33) hold the ability to produce AFB and trace amount of AFG’s, against the previous report of its production exclusively by Aspergillus parasiticus. The production of the aflatoxin G’s by some strains previously known as non-aflatoxin producers could be due to genetic interaction between the toxigenic and atoxigenic strains of fungi within the eco-system. A high gene similarity has been reported along the sterigmatocystin pathway of Aspergillus flavus and Aspergillus parasiticus [40]. Similarly, Aspergillus oryzae and Aspergillus sojae have been shown to be closely related to Aspergillus flavus and Aspergillus parasiticus but yet to be reported as aflatoxin producers [46]. The inability of Aspergillus oryzae and Aspergillus sojae to produce aflatoxin has been explained to be due to gene deletion or mutations that resulted in the silencing of the aflatoxin biosynthesis gene [47]. However, Aspergillus oryzae and Aspergillus sojae holds the potentials to produce aflatoxin. This assertion was based on the fact that they possess a similar aflatoxin biosynthesis pathway genes as observed in Aspergillus flavus and Aspergillus parasiticus. We suggest the production of aflatoxin by Aspergillus oryzae in this study might be due to a lateral gene transfer between the genome of aflatoxin-producing strains and previously known atoxigenic strains colonizing the feedlots of animals that are kept for food. Therefore further studies could be conducted to investigate gene alteration and mutations in fungal isolates as a result of extreme environmental conditions or as a product of microbial interactions.
The closer the R2 is to one the higher the accuracy of a determination. Hence, the high R2 value obtained in this study depicts the accuracy of the aflatoxin determinations. The concentrations of aflatoxins produced by some of the fungal pathogens were below the LOD which is desired, however, the concentrations might increase if pathogens are exposed to more favorable growth conditions. The total aflatoxin production reported in this study are above the European Union tolerable limits for aflatoxin (4 µg/kg) and the legislated aflatoxin limits of 20 μg/kg in animal feeds. The Fertilizers Farm, Feed, Agricultural Remedies and Stock Remedies Acts (Act No. 36 of 1947) stipulates 10 µg/kg standards for aflatoxins (South African Government 2009) while standards of 20 ppb set by some countries were exceeded in this present study. The Federal Drug Agency USA have set a tolerable limit of aflatoxin in feedstuff at 1000 µg/kg (Kubo, 2012). Toxigenic strains of fungi belonging to the Flavi family are known as producers of aflatoxins which could have a negative effect on the health of both animals and human [48] when ingested in food. Aspergillus flavus and Aspergillus parasiticus have been grouped as a group one carcinogen by the International Agency for Research on Cancer [49] and rated as the major cause of liver cancer. The incidence of aflatoxin in animal feeds has been reported in South Africa, Kenyan, Sudan, Morocco, and Nigeria [50,51,52,53,54,55].

4. Conclusions

This study supports the use of a polyphasic approach in the evaluation of toxin producing potentials of fungal species as a single approach might not give a reliable insight into the toxin production ability of presumptive toxigenic fungi. The fluorescence assays and chromatography approach could serve as a confirmatory assay to the molecular detection assays. In this study, some Aspergillus flavus isolates from feedlots of animals were found to be non-aflatoxigenic. Aspergillus oryzae, Aspergillus ochraceoroseus, and Aspergillus nomius could produces both the B and G aflatoxins. This study reports for the first time the potentials of Aspergillus oryzae to produce aflatoxin, however, at a trace level. Aspergillus species colonizing the feedlots of animals kept for food production in Mafikeng, North West Province, South Africa are capable of producing aflatoxin at a concentration higher than the stipulated European Union legislated standards in food and feeds. The finding from this study show a possibility for aflatoxicosis conditions in the North West Province as this could impact negatively on the socioeconomic life, food security, safety, and health of animals and humans. Therefore, there should be increased surveillance for aflatoxin contaminations in agricultural commodities used for food and livestock rearing in the North West Province, South Africa.

5. Materials and Methods

5.1. Materials

Filamentous fungi belonging to genus Aspergillus that were used in this study were isolated from feeds of animals reared for food production and were collected from the Toxicological/Biochemistry Laboratory in the Department of Animal Health, North-West University, Mafikeng Campus, South Africa. Whole wheat flour was purchased from some randomly selected supermarkets in Mafikeng, North West Province, South Africa. Aspergillus flavus and Saccharomyces cerevisiae were used as positive and negative control strains, respectively. Purified aflatoxin B1, aflatoxin B2, aflatoxin G1, and aflatoxin G2 were used as standards in this study and were procured from Sigma Aldrich, St Loius, MO, USA. All chemical reagents used in this study were of analytical grade and were procured from both Sigma Aldrich, St Loius, MO, USA and Merck Chemicals Pty Ltd., Wadeville, Gauteng, South Africa and Biolab, Modderfontein, South Africa.

5.2. Culturing of Fungi

Forty-five (45) fungi isolates were selected out of the lots from the fungal collection in the Toxicological/Biochemistry Laboratory of the Department of Animal Health, North-West University, Mafikeng Campus, South Africa. Criteria for selection was based on morphological characteristics similar to Aspergillus species. Therefore, isolates presumably belonging to Aspergillus genus were re-activated in malt extract broth and were cultured aseptically. The colonies were purified on potato dextrose agar. Isolates showing green, blue-green, green and black pigmentation on Potato Dextrose Agar were selected and cultured using a surface point inoculation on sterile PDA plates and incubated for 72 h at 25 ± 2 °C.

5.3. Molecular Identification of Presumptive Aspergilli

Mycelia were harvested from fungal isolates and used for DNA extraction using the DNATM Fungal/Bacterial Miniprep extraction kit (Zymo Research Corporation, Irvine, CA, USA) following the manufacturer’s instructions. The pure genomic DNA of fungi isolates were quantified using a Nanodrop Lite spectrophotometer (Model 1558) obtained from Thermo Scientific, Wilmington, DE, USA. The concentration (ng/µL) of extracted DNA was measured using the absorbance at 260 nm and the purity was determined at 260/280 nm. Isolates with absorbance ratio ≥1.8 were considered pure. The presence of DNA was confirmed through a 1% (w/v) agarose gel electrophoresis and analysis was conducted at 400 A, 80 V for 30 min. The gel was then viewed under the UV Transilluminator (Biorad Gel DocTM XR+ Philadelphia, PA, USA) to confirm the presence of DNA. The eluted DNA was stored at −80 °C for further molecular identification assays.

PCR Amplification of ITS1 and ITS4 of Presumptive Aspergillus Isolates

The amplification of internally transcribed spacer regions, ITS1 and ITS4, that facilitate identification of Aspergillus isolates was performed using previous protocols [56]. The amplification was conducted in a Biorad C1000 TouchTM Thermal Cycler. The ITS1–ITS4 forward (5′-TCC GTA GGT GAA CCT GCG G-3′) and reverse (5′-TCC TCC GCT TAT TGA TAT G-3′) oligonucleotide primers was synthesized at Inqaba Biotechnical Industries (Pty) Ltd., Pretoria, South Africa. The PCR was performed as standard 25 µL volumes comprising 1X PCR master mix, 50 pmol of primers, 4 µL of template DNA, and nuclease free water. The PCR mix consumables were obtained from ThermoFischer Scientific, Wilmington, DE, USA. DNA extracted from an environmental Saccharomyces cervisiae and Aspergillus flavus strains was used as negative and positive controls respectively during amplification reactions. PCR amplification conditions comprised an initial denaturation of 95 °C for 5 min, 35 cycles of denaturation at 94 °C for 30 s, annealing at 61 °C for 30 s, elongation at 72 °C for 5 min, and a final elongation at 72 °C for 7 min. PCR amplicons were held at 4 °C until electrophoresis. PCR amplicons were resolved on a 1% (w/v) agarose gel containing 0.25 μg/mL ethidium bromide. Electrophoresis was conducted at 60 volts, 400 amperes (A) for 60 min using an electrophoresis units (Bio-Rad Laboratories, CA, USA) containing 1% (v/v) TAE buffer (Fermentas Life Science, Vilnius, Lithuania). Each gel contained a 1 kb DNA molecular weight marker (Fermentas Life Science, Vilnius, Lithuania) that was used to confirm the size of PCR fragments. Gels were visualized under the UV transilluminator gel documentation unit (Biorad Gel DocTM XR+, Philadelphia, PA, USA) and images were recorded. Amplified ITS gene fragments were sequenced by Inqaba Biotec Ltd., Pretoria, South Africa. Blast searches (http://www.ncbi.nlm.nih.gov/BLAST) were used to confirm the identities of the sequences and accession numbers were obtained.

5.4. Expression of Aflatoxin Biosynthesis Pathway Genes in Filamentous Aspergilli

The expression of the aflatoxin biosynthesis regulatory genes aflR, aflJ, aflD (Nor-A), aflM (ver-1), and omt-A were evaluated as previously described [21]. Oligonucleotide primer sequences and amplifications conditions used are shown in Supplementary Table S1. Amplifications were performed in 25 µL reaction volumes comprising of 1X PCR master mix, 50 pM of forward and reverse primers, 4 µL of template DNA and nuclease free water using a Biorad C1000 TouchTM Thermal Cycler. The PCR products were separated on a 1% (w/v) agarose gel containing 0.25 μg/mL ethidium bromide. The percent expression of aflatoxigenic genes was calculated as described in Equation (1). The toxigenic Aspergillus strains were then screened for aflatoxin production using an in vitro conventional method.
Aflatoxigenic   genes   ( % ) = No   of   positive   amplification Total   number   of   selected   fungi   with   potential   for   mycotoxin   production × 100

5.5. Evaluation of Filamentous Aspergillus spp. for Aflatoxin Production

5.5.1. β-Cyclodextrin Neutral Red Desiccated Coconut Agar (β-CNRDCA) Assay

Spores of Aspergillus strains were grown overnight in malt extract medium at 28 ± 2 °C. A surface point inoculation was performed with a sterilized needle on β-cyclodextrin neutral red desiccated coconut agar (β-CNRDCA) [41]. Briefly, about 200 g of desiccated coconut was soaked in a liter of boiled purified distil water (pH 4.8) and was homogenized for 5 min in a high-speed blender. The mixture obtained was sieved and the filtrate was used in the preparation of the β-CNRDCA. An amount of 0.2% (v/v) of neutral red dye, 0.3% (w/v) β-cyclodextrin, and 2% of microbiological agar medium (Merck, Darmstadt, KGaA, Germany) was added to the filtrate to give a light pink color for improve fluorescence by aflatoxigenic strains. The resulting media was stirred and boiled on a gas burner and allowed to cool prior to sterilization in an autoclave at 121 °C for 15 min. The media was poured on 6 cm petri dish plates, allowed to solidify and plates were inoculation with selected fungi strains. Inoculated plates were incubated at 28 ± 2 °C for 14 days. Mycotoxin production was evaluated by the presence of yellow pigment and the detection of blue or bluish green fluorescence under ultraviolet light at 365 nm. Aspergillus flavus and Saccharomyces cerevisiae were used as positive and negative controls, respectively, while a β-CNRDCA plated without fungi inoculation served as negative internal control. The percent detection of mycotoxin on β-CNRDCA (β-CNRDCA %) was expressed as shown in Equation (2).
β CNRDCA   ( % ) = No   of   positives   isolates   on   β NRDCA   Total   number   of   selected   fungi   with   potential   for   mycotoxin   production     × 100

5.5.2. Yeast Extract Sucrose (Ammonium Vapor) Test Assay

Yeast extract sucrose agar was used to evaluate the potential of selected Aspergillus species to produce aflatoxin [24]. The YES medium was compounded by measuring 150 g/L of Sucrose and 15 g/L of bacteriological agar to 20 g/L of Yeast Extract broth medium into a conical flask and the media was dissolved in a liter of purified water. The resulting mixture was sterilized at 121 °C for 15 min. The YES medium plates were then surface centered inoculated with respective fungi isolates and incubated for seven days at 25 ± 2 °C. The aflatoxin production was evaluated after period of incubation by examining for yellow pigment around the fungi and the production of red pigment after exposing plates to five ml ammonia (NH3) solvent. Aspergillus flavus and Saccharomyces cerevisiae were used as positive and negative controls respectively while a YES medium plate without fungi inoculation served as negative internal control. The percent detection of mycotoxin on YES medium (YES%) was expressed as shown in Equation (3).
YES   ( % ) = No   of   positives   on   YES   media Total   number   of   selected   fungi   with   potential   for   mycotoxin   production   × 100

5.6. Aflatoxin Production by Aspergilli in Wheat Flour Using Thin-Layer Chromatography (TLC) Assay

Whole wheat flour was sterilized at 121 °C for 15 min and dried to an equilibrium moisture content of 10% in hot air oven at 65 °C. The flour moisture content was reduced to remove the free water that could aid microbial growth. The moisture content of dried wheat flour was determined using a previously described technique [57]. Briefly, 10 g of the dried wheat flour was weighed to represent W1 and placed into a pre-weighed empty Petri dish (W2) that was also placed in a preset oven at 105 °C and allowed to stand for 3 h. Dried samples were placed in a desiccator for cooling and these represented W3. This process was repeated until a constant weight of 10% moisture content was obtained. The moisture content was calculated as described in Equation (4). A portion of 50 g of the wheat flour was measured into a conical flask and 10% moisture of sterile DNA free water was added. One milligram of Aspergillus spores per 50 g of flour was weighed on a digital weighing balance and was inoculated into moistened flour. The moistened flour was stirred using a sterile glass rod and was cotton plugged after which incubation was done at a relative humidity of 50% for 15 days at 25 ± 2 °C.
%   Moisture   Content = W 2 W 3 W 1   ×   100
A solid –liquid extraction method was employed for mycotoxin extraction from wheat flour [58] with slight modifications. Twenty-five grams (25 g) of inoculated flour was weighed into a glass beaker and 50 mL of methanol: Water (w/v; 18:2) solution and 1 g sodium chloride (NaCl) was added. The mycotoxin extraction was done in a dark room to prevent fluorescence under white light. The mixture was blended in a high speed rotary stirrer IKA at maximum speed to aid the release of mycotoxin into the solvent. The slurry was filtered using a Whattman No 1 filter paper (Maidstone, UK) and the filtrate was evaporated to dryness under dark environment while the residue was discarded. The dried filtrate was then reconstituted with 1000 µL of HPLC grade methanol (Sigma Aldrich, St Loius, MO, USA) and was filtered through a 0.22 µm MS Nylon Syringe Millipore filter (SIMPLEPURE, NY, USA) fitted to a sterile syringe. The volume of elute was adjusted to 4 mL with methanol in LC/LCMS vials (Shimadzu, GbHg, Germany).
The aflatoxin detection by the TLC method was performed using the protocol [44] with slight modifications. A glass baked silica gel coated (CaSO4) plates with 20 by 20 cm dimension of 250 μm thickness supplied by Merck (KGaA, Darmstadt, Germany) was used in the qualitative analysis of the samples. A 40 µL aliquot of the extract was spotted on the TLC plates against 0.5 µg/mL aflatoxin standards (AFB1, AFB2, AFG1, and AFG2). The mobile phase (TLC solvent) comprised chloroform: Ethyl acetate: Propan-2-ol at proportions of 90:5:5 (v/v/v). The spotted plates were placed in the TLC tank containing the mobile phase to allow for migration by a capillary action through the stationary phase (TLC silica). The separated TLC plates were viewed under UV-light at a wavelength of 365 nm and images were photographed and recorded. AFB1, AFB2 and AFG1, AFG2 migration along with the aflatoxin standards was identified respectively by a blue and blue green fluorescence on the plate. The percent detection of each aflatoxin was calculated using the formula described in Equation (5).
TLC   ( % ) = No   of   positives   on   TLC Total   number   of   selected   fungi   with   potential   for   mycotoxin   production     × 100

5.7. Quantification of Aflatoxin by High-Performance Liquid Chromatography

The concentration of aflatoxins produced by selected Aspergillus species was quantified in a High-Performance Liquid Chromatography Shimadzu liquid chromatograph (Kyoto, Japan) equipped with a Jasco FP-920 fluorescence detector of 362 nm excitation wavelength and 425 nm emission wavelength respectively for AFB1 and AFB2 while AFG1 and AFG2 were quantified at 455 nm. The column used was a Hichrom column (4.6 mm by 150 mm) of 5 μm, while the derivatization reactor used was KOBRA Cell at a regimen of 100 μA. The guard cartridge and analytical cartridge used was Inertsil ODS-3 and ODS-3V, respectively. The injector was an autosampler with reodyne valve. In order to perform HPLC analysis, 100 μL of the sample extract was injected into the equipment while 0.00025, 0.0025, 0.25, 2.5, and 25 μg/mL of aflatoxin standards were used in validating the analysis. The separations of the chromatography peaks was done using a Hichrom column to which a pre-column of similar stationary phase has been fitted. The mobile phase was made up of water: Acetonitrile: Methanol; (3:1:1, v/v/v) pumped at 1.0 mL/min at an injection volume of 100 μL following an isocratic line-up. Aflatoxins standards (AFB1, AFB2, AFG1, AFG2, and AFTOT) purchased from Sigma Aldrich (Sigma, St. Louis, MO, USA) were reconstituted with sterile biopure water and concentrations of 2 μg/mL each for AFB1 and AFG1 and 0.5 μg/mL each for AFB2 and AFG2 were prepared. Aflatoxin detection was regarded positive for each peak at a retention time similar to each standard and at a height five times higher than the baseline noise [25,54,58].
The HPLC method was validated by determining the accuracy, linearity, and sensitivity of the standards. The linearity was obtained by constructing a calibration curves from the emissions obtained from AFB1, AFB2, AFG2, AFG1, AFTOT, and the control which is made up of acetonitrile (HPLC grade). The calibration curves were plotted using five different concentrations of standards ranging from 0.0025 μg/mL to 25 μg/mL against the areas of the peaks (aflatoxin concentrations) while a regression analysis was carried out to determine linearity of the determination. The slope of the standard calibration curve and matrix-matched calibration curve for each concentration of the standards was used to determine the matrix effect (ME) of each concentration of analyte (aflatoxin). The matrix effect calibration curves was created by spiking blank sample (Acetonitrile) with aflatoxin standards.
On the other hand, the sensitivity of the HPLC system was determined by the limit of quantification and limit of detection. The LOQ was calculated by multiplying the signal to noise ratio by three while the LOD was calculated by the product of ten and the concentration obtained at the lowest level of chromatographic peaks of the spiked test samples. The recovery analysis was used to evaluate the accuracy of the quantification of aflatoxin produced by the fungal isolates. The recovery was obtained by determining the ratio of the area under chromatographic peaks of individual spiked aflatoxin standards obtained before extraction and after extraction. The recovery was done at three levels (25, 50, and 100 μg/kg) in addition to the previous standard concentration spiked.

5.8. Statistical Analysis

The statistical package for social sciences (SPSS, Inc., Chicago, IL, USA) version 21 was used in the analysis of aflatoxin produced by selected fungal isolates through the One-way analysis of variance (ANOVA). The means were separated using the Duncan new multiple range test at 95% confidence interval while the measure of central tendency (mean) and descriptive statistics (percentages) was used to express the aflatoxin production potentials of Aspergillus species isolated from feedlots of animals kept for food production.

Supplementary Materials

The following are available online at https://www.mdpi.com/2072-6651/11/12/692/s1, Table S1: PCR Conditions for Amplification of Aflatoxin Biosynthesis Genes.

Author Contributions

Conceptualization, S.A.A.; C.N.A. and M.M.; Methodology, S.A.A.; C.N.A. and M.M.; software, S.A.A.; validation, S.A.A.; M.M. and C.N.A.; formal analysis, S.A.A.; investigation, S.A.A.; resources, M.M.; data curation, M.M.; C.N.A.; writing—original draft preparation, S.A.A.; writing—review and editing, C.N.A.; M.M.; visualization, C.N.A.; M.M.; supervision, C.N.A.; M.M.; project administration, S.A.A.; C.N.A.; M.M.; funding acquisition, M.M.

Funding

This research was funded by the DST-TWAS National Research Foundation of South Africa and Food Safety Niche Area, North West University, Mafikeng Campus, grant number UID: 110854 and The APC was funded by North West University South Africa.

Acknowledgments

Authors acknowledge the support of the technical staffs of the Department of Animal Health and the Department of Microbiology, North West University, South Africa.

Conflicts of Interest

The funders had no role in the design of the study; in the collection, analyses, or interpretation of data; in the writing of the manuscript, or in the decision to publish the results.

References

  1. Ominski, K.H.; Marquardi, R.R.; Sinha, R.N.; Abramson, D. Ecological aspects of growth and mycotoxin production by storage fungi. In Mycotoxins in Grains: Compounds Other than Aflatoxins; Miller, J.D., Trenholm, H.L., Eds.; Eagan Press: St. Paul, MN, USA, 1994; pp. 287–314. [Google Scholar]
  2. Bhat, R.; Rai, R.V.; Karim, A.A. Mycotoxins in food and feed: Present status and future concerns. Comp. Rev. Food Sci. Food Saf. 2010, 9, 57–81. [Google Scholar] [CrossRef]
  3. Charoenpornsook, K.; Kavisarasai, P. Mycotoxins in animal feedstuffs of Thailand. KMITL Sci. Technol. J. 2006, 6, 25–28. [Google Scholar]
  4. Francesca, B.; Chiara, M. Mycotoxins in Food, Food Industrial Processes—Methods and Equipment; InTechOpen: Rijeka, Croatia, 2012; Volume 10, pp. 169–199. [Google Scholar]
  5. Bryden, W.L. Mycotoxins in the food chain: Human health implications. Asia Pac. J. Clin. Nutr. 2007, 16, 95–101. [Google Scholar] [PubMed]
  6. Castegnaro, M.; Pfohl-Leszkowicz, A. Les mycotoxines: Contaminants omniprésents dans l’alimentation animale et humaine, dans La sécurité alimentaire du consommateur. In Tec & Doc; Lavoisier: Paris, France, 2002; pp. 127–179. [Google Scholar]
  7. Food and Agriculture Organisation (FAO). Post Harvest Losses in Quality of Food Grains; Food and Agriculture Organisation: Rome, Italy, 1983; Volume 29, p. 103. [Google Scholar]
  8. Brera, C.B.; De Santis, D.F.; Miraglia, M. Mycotoxins. In Food Contaminants and Residue Analysis; Pico, Y., Ed.; Elsevier: Oxford, UK, 2008; pp. 363–419. [Google Scholar]
  9. Bennett, J.W.; Klich, M. Mycotoxins. Clin. Microbiol. Rev. 2003, 16, 497–516. [Google Scholar] [CrossRef]
  10. CAST. Mycotoxins: Risks in Plant, Animal and Human Systems; Task Force Report N 139; CAST: Ames, IA, USA, 2003. [Google Scholar]
  11. Niessen, L. PCR-based diagnosis and quantification of mycotoxin producing fungi. Int. J. Food Microbiol. 2007, 119, 38–46. [Google Scholar] [CrossRef]
  12. Bankole, S.; Schollenberger, M.; Drochner, W. Mycotoxins in food systems in Sub Saharan Africa: A review. Mycotoxin Res. 2006, 22, 163–169. [Google Scholar] [CrossRef]
  13. Nonaka, Y.; Saitob, K.; Hanioka, N.; Narimatsu, S.; Kataoka, H. Determination of aflatoxins in food samples by automated on-line in-tube solid-phase microextraction coupled with liquid chromatography–mass spectrometry. J. Chromatogr. 2009, 1216, 4416–4422. [Google Scholar] [CrossRef]
  14. EC. Commission Regulation (EC)No. 2174/2003 of 12 December 2003 Amending Regulation (EC) No. 466/2001 as Regards Aflatoxins. Off. J. Eur. Union 2003, 12, 326. [Google Scholar]
  15. Codex Alimentarius Commission. Joint FAO/WHO Food Standards Program, Codex Committee on Food Additives and Contaminants; CODEX: Hague, The Netherlands, 2001. [Google Scholar]
  16. Ojuri, O.T.; Ezekiel, C.N.; Sulyok, M.; Ezeokoli, O.T.; Oyedele, O.A.; Ayeni, K.I.; Eskola, M.K.; Šarkanj, B.; Hajšlováf, J.; Adeleke, R.A.; et al. Assessing the mycotoxicological risk from consumption of complementary foods by infants and young children. Niger. Food Chem. Toxicol. 2018, 121, 37–50. [Google Scholar] [CrossRef]
  17. Gbashi, S.; Madala, N.E.; De Saeger, S.; De Boevre, M.; Adekoya, I.; Adebo, O.A.; Njobeh, P.B. The socio-economic impact of mycotoxin contamination in Africa. In Fungi and Mycotoxins—Their Occurrence, Impact on Health and the Economy as well as Pre- and Postharvest Management Strategies; Njobeh, P.B., Stepman, F., Eds.; InTech: Rijeka, Croatia, 2019. [Google Scholar]
  18. Van Egmond, H.P.; Jonker, M.A. Worldwide regulations on aflatoxins—The situation in 2002. J. Toxicol. Toxin Rev. 2004, 23, 273–293. [Google Scholar] [CrossRef]
  19. Rodrigues, P.; Santos, C.; Venâncio, A.; Lima, N. Species identification of Aspergillus section Flavi isolates from Portuguese almonds using phenotypic, including MALDI-TOF ICMS, and molecular approaches. J. Appl. Microbiol. 2011, 111, 877–892. [Google Scholar] [CrossRef] [PubMed]
  20. Nleya, N.; Adetunji, M.; Mwanza, M. Current status of mycotoxin contamination of food commodities in Zimbabwe. Toxins 2018, 10, 89. [Google Scholar] [CrossRef] [PubMed]
  21. Adetunji, M.C.; Ngoma, L.; Atanda, O.O.; Mwanza, M. A polyphasic method for the identification of aflatoxigenic Aspergilla from cashew nuts. World J. Microbiol. Biotechnol. 2019, 35, 8. [Google Scholar] [CrossRef] [PubMed]
  22. Peterson, S.W.; Ito, Y.; Horn, B.W.; Goto, T. Aspergillus bombycis, a new aflatoxigenic species and genetic variation in its sibling species, A. nomius. Mycologia 2001, 93, 689–703. [Google Scholar] [CrossRef]
  23. Mircea, C.; Poiata, A.; Tuchilus, C.; Agoroae, L.; Butnaru, E.; Stanescu, U. Aflatoxigenic fungi isolated from medicinal herbs. Toxicol. Lett. 2008, 180, 32–246. [Google Scholar] [CrossRef]
  24. Saleemullah, A.I.; Khalil, I.A.; Shah, H. Aflatoxin content of stored and artificially innoculated cereals and nuts. Food Chem. 2006, 98, 699–703. [Google Scholar] [CrossRef]
  25. Rodrigues, P.; Venâncio, A.; Kozakiewicz, Z.; Lima, N. A polyphasic approach to the identification of aflatoxigenic and non-aflatoxigenic strains of Aspergillus Section Flavi isolated from Portuguese almonds. Internat. J. Food Microbiol. 2009, 129, 187–193. [Google Scholar] [CrossRef]
  26. Food and Agricultural Organization (FAO); World Health Organization (WHO). Standards programme. In Codex Alimentarius Commission, 3rd ed.; Alinorm: Rome, Italy, 1992; p. 93/12. [Google Scholar]
  27. EU. Setting Maximum Levels for Certain Contaminants in Foodstuffs. Off. J. Eur. Union 2006, 364, 5–24. [Google Scholar]
  28. EC. Directives 2002/32/EC of the European Parliament and of the Council on Undesirable Substances in Animal Feed; European, C., Ed.; EC: Brussels, Belgium, 2002; pp. 1–27. [Google Scholar]
  29. Moss, M.O. Risk assessment for aflatoxins in foodstuffs. Int. Biodeterior. Biodegrad. 2002, 50, 137–142. [Google Scholar] [CrossRef]
  30. Makun, H.A.; Dutton, M.F.; Njobeh, P.B.; Gbodi, T.A.; Haruna, O.G. Aflatoxin Contamination in Foods and Feeds: A Special Focus on Africa, in Trends in Vital Food and Control Engineering; Eissa, P.A.A., Ed.; InTech Open: Rijeka, Croatia, 2012; Volume 10, pp. 187–290. [Google Scholar]
  31. Makun, H.A.; Dutton, M.F.; Njobeh, P.B.; Mwanza, M.; Kabiru, A.Y. Natural multi- mycotoxin occurrence in rice from Niger State, Nigeria. Mycotoxin Res. 2011, 27, 97–104. [Google Scholar] [CrossRef]
  32. Lee, C.Z.; Liou, G.Y.; Yuan, G.F. Comparison of the aflR gene sequences of strains in Aspergillus section Flavi. Microbiology 2006, 152, 161–170. [Google Scholar] [CrossRef] [PubMed]
  33. Georgianna, D.R.; Hawkridge, A.M.; Muddiman, D.C.; Payne, G.A. Temperature-dependent regulation of proteins in Aspergillus flavus: Whole organism stable isotope labeling by amino acids. J. Proteome Res. 2008, 7, 2973–2979. [Google Scholar] [CrossRef] [PubMed]
  34. Calvo, A.M.; Wilson, R.A.; Bok, J.W.; Keller, N.P. Relationship between secondary metabolism and fungal development. Microbiol. Mol. Biol. Rev. 2002, 66, 447–459. [Google Scholar] [CrossRef] [PubMed]
  35. Bhatnagar, D.; Ehrlich, K.C.; Cleveland, T.E. Molecular genetic analysis and regulation of aflatoxin biosynthesis. Appl. Microbiol. Biotechnol. 2003, 61, 83–93. [Google Scholar] [CrossRef] [PubMed]
  36. Renqing, Z. The Function, Accumulation and Localization of the Nor-1 Protein Involved in Aflatoxin Biosynthesis; the Function of the Flu? Gene Associated with Sporulatton in Aspergillus Parasiticus. In Department of Food Science and Human Nutrition and Multidisciplinary Graduate Program in Environmental Toxicology; Michigan State University: East Lansing, MI, USA, 1997; p. 246. [Google Scholar]
  37. Ryan, L.A.; Dal Bello, F.; Arendt, E.K.; Koehler, P. Detection and quantitation of 2,5-diketopiperazines in wheat sourdough and bread. J. Agric. Food Chem. 2009, 57, 9563–9568. [Google Scholar] [CrossRef]
  38. Bhatnagar, D.; Cary, J.W.; Ehrlich, K.; Yu, J.; Cleveland, T.E. Understanding the genetics of regulation of aflatoxin production and Aspergillus flavus development. Mycopathologia 2006, 162, 155–166. [Google Scholar] [CrossRef]
  39. Chiou, C.H.; Miller, M.; Wilson, D.L.; Trail, F.; Linz, J.E. Chromosomal location plays a role in regulation of aflatoxin gene expression in Aspergillus parasiticus. Appl. Environ. Microbiol. 2002, 68, 306–315. [Google Scholar] [CrossRef]
  40. Yu, J.; Chang, P.-K.; Bhatnagar, D.; Cleveland, T.E. Cloning of sugar utilization gene cluster in Aspergillus parasiticus. Biochim. Biophys. Acta 2000, 1493, 211–214. [Google Scholar] [CrossRef]
  41. Atanda, O.; Ogunrinu, M.; Olorunfemi, F. A neutral red desiccated coconut agar for rapid detection of aflatoxigenic fungi and visual determination of aflatoxins. World Mycotoxin J. 2011, 4, 147–155. [Google Scholar] [CrossRef]
  42. Ezekiel, C.N.; Udom, I.E.; Frisvad, J.C.; Adetunji, M.C.; Houbraken, J.; Fapohunda, S.O.; Samson, R.A.; Atanda, O.O.; Agi-Otto, M.C.; Onashile, O.A. Assessment of aflatoxigenic Aspergillus and other fungi in millet and sesame from Plateau State, Nigeria. Mycology 2014, 5, 16–22. [Google Scholar] [CrossRef]
  43. Degola, F.; Dall’Asta, C.; Restivo, F. Development of a simple and high-throughput method for detecting aflatoxins production in culture media. Lett. Appl. Microbiol. 2012, 55, 82–89. [Google Scholar] [CrossRef] [PubMed]
  44. Abbas, H.K.; Zablotowicz, R.M.; Weaver, R.M.; Horn, B.W.; Xie, W.; Shier, W.T. Comparison of Cultural and Analytical Methods for Determination of Aflatoxin Production by Missisissipi Delta Aspergillus isolates. Can. J. Microbiol. 2005, 50, 193–199. [Google Scholar] [CrossRef] [PubMed]
  45. Sudini, H.; Srilakshmi, P.; Vijay, K.K.K.; Njoroge, S.M.; Osiru, M.; Anitha, S.; Waliyar, F. Detection of aflatoxigenic Aspergillus strains by cultural and molecular methods: A critical review African. J. Microbiol. Res. 2015, 9, 484–491. [Google Scholar]
  46. Cary, J.; Ehrlich, K.; Beltz, S.; Harris-Coward, P.; Klich, M. Characterization of the Aspergillus ochraceoroseus aflatoxin/sterigmatocystin biosynthetic gene cluster. Mycologia 2009, 101, 352–362. [Google Scholar] [CrossRef] [PubMed]
  47. Klich, M.; Yu, J.; Chang, P.-K.; Mullaney, E.; Bhatnagar, D.; Cleveland, T. Hybridization of genes involved in aflatoxin biosynthesis to DNA of aflatoxigenic and non-aflatoxigenic Aspergilli. Appl. Microbiol. Biotechnol. 1995, 44, 439–443. [Google Scholar] [CrossRef] [PubMed]
  48. Wagacha, J.M.; Muthomi, J.W. Mycotoxin problem in Africa: Current status, implications to food safety and health and possible management strategies. Int. J. Food Microbiol. 2008, 124, 1–12. [Google Scholar] [CrossRef]
  49. International Agency for Research on Cancer (IARC). Monographs on the Evaluation of Carcinogenic Risk to Humans. In Some Naturally Occurring Substances: Food Items and Constituents, Heterocyclic Aromatic Amines and Mycotoxins; IARC, Ed.; World Health Organisation: Lyon, France, 1993; p. 489. [Google Scholar]
  50. Mngadi, P.T.; Govinden, R.; Odhav, B. Co-occurring mycotoxins in animal feeds. Afri. J. Biotechnol. 2008, 7, 2239–2243. [Google Scholar]
  51. Kangethe, E.K.; Langa, K.A. Aflatoxin B1 and M1 contamination of animal feeds and milk from urban centers in Kenya. Afr. Health Sci. 2009, 9, 218–226. [Google Scholar]
  52. Elzupir, A.O.; Younis, M.H.; Himmat, F.M.; Elhussein, A.M. Determination of Aflatoxins in Animal Feed in Khartoum State, Sudan. J. Anim. Vet. Adv. 2009, 8, 1000–1003. [Google Scholar]
  53. Mwanza, M.; Ndou, R.V.; Dzoma, B.; Nyirenda, M.; Bakunzi, F. Canine aflatoxicosis outbreak in South Africa; A possible multi-mycotoxins aetiology Art 133. J. South Afr. Vet. Assoc. 2013, 84, 5. [Google Scholar]
  54. Zinedine, A.; Juan, C.; Soriano, J.M.; Moltó, J.C.; Idrissi, L.; Mañes, J. Limited survey for the occurrence of aflatoxins in cereals and poultry feeds from Rabat, Morocco. Internat. J. Food Microbiol. 2007, 115, 124–127. [Google Scholar] [CrossRef]
  55. Adebayo-Tayo, B.C.; Ettah, A.E. Microbiological quality and aflatoxin B1 level in poultry and livestock feeds. Niger. J. Microbiol. 2010, 24, 2145–2152. [Google Scholar]
  56. Magnani, M.; Fernandes, T.; Prete, C.E.C.; Homechim, M.; Ono, E.Y.S.; Vilas-Boas, L.A.; Sartori, D.; Furlaneto, M.C.; Fungaro, M.H.P. Molecular identification of Aspergillus spp. isolated from coffee beans. Sci. Agric. 2005, 62, 45–49. [Google Scholar] [CrossRef]
  57. Association of Official Analytical Chemists (AOAC). Official Methods of Analysis, 18th ed.; Association of Official Analytical Chemists, Ed.; AOAC: Washington, DC, USA, 2007. [Google Scholar]
  58. Hassane, A.M.A.; El-Shanawany, A.A.; Abo-Dahab, N.F.; Abdel-Hadi, A.M.; Abdul-Raouf, U.M.; Mwanza, M. Influence of Different Moisture Contents and Temperature on Growth and Production of Aflatoxin B1 by a Toxigenic Aspergillus flavus Isolate in Wheat Flour. J. Ecol. Heal. Environ. 2017, 5, 77–83. [Google Scholar] [CrossRef]
Figure 1. Gel electrophoresis patterns for the expression of ITS1 and ITS4 regions at 670 bp in representative fungi isolated from feedlots of animals reared for food production. Lane M = DNA marker (1 kb); Lane 1 to 13 = positive amplification; Lane 1, and 5 = Negative amplification; and Lane 1 = No template (Internal control), Lane 2 = Aspergillus flavus ATCC 259622TM (Positive control).
Toxins 11 00692 g001
Figure 2. Percent diversity of selected fungi from feedlots of animals kept for food production.
Toxins 11 00692 g002
Figure 3. Gel electrophoresis patterns for expression of aflatoxin biosynthesis genes in representative Aspergilli. (a) Gel electrophoresis patterns for expression of aflR genes at 1032 bp in Aspergillus strains isolated from feedlots of animals kept for food production. Lane M = DNA marker (1 kb); Lane 1 to 17 = positive amplification; Lane 3, 5, and 11 = Negative amplification; Lane 18 = Saccharomyces cerevisiae (Negative control); and Lane 19 = No template (Internal control), Lane 17 = Aspergillus flavus ATCC 259622TM (Positive control). (b) Gel electrophoresis patterns for expression of aflJ genes at 737 bp in Aspergillus strains isolated from feedlots of animals kept for food production. Lane M = DNA marker (1 kb); Lane 1 to 17 = positive amplification; Lane 3 and 11 = Negative amplification; Lane 18 = Saccharomyces cerevisiae (Negative control); and Lane 19 = No template (Internal control), Lane 17 = Aspergillus flavus ATCC 259622TM (Positive control). (c) Gel electrophoresis patterns for expression of aflD (Nor-1) genes at 400 bp in Aspergillus strains isolated from feedlots of animals kept for food production. Lane M = DNA marker (1 kb); Lane 1 to 17 = positive amplification; Lane 13 and 18 = Negative amplification; Lane 13 = Saccharomyces cerevisiae (Negative control); and Lane 18 = No template (Internal control), Lane 17 = Aspergillus flavus ATCC 259622TM (Positive control). (d) Gel electrophoresis patterns for expression of aflM genes at 537 bp in Aspergillus strains isolated from feedlots of animals kept for food production. Lane M = DNA marker (1 kb); Lane 1 to 17 = positive amplification; Lane 3, 11, 18, and 19 = Negative amplification; Lane 18 = Saccharomyces cerevisiae (Negative control); and Lane 19 = No template (Internal control), Lane 17 = Aspergillus flavus ATCC 259622TM (Positive control). (e) Gel electrophoresis patterns for expression of omt-A genes at 797 bp in Aspergillus strains isolated from feedlots of animals kept for food production. Lane M = DNA marker (1 kb); Lane 1 to 17 = positive amplification; Lane 3, 4, 11 and 16 = Negative amplification; Lane 18 = Saccharomyces cerevisiae (Negative control); and Lane 19 = No template (Internal control), Lane 17 = Aspergillus flavus ATCC 259622TM (Positive control).
Toxins 11 00692 g003aToxins 11 00692 g003b
Figure 4. Percent amplification of aflatoxin biosynthesis pathway genes in selected Aspergilli.
Toxins 11 00692 g004
Figure 5. Detection of aflatoxin production in Aspergilli isolates from feedlots of animals kept for food production using the thin-layer chromatography. Lane M = Aflatoxin Standard (AFB1, AFB2, AFG1, and AFG2); Lanes 1–10 = Positive detection; Lanes 11 = Positive Control (toxigenic Aspergillus flavus); Lanes 13 = Negative detection; Lanes 14 = Saccharomyces cerevisiae; and Lanes 15 = Negative control (Nuclease free water).
Toxins 11 00692 g005
Table 1. Morphology of the fungi cultures isolated from feedlots of animals kept for food production.
SNIDIsolates NameAssession NoMediaColour and Morphology
1FG1Aspergillus oryzaeMG647833MEALine Green
2FG2Aspergillus flavusMG659619MEALine green
3FG3Aspergillus nigerMG647838MEABlack
4FG4Aspergillus flavusMG659628MEAGreen
5FG5Aspergillus nigerMG647849MEABlack
6FG6Aspergillus terreusMG647840MEADark green
7FG7Aspergillus flavusMG659631MEALine green
8FG8Aspergillus tubingensisMG647844MEAGreen
9FG9Aspergillus flavusMH270531MEAGreen
10FG10Aspergillus flavusMG647845MEAGreen
11FG11Aspergillus terreusMG647846MEADark green
12FG12Aspergillus parasiticusMG659626MEAGreen
13FG13Aspergillus amstelodamiMG647851MEALine Green
14FG14Aspergillus flavusMH270612MEAGreen
15FG15Aspergillus nomiusMG659621MEAGreen
16FG16Aspergillus tubingensisMG647853MEAMilitary green
17FG17Aspergillus terreusMG647863MEAdark green
18FG18Aspergillus flavusMG659635MEAGreen
19FG19Aspergillus flavusMH270544MEAGreen
20FG20Aspergillus flavusMG659673MEAGreen
21FG21Aspergillus nigerMG647867MEABlack
22FG22Aspergillus flavusMH270559MEAGreen
23FG23Aspergillus flavusMG659626MEAGreen
24FG24Aspergillus flavusMH270559MEAGreen
25FG25Aspergillus oryzaeMH270563MEAGreen
26FG26Aspergillus flavusMH270574MEAGreen
27FG27Aspergillus clavatusMG647850MEALine Green
28FG28Aspergillus fumigatusMG647855MEABluish green
29FG29Aspergillus fumigatusMG647869MEABluish green
30FG30Aspergillus terreusMG647840MEADark green
31FG31Aspergillus flavusMH270578MEAGreen
32FG32Aspergillus flavusMG647868MEAGreen
33FG33Aspergillus flavusMH270581MEAGreen
34FG34Aspergillus oryzaeMG659690MEAMilitary green
35FG35Aspergillus clavatusMG647856MEAGreen
36FG36Aspergillus oryzaeMG659633MEAGreen
37FG37Aspergillus terreusMG647866MEAGreen
38FG38Aspergillus terreusMG647852MEAGreen
39FG39Aspergillus flavusMG647857MEAGreen
40FG40Aspergillus flavusMG659627MEAGreen
41FG41Aspergillus parasiticusMG659687MEAGreen
42FG42Aspergillus flavusMG659676MEAGreen
43FG43Aspergillus nomiusMH270600MEAGreen
44FG44Aspergillus ochraceoroseusMH270530MEAGreen
45FG45Aspergillus flavusMG647871MEAGreen
46Control 1Aspergillus flavusATCC 259622TMMEAGreen
47Control 2Saccharomyces cerevisiae MEACreamy
Keys: FG1–FG45 = fungal isolates, MEA = Malt extract agar.
Table 2. Polyphasic characterization for aflatoxin production in selected fungi isolates.
SNIDIsolates NameAssession NoaflD (Nor-A)aflRaflJaflM (ver-1)Omt-AYES (NH4 Vapor Test)(β-CDNRDCA)TLCHPLCSelected Isolates
Yellow PigmentUV-Florescence
1FG1Aspergillus oryzaeMG647833POSNEGPOSPOSNEGPOSPOS-ndnd
2FG2Aspergillus flavusMG659619NEGPOSPOSNEGPOSPOSPOS-ndnd
3FG3Aspergillus nigerMG647838POSPOSPOSNEGPOSNEGNEG-ndnd
4FG4Aspergillus flavusMG659628POSPOSPOSPOSPOSPOSPOS±NEGPOS**
5FG5Aspergillus nigerMG647849POSPOSPOSNEGPOSNEGNEG-ndnd
6FG6Aspergillus terreusMG647840NEGPOSPOSNEGPOSNEGNEG-ndnd
7FG7Aspergillus flavusMG659631POSNEGPOSPOSPOSPOSPOS+++POSPOS**
8FG8Aspergillus tubingensisMG647844POSNEGPOSPOSNEGNEGNEG-ndnd
9FG9Aspergillus flavusMH270531POSPOSPOSPOSPOSNEGNEG-NEGPOS**
10FG10Aspergillus flavusMG647845POSPOSPOSPOSPOSPOSPOS+NEGPOS**
11FG11Aspergillus terreusMG647846NEGPOSPOSNEGNEGNEGPOS++ndnd
12FG12Aspergillus parasiticusMG659626POSPOSPOSPOSPOSPOSPOS+++POSPOS**
13FG13Aspergillus amstelodamiMG647851NEGPOSPOSNEGNEGNEGNEG-ndnd
14FG14Aspergillus flavusMH270612POSPOSPOSPOSPOSPOSPOS++++POSPOS**
15FG15Aspergillus nomiusMG659621POSPOSPOSPOSPOSPOSPOS++++POSPOS**
16FG16Aspergillus tubingensisMG647853NEGNEGPOSNEGPOSNEGNEG-ndnd
17FG17Aspergillus terreusMG647863POSPOSPOSNEGNEGNEGNEG-ndnd
18FG18Aspergillus flavusMG659635POSPOSPOSPOSPOSPOSPOS+++POSPOS**
19FG19Aspergillus flavusMH270544POSPOSPOSPOSPOSPOSPOS+++POSPOS**
20FG20Aspergillus flavusMG659673POSPOSPOSPOSPOSPOSPOS+++POSPOS**
21FG21Aspergillus nigerMG647867POSPOSPOSNEGNEGNEGPOS++ndnd
22FG22Aspergillus flavusMH270559POSPOSPOSPOSPOSPOSPOS++POSPOS**
23FG23Aspergillus flavusMG659626POSPOSPOSPOSPOSPOSPOS+++POSPOS**
24FG24Aspergillus flavusMH270559POSPOSPOSPOSPOSPOSPOS+/-POSPOS**
25FG25Aspergillus oryzaeMH270563POSPOSPOSPOSPOSPOSPOS+/-POSPOS**
26FG26Aspergillus flavusMH270574NEGPOSPOSPOSNEGPOSNEG-ndnd
27FG27Aspergillus clavatusMG647850POSPOSPOSNEGNEGNEGPOS-ndnd
28FG28Aspergillus fumigatusMG647855NEGPOSPOSNEGPOSNEGNEG-ndnd
29FG29Aspergillus fumigatusMG647869POSPOSPOSNEGPOSNEGPOS-ndnd
30FG30Aspergillus terreusMG647840POSPOSPOSNEGNEGNEGNEG-ndnd
31FG31Aspergillus flavusMH270578POSPOSPOSPOSPOSPOSPOS++POSPOS**
32FG32Aspergillus flavusMG647868POSPOSPOSNEGNEGNEGPOS-ndnd
33FG33Aspergillus flavusMH270581POSPOSPOSPOSPOSPOSPOS++POSPOS**
34FG34Aspergillus oryzaeMG659690POSPOSPOSPOSPOSPOSPOS+NEGPOS**
35FG35Aspergillus clavatusMG647856POSPOSPOSNEGNEGNEGPOS-ndnd
36FG36Aspergillus oryzaeMG659633POSPOSPOSPOSPOSNEGPOS+NEGPOS**
37FG37Aspergillus terreusMG647866POSPOSPOSNEGPOSNEGPOS+ndnd
38FG38Aspergillus terreusMG647852POSPOSPOSNEGPOSNEGPOS-ndnd
39FG39Aspergillus flavusMG647857POSPOSPOSPOSNEGNEGPOS-ndnd
40FG40Aspergillus flavusMG659627POSNEGPOSPOSPOSPOSPOS+++POSPOS**
41FG41Aspergillus parasiticusMG659687POSPOSPOSPOSPOSPOSPOS+++POSPOS**
42FG42Aspergillus flavusMG659676POSPOSPOSPOSPOSNEGNEG-POSPOS**
43FG43Aspergillus nomiusMH270600POSPOSPOSPOSPOSPOSPOS+++POSPOS**
44FG44Aspergillus ochraceoroseusMH270530POSPOSPOSPOSPOSPOSPOS++POSPOS**
45FG45Aspergillus flavusMG647871POSPOSPOSPOSNEGNEGPOS-ndnd
46Control 1Aspergillus flavus ATCC259622TMPOSPOSPOSPOSPOSPOSPOS+++POSPOS
47Control 2Saccharomyces cereviasiae NEGNEGNEGNEGNEGNEGNEG-ndnd
Keys: POS = positive amplification/reaction, NEG = negative amplification/reaction, + = fluorescence, - = no fluorescence, +/- = low fluorescence, ++ = mild fluorescence, +++ = high fluorescence, ++++ = very high fluorescence, nd = not detected, ** = selected isolates, TLC = thin-layer chromatography, HPLC = high-performance liquid chromatography, YES = yeast extract sucrose medium, and β-CDNRDCA = β-cyclodextrin neutral red desiccated coconut agar.
Table 3. Aflatoxin concentrations (ug/g) of wheat flour inoculated with Aspergillus strains isolated from feedlots of animals kept for food production.
S/NIDIsolate NameAFG2 (µg/g)AFG1 (µg/g)AFB2 (µg/g)AFB1 (µg/g)AFTOT (µg/g)
1FG4Aspergillus flavusndnd6.78 ± 0.01 rnd6.78 ± 0.01 q
2FG7Aspergillus flavus1.67 ± 0.01 pndnd54.75 ± 3.46 f56.42 ± 3.45 m
3FG9Aspergillus flavusndndndndnd
4FG10Aspergillus flavusnd6.21 ± 0.02 cndnd6.21 ± 0.02 q
5FG12Aspergillus parasiticus360.06 ± 0.05 b745.34 ± 0.03 a242.52 ± 0.04 a34,043.71 ± 0.27 b35,391.63 ± 0.34 b
6FG14Aspergillus flavusndnd13.24 ± 0.01 q59.66 ± 0.02 e72.90 ± 0.01 l
7FG15Aspergillus nomius768.52 ± 0.03 a396.45 ± 0.02 bnd70,289.23 ± 0.67a71,454.21 ± 0.66 a
8FG18Aspergillus flavus21.91 ± 0.03 ind103.15 ± 0.02 cnd125.06 ± 0.03 h
9FG19Aspergillus flavus0.98 ± 0.02 qnd24.14 ± 0.01 ond25.12 ± 0.03 p
10FG20Aspergillus flavus11.84 ± 0.04 knd66.08 ± 0.07 ind77.92 ± 0.11 j
11FG22Aspergillus flavus3.43 ± 0.02 o1.88 ± 0.01 f50.08 ± 0.01 knd55.39 ± 0.04 m
12FG23Aspergillus flavus72.55 ± 0.02 end30.33 ± 0.04 mnd102.88 ± 0.04 i
13FG24Aspergillus flavus14.86 ± 0.06 jnd57.77 ± 0.02 jnd72.63 ± 0.06 l
14FG25Aspergillus oryzae86.04 ± 0.04 dnd95.58 ± 0.01 dnd181.62 ± 0.05 f
15FG31Aspergillus flavus253.44 ± 0.05 c3.19 ± 0.02 d73.88 ± 0.03 fnd330.51 ± 0.07 e
16FG33Aspergillus flavus38.33 ± 0.03 gnd109.23 ± 0.03 and147.57 ± 0.05 g
17FG34Aspergillus oryzaendndndndnd
18FG36Aspergillus oryzaendndndndnd
19FG40Aspergillus flavus4.77 ± 0.02 mnd71.66 ± 0.02 hnd76.43 ± 0.03 k
20FG41Aspergillus parasiticus29.44 ± 0.04 hnd45.09 ± 0.01 l1062.56 ± 0.05 c1137.09 ± 0.08 c
21FG42Aspergillus flavus4.65 ± 0.03 nnd73.73 ± 0.02 gnd78.39 ± 0.06 j
22FG43Aspergillus nomius56.57 ± 0.03 f0.84 ± 0.01 g75.63 ± 0.02 e704.67 ± 0.02 d837.70 ± 0.06 d
23FG44Aspergillus ochraceoroseus11.47 ± 0.02 l2.34 ± 0.02 e22.65 ± 0.02 p3.77 ± 0.02 g40.23 ± 0.05 n
24Control 1Aspergillus flavus ATCC 462830.53 ± 0.07 snd29.35 ± 0.03 nnd29.87 ± 0.05 o
25Control 2Saccharomyces cerevisiae0.63 ± 0.03 rnd0.04 ± 0.01 snd0.67 ± 0.03
26StandardAFG2 (0.05) µg/mL13,820.28ndndndnd
27standardAFG1 (0.05) µg/mLnd4,556,586ndndnd
28standardAFB2 (0.05) µg/mLndnd1,798,698ndnd
29standardAFB1 (0.05) µg/mLndndnd3,742,170nd
30standardAFTOT (0.05) µg/mLndndndnd11,479,481
StandardWHO/FAO limit in Feed [26] 5 µg/kg
European Union limit in animal feed [27] 4 µg/kg
European Commission aflatoxins in animal feed [14,28] 5–20 µg/kg
European Commission tolerable limit of aflatoxins in foods in Africa [28] <5–20 µg/kg
European Commission tolerable limits of aflatoxins in Animal feeds [28] <0.001–0.01 µg/kg body weight
European Commission aflatoxins limits for infants food [28] 0.05–10 µg/kg
Keys; FG = fungal isolates description; AFB1, AFB2, AFG1, AFG2 = Aflatoxins; and AFTOT = total aflatoxin. Superscript are significantly different across the column at p ≤ 0.05.

