Improved Dietary Guidelines for Vitamin D: Application of Individual Participant Data (IPD)-Level Meta-Regression Analyses


Abstract
:1. Introduction
2. Materials and Methods, Including Scientific Approach
2.1. Context and Parameters of the Analyses
2.2. Measurement of Serum 25-hydroxyvitamin D
2.3. Assessment of Total Vitamin D Intake
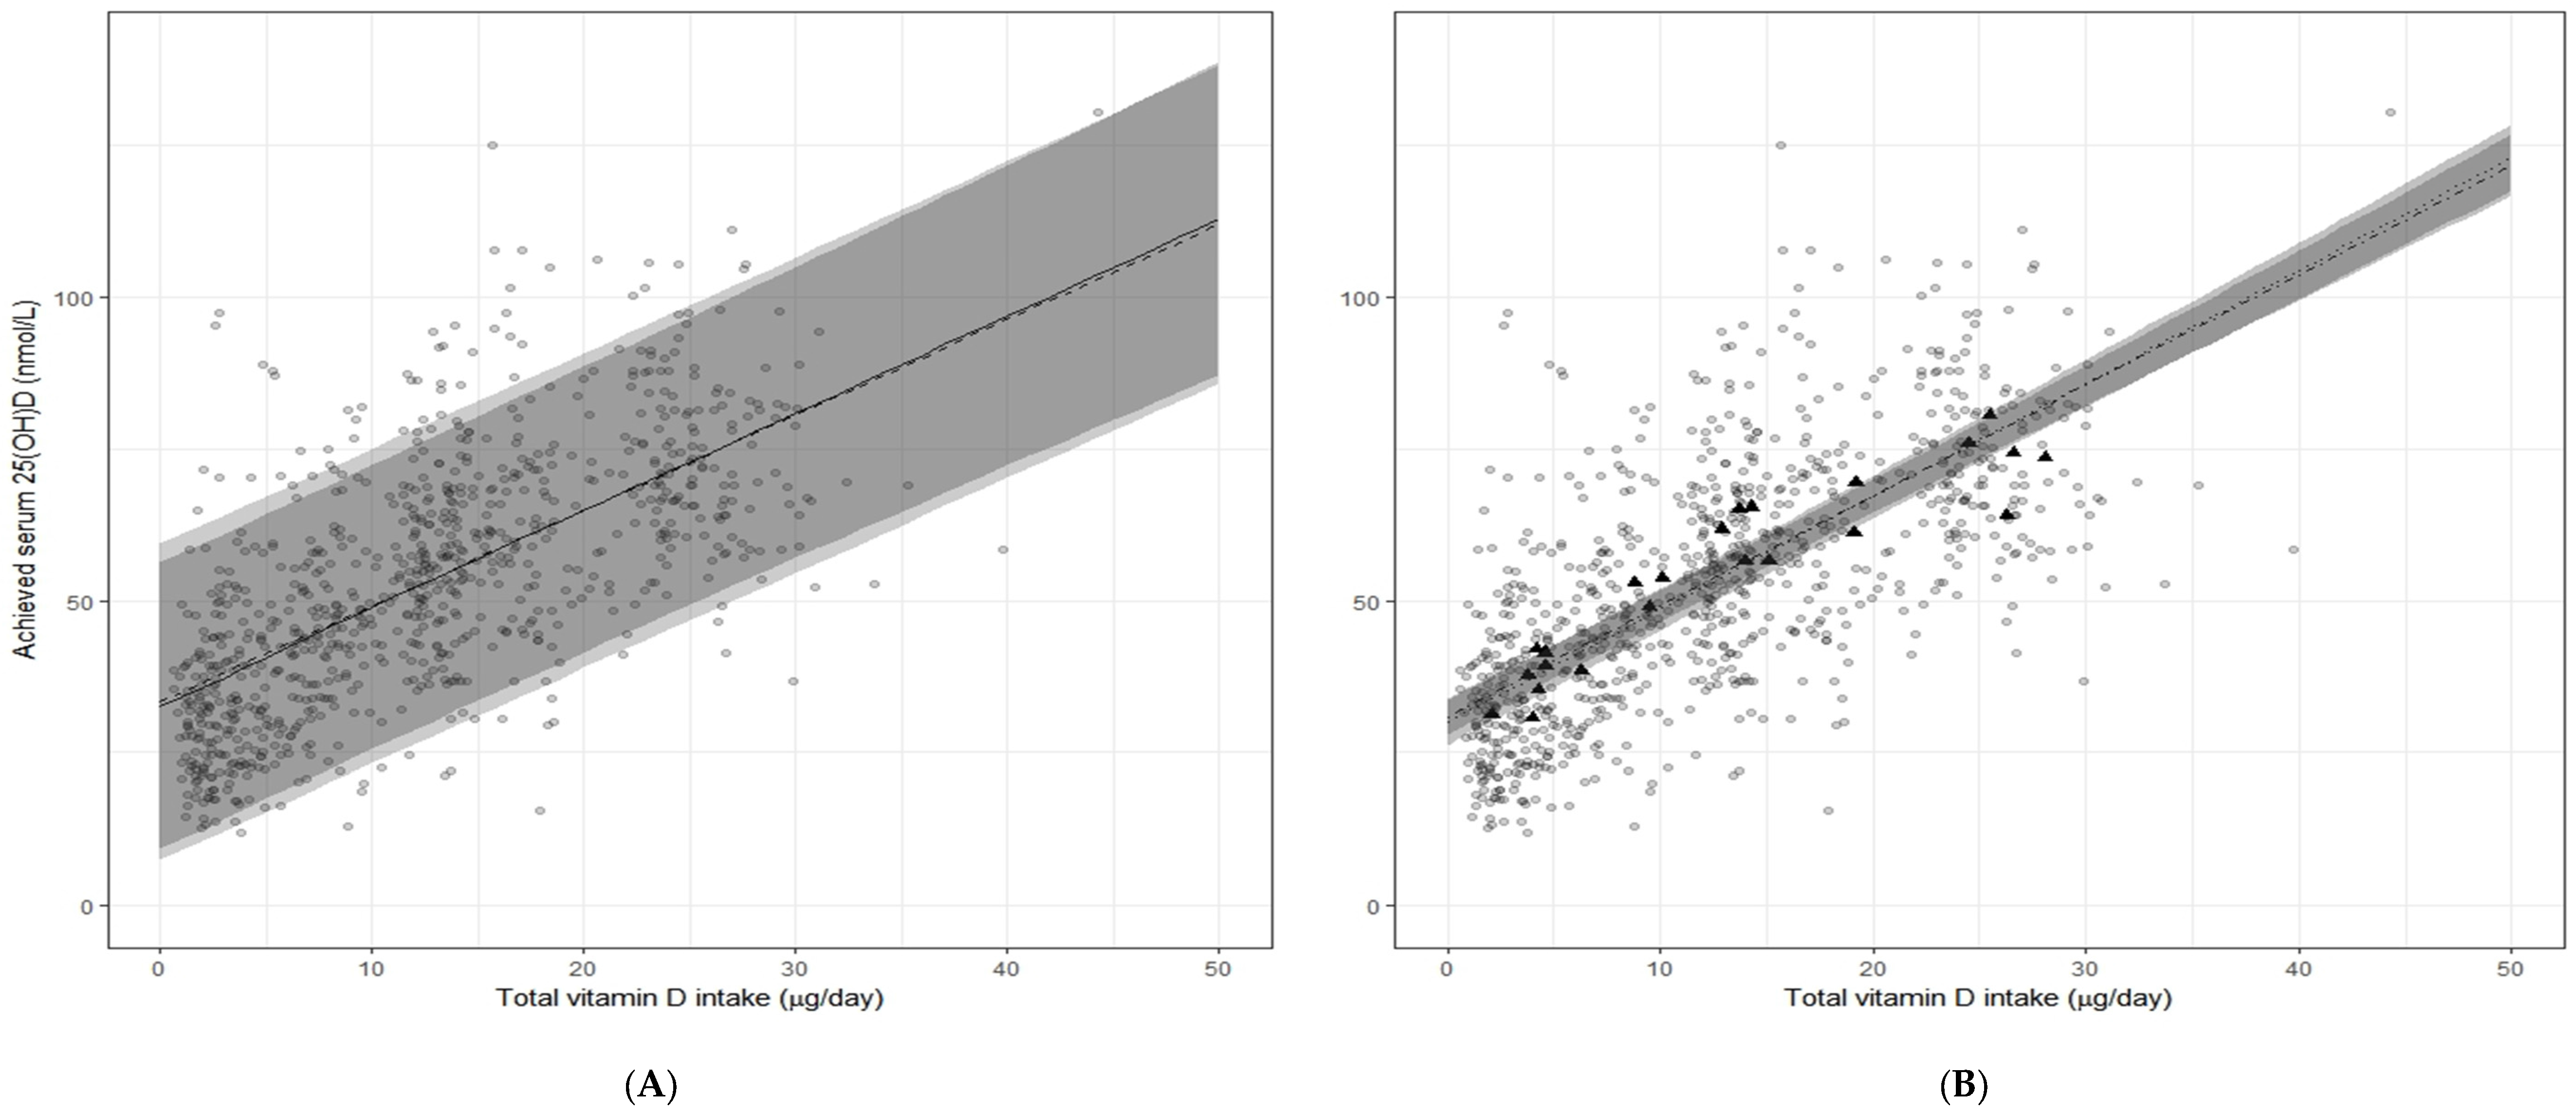
2.4. Meta-Regression Analysis of the Vitamin D–Serum 25-(OH)D Relation Using Data from the Seven Prioritized RCTs: Aggregate v. IPD-Based
2.5. Sensitivity Analyses: Two-Step IPD
3. Results
3.1. Vitamin D Requirement Estimates Based on the Two-Step IPD Meta-Regression Analyses
- Using the UK SACN 25(OH)D cut-off of ≥25 nmol/L (9), we estimated the vitamin D requirement to be 9.9 µg/day;
3.2. Outcomes of the Sensitivity Analyses for the Two-Step IPD
3.3. Comparison with Vitamin D Requirement Estimates from Standard Meta-Regression Analyses Based on Aggregate Data
4. Discussion
5. Conclusions
Acknowledgments
Author Contributions
Conflicts of Interest
Appendix
Appendix A. Supplemental Materials and Methods
Predefined Criteria for Selection of Randomized Controlled Trials for Inclusion in DRV Meta-Regression Analyses
- (1)
- Vitamin D3 administered orally on a daily basis, but limited to:
- ≤1200 IU/day (30 µg/day; 1 µg = 40 IU) (NORDEN),
- ≤2000 IU/day (50 µg/day) (IOM),
- or ≤4000 IU/day (100 µg/day) (EFSA)
- (2)
- No vitamin D metabolites [25(OH)D and 1,25(OH)2D] and analogues (e.g., alfacalcidol) co-administered;
- (3)
- Winter-based studies, performed at relatively high latitudes to ensure minimal impact of UVB on the vitamin D intake–25(OH)D dose-response relationship and thus the calculated vitamin D intake requirements to achieve serum 25(OH)D thresholds. The selected latitude ranges/thresholds were:
- >40° N (EFSA),
- ≥49.5° N (or ≥49.5° S) (IOM),
- or ≥50° N (NORDEN)
- (4)
- Minimum of 6 weeks duration (on the basis that following initiation of vitamin D supplementation, serum 25(OH)D concentrations reach equilibrium after 6–8 weeks in adult and elderly subjects [44]). IOM did not apply this criteria as RCTs as short as 4 weeks were included;
- (5)
- Reported serum or plasma 25(OH)D following supplementation in at least one intervention group and one control group;
- (6)
- Assessment of vitamin D intakes on which to base the dose-response calculations. The IOM, NORDEN, and EFSA prioritized use of ‘total vitamin D intake‘ (i.e., vitamin D intake from diet as well as that from supplemental vitamin D dose used in the RCT) [1,10,11], which was the best overall estimate of vitamin D intake.
Appendix B. ODIN Collaborators:
References
- Institute of Medicine Food and Nutrition Board. Dietary Reference Intakes for Calcium and Vitamin D; National Academy Press: Washington, DC, USA, 2011. [Google Scholar]
- Munns, C.F.; Shaw, N.; Kiely, M.; Specker, B.L.; Thacher, T.D.; Ozono, K.; Michigami, T.; Tiosano, D.; Mughal, M.Z.; Mäkitie, O.; et al. Global Consensus Recommendations on Prevention and Management of Nutritional Rickets. J. Clin. Endocrinol. MeTable 2016, 101, 394–415. [Google Scholar] [CrossRef] [PubMed]
- Cranney, A.; Horsley, T.; O’Donnell, S.; Weiler, H.; Puil, L.; Ooi, D.; Atkinson, S.; Ward, L.; Moher, D.; Hanley, D.; et al. Effectiveness and Safety of Vitamin D in Relation to Bone Health; Evidence Report/Technology Assessment No. 158; Agency for Healthcare Research and Quality: Rockville, MD, USA, 2007.
- Cashman, K.D.; Dowling, K.G.; Škrabáková, Z.; Gonzalez-Gross, M.; Valtueña, J.; De Henauw, S.; Moreno, L.; Damsgaard, C.T.; Michaelsen, K.F.; Mølgaard, C.; et al. Vitamin D deficiency in Europe: Pandemic? Am. J. Clin. Nutr. 2016, 103, 1033–1044. [Google Scholar] [PubMed]
- Holick, M.F.; Binkley, N.C.; Bischoff-Ferrari, H.A.; Gordon, C.M.; Hanley, D.A.; Heaney, R.P.; Murad, M.H.; Weaver, C.M.; Endocrine Society. Evaluation, treatment, and prevention of vitamin D deficiency: An Endocrine Society clinical practice guideline. J. Clin. Endocrinol. MeTable 2011, 96, 1911–1930. [Google Scholar]
- De Benoist, B.; McLean, E.; Egli, I.; Cogswell, M. (Eds.) Worldwide Prevalence of Anaemia 1993–2005: WHO Global Database on Anaemia; World Health Organisation: Geneva, Switzerland, 2008. [Google Scholar]
- Cashman, K.D.; Kiely, M. Recommended dietary intakes for vitamin D: Where do they come from, what do they achieve and how can we meet them? J. Hum. Nutr. Diet. 2014, 27, 434–442. [Google Scholar] [CrossRef] [PubMed]
- Cashman, K.D. Vitamin D: Dietary requirements and food fortification as a means of helping achieve adequate vitamin D status. J. Steroid Biochem. Mol. Biol. 2015, 148, 19–26. [Google Scholar] [PubMed]
- Scientific Advisory Committee on Nutrition Report on Vitamin D and Health. Available online: http://www.sacn.gov.uk/pdfs/sacn_vitamin D_and_health_report_web.pdf (accessed on 1 July 2016).
- EFSA NDA Panel (EFSA Panel on Dietetic Products, Nutrition and Allergies). Scientific opinion on Dietary Reference Values for vitamin D. EFSA J. 2016, 14, 4547. [Google Scholar]
- NORDEN Nordic Nutrition Recommendations, 5th Edition (NNR5)—Vitamin D. Available online: http://www.slv.se/en-gb/Startpage-NNR/Public-consultation11/ (accessed on 28 August 2013).
- German Nutrition Society. New reference values for vitamin D. Ann. Nutr. MeTable 2012, 60, 241–246. [Google Scholar]
- Carriquiry, A.L. Assessing the prevalence of nutrient inadequacy. Public Health Nutr. 1999, 2, 23–33. [Google Scholar] [PubMed]
- Binkley, N.; Krueger, D.; Cowgill, C.S.; Plum, L.; Lake, E.; Hansen, K.E.; DeLuca, H.F.; Drezner, M.K. Assay variation confounds the diagnosis of hypovitaminosis D: A call for standardization. J. Clin. Endocrinol. MeTable 2004, 89, 3152–3157. [Google Scholar] [CrossRef] [PubMed]
- Riley, R.D.; Higgins, J.P.; Deeks, J.J. Interpretation of random effects meta-analyses. BMJ 2011, 342, d549. [Google Scholar] [CrossRef] [PubMed]
- Vale, C.L.; Rydzewska, L.H.; Rovers, M.M.; Emberson, J.R.; Gueyffier, F.; Stewart, L.A.; Cochrane IPD Meta-Analysis Methods Group. Uptake of systematic reviews and meta-analyses based on individual participant data in clinical practice guidelines: Descriptive study. BMJ. 2015, 350, h1088. [Google Scholar] [CrossRef] [PubMed]
- Mortensen, C.; Damsgaard, C.T.; Hauger, H.; Ritz, C.; Lanham-New, S.A.; Smith, T.J.; Hennessy, Á.; Dowling, K.G.; Cashman, K.D.; Kiely, M.; et al. Estimation of the dietary requirement for vitamin D in 4–8 year-old, white children: A randomized, controlled, dose-response trial. Am. J. Clin. Nutr. 2016, 104, 1310–1317. [Google Scholar] [CrossRef] [PubMed]
- Cashman, K.D.; FitzGerald, A.P.; Viljakainen, H.T.; Jakobsen, J.; Michaelsen, K.F.; Lamberg-Allardt, C.; Mølgaard, C. Estimation of the dietary requirement for vitamin D in healthy adolescent white girls. Am. J. Clin. Nutr. 2011, 93, 549–555. [Google Scholar] [CrossRef] [PubMed]
- Smith, T.J.; Tripkovic, L.; Damsgaard, C.T.; Mølgaard, C.; Ritz, C.; Wilson-Barnes, S.L.; Dowling, K.G.; Hennessy, Á.; Cashman, K.D.; Kiely, M.; et al. Estimation of the dietary requirement for vitamin D in adolescents aged 14–18 years: A dose-response, double-blind, randomized placebo-controlled trial. Am. J. Clin. Nutr. 2016, 104, 1301–1309. [Google Scholar] [CrossRef] [PubMed]
- Cashman, K.D.; Hill, T.R.; Lucey, A.J.; Taylor, N.; Seamans, K.M.; Muldowney, S.; Fitzgerald, A.P.; Flynn, A.; Barnes, M.S.; Horigan, G.; et al. Estimation of the dietary requirement for vitamin D in healthy adults. Am. J. Clin. Nutr. 2008, 88, 1535–1542. [Google Scholar] [CrossRef] [PubMed]
- Cashman, K.D.; Seamans, K.M.; Lucey, A.J.; Stöcklin, E.; Weber, P.; Kiely, M.; Hill, T.R. Relative effectiveness of oral 25-hydroxyvitamin D3 and vitamin D3 in raising wintertime serum 25-hydroxyvitamin D in older adults. Am. J. Clin. Nutr. 2012, 95, 1350–1356. [Google Scholar] [CrossRef] [PubMed]
- Cashman, K.D.; Hayes, A.; O’Donovan, S.M.; Zhang, J.Y.; Kinsella, M.; Galvin, K.; Kiely, M.; Seamans, K.M. Dietary calcium does not interact with vitamin D₃ in terms of determining the response and catabolism of serum 25-hydroxyvitamin D during winter in older adults. Am. J. Clin. Nutr. 2014, 99, 1414–1423. [Google Scholar] [CrossRef] [PubMed]
- Cashman, K.D.; Wallace, J.M.; Horigan, G.; Hill, T.R.; Barnes, M.S.; Lucey, A.J.; Bonham, M.P.; Taylor, N.; Duffy, E.M.; Seamans, K.; et al. Estimation of the dietary requirement for vitamin D in free-living adults ≥64 y of age. Am. J. Clin. Nutr. 2009, 89, 1366–1374. [Google Scholar] [CrossRef] [PubMed]
- Cashman, K.D.; Kiely, M.; Kinsella, M.; Durazo-Arvizu, R.A.; Tian, L.; Zhang, Y.; Lucey, A.; Flynn, A.; Gibney, M.J.; Vesper, H.W.; et al. Evaluation of Vitamin D Standardization Program protocols for standardizing serum 25-hydroxyvitamin D data: A case study of the program’s potential for national nutrition and health surveys. Am. J. Clin. Nutr. 2013, 97, 1235–1242. [Google Scholar] [CrossRef] [PubMed]
- Cashman, K.D.; Kinsella, M.; McNulty, B.A.; Walton, J.; Gibney, M.J.; Flynn, A.; Kiely, M. Dietary vitamin D2—A potentially underestimated contributor to vitamin D nutritional status of adults? Br. J. Nutr. 2014, 112, 193–202. [Google Scholar] [CrossRef] [PubMed]
- Rahmani, Y.E.; Botelho, J.C.; Vesper, H.W. CDC Vitamin D Standardization Certification Program. Endocr. Rev. 2013, 34, SUN-277. [Google Scholar]
- Hollis, B.W. Measuring 25-hydroxyvitamin D in a clinical environment: Challenges and needs. Am. J. Clin. Nutr. 2008, 88, 507S–510S. [Google Scholar] [PubMed]
- Kiely, M.; Collins, A.; Lucey, A.J.; Andersen, R.; Cashman, K.D.; Hennessy, Á. Development, validation and implementation of a quantitative food frequency questionnaire to assess habitual vitamin D intake. J. Hum. Nutr. Diet. 2016, 29, 495–504. [Google Scholar] [CrossRef] [PubMed]
- Debray, T.P.A.; Moons, K.G.M.; Abo-Zaid, G.M.A.; Koffijberg, H.; Riley, R.D. Individual Participant Data Meta-Analysis for a Binary Outcome: One-Stage or Two-Stage? PLoS ONE 2013, 8, e60650. [Google Scholar] [CrossRef] [PubMed]
- Stewart, G.B.; Altman, D.G.; Askie, L.M.; Duley, L.; Simmonds, M.C.; Stewart, L.A. Statistical Analysis of Individual Participant Data Meta-Analyses: A Comparison of Methods and Recommendations for Practice. PLoS One 2012, 7, e46042. [Google Scholar] [CrossRef] [PubMed]
- Viechtbauer, W. Conducting meta-analyses in R with the metafor package. J. Stat. Soft. 2010, 36, 1–48. [Google Scholar] [CrossRef]
- Wortsman, J.; Matsuoka, L.Y.; Chen, T.C.; Lu, Z.; Holick, M.F. Decreased bioavailability of vitamin D in obesity. Am. J. Clin. Nutr. 2000, 72, 690–693. [Google Scholar] [PubMed]
- Black, L.J.; Walton, J.; Flynn, A.; Cashman, K.D.; Kiely, M. Small Increments in Vitamin D Intake by Irish Adults over a Decade Show That Strategic Initiatives to Fortify the Food Supply Are Needed. J. Nutr. 2015, 145, 969–976. [Google Scholar] [CrossRef] [PubMed]
- O’Neill, C.M.; Kazantzidis, A.; Ryan, M.J.; Barber, N.; Sempos, C.T.; Durazo-Arvizu, R.A.; Jorde, R.; Grimnes, G.; Eiriksdottir, G.; Gudnason, V.; et al. Seasonal changes in vitamin D-effective UVB availability in Europe and associations with population serum 25-hydroxyvitamin D. Nutrients 2016, 8, 533. [Google Scholar] [CrossRef] [PubMed]
- Aloia, J.F.; Patel, M.; Dimaano, R.; Li-Ng, M.; Talwar, S.A.; Pollack, S.; Yeh, J.K. Vitamin D intake to attain a desired serum 25-hydroxyvitamin D concentration. Am. J. Clin. Nutr. 2008, 87, 1952–1958. [Google Scholar] [PubMed]
- Flynn, A.; Hirvonen, T.; Mensink, G.B.; Ocké, M.C.; Serra-Majem, L.; Stos, K.; Szponar, L.; Tetens, I.; Turrini, A.; Fletcher, R.; et al. Intake of selected nutrients from foods, from fortification and from supplements in various European countries. Food Nutr. Res. 2009, 12, 53. [Google Scholar] [CrossRef] [PubMed]
- Fulgoni, V.L., 3rd; Keast, D.R.; Bailey, R.L.; Dwyer, J. Foods, fortificants, and supplements: Where do Americans get their nutrients? J. Nutr. 2011, 141, 1847–1854. [Google Scholar] [CrossRef] [PubMed]
- Thompson, S.G.; Higgins, J.P. How should meta-regression analyses be undertaken and interpreted? Stat. Med. 2002, 21, 1559–1573. [Google Scholar] [CrossRef] [PubMed]
- Ní Chaoimh, C.; McCarthy, E.K.; Hourihane, J.O.; Kenny, L.C.; Irvine, A.D.; Murray, D.M.; Kiely, M.E. Low vitamin D deficiency in Irish toddlers despite northerly latitude and a high prevalence of inadequate intakes. Eur. J. Nutr. 2016. [CrossRef] [PubMed]
- Cashman, K.D.; Kiely, M. Towards prevention of vitamin D deficiency and beyond: Knowledge gaps and research needs in vitamin D nutrition and public health. Br. J. Nutr. 2011, 106, 1617–1627. [Google Scholar] [CrossRef] [PubMed]
- Food Standards Agency, UK. McCance and Widdowson’s Composition of Foods Integrated Dataset. Available online: http://www.food.gov.uk/science/dietarysurveys/dietsurveys/ (accessed on 1 June 2011).
- Autier, P.; Gandini, S.; Mullie, P. A systematic review: Influence of vitamin D supplementation on serum 25-hydroxyvitamin D concentration. J. Clin. Endocrinol. MeTable 2012, 97, 2606–2613. [Google Scholar] [CrossRef] [PubMed]
- Tripkovic, L.; Lambert, H.; Hart, K.; Smith, C.P.; Bucca, G.; Penson, S.; Chope, G.; Hyppönen, E.; Berry, J.; Vieth, R.; Lanham-New, S. Comparison of vitamin D2 and vitamin D3 supplementation in raising serum 25-hydroxyvitamin D status: a systematic review and meta-analysis. Am. J. Clin. Nutr. 2012, 95, 1357–1364. [Google Scholar] [CrossRef] [PubMed]
- Harris, S.S.; Dawson-Hughes, B. Plasma vitamin D and 25(OH)D responses of young and old men to supplementation with vitamin D3. J. Am. Coll. Nutr. 2002, 21, 357–362. [Google Scholar] [CrossRef] [PubMed]

| Study | Cashman et al. 2008 | Cashman et al. 2009 | Cashman et al. 2011 | Cashman et al. 2012 | Cashman et al. 2014 | Smith et al. 2016 | Mortensen et al. 2016 |
|---|---|---|---|---|---|---|---|
| (Reference Number) | [19] | [22] | [17] | [20] | [21] | [18] | [16] |
| Trial registry ID | ISRCTN20236112 | NCT01990872 | NCT00267540 | NCT01398202 | NCT01990872 | ISRCTN40736890 | NCT02145195 |
| Design parameters | |||||||
| Location (° N) | Ireland (51° N and 55° N) | Ireland (51° N and 55° N) | Denmark (55° N) | Ireland (51° N) | Ireland (51° N) | UK (51° N) | Denmark (55° N) |
| Year of study | 2006–2007 | 2007–2008 | 2001–2002 | 2011 | 2012–2013 | 2014–2015 | 2014–2015 |
| Duration (and Months) | 22 weeks (October–April) | 22 weeks (September–April) | 22 weeks (October–April) | 10 weeks (January–April) | 15 weeks (November–March) | 20 weeks (October–March) | 20 weeks (September–March) |
| Supplemental vitamin D3 dose(s) (µg/day) | 0, 5, 10, 15 | 0, 5, 10, 15 | 0, 5, 10 | 0, 20 | 0, 20 | 0, 10, 20 | 0, 10, 20 |
| Subject characteristics: | |||||||
| n | 196 | 176 | 140 | 28 | 122 | 102 | 119 |
| Sex (Male:Female) | 98:98 | 70:106 | 140 F | 13:16 | 34:88 | 86:130 | 55:64 |
| Age (year) | 29.9 ± 6.2 1 | 70.7 ± 5.4 | 11.3 ± 0.3 | 57.2 ± 6.3 | 59.9 ± 6.5 | 15.9 ± 1.4 | 6.7 ± 1.5 |
| Weight (kg) | 77.0 ± 15.8 | 76.9 ± 4.3 | 42.1 ± 8.5 | 79.0 ± 15.3 | 72.5 ± 13.3 | 60.7 ± 12.7 | 23.4 ± 5.0 |
| Height (m) | 1.71 ± 0.009 | 1.62 ± 0.09 | 1.50 ± 0.07 | 1.67 ± 0.08 | 1.64 ± 0.11 | 1.70 ± 0.10 | 1.22 ± 0.10 |
| BMI (kg/m2) | 26.1 ± 4.3 | 28.9 ± 4.8 | 18.6 ± 3.0 | 28.3 ± 4.8 | 26.7 ± 4.2 | 21.3 ± 3.4 | 15.5 ± 1.4 |
| Dietary calcium (mg/day) | 976 (682, 1301) 2 | 874 (678, 1174) | 1122 ± 582 | 971 ± 445 | 814 ± 413 | 853 (591, 1249) | 683 (485, 914) |
| Dietary vitamin D (µg/day) | 3.6 (2.1, 5.4) | 4.4 (2.7, 5.9) | 3.7 ± 2.0 | 5.4 (3.5, 8.2) | 4.4 (2.9, 6.8) | 3.3 (2.2, 5.5) | 1.8 (1.2, 2.5) |
| Serum 25(OH)D (nmol/L) | 66.1 ± 22.5 * | 51.9 ± 18.6 * | 62.8 ± 13.5 * | 41.5 ± 15.7 * | 55.1 ± 20.4 | 48.2 (41.2, 22.70) | 56.7 ± 12.3 |
| Published RDA at 25 nmol/L (µg/day) 3 | 8.7 | 8.6 | 8.3 | NR | NR | 10.1 | 6.4 |
| Serum 25(OH)D | 50th Percentile 3 | 90th Percentile | 95th Percentile | 97.5th Percentile 4 |
|---|---|---|---|---|
| Adjusted model 1 | µg/day | |||
| ≥25 nmol/L | - | 4.7 (3.6, 5.9) | 7.5 (5.9, 9.1) | 9.9 (7.9, 12.0) |
| ≥30 nmol/L | - | 7.9 (6.5, 9.2) | 10.6 (8.8, 12.5) | 13.1 (10.8, 15.4) |
| ≥40 nmol/L | 4.5 (3.1, 6.0) | 14.2 (12.3, 16.2) | 17.1 (14.6, 19.6) | 19.6 (16.5, 22.6) |
| ≥50 nmol/L | 10.9 (9.2, 12.5) | 20.7 (17.9, 23.5) | 23.5 (20.2, 26.9) | 26.1 (22.1, 30.1) |
| Unadjusted model 2 | µg/day | |||
| ≥25 nmol/L | - | 6.8 (5.0, 8.6) | 9.9 (7.5, 12.3) | 12.7 (9.7, 15.7) |
| ≥30 nmol/L | - | 9.7 (7.6, 11.8) | 12.9 (10.1, 15.6) | 15.7 (12.3, 19.0) |
| ≥40 nmol/L | 4.7 (3.3, 6.1) | 15.7 (12.9, 18.5) | 18.9 (15.4, 22.3) | 21.7 (17.6, 25.8) |
| ≥50 nmol/L | 10.6 (8.7, 12.4) | 21.6 (18.1, 25.2) | 24.8 (20.6, 29.1) | 27.7 (22.7, 32.6) |
| Name of Agency: Specified DRV | Criterion Appliedby Establishing Agency | Agency Recommendation (µg/day) | Our IPD-Derived Value (µg/day) |
|---|---|---|---|
| IOM: RDA | Intake to meet needs of 97.5% of individuals at target serum 25(OH)D of 50 nmol/L | 15 | 26 |
| NORDEN: RI | Intake to meet needs of 97.5% of individuals at target serum 25(OH)D of 50 nmol/L | 10 | 26 |
| EFSA: AI | Intake to meet needs of 97.5% of individuals at target serum 25(OH)D of 50 nmol/L | 15 | 26 |
| SACN: RNI | Intake to meet needs of 97.5% of individuals at target serum 25(OH)D of 25 nmol/L | 10 | 10 |
| IOM: EAR | Intake to meet needs of 50% of individuals at target serum 25(OH)D of 40 nmol/L | 10 | 4.5 |
| NORDEN: AR | Intake to meet needs of 50% of individuals at target serum 25(OH)D of 50 nmol/L | 7.5 | 11 |
© 2017 by the authors. Licensee MDPI, Basel, Switzerland. This article is an open access article distributed under the terms and conditions of the Creative Commons Attribution (CC BY) license (http://creativecommons.org/licenses/by/4.0/).
Share and Cite
Cashman, K.D.; Ritz, C.; Kiely, M.; ODIN Collaborators. Improved Dietary Guidelines for Vitamin D: Application of Individual Participant Data (IPD)-Level Meta-Regression Analyses. Nutrients 2017, 9, 469. https://doi.org/10.3390/nu9050469
Cashman KD, Ritz C, Kiely M, ODIN Collaborators. Improved Dietary Guidelines for Vitamin D: Application of Individual Participant Data (IPD)-Level Meta-Regression Analyses. Nutrients. 2017; 9(5):469. https://doi.org/10.3390/nu9050469
Chicago/Turabian StyleCashman, Kevin D., Christian Ritz, Mairead Kiely, and ODIN Collaborators. 2017. "Improved Dietary Guidelines for Vitamin D: Application of Individual Participant Data (IPD)-Level Meta-Regression Analyses" Nutrients 9, no. 5: 469. https://doi.org/10.3390/nu9050469
APA StyleCashman, K. D., Ritz, C., Kiely, M., & ODIN Collaborators. (2017). Improved Dietary Guidelines for Vitamin D: Application of Individual Participant Data (IPD)-Level Meta-Regression Analyses. Nutrients, 9(5), 469. https://doi.org/10.3390/nu9050469