Predictors of Vitamin D-Containing Supplement Use in the Australian Population and Associations between Dose and Serum 25-Hydroxyvitamin D Concentrations


Abstract
:1. Introduction
2. Materials and Methods
2.1. Study Population
2.2. Use of Vitamin D-Containing Supplements
2.3. Analysis of Serum 25-Hydroxyvitamin D Concentrations
2.4. Participant Characteristics
2.5. Statistical Analysis
3. Results
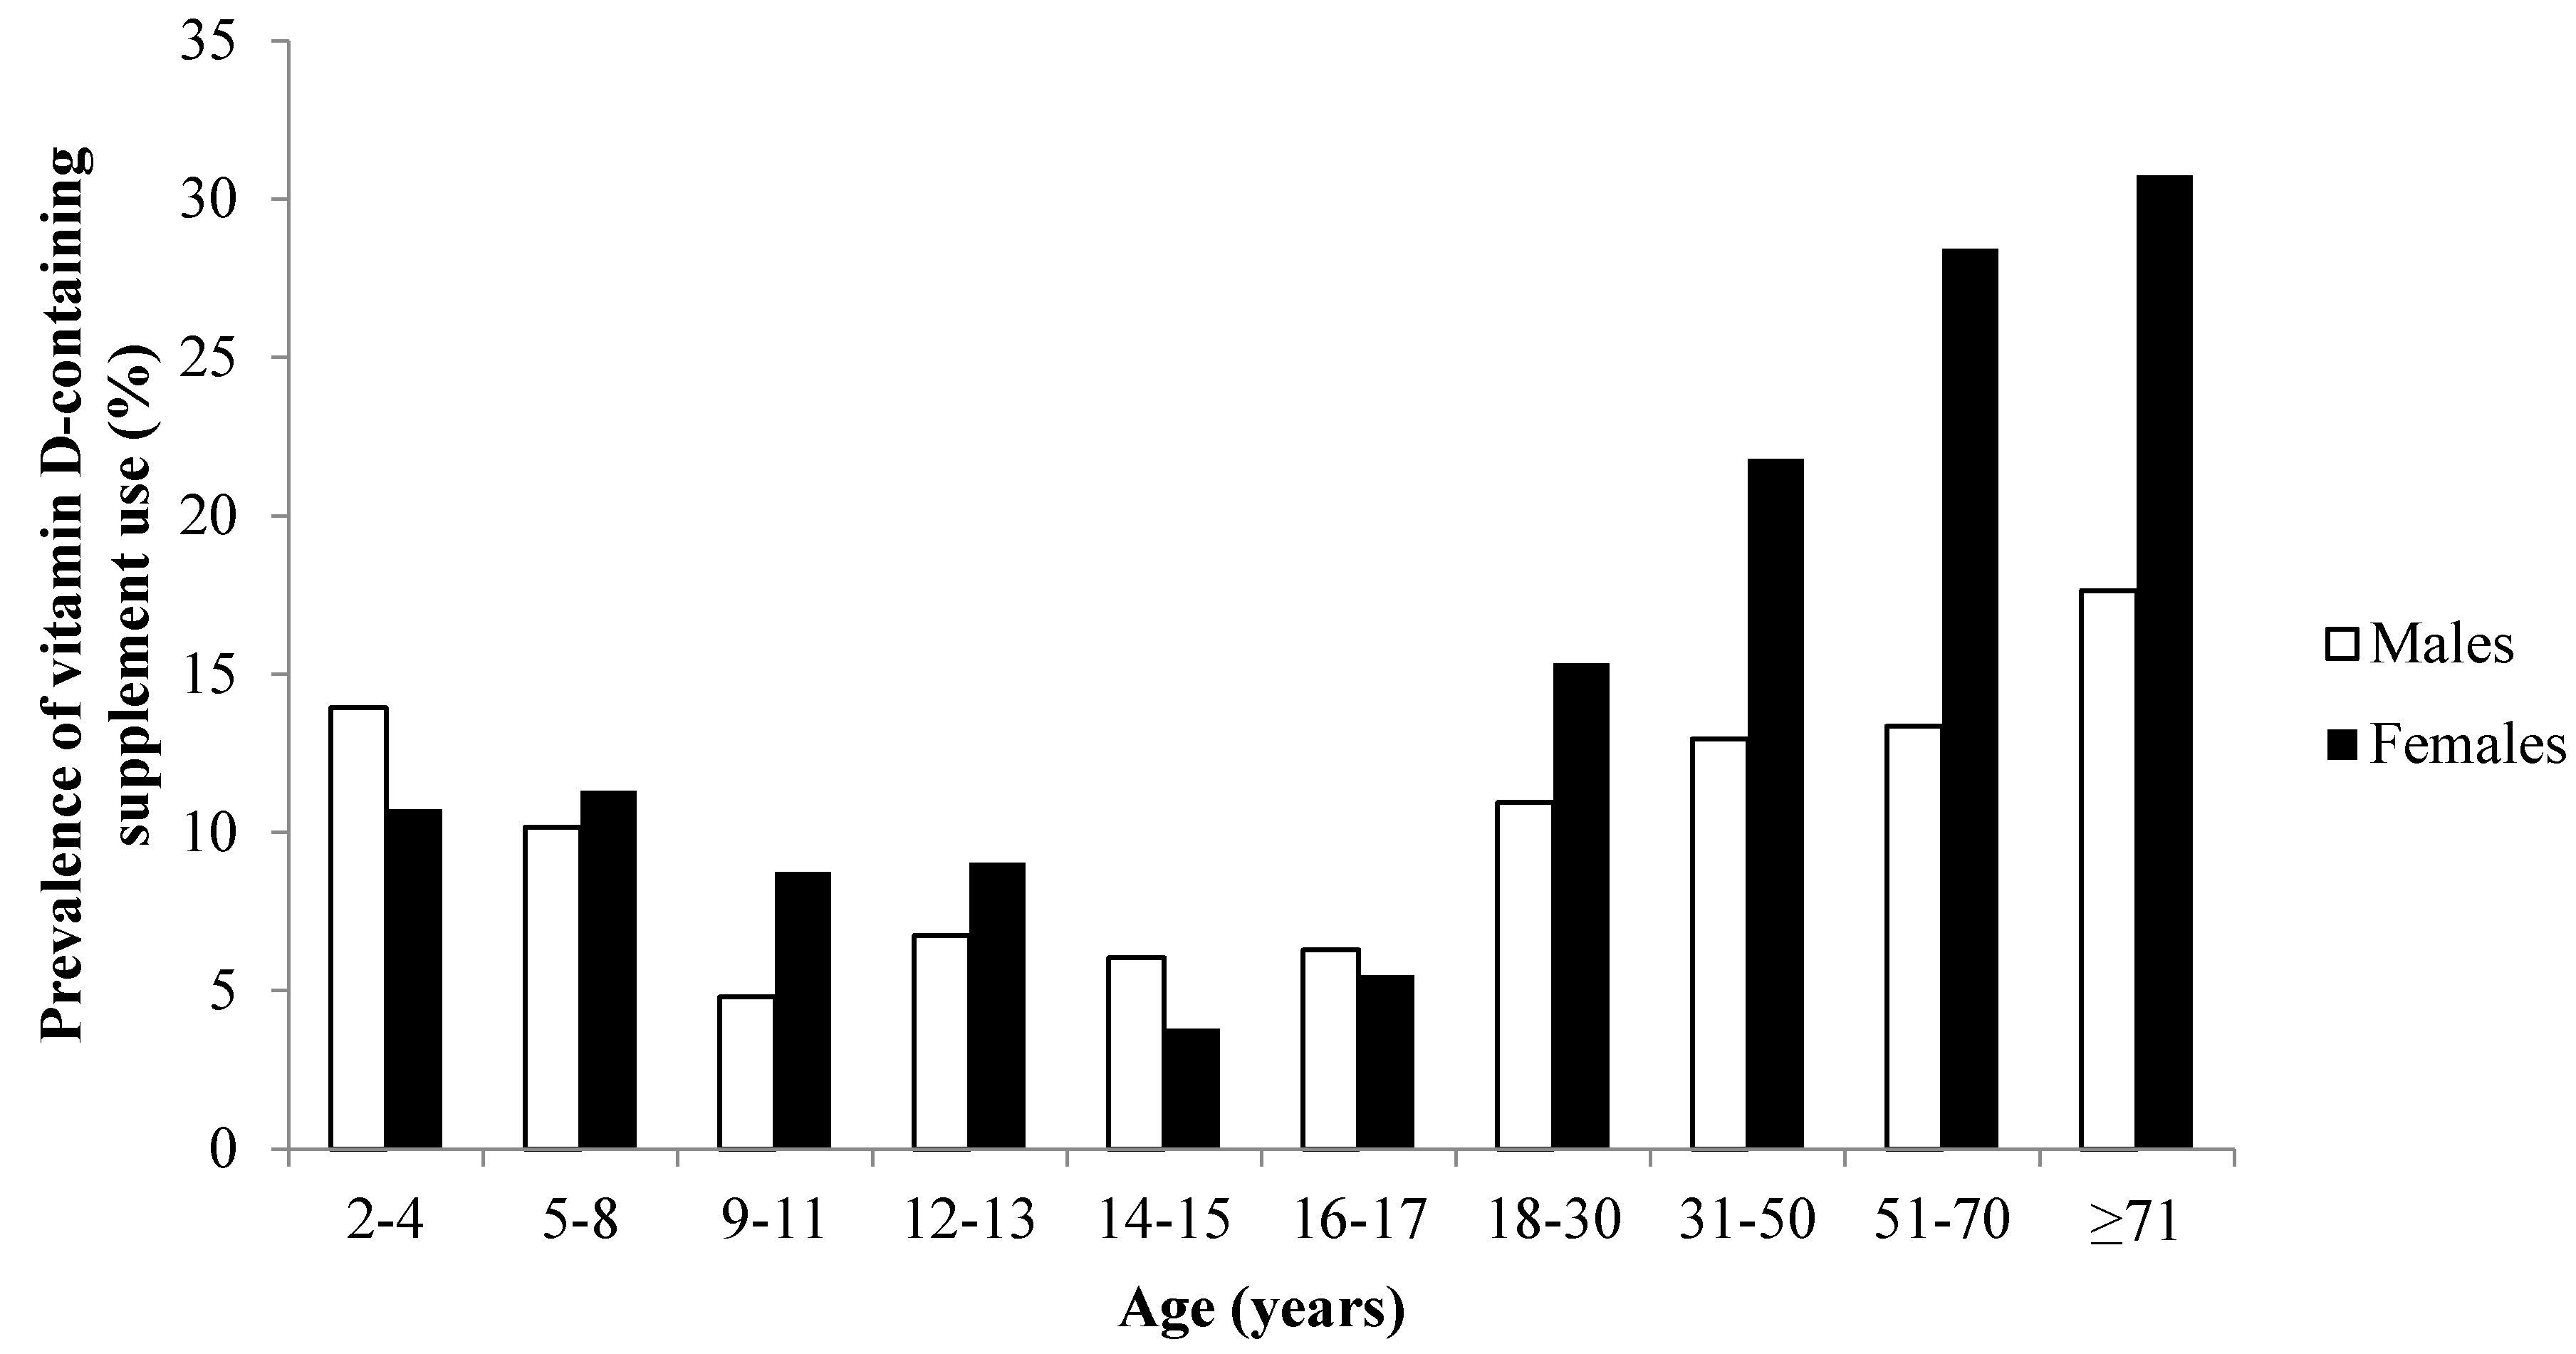
3.1. Prevalence of Vitamin D-Containing Supplement Use
3.2. Independent Predictors of Vitamin D-Containing Supplement Use
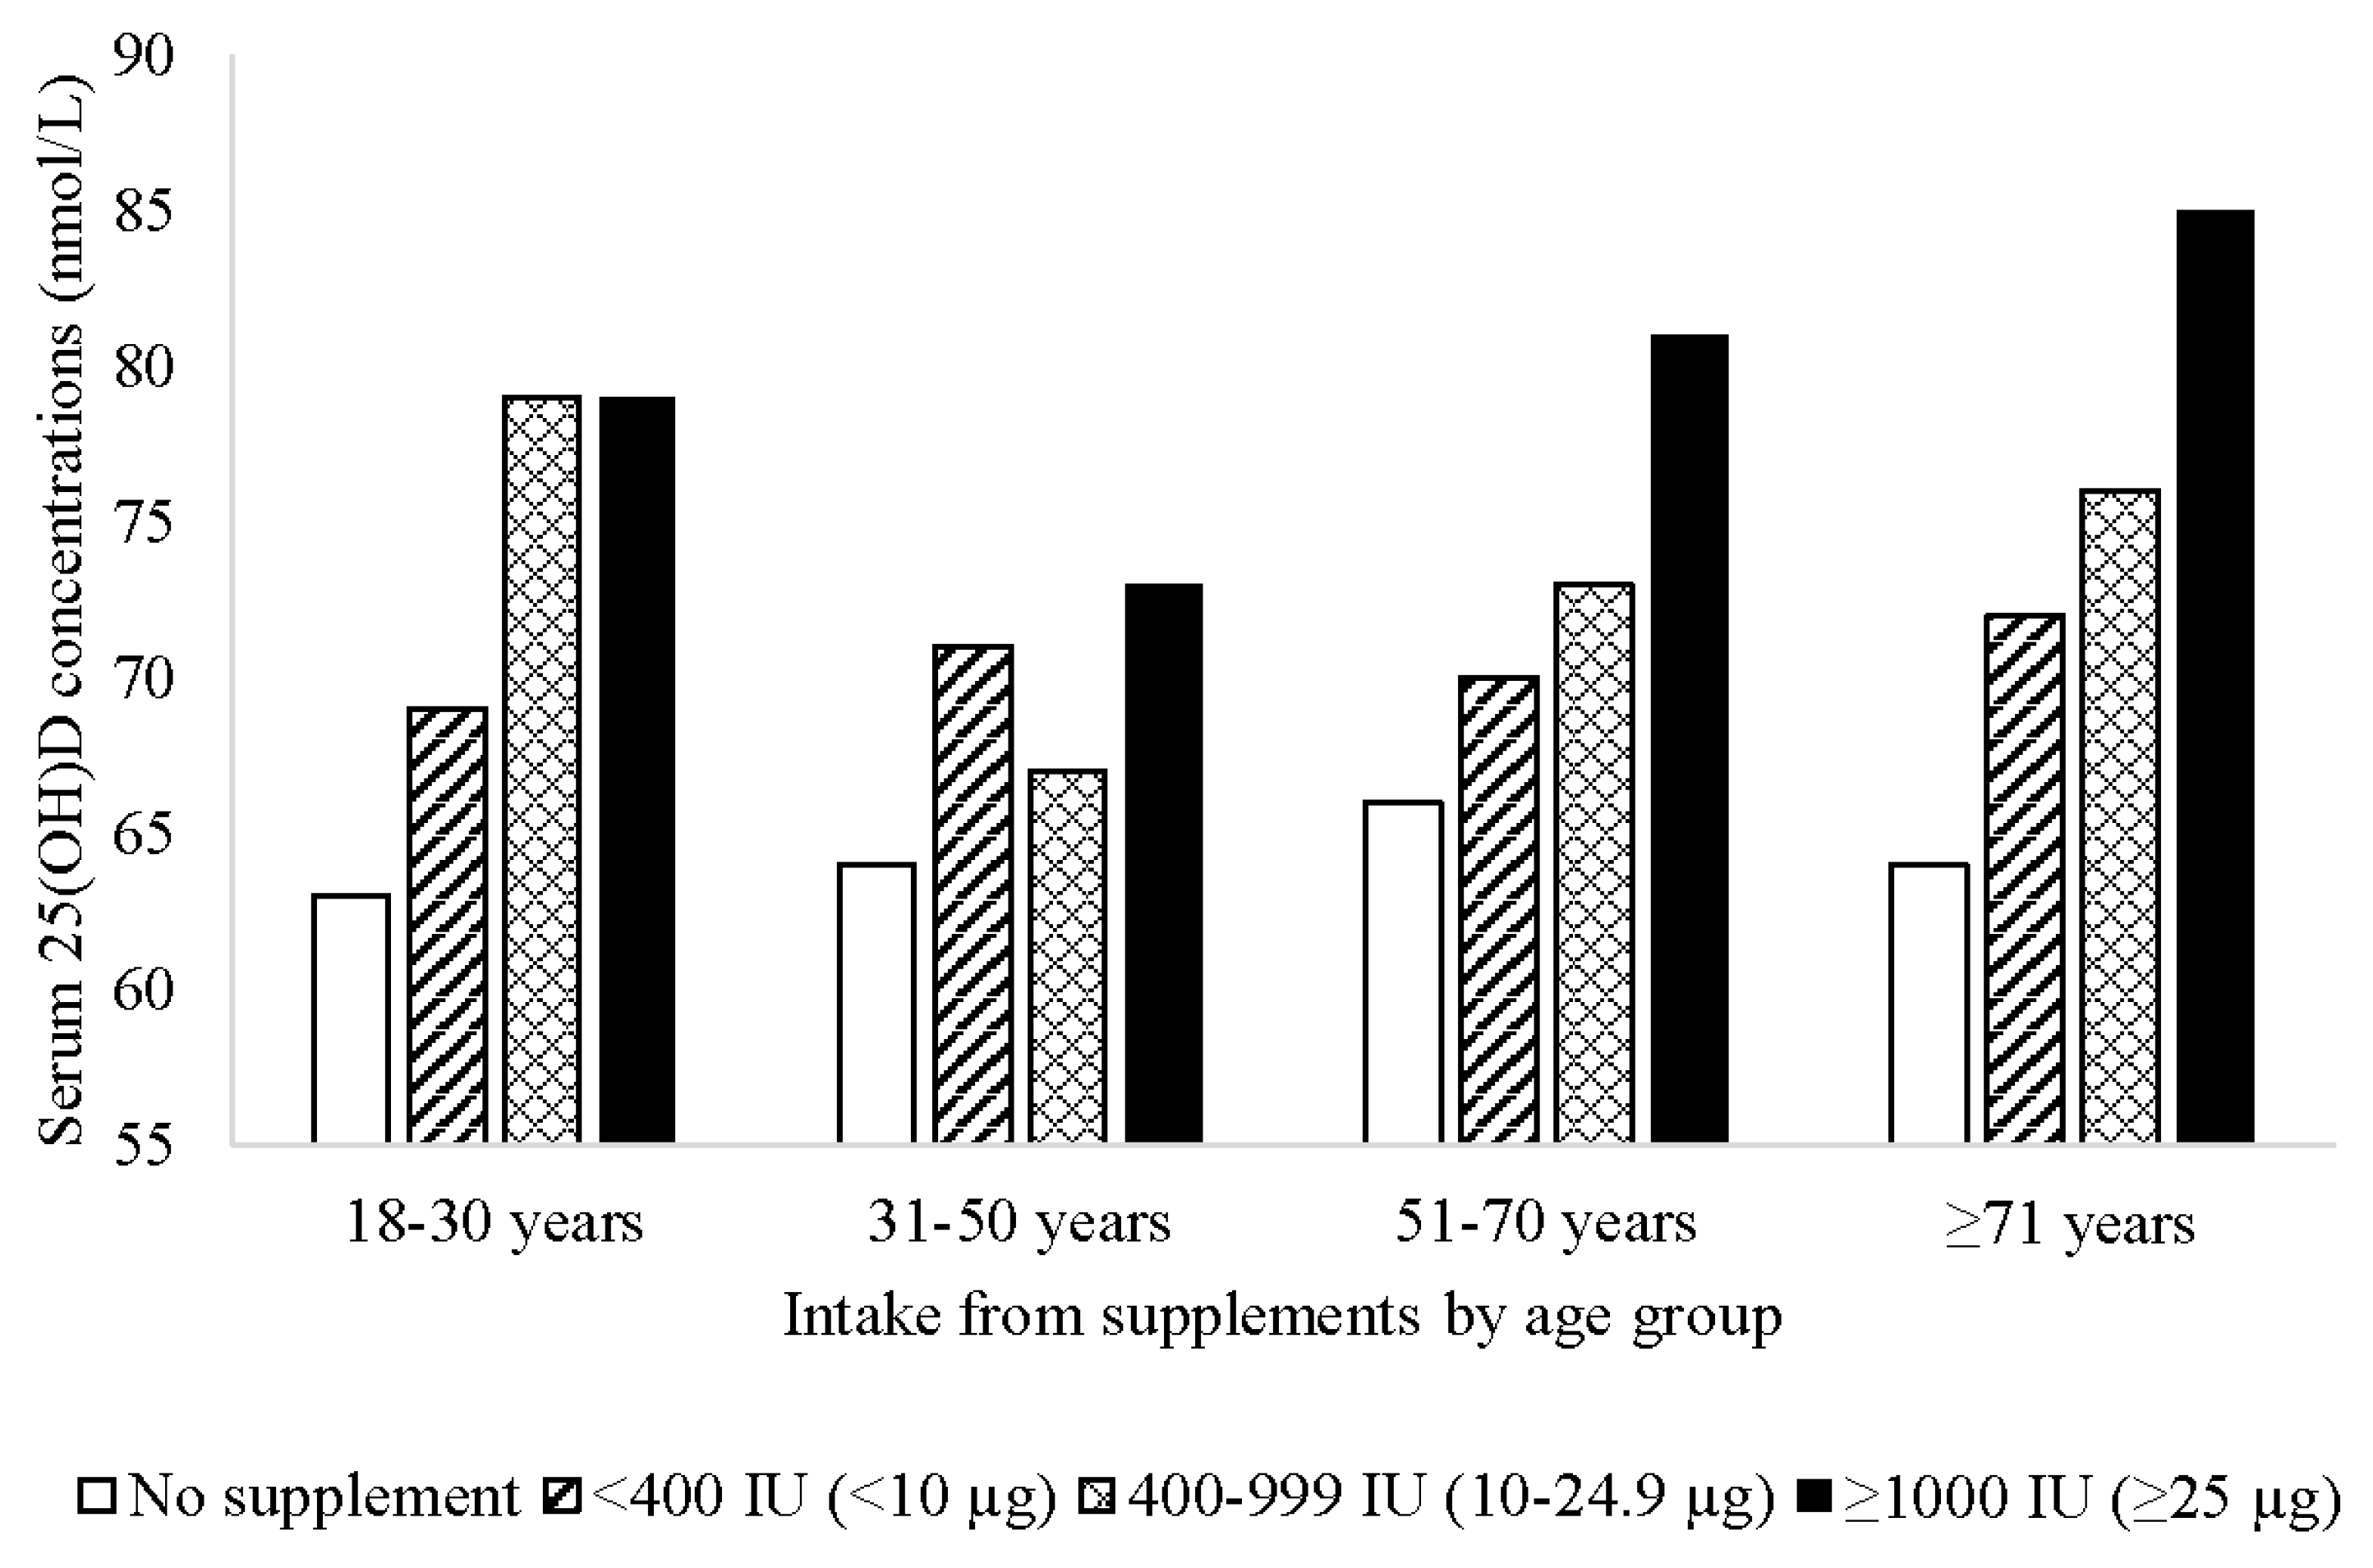
3.3. Associations with Serum 25-Hydroxyvitamin D Concentrations
4. Discussion
5. Conclusions
Acknowledgments
Author Contributions
Conflicts of Interest
Abbreviations
| 25(OH)D | 25-hydroxyvitamin D |
| NNPAS | National Nutrition and Physical Activity Survey |
| SEIFA | Socio-Economic Indexes for Areas |
| UL | Tolerable Upper Intake Level |
References
- International Agency for Research on Cancer. Globocan 2012: Estimated Cancer Incidence, Mortality and Prevalence Worldwide in 2012. Available online: http://globocan.iarc.fr/Default.aspx (accessed on 2 June 2016).
- Australian Bureau of Statistics. Australian Health Survey: Biomedical Results for Nutrients; Australian Bureau of Statistics: Canberra, Australia, 2014.
- Munns, C.F.; Simm, P.J.; Rodda, C.P.; Garnett, S.P.; Zacharin, M.R.; Ward, L.M.; Geddes, J.; Cherian, S.; Zurynski, Y.; Cowell, C.T. Incidence of vitamin D deficiency rickets among Australian children: An Australian paediatric surveillance unit study. Med. J. Aust. 2012, 196, 466–468. [Google Scholar] [PubMed]
- Black, L.J.; Walton, J.; Flynn, A.; Kiely, M. Adequacy of vitamin D intakes in children and teenagers from the base diet, fortified foods and supplements. Public Health Nutr. 2013, 17, 721–731. [Google Scholar] [CrossRef] [PubMed]
- Fulgoni, V.L.; Keast, D.R.; Bailey, R.L.; Dwyer, J. Foods, fortificants, and supplements: Where do Americans get their nutrients? J. Nutr. 2011, 141, 1847–1854. [Google Scholar] [CrossRef] [PubMed]
- Bailey, R.L.; Dodd, K.W.; Goldman, J.A.; Cahche, J.J.; Dwyer, J.T.; Moshfegh, A.J.; Sempos, C.T.; Picciano, M.F. Estimation of total usual calcium and vitamin D intakes in the United States. J. Nutr. 2010, 140, 817–822. [Google Scholar] [CrossRef] [PubMed]
- Whiting, S.J.; Langlois, K.A.; Vatanparast, H.; Greene-Finestone, L.S. The vitamin D status of Canadians relative to the 2011 dietary reference intakes: An examination in children and adults with and without supplement use. Am. J. Clin. Nutr. 2011, 94, 128–135. [Google Scholar] [CrossRef] [PubMed]
- Black, L.J.; Walton, J.; Flynn, A.; Cashman, K.D.; Kiely, M. Small increments in vitamin D intake by Irish adults over a decade show that strategic initiatives to fortify the food supply are needed. J. Nutr. 2015, 145, 969–976. [Google Scholar] [CrossRef] [PubMed]
- Greene-Finestone, L.S.; Langlois, K.A.; Whiting, S.J. Characteristics of users of supplements containing vitamin D in canada and associations between dose and 25-hydroxvitamin D. Appl. Physiol. Nutr. Metab. 2013, 38, 707–715. [Google Scholar] [CrossRef] [PubMed]
- Skeie, G.; Braaten, T.; Hjartaker, A.; Lentjes, M.; Amiano, P.; Jakszyn, P.; Pala, V.; Palanca, A.; Niekerk, E.M.; Verhagen, H.; et al. Use of dietary supplements in the european prospective investigation into cancer and nutrition calibration study. Eur. J. Clin. Nutr. 2009, 63, S226–S238. [Google Scholar] [CrossRef] [PubMed]
- Gahche, J.; Bailey, R.; Burt, V.; Hughes, J.; Yetley, E.; Dwyer, J.; Picciano, M.F.; McDowell, M.; Sempos, C. Dietary supplement use among US adults has increased since NHANES III (1988–1994). NCHS Data Brief 2011, 61, 1–8. [Google Scholar] [PubMed]
- Australian Bureau of Statistics. Australian Health Survey: Users’ Guide, 2011–2013; Australian Bureau of Statistics: Canberra, Australia, 2013.
- Australian Government Department of Health, Therapeutic Goods Administration. Australian Register of Therapeutic Goods. Available online: https://www.tga.gov.au/australian-register-therapeutic-goods (accessed on 2 June 2016).
- Sempos, C.T.; Vesper, H.W.; Phinney, K.W.; Thienpont, L.M.; Coates, P.M. Vitamin D status as an international issue: National surveys and the problem of standardization. Scand. J. Clin. Lab. Investig. Suppl. 2012, 243, 32–40. [Google Scholar]
- Australian Bureau of Statistics. Census of Population and Housing: Socio-Economic Indexes for Areas (SEIFA), Australia, 2011. Available online: http://www.abs.gov.au/ausstats/abs@.nsf/Lookup/2033.0.55.001main+features42011 (accessed on 2 June 2016).
- Scientific Committee for Food. Guidelines of the Scientific Committee on Food for the Development of Tolerable upper Intake Levels for Vitamins and Minerals; European Commission: Brussels, Belgium, 2000. [Google Scholar]
- Institute of Medicine. Dietary Reference Intakes for Calcium and Vitamin D; National Academies Press: Washington, DC, USA, 2011. [Google Scholar]
- Green, T.J.; Barr, S.I.; Chapman, G.E. The majority of older British Columbians take vitamin D-containing supplements. Can. J. Public Health 2010, 101, 246–250. [Google Scholar] [PubMed]
- Hollis, B.W.; Wagner, C.L.; Howard, C.R.; Ebeling, M.; Shary, J.R.; Smith, P.G.; Taylor, S.N.; Morella, K.; Lawrence, R.A.; Hulsey, T.C. Maternal versus infant vitamin D supplementation during lactation: A randomized controlled trial. Pediatrics 2015, 136, 625–634. [Google Scholar] [CrossRef] [PubMed]
- Vatanparast, H.; Adolphe, J.L.; Whiting, S.J. Socio-economic status and vitamin/mineral supplement use in Canada. Stat. Can. 2010, 21, 19–25. [Google Scholar]
- Bailey, R.L.; Gahche, J.J.; Lentino, C.V.; Dwyer, J.T.; Engel, J.S.; Thomas, P.R.; Betz, J.M.; Sempos, C.T.; Picciano, M.F. Dietary supplement use in the United States, 2003–2006. J. Nutr. 2011, 141, 261–266. [Google Scholar] [CrossRef] [PubMed]
- Radimer, K.; Bindewald, B.; Hughes, J.; Ervin, B.; Swanson, C.; Picciano, M.F. Dietary supplement use by US adults: Data from the national health and nutrition examination survey, 1999–2000. Am. J. Epidemiol. 2004, 160, 339–349. [Google Scholar] [CrossRef] [PubMed]
- Whiting, S.J.; Vatanparast, H.; Taylor, J.G.; Adolphe, J.L. Barriers to healthful eating and supplement use in lower-income adults. Can. J. Diet. Pract. Res. 2010, 71, 70–76. [Google Scholar] [CrossRef] [PubMed]
- Reaves, L.; Steffen, L.M.; Dwyer, J.T.; Webber, L.S.; Lytle, L.A.; Feldman, H.A.; Hoelscher, D.M.; Zive, M.M.; Osganian, S.K. Vitamin supplement intake is related to dietary intake and physical activity: The Child and Adolescent Trial for Cardiovascular Health (CATCH). J. Am. Diet. Assoc. 2006, 106, 2018–2023. [Google Scholar] [CrossRef] [PubMed]
- O’Dea, J.A. Consumption of nutritional supplements among adolescents: Usage and perceived benefits. Health Educ. Res. 2003, 18, 98–107. [Google Scholar] [CrossRef] [PubMed]
- Tetens, I.; Biltoft-Jensen, A.; Spagner, C.; Christensen, T.; Gille, M.B.; Bugel, S.; Banke Rasmussen, L. Intake of micronutrients among Danish adult users and non-users of dietary supplements. Food Nutr. Res. 2012, 55. [Google Scholar] [CrossRef] [PubMed]
- Drincic, A.T.; Armas, L.A.; van Diest, E.E.; Heaney, R.P. Volumetric dilution, rather than sequestration best explains the low vitamin D status of obesity. Obesity 2012, 20, 1444–1448. [Google Scholar] [CrossRef] [PubMed]
- Mai, X.M.; Chen, Y.; Camargo, C.A., Jr.; Langhammer, A. Cross-sectional and prospective cohort study of serum 25-hydroxyvitamin D level and obesity in adults: The hunt study. Am. J. Epidemiol. 2012, 175, 1029–1036. [Google Scholar] [CrossRef] [PubMed]
- Snijder, M.B.; van Dam, R.M.; Visser, M.; Deeg, D.J.; Dekker, J.M.; Bouter, L.M.; Seidell, J.C.; Lips, P. Adiposity in relation to vitamin D status and parathyroid hormone levels: A population-based study in older men and women. J. Clin. Endocrinol. Metab. 2005, 90, 4119–4123. [Google Scholar] [CrossRef] [PubMed]
- Pludowski, P.; Karczmarewicz, E.; Bayer, M.; Carter, G.; Chlebna-Sokół, D.; Czech-Kowalska, J.; Dębski, R.; Decsi, T.; Dobrzańska, A.; Franek, E.; et al. Practical guidelines for the supplementation of vitamin D and the treatment of deficits in Central Europe—Recommended vitamin D intakes in the general population and groups at risk of vitamin D deficiency. Endokrynol. Polska 2013, 64, 319–327. [Google Scholar] [CrossRef]
- Spedding, S.; Vanlint, S.; Morris, H.; Scragg, R. Does vitamin D sufficiency equate to a single serum 25-hydroxyvitamin D level or are different levels required for non-skeletal diseases? Nutrients 2013, 5, 5127–5139. [Google Scholar] [CrossRef] [PubMed]


| 2–11 Years | 12–17 Years | 18–30 Years | 31–50 Years | 51–70 Years | ≥71 Years | ≥2 Years | ≥18 Years | |
|---|---|---|---|---|---|---|---|---|
| n (%) | n (%) | n (%) | n (%) | n (%) | n (%) | n (%) | n (%) | |
| Total | ||||||||
| All types | 176 (10.3) | 63 (6.3) | 224 (13.3) | 629 (17.6) | 624 (21.5) | 323 (25.3) | 2039 (16.8) | 1800 (19.1) |
| Single vitamin D | 1 (0.1) | 5 (0.5) | 26 (1.5) | 104 (2.9) | 218 (7.5) | 147 (11.5) | 501 (4.1) | 495 (5.2) |
| Calcium 1 | 17 (1.0) | 6 (0.6) | 5 (0.3) | 67 (1.9) | 157 (5.4) | 72 (5.6) | 324 (2.7) | 301 (3.2) |
| MVMM 1 | 155 (9.1) | 50 (5.0) | 179 (10.6) | 460 (12.9) | 300 (10.3) | 128 (10.0) | 1272 (10.5) | 1067 (11.3) |
| Fish oil 1 | 7 (0.4) | 7 (0.7) | 26 (1.5) | 50 (1.4) | 42 (1.4) | 15 (1.2) | 147 (1.2) | 133 (1.4) |
| Fish liver oil 2 | 4 (0.2) | 0 (0.0) | 1 (0.1) | 10 (0.3) | 16 (0.6) | 16 (1.3) | 47 (0.4) | 43 (0.5) |
| Males | ||||||||
| All types | 87 (10.2) | 33 (6.4) | 86 (10.9) | 216 (12.9) | 179 (13.3) | 94 (17.6) | 695 (12.2) | 575 (13.3) |
| Single vitamin D | 1 (0.1) | 1 (0.2) | 6 (0.8) | 27 (1.6) | 51 (3.8) | 36 (6.8) | 122 (2.1) | 120 (2.8) |
| Calcium 1 | 9 (1.1) | 3 (0.6) | 3 (0.4) | 14 (0.8) | 19 (1.4) | 11 (2.1) | 59 (1.0) | 47 (1.1) |
| MVMM 1 | 75 (8.8) | 26 (5.0) | 68 (8.7) | 161 (9.6) | 99 (7.4) | 45 (8.4) | 474 (8.3) | 373 (8.6) |
| Fish oil 1 | 3 (0.4) | 4 (0.8) | 14 (1.8) | 28 (1.7) | 19 (1.4) | 6 (1.1) | 74 (1.3) | 67 (1.5) |
| Fish liver oil 2 | 2 (0.2) | 0 (0.0) | 0 (0.0) | 5 (0.3) | 4 (0.3) | 6 (1.1) | 17 (0.3) | 15 (0.3) |
| Females | ||||||||
| All types | 89 (10.4) | 30 (6.1) | 138 (15.3) | 413 (21.8) | 445 (28.4) | 229 (30.7) | 1344 (20.8) | 1225 (24.0) |
| Single vitamin D | 0 (0.0) | 4 (0.8) | 20 (2.2) | 77 (4.1) | 167 (10.7) | 111 (14.9) | 379 (5.9) | 375 (7.3) |
| Calcium 1 | 8 (0.9) | 3 (0.6) | 2 (0.2) | 53 (2.8) | 138 (8.8) | 61 (8.2) | 265 (4.1) | 254 (5.0) |
| MVMM 1 | 80 (9.3) | 24 (4.9) | 111 (12.3) | 299 (15.8) | 201 (12.8) | 83 (11.1) | 798 (12.4) | 694 (13.6) |
| Fish oil 1 | 4 (0.5) | 3 (0.6) | 12 (1.3) | 22 (1.2) | 23 (1.5) | 9 (1.2) | 73 (1.1) | 66 (1.3) |
| Fish liver oil 2 | 2 (0.2) | 0 (0.0) | 1 (0.1) | 5 (0.3) | 12 (0.8) | 10 (1.3) | 30 (0.5) | 28 (0.5) |
| n | % Across Rows | n | % Across Rows | p | |
|---|---|---|---|---|---|
| Vitamin D-Containing Supplement User | Vitamin D-Containing Supplement Non-User | ||||
| Sex | 1800 | 7635 | <0.001 | ||
| Male | 575 | 13 | 3754 | 87 | |
| Female | 1225 | 24 | 3881 | 76 | |
| Age Group | 1800 | 7635 | <0.001 | ||
| 18–30 years | 224 | 13 | 1462 | 87 | |
| 31–50 years | 629 | 18 | 2936 | 82 | |
| 51–70 years | 624 | 21 | 2282 | 79 | |
| ≥71 years | 323 | 25 | 955 | 75 | |
| Region of birth | 1800 | 7635 | 0.009 | ||
| Australia and New Zealand | 1277 | 18 | 5729 | 82 | |
| Europe | 275 | 21 | 1017 | 79 | |
| Americas | 26 | 21 | 98 | 79 | |
| Asia | 166 | 22 | 574 | 78 | |
| Africa and Middle East | 56 | 21 | 217 | 79 | |
| State/Territory | 1800 | 7635 | <0.001 | ||
| New South Wales | 312 | 19 | 1345 | 81 | |
| Victoria | 276 | 20 | 1085 | 80 | |
| Queensland | 271 | 18 | 1239 | 82 | |
| South Australia | 248 | 21 | 952 | 79 | |
| Western Australia | 258 | 19 | 1067 | 81 | |
| Tasmania | 205 | 21 | 791 | 79 | |
| Northern Territory | 68 | 12 | 507 | 88 | |
| Australian Capital Territory | 162 | 20 | 649 | 80 | |
| Education | 1767 | 7524 | <0.001 | ||
| None after school | 601 | 16 | 3103 | 84 | |
| Certificate | 366 | 17 | 1849 | 83 | |
| Bachelor/Diploma | 597 | 23 | 2005 | 77 | |
| Postgraduate | 203 | 26 | 567 | 74 | |
| SEIFA | 1800 | 7635 | <0.001 | ||
| Lowest 20% | 270 | 15 | 1508 | 85 | |
| Second quintile | 360 | 18 | 1601 | 82 | |
| Third quintile | 397 | 21 | 1476 | 79 | |
| Fourth quintile | 379 | 20 | 1537 | 80 | |
| Highest 20% | 394 | 21 | 1513 | 79 | |
| BMI category | 1527 | 6431 | 0.491 | ||
| Underweight | 24 | 20 | 97 | 80 | |
| Normal weight | 544 | 20 | 2192 | 80 | |
| Overweight | 559 | 19 | 2339 | 81 | |
| Obese | 400 | 18 | 1803 | 82 | |
| Physical activity | 1777 | 7551 | 0.218 | ||
| Low | 1001 | 18 | 4425 | 82 | |
| Moderate | 512 | 20 | 2062 | 80 | |
| High | 264 | 20 | 1064 | 80 | |
| Smoking | 1800 | 7635 | <0.001 | ||
| Current smoker | 197 | 11 | 1588 | 89 | |
| Ex-smoker | 660 | 21 | 2417 | 79 | |
| Never smoked | 943 | 21 | 3630 | 79 | |
| Alcohol (g/day) (median, IQR) | 1800 | 0.0 (14.4) | 7635 | 0.0 (16.3) | 0.006 |
| Health condition | 1800 | 7635 | <0.001 | ||
| Yes | 912 | 22 | 3155 | 78 | |
| No | 888 | 17 | 4480 | 83 | |
| Self-assessed health | 1800 | 7635 | 0.738 | ||
| Excellent | 286 | 19 | 1251 | 81 | |
| Very good | 647 | 19 | 2676 | 81 | |
| Good | 556 | 19 | 2409 | 81 | |
| Fair | 217 | 19 | 946 | 81 | |
| Poor | 94 | 21 | 353 | 79 | |
| Type of Supplement | Minimum | Maximum | Median | IQR |
|---|---|---|---|---|
| Single vitamin D | 1000 (25.0) | 1000 (25.0) | 1000 (25.0) | 0 (0.0) |
| Multivitamin/mineral | 4 (0.1) | 1000 (25.0) | 200 (5.0) | 224 (5.6) |
| Calcium preparation | 5.2 (1.3) | 1000 (25.0) | 200 (5.0) | 200 (5.0) |
| Fish oil preparation | 4 (0.1) | 1000 (25.0) | 200 (5.0) | 264 (6.6) |
| Fish liver oil | 8 (0.2) | 252 (6.3) | 80 (2.0) | 40 (1.0) |
| Adjusted OR (95% CI) | p | |
|---|---|---|
| Sex (female vs. male) | 2.05 (1.80, 2.33) | <0.001 |
| Age group | <0.001 | |
| 18–30 years | Reference category | |
| 31–50 years | 1.36 (1.12, 1.64) | 0.002 |
| 51–70 years | 2.00 (1.60, 2.41) | <0.001 |
| 71 years and over | 2.40 (1.88, 3.05) | <0.001 |
| Region of birth | 0.088 | |
| Australia and New Zealand | Reference category | |
| Europe | 0.97 (0.82, 1.15) | 0.705 |
| Americas | 1.21 (0.75, 1.94) | 0.435 |
| Asia | 1.26 (1.01, 1.57) | 0.044 |
| Africa and Middle East | 1.38 (1.00, 1.92) | 0.052 |
| State/Territory | 0.002 | |
| New South Wales | Reference category | |
| Victoria | 1.19 (0.97, 1.46) | 0.104 |
| Queensland | 0.99 (0.81, 1.22) | 0.949 |
| South Australia | 1.22 (0.98, 1.50) | 0.074 |
| Western Australia | 1.11 (0.90, 1.36) | 0.344 |
| Tasmania | 1.30 (1.04, 1.63) | 0.023 |
| Northern Territory | 0.64 (0.46, 0.88) | 0.007 |
| Australian Capital Territory | 1.10 (0.86, 1.40) | 0.460 |
| Season | 0.415 | |
| Summer | Reference category | |
| Autumn | 1.12 (0.96, 1.31) | 0.151 |
| Winter | 1.10 (0.93, 1.30) | 0.267 |
| Spring | 1.14 (0.96, 1.34) | 0.150 |
| Education | <0.001 | |
| None after school | Reference category | |
| Certificate | 1.27 (1.08, 1.50) | 0.004 |
| Bachelor/Diploma | 1.63 (1.40, 1.89) | <0.001 |
| Postgraduate | 1.87 (1.44, 2.42) | <0.001 |
| SEIFA | <0.001 | |
| Lowest 20% | Reference category | |
| Second quintile | 1.27 (1.04, 1.55) | 0.017 |
| Third quintile | 1.65 (1.35, 2.01) | <0.001 |
| Fourth quintile | 1.31 (1.07, 1.61) | 0.009 |
| Highest 20% | 1.31 (1.06, 1.61) | 0.012 |
| BMI category | 0.160 | |
| Normal weight | Reference category | |
| Overweight | 0.99 (0.86, 1.14) | 0.876 |
| Obese | 0.85 (0.73, 1.00) | 0.050 |
| Underweight | 1.12 (0.70, 1.81) | 0.638 |
| Physical activity | 0.006 | |
| Low | Reference category | |
| Moderate | 1.09 (0.95, 1.25) | 0.205 |
| High | 1.34 (1.12, 1.61) | 0.002 |
| Smoking | <0.001 | |
| Current smoker | Reference category | |
| Ex-smoker | 1.73 (1.42, 2.10) | <0.001 |
| Never smoked | 1.58 (1.30, 1.91) | <0.001 |
| Alcohol (g/day) | 1.00 (1.00, 1.00) | 0.802 |
| Health condition (yes v no) | 1.24 (1.09 1.42) | 0.001 |
| Self-assessed health | 0.019 | |
| Excellent | Reference category | |
| Very good | 1.22 (1.02, 1.46) | 0.032 |
| Good | 1.31 (1.08, 1.59) | 0.005 |
| Fair | 1.30 (1.03, 1.66) | 0.031 |
| Poor | 1.64 (1.19, 2.26) | 0.003 |
© 2016 by the authors; licensee MDPI, Basel, Switzerland. This article is an open access article distributed under the terms and conditions of the Creative Commons Attribution (CC-BY) license (http://creativecommons.org/licenses/by/4.0/).
Share and Cite
Black, L.J.; Jacoby, P.; Nowson, C.A.; Daly, R.M.; Lucas, R.M. Predictors of Vitamin D-Containing Supplement Use in the Australian Population and Associations between Dose and Serum 25-Hydroxyvitamin D Concentrations. Nutrients 2016, 8, 356. https://doi.org/10.3390/nu8060356
Black LJ, Jacoby P, Nowson CA, Daly RM, Lucas RM. Predictors of Vitamin D-Containing Supplement Use in the Australian Population and Associations between Dose and Serum 25-Hydroxyvitamin D Concentrations. Nutrients. 2016; 8(6):356. https://doi.org/10.3390/nu8060356
Chicago/Turabian StyleBlack, Lucinda J., Peter Jacoby, Caryl A. Nowson, Robin M. Daly, and Robyn M. Lucas. 2016. "Predictors of Vitamin D-Containing Supplement Use in the Australian Population and Associations between Dose and Serum 25-Hydroxyvitamin D Concentrations" Nutrients 8, no. 6: 356. https://doi.org/10.3390/nu8060356
APA StyleBlack, L. J., Jacoby, P., Nowson, C. A., Daly, R. M., & Lucas, R. M. (2016). Predictors of Vitamin D-Containing Supplement Use in the Australian Population and Associations between Dose and Serum 25-Hydroxyvitamin D Concentrations. Nutrients, 8(6), 356. https://doi.org/10.3390/nu8060356