Effect of Replacing Animal Protein with Plant Protein on Glycemic Control in Diabetes: A Systematic Review and Meta-Analysis of Randomized Controlled Trials


Abstract
:1. Introduction
2. Methods
2.1. Data Sources and Searches
2.2. Study Selection
2.3. Data Extraction and Quality Assessment
2.4. Data Synthesis and Analysis
3. Results
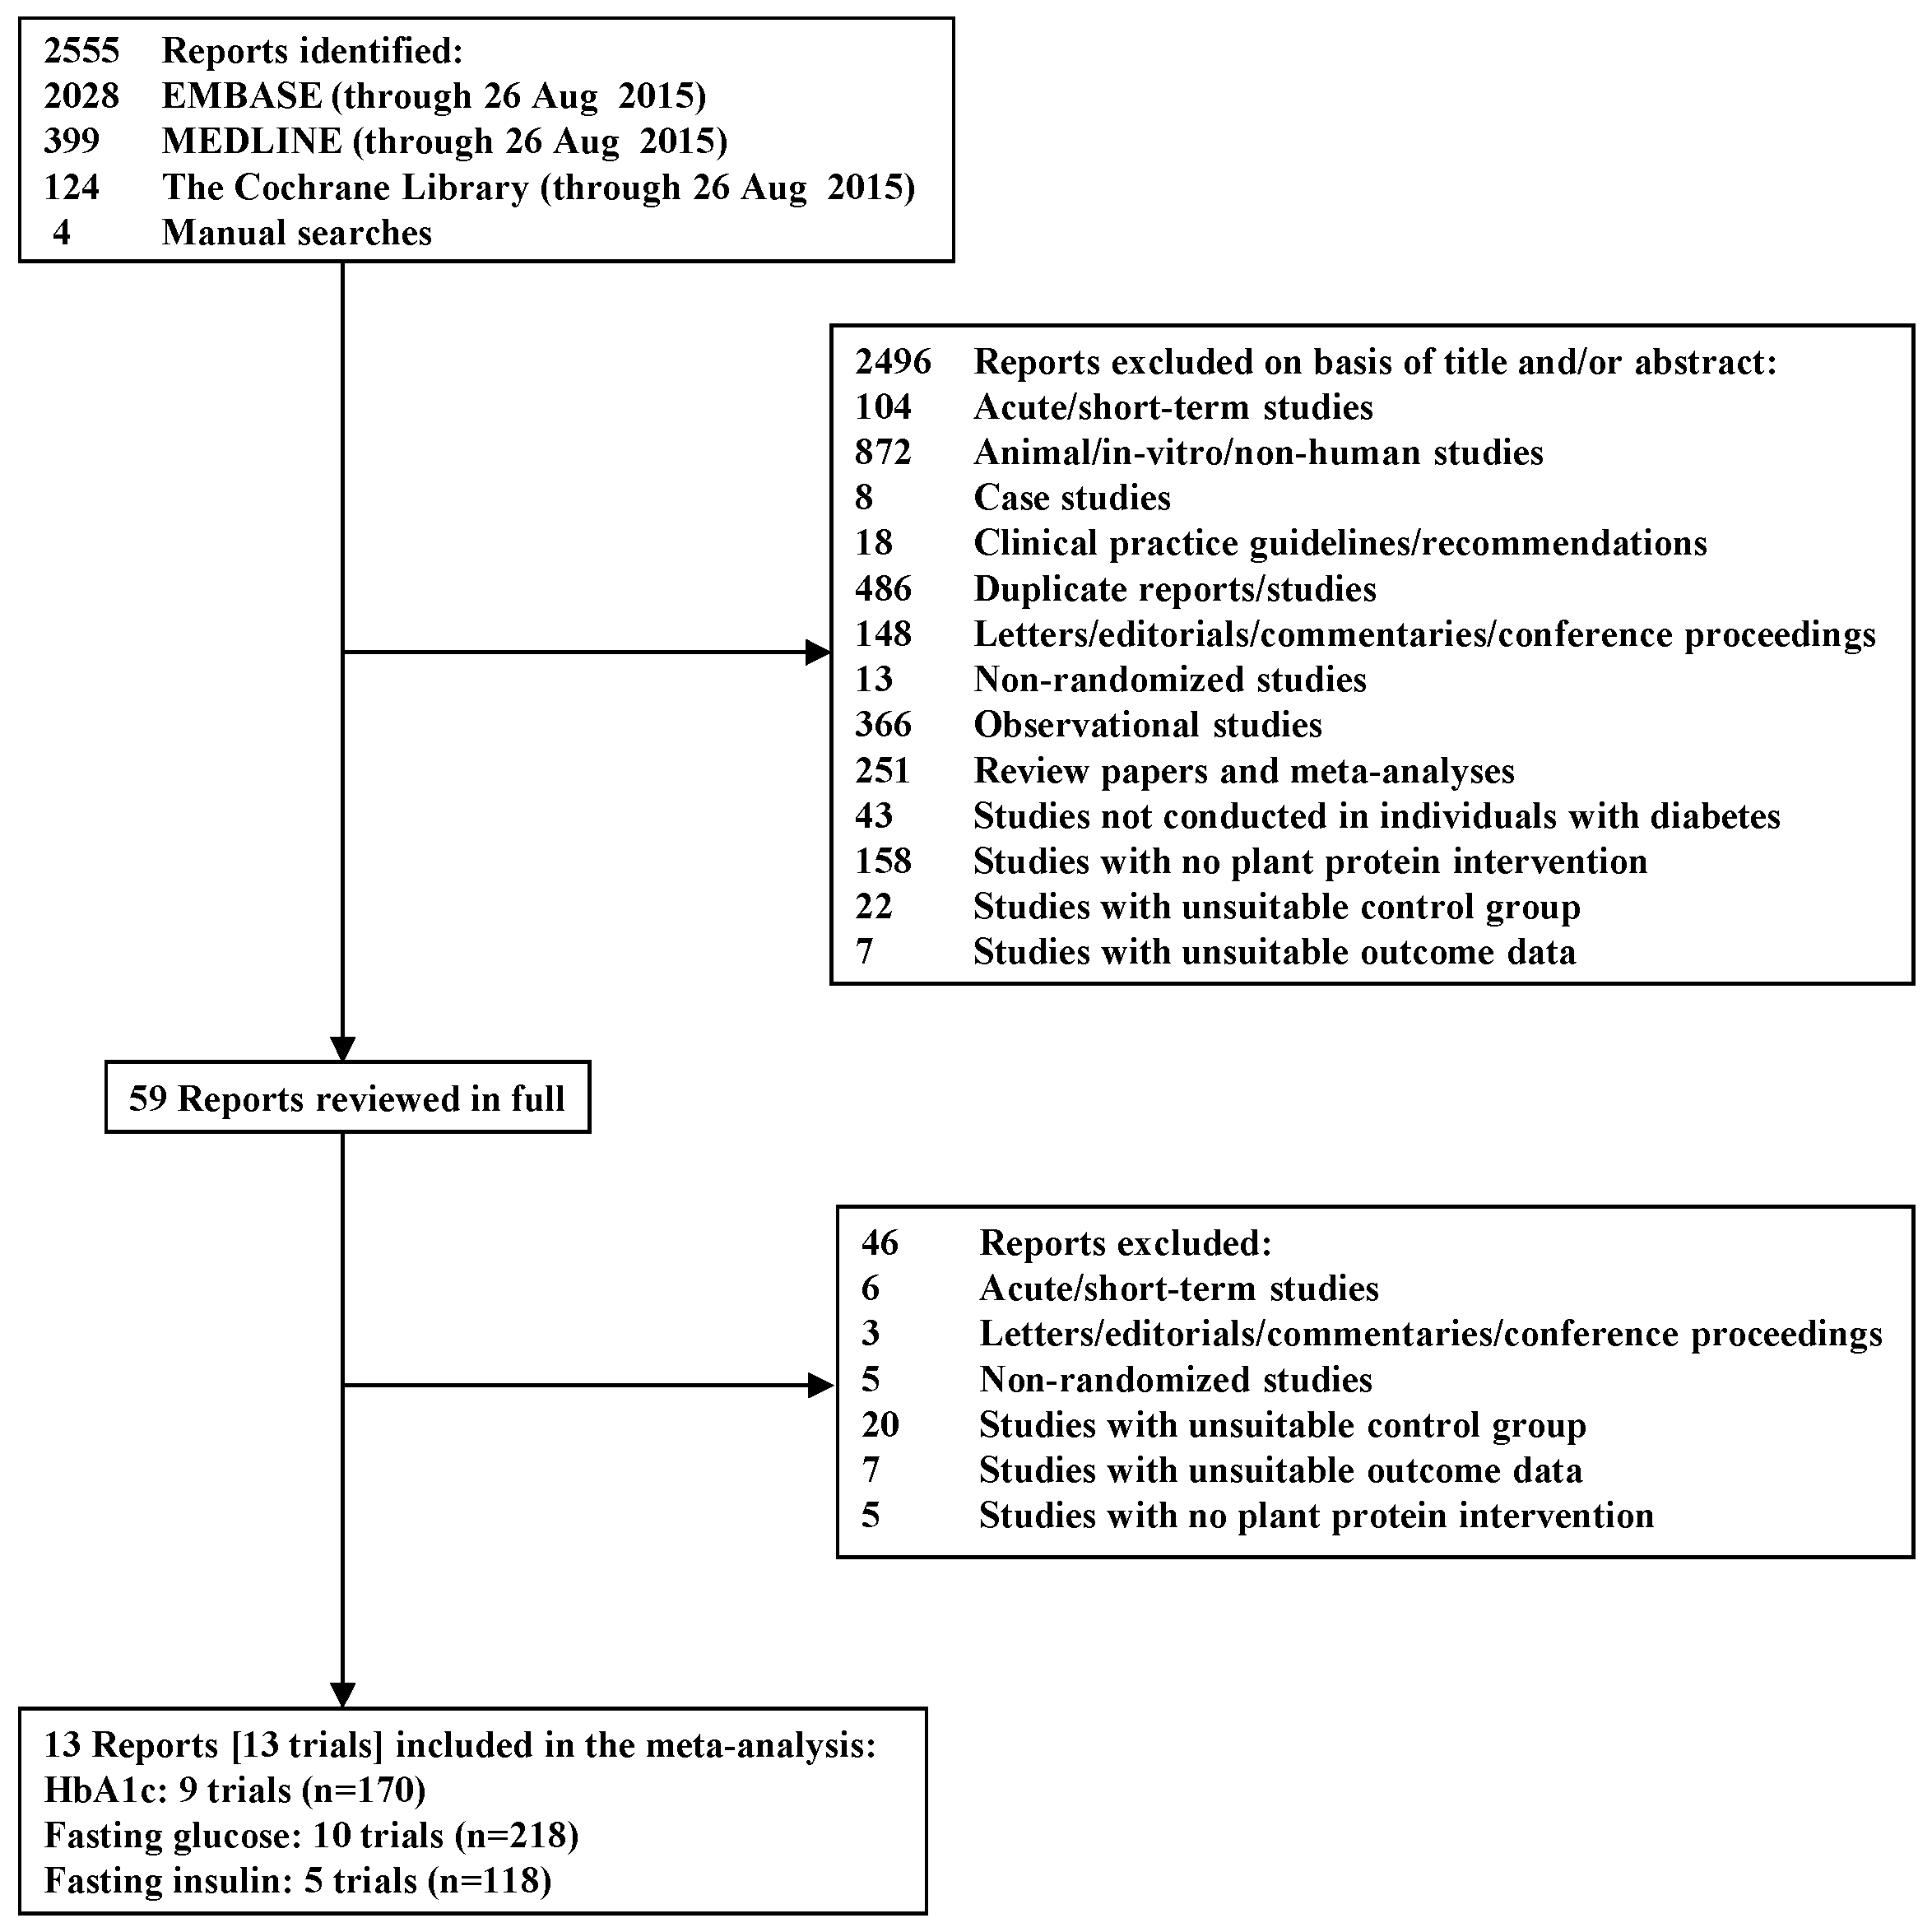
3.1. Search Results
3.2. Trial Characteristics

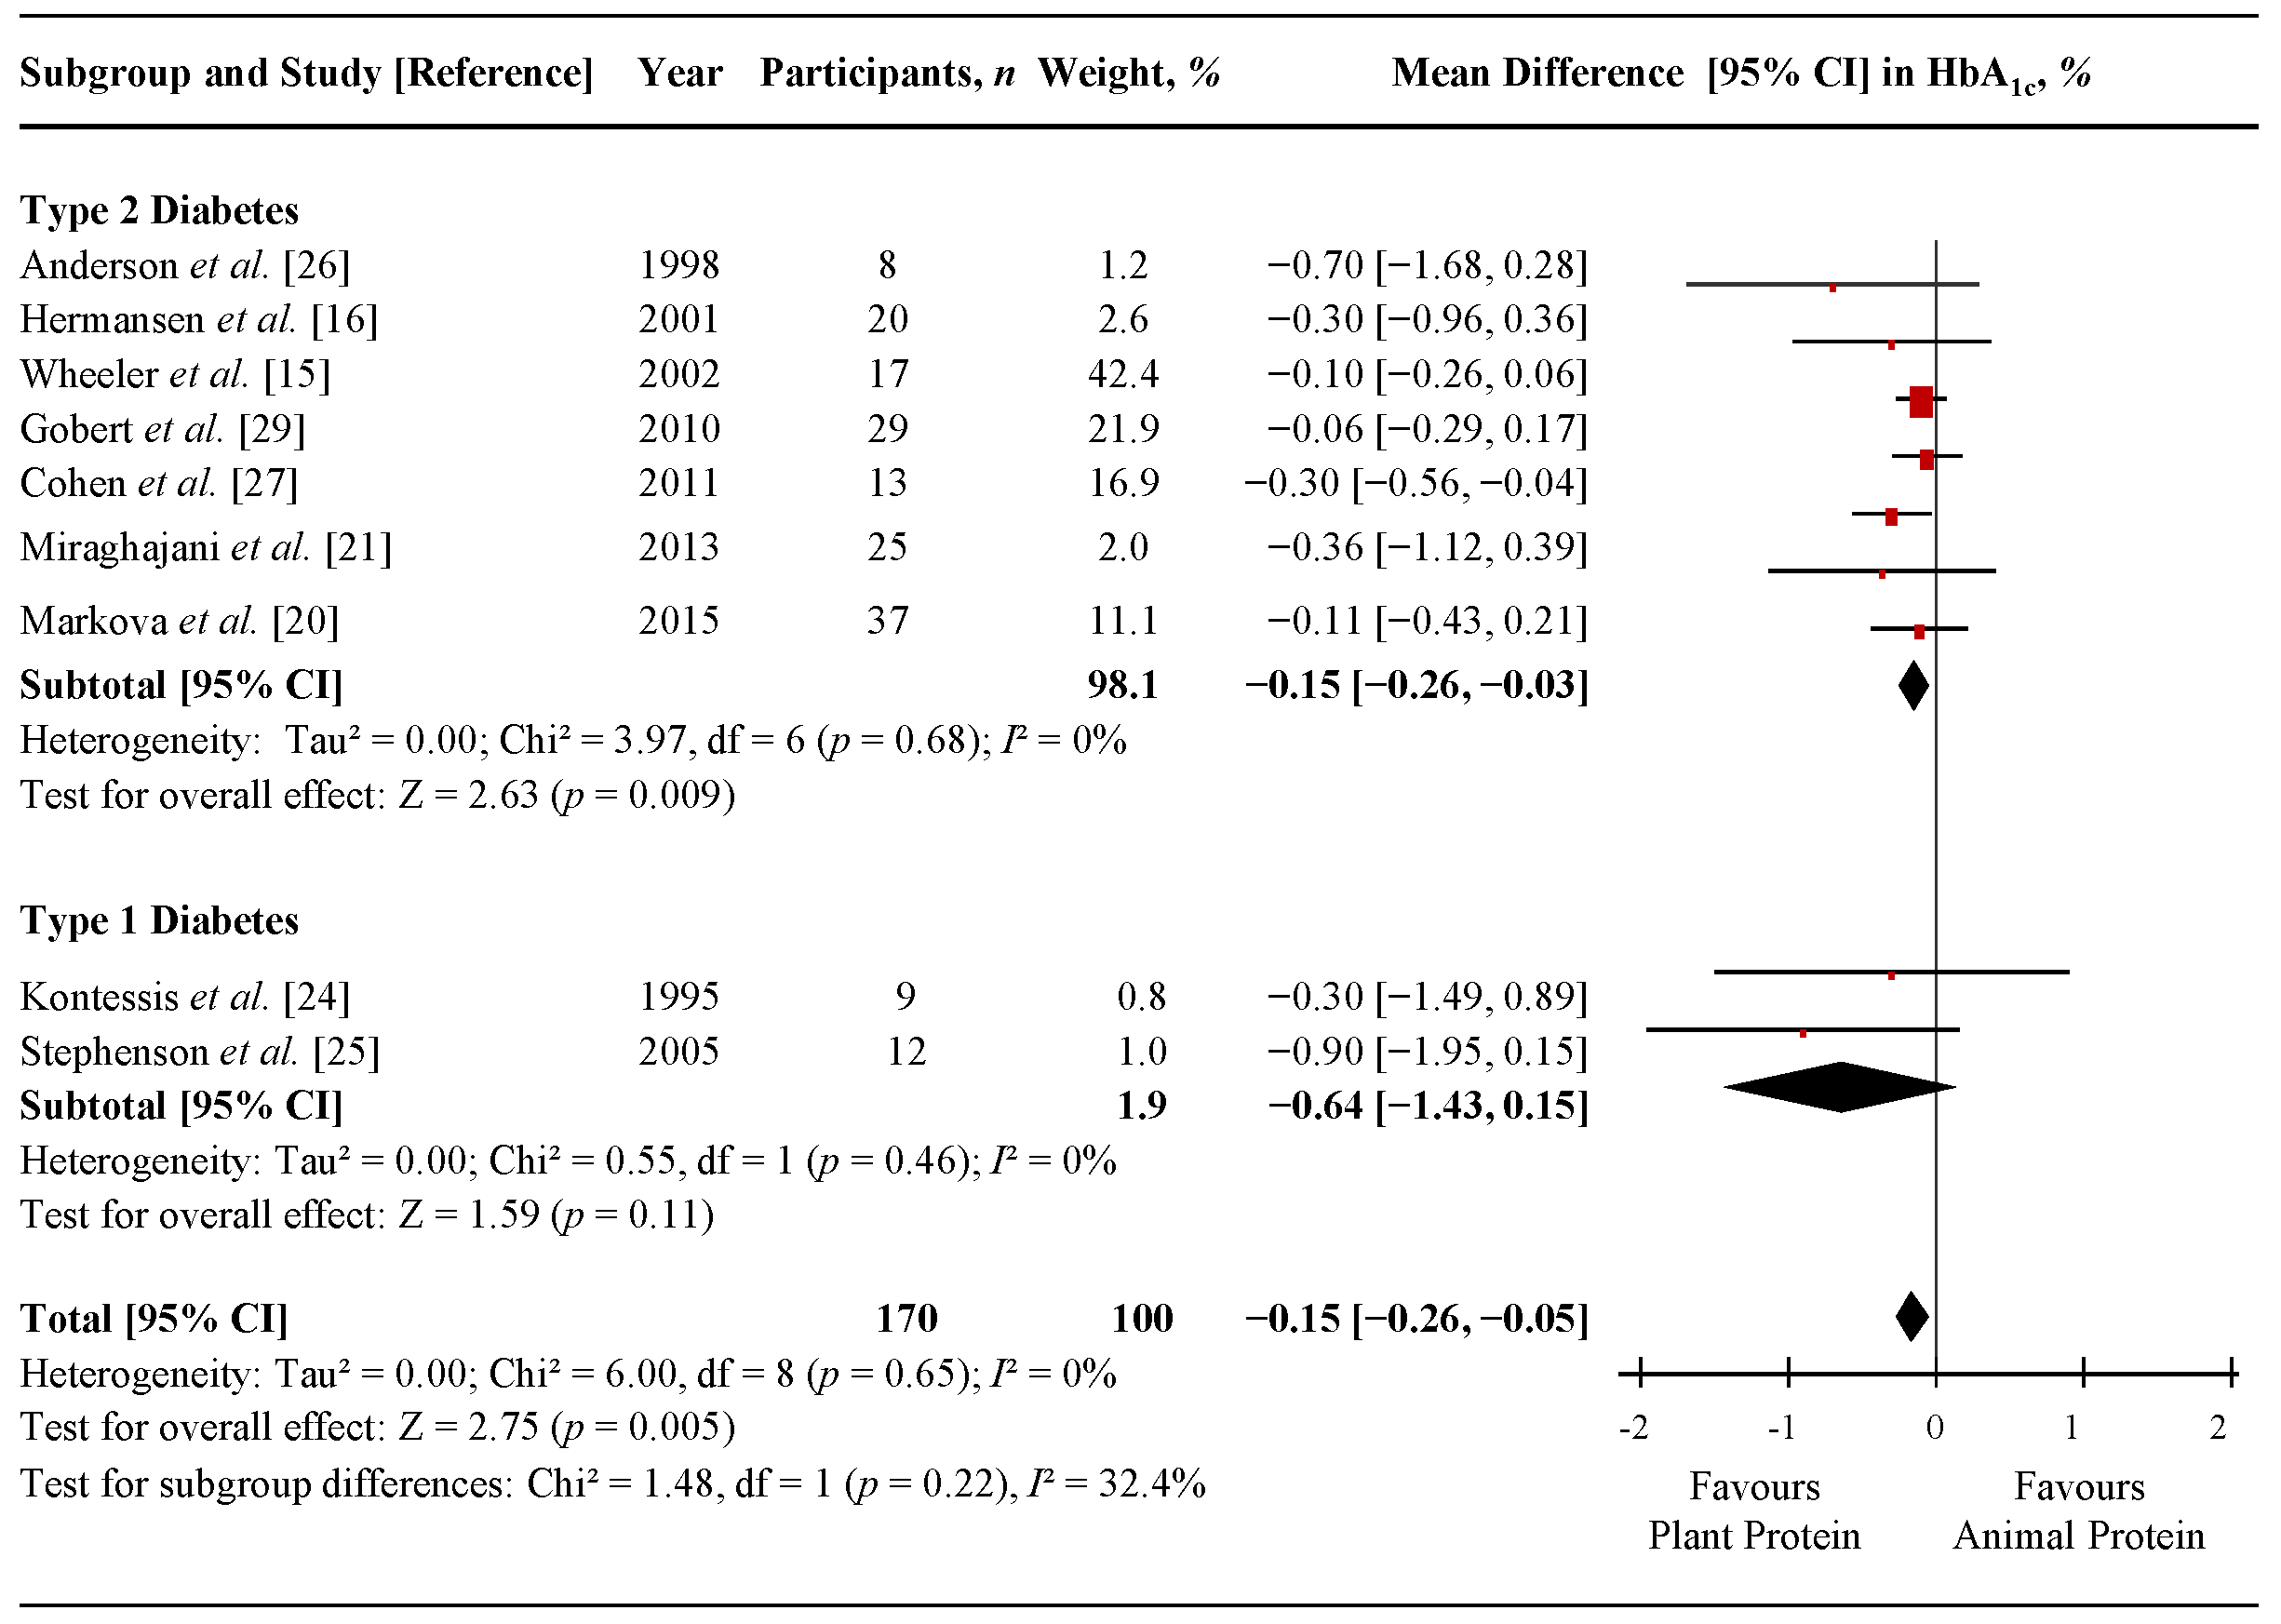
3.3. Hemoglobin A1c (HbA1c)


| Study, Year (References) | Participants | Age *, Year | Body Weight or BMI *,† | Diabetes Duration *, Year | Setting ‡ | Design | Feeding Control § | PP Type || | AP Type || | Amount of AP Replaced ¶ | Food Form ††† | Diet # | Energy Balance | Follow-up | MQS ** | Funding Sources †† |
|---|---|---|---|---|---|---|---|---|---|---|---|---|---|---|---|---|
| TYPE 2 DIABETES | ||||||||||||||||
| Anderson et al. 1998 [29] ‡‡ | 8 T2D+N, O, HT (M only) | 68 (18.4) | 111 (66.8) kg | >5 | OP, USA | C | Supp | 50% (~55.5 g/day) | Whole | Neutral | 8 wk | 8 | NA | |||
| Intervention | Soy | ~15:55:30 | ||||||||||||||
| Control | Mixed | ~15:55:30 | ||||||||||||||
| Hermansen et al. 2001 [16] §§ | 20 T2D+R (6W, 14M) | 63.6 (7.5) | 3 (2.7) | OP, DNK | C | Supp | ~33% (50 g/day) | Powder | Neutral | 6 wk | 5 | Agency-industry | ||||
| Intervention | 88.7 (11.9) kg | Soy | 25:41:29 | |||||||||||||
| Control | 88.3 (11.8) kg | Casein | 26:43:28 | |||||||||||||
| Wheeler et al. 2002 [15] |||| | 17 T2D+N (3W, 14M) | 56 (12.4) | 102.3 (21.4) kg | 7 (1–16) | OP, USA | C | Met | 60% (64 g/day) | Whole | Neutral | 6 wk | 6 | Agency-industry | |||
| Intervention | Mixed | 17:53:30 | ||||||||||||||
| Control | Mixed | 17:53:30 | ||||||||||||||
| Azadbakht et al. 2008 [13] ¶¶ | 41 T2D+N,R (23W, 18M) | 10 (3) | OP, IRN | P | Supp | 35% (~20 g/day) | Whole | Neutral | 4 y | 4 | NA | |||||
| Intervention | 61.9 (11.8) | 71 (9) kg | Soy | ~10:70:20 | ||||||||||||
| Control | 62.1 (12.1) | 72 (8) kg | Mixed | ~10:68:22 | ||||||||||||
| Azadbakht et al. 2009 [31] ## | 14 T2D+N (4W, 10M) | 62.5 (12.1) | 10 (4) | OP, IRN | C | Supp | 35% (~20 g/day) | Whole | Neutral | 7 wk | 4 | Agency | ||||
| Intervention | 70.6 (10.3) kg | Soy | ~9:70:21 | |||||||||||||
| Control | 70.7 (10.7) kg | Mixed | ~9:69:22 | |||||||||||||
| Gobert et al. 2010 [32] *** | 29 T2D (13W, 16M) | 60.1 (9.64) | 83.4 (10.9) kg | 3.4 (4.8) | OP, CAN | C | Supp | ~34% (40 g/day) | Powder | Neutral | 8 wk | 7 | Agency-industry | |||
| Intervention | Soy | ~23:45:32 | ||||||||||||||
| Control | Milk | ~23:44:33 | ||||||||||||||
| Cohen et al. 2011 [30] ‡‡‡ | 13 T2D (6W, 7M) | At least 1 year | OP, USA | P | Supp | NA (~6 g/day) | Whole | NA | Neutral | 12 wk | 7 | Agency | ||||
| Intervention | 66 (8.1) | 96.1 (21.8) kg | Almonds | |||||||||||||
| Control | 66 (8.7) | 105.1 (29.6) kg | Cheese | |||||||||||||
| Miraghajani et al. 2013 [24] §§§ | 25 T2D+N (15W, 10M) | 51 (10) | NA | OP, IRN | C | DA | ~4% (2.5 g/day) | Whole | Neutral | 4 wk | 6 | Agency | ||||
| Intervention | 76.1 (13.2) kg | Soy | 14:46:40 | |||||||||||||
| Control | 76.5 (13.6) kg | Milk | 13:50:37 | |||||||||||||
| Abd-Mishani et al. 2014 [33] ||||||| | 21 T2D (18W, 6M) | 61.7 (6) | 74.5 (7.1) kg | 3.4 (1.2) | OP, IRN | C | DA | ~18% (~13.3 g/day) | Whole | Neutral | 8 wk | 4 | Agency | |||
| Intervention | Pulses | 15:55:30 | ||||||||||||||
| Control | Red meat | 15:55:30 | ||||||||||||||
| Hosseinpour-Niazi et al. 2014 [14] ||||||| | 31 T2D+O (24W, 7M) | 58.1 (33.4) | NA | OP, IRN | C | DA | ~17% (~13.3 g/day) | Whole | Neutral | 8 wk | 6 | Agency | ||||
| Intervention | 27.7 (3.34) kg/m2 | Pulses | 14:54:33 | |||||||||||||
| Control | 27.8 (3.34) kg/m2 | Red meat | 15:52:34 | |||||||||||||
| Markova et al. 2015 [23] ¶¶¶ | 37 T2D (13W, 24M) | NA | OP, DEU | P | Supp | ~32.5% (NA) | Both | Neutral | 6 wk | NA | NA | |||||
| Intervention | 63.7 (6.54) | 86 (13.9) kg | Pulses | 30:40:30 | ||||||||||||
| Control | 65 (5.9) | 92.6 (11.9) kg | Mixed | 30:40:30 | ||||||||||||
| TYPE 1 DIABETES | ||||||||||||||||
| Kontessis et al. 1995 [27] ### | 9 T1D (7W, 2M) | 32 (20–48) **** | 23.8 (20.6–27.8) kg/m2 **** | Onset before the age of 30 | OP, GRC | C | NA | 70% (~49 g/day) | Whole | Neutral | 4 wk | 7 | NA | |||
| Intervention | Mixed | ~17:49:34 | ||||||||||||||
| Control | Mixed | ~19:41:37 | ||||||||||||||
| Stephenson et al, 2005 [28] | 12 T1D+GHF (6W, 6M) | 29.9 (8) | 79.0 (5.9) kg | 15.1 (8) | OP, USA | C | Supp | ~46%–56% (45–55 g/day) | Whole | Neutral | 8 wk | 5 | Agency-industry | |||
| Intervention | Soy †††† | 22:53:27 | ||||||||||||||
| Control | Mixed | 16:49:36 |
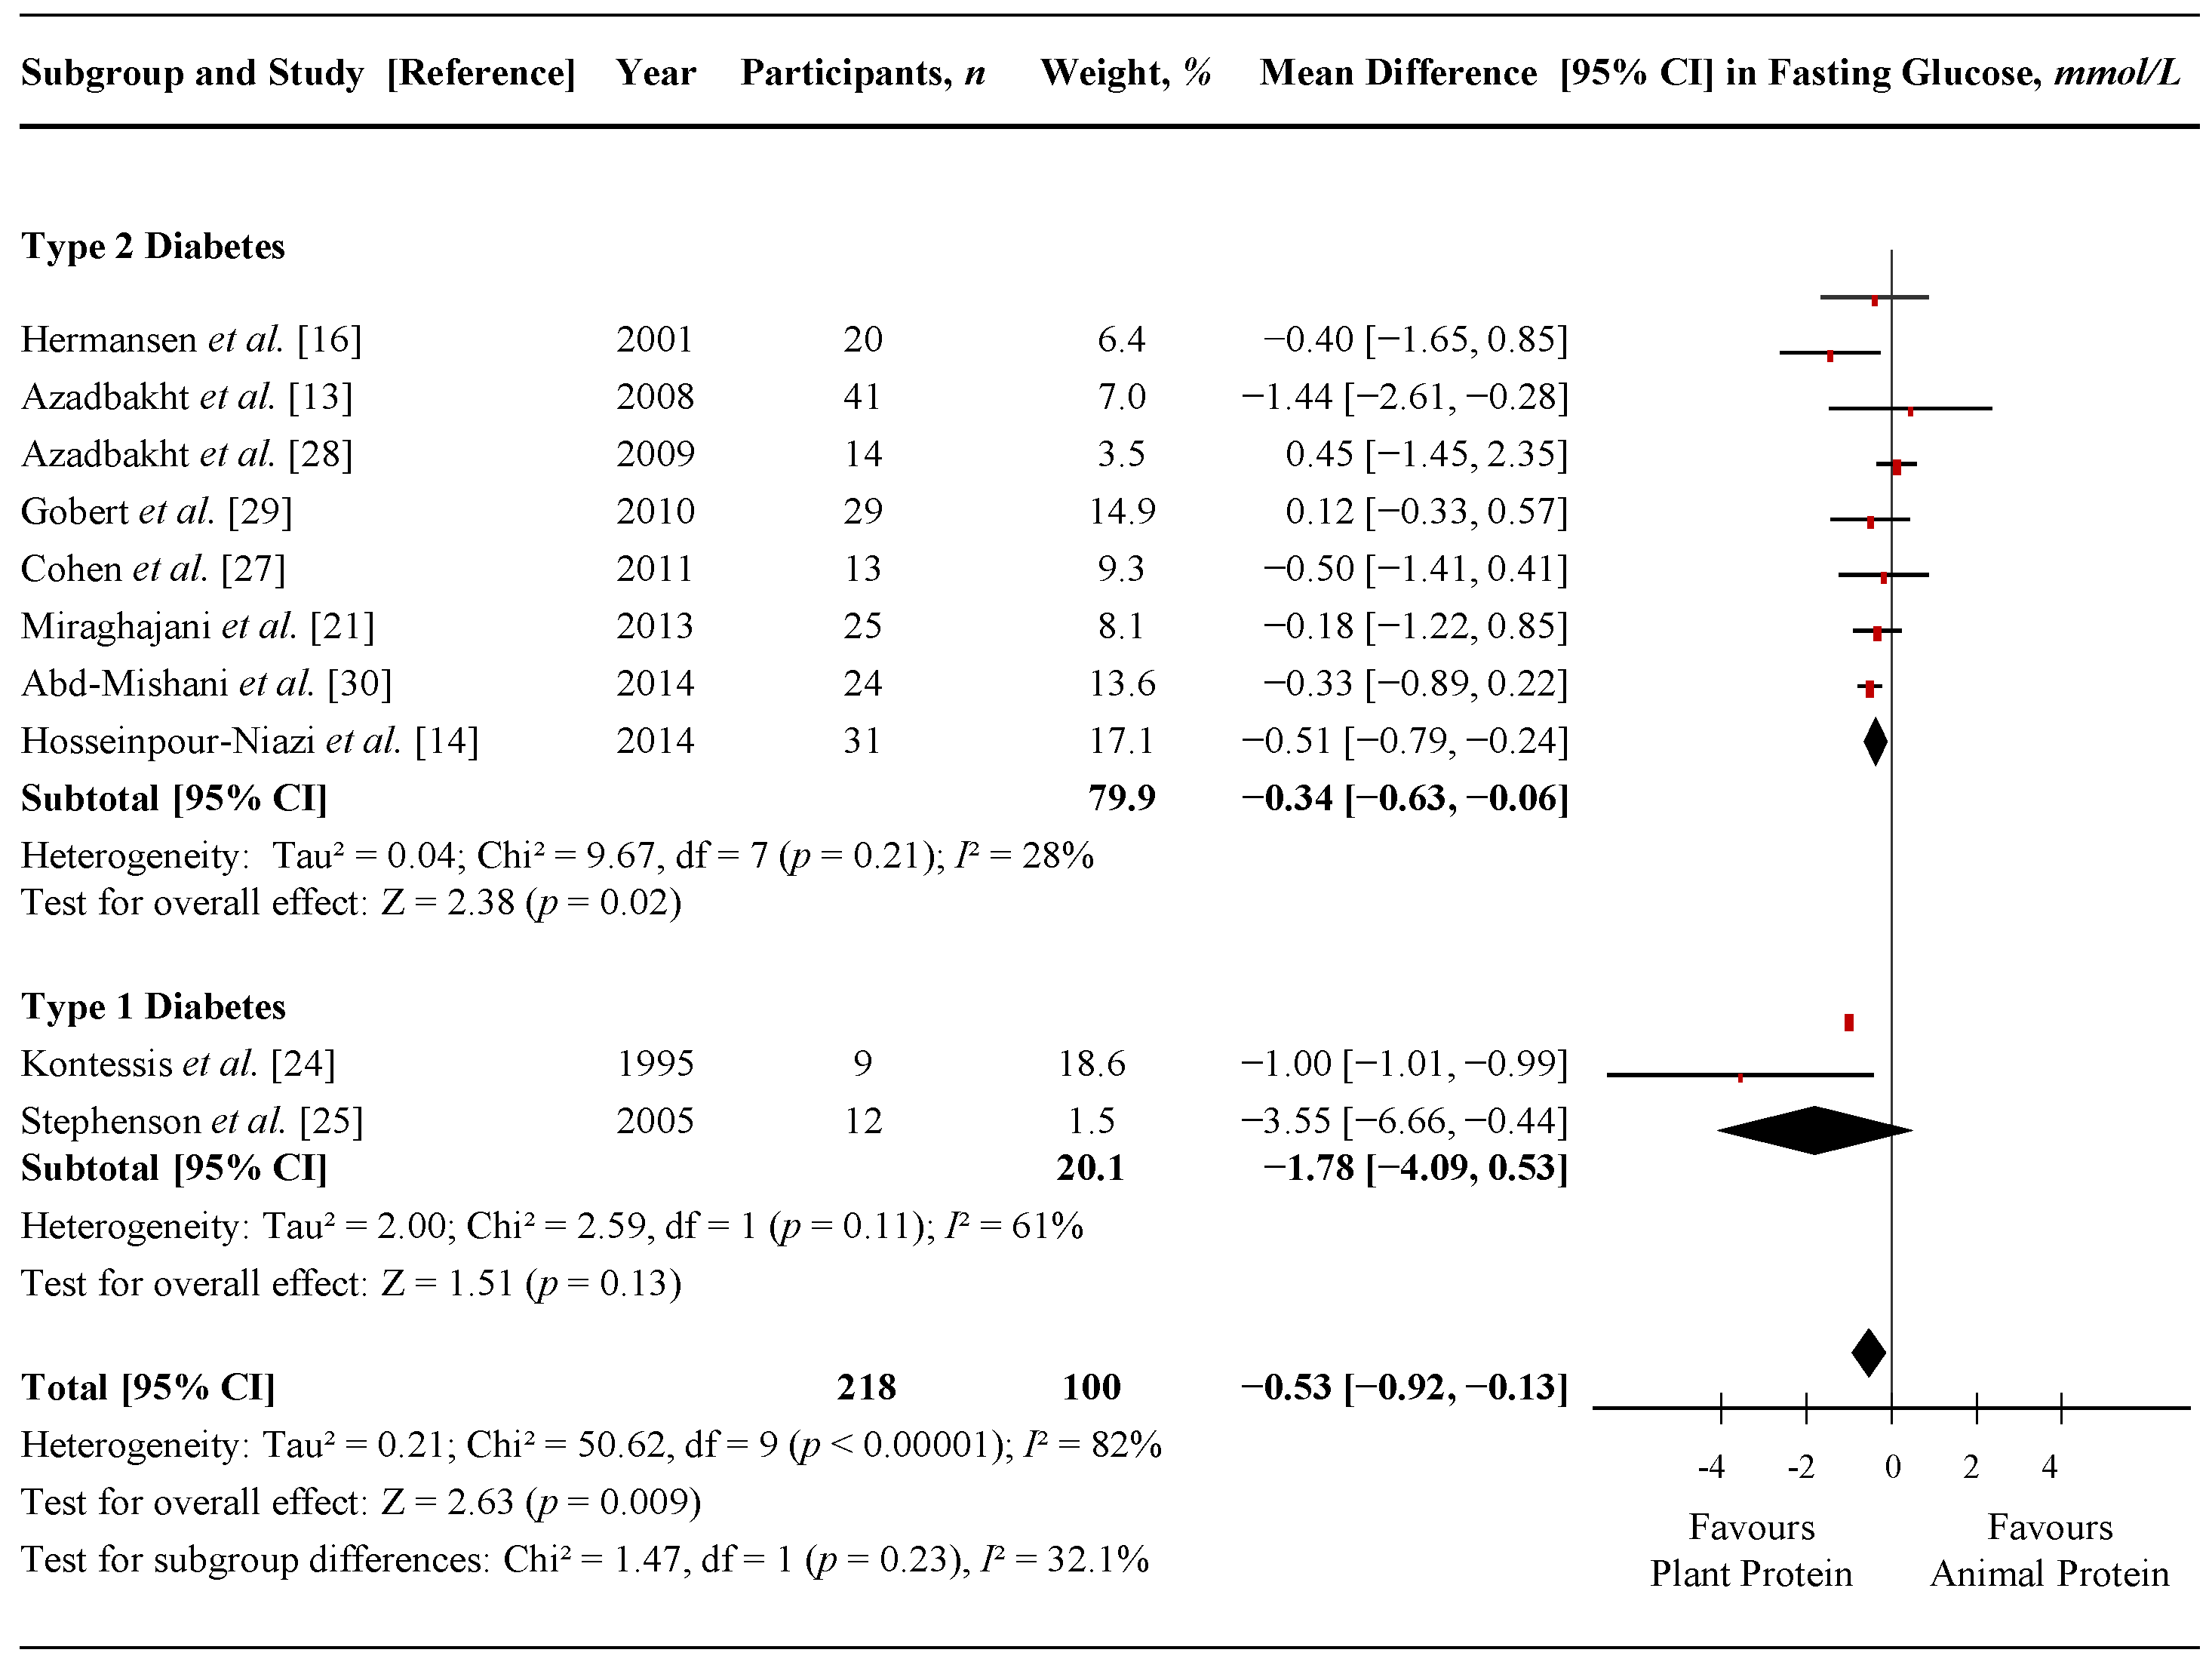
3.4. Fasting Glucose

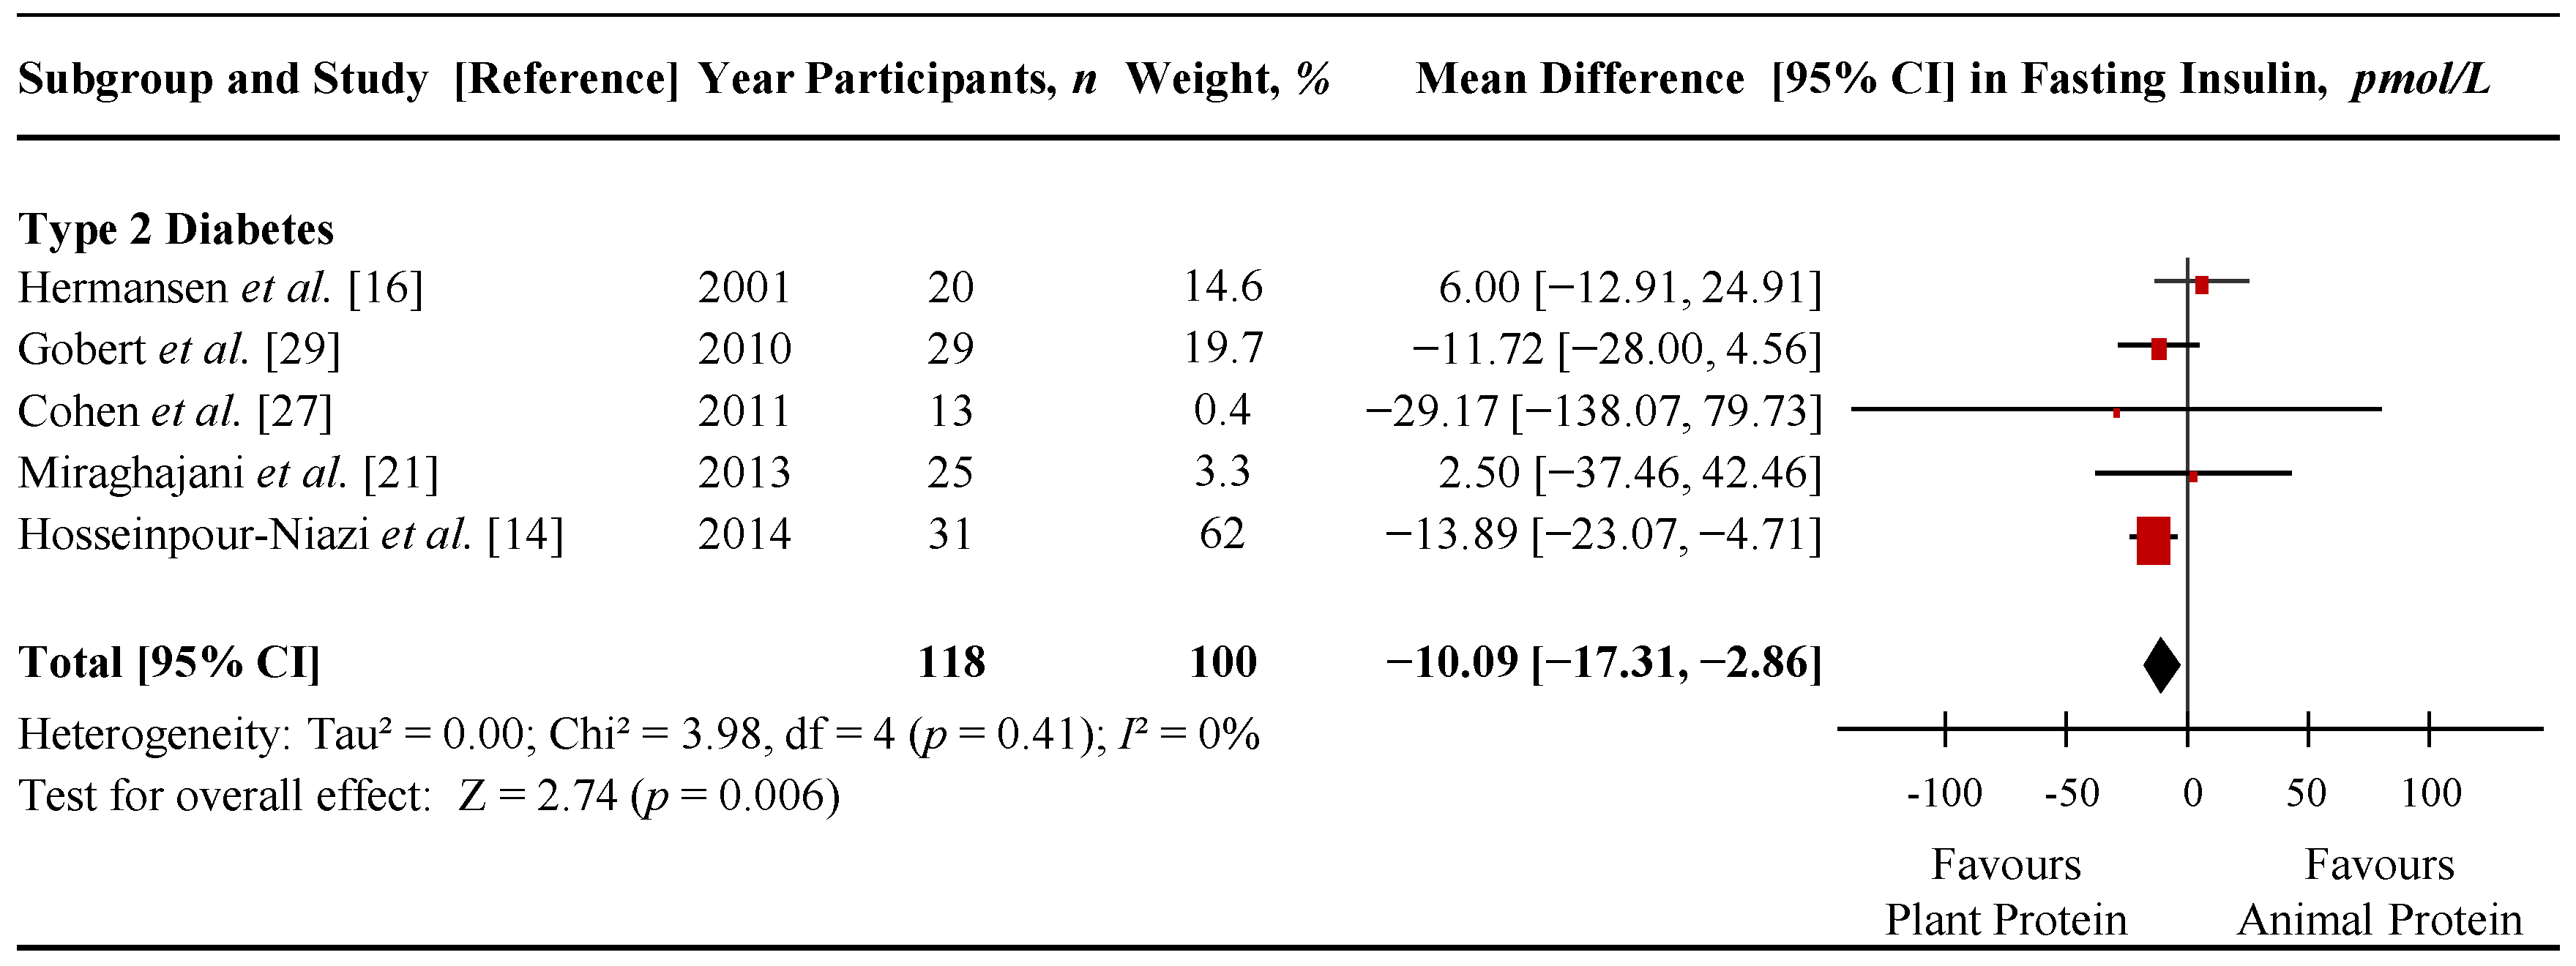
3.5. Fasting Insulin

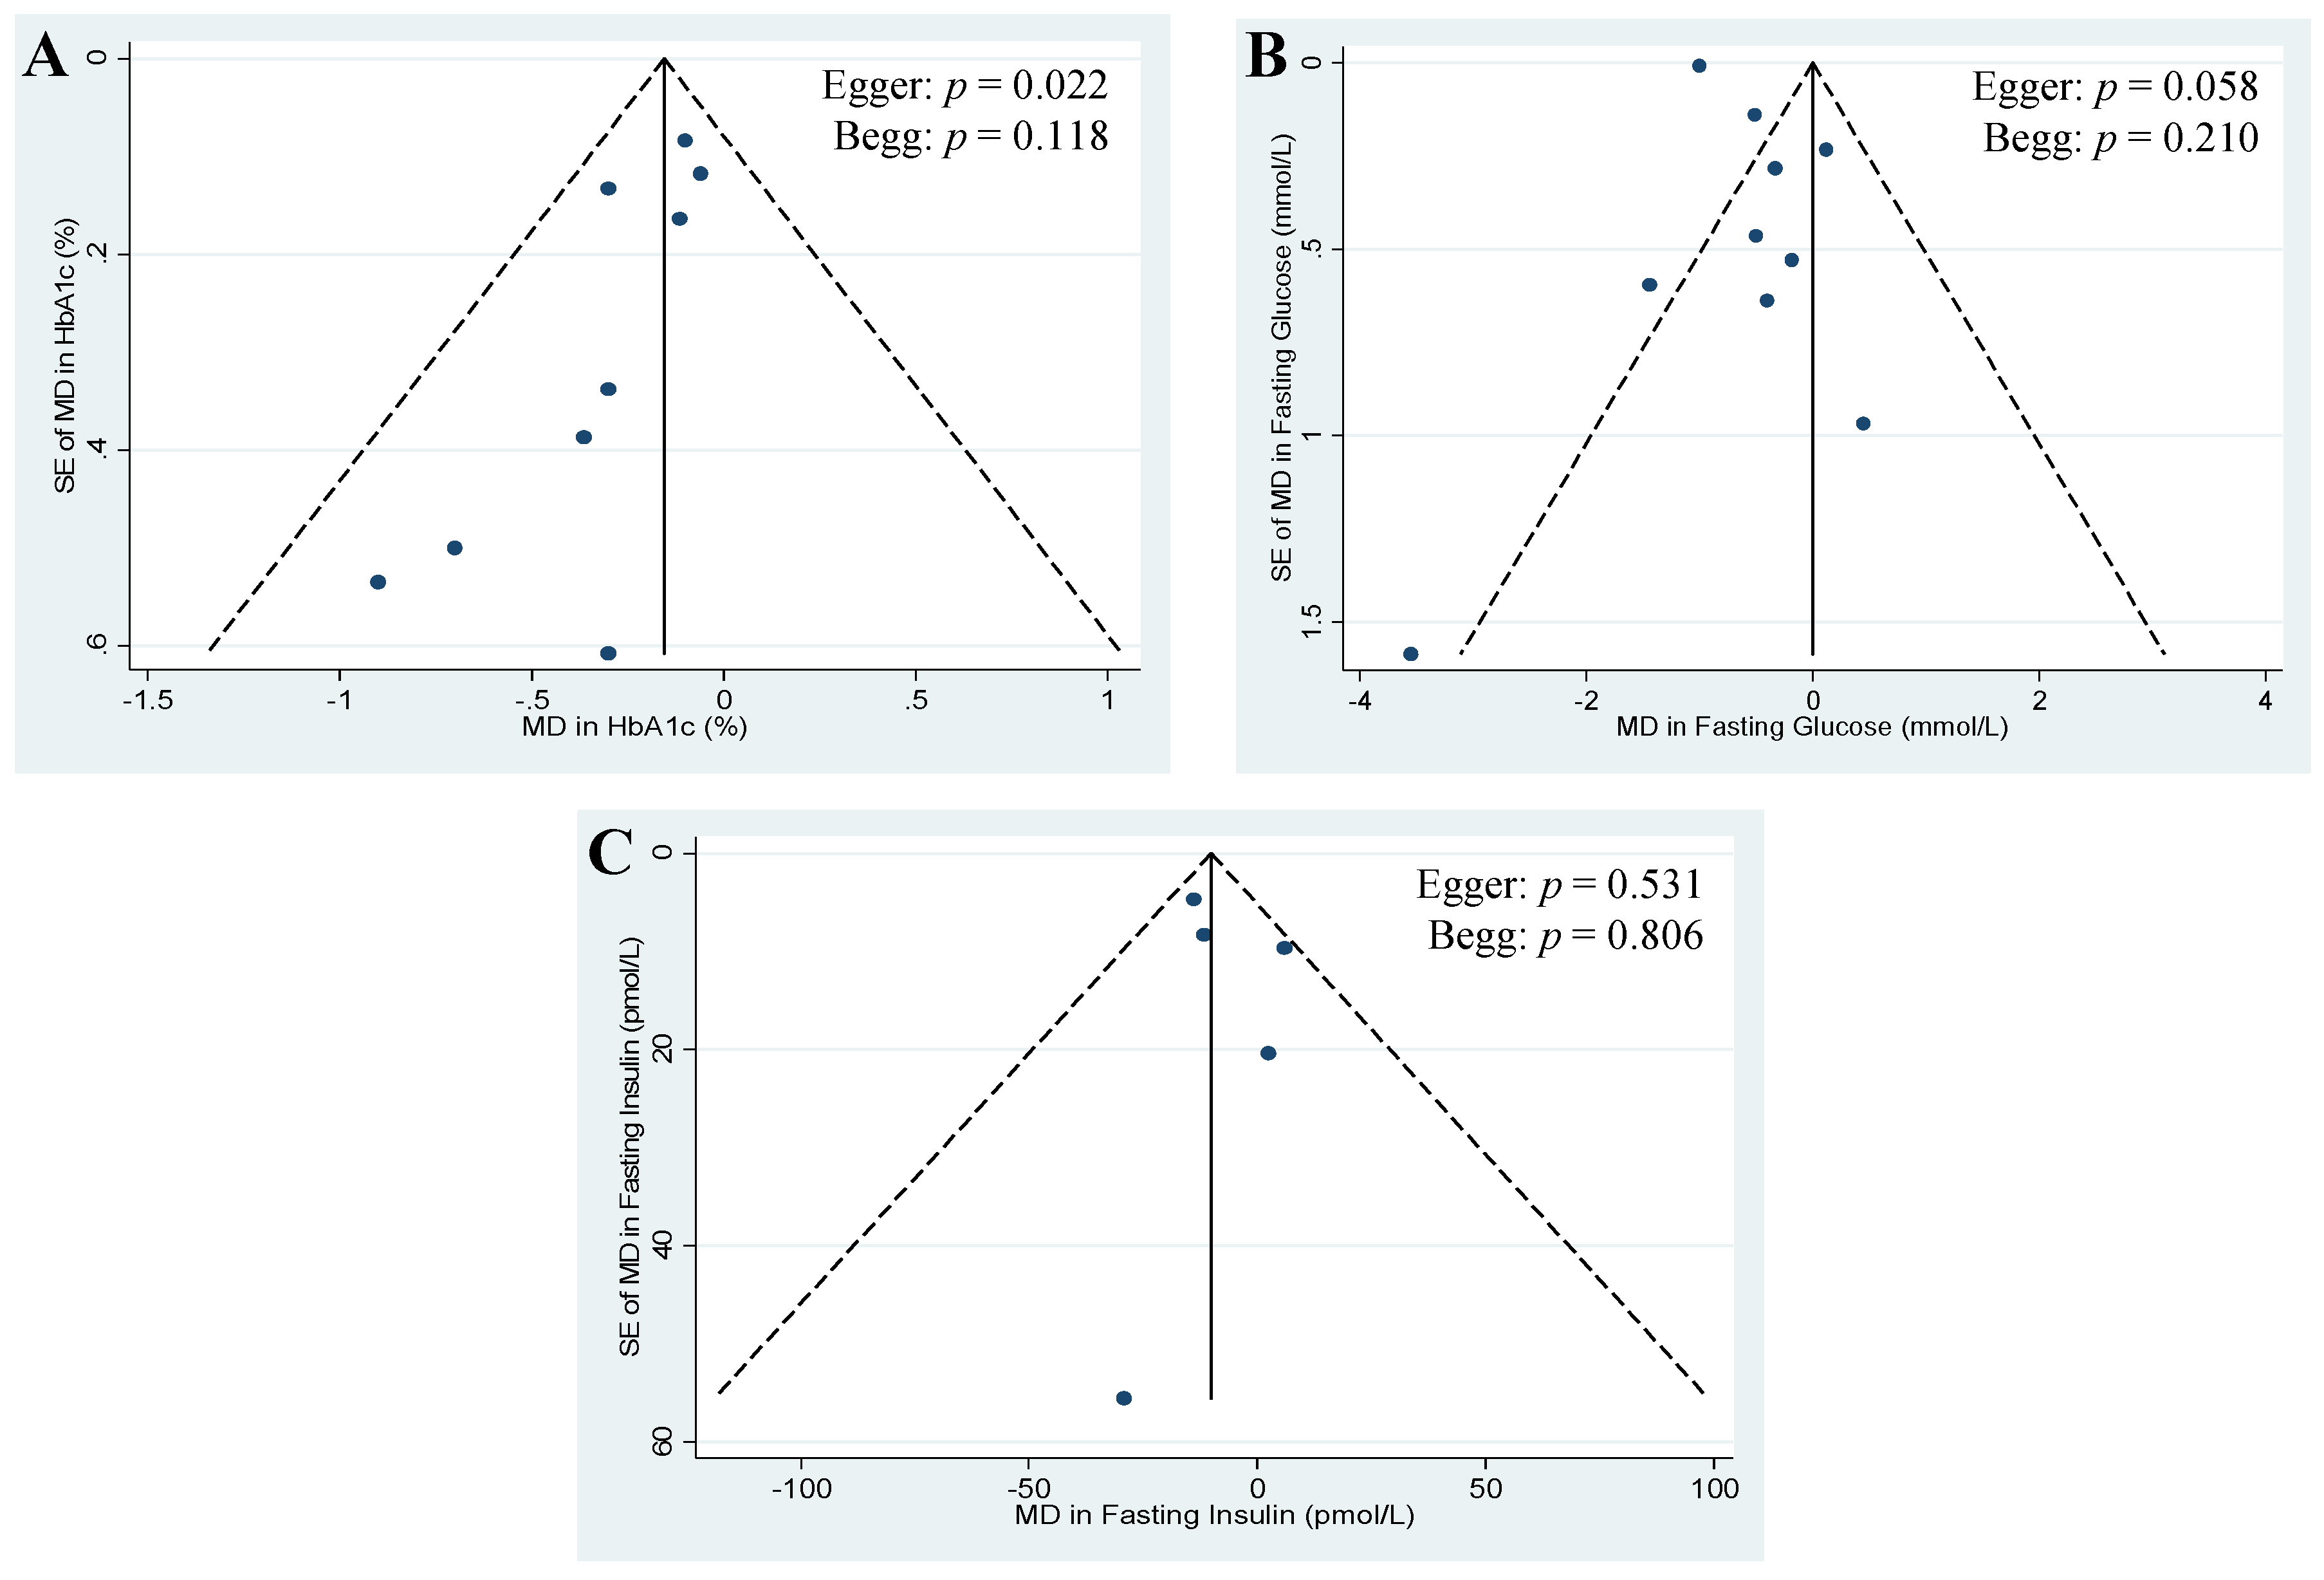
3.6. Publication Bias

4. Discussion
4.1. Findings in Relation to Other Studies
4.2. Possible Mechanisms of Action
4.3. A-Priori and Post-Hoc Subgroup Analyses
4.4. Limitations
4.5. Implications
5. Conclusions
Supplementary Materials
Acknowledgments
Author Contributions
Conflicts of Interest
References
- Evert, A.B.; Boucher, J.L.; Cypress, M.; Dunbar, S.A.; Franz, M.J.; Mayer-Davis, E.J.; Neumiller, J.J.; Nwankwo, R.; Verdi, C.L.; Urbanski, P.; et al. Nutrition therapy recommendations for the management of adults with diabetes. Diabetes Care 2014, 37, S120–S143. [Google Scholar] [CrossRef] [PubMed]
- Mann, J.I.; de Leeuw, I.; Hermansen, K.; Karamanos, B.; Karlstrom, B.; Katsilambros, N.; Riccardi, G.; Rivellese, A.A.; Rizkalla, S.; Slama, G.; et al. Evidence-based nutritional approaches to the treatment and prevention of diabetes mellitus. NMCD 2004, 14, 373–394. [Google Scholar] [CrossRef]
- Dworatzek, P.D.; Arcudi, K.; Gougeon, R.; Husein, N.; Sievenpiper, J.L.; Williams, S.L. Nutrition therapy. Can. J. Diabetes 2013, 37, S45–S55. [Google Scholar] [CrossRef] [PubMed]
- Tonstad, S.; Butler, T.; Yan, R.; Fraser, G.E. Type of vegetarian diet, body weight, and prevalence of type 2 diabetes. Diabetes Care 2009, 32, 791–796. [Google Scholar] [CrossRef] [PubMed]
- Tonstad, S.; Stewart, K.; Oda, K.; Batech, M.; Herring, R.P.; Fraser, G.E. Vegetarian diets and incidence of diabetes in the Adventist Health Study-2. NMCD 2013, 23, 292–299. [Google Scholar] [CrossRef] [PubMed]
- Orlich, M.J.; Singh, P.N.; Sabate, J.; Jaceldo-Siegl, K.; Fan, J.; Knutsen, S.; Beeson, W.L.; Fraser, G.E. Vegetarian dietary patterns and mortality in Adventist Health Study 2. JAMA Intern. Med. 2013, 173, 1230–1238. [Google Scholar] [CrossRef] [PubMed]
- Yokoyama, Y.; Barnard, N.D.; Levin, S.M.; Watanabe, M. Vegetarian diets and glycemic control in diabetes: A systematic review and meta-analysis. Cardiovasc. Diagn. Ther. 2014, 4, 373–382. [Google Scholar] [PubMed]
- Malik, V.S.L.; Tobias, D.K.; Pan, A.; Hu, F.B. Dietary protein intake and risk of type 2 diabetes in U.S. men and women. Diabetes 2015, 64, A424. [Google Scholar]
- Aune, D.; Ursin, G.; Veierod, M.B. Meat consumption and the risk of type 2 diabetes: A systematic review and meta-analysis of cohort studies. Diabetologia 2009, 52, 2277–2287. [Google Scholar] [CrossRef] [PubMed]
- Pan, A.; Sun, Q.; Bernstein, A.M.; Schulze, M.B.; Manson, J.E.; Willett, W.C.; Hu, F.B. Red meat consumption and risk of type 2 diabetes: 3 cohorts of US adults and an updated meta-analysis. Am. J. Clin. Nutr. 2011, 94, 1088–1096. [Google Scholar] [CrossRef] [PubMed]
- Pan, A.; Sun, Q.; Bernstein, A.M.; Manson, J.E.; Willett, W.C.; Hu, F.B. Changes in red meat consumption and subsequent risk of type 2 diabetes mellitus: Three cohorts of US men and women. JAMA Intern. Med. 2013, 173, 1328–1335. [Google Scholar] [CrossRef] [PubMed]
- Barnard, N.L.S.; Trapp, C. Meat Consumption as a Risk Factor for Type 2 Diabetes. Nutrients 2014, 6, 897–910. [Google Scholar] [CrossRef] [PubMed]
- Azadbakht, L.; Atabak, S.; Esmaillzadeh, A. Soy protein intake, cardiorenal indices, and C-reactive protein in type 2 diabetes with nephropathy: A longitudinal randomized clinical trial. Diabetes Care 2008, 31, 648–654. [Google Scholar] [CrossRef] [PubMed]
- Hosseinpour-Niazi, S.; Mirmiran, P.; Hedayati, M.; Azizi, F. Substitution of red meat with legumes in the therapeutic lifestyle change diet based on dietary advice improves cardiometabolic risk factors in overweight type 2 diabetes patients: A cross-over randomized clinical trial. Eur. J. Clin. Nutr. 2014. [Google Scholar] [CrossRef] [PubMed]
- Wheeler, M.L.; Fineberg, S.E.; Fineberg, N.S.; Gibson, R.G.; Hackward, L.L. Animal versus plant protein meals in individuals with type 2 diabetes and microalbuminuria: Effects on renal, glycemic, and lipid parameters. Diabetes Care 2002, 25, 1277–1282. [Google Scholar] [CrossRef] [PubMed]
- Hermansen, K.; Sondergaard, M.; Hoie, L.; Carstensen, M.; Brock, B. Beneficial effects of a soy-based dietary supplement on lipid levels and cardiovascular risk markers in type 2 diabetic subjects. Diabetes Care 2001, 24, 228–233. [Google Scholar] [CrossRef] [PubMed]
- Higgins, J.P.T.; Green, S. Cochrane Handbook for Systematic Reviews of Interventions Version 5.1.0, (updated March 2011); The Cochrane Collaboration: London, UK, 2011. [Google Scholar]
- Moher, D.; Liberati, A.; Tetzlaff, J.; Altman, D.G.; Group, P. Preferred reporting items for systematic reviews and meta-analyses: The PRISMA statement. PLoS Med. 2009, 6, e1000097. [Google Scholar] [CrossRef] [PubMed]
- Ovid® MEDLINE(R). Available online: http://gateway.tx.ovid.com.myaccess.library.utoronto.ca/sp-3.17.0a/ovidweb.cgi?&S=EIMJFPILKKDDALJKNCJKNGJCKIJNAA00&New+Database=Single%7c1 (accessed on 20 November 2015).
- Ovid® Embase Classic+Embase. Available online: http://gateway.tx.ovid.com.myaccess.library.utoronto.ca/sp-3.17.0a/ovidweb.cgi (accessed on 20 November 2015).
- Ovid® EBM Reviews-Cochrane Central Register of Controlled Trials. Available online: http://ovidsp.tx.ovid.com/sp-3.17.0a/ovidweb.cgi (accessed on 20 November 2015).
- Heyland, D.K.; Novak, F.; Drover, J.W.; Jain, M.; Su, X.; Suchner, U. Should immunonutrition become routine in critically ill patients? A systematic review of the evidence. JAMA 2001, 286, 944–953. [Google Scholar] [CrossRef] [PubMed]
- Markova, M.H.S.; Sucher, S.; Pivovarova, O.; Pfeiffer, A. Metabolic and molecular effects of a high-protein diet in subjects with type 2 diabetes. Diabetologia 2015, 58, S335. [Google Scholar]
- Miraghajani, M.S.; Esmaillzadeh, A.; Najafabadi, M.M.; Mirlohi, M.; Azadbakht, L. Soy milk consumption, inflammation, coagulation, and oxidative stress among type 2 diabetic patients with nephropathy. Diabetes Care 2012, 35, 1981–1985. [Google Scholar] [CrossRef] [PubMed]
- Elbourne, D.R.; Altman, D.G.; Higgins, J.P.; Curtin, F.; Worthington, H.V.; Vail, A. Meta-analyses involving cross-over trials: Methodological issues. Int. J. Epidemiol. 2002, 31, 140–149. [Google Scholar] [CrossRef] [PubMed]
- Teixeira, S.R.; Tappenden, K.A.; Carson, L.; Jones, R.; Prabhudesai, M.; Marshall, W.P.; Erdman, J.W., Jr. Isolated soy protein consumption reduces urinary albumin excretion and improves the serum lipid profile in men with type 2 diabetes mellitus and nephropathy. J. Nutr. 2004, 134, 1874–1880. [Google Scholar] [PubMed]
- Kontessis, P.A.; Bossinakou, I.; Sarika, L.; Iliopoulou, E.; Papantoniou, A.; Trevisan, R.; Roussi, D.; Stipsanelli, K.; Grigorakis, S.; Souvatzoglou, A. Renal, metabolic, and hormonal responses to proteins of different origin in normotensive, nonproteinuric type I diabetic patients. Diabetes Care 1995, 18, 1233. [Google Scholar] [CrossRef] [PubMed]
- Stephenson, T.J.; Setchell, K.D.; Kendall, C.W.; Jenkins, D.J.; Anderson, J.W.; Fanti, P. Effect of soy protein-rich diet on renal function in young adults with insulin-dependent diabetes mellitus. Clin. Nephrol. 2005, 64, 1–11. [Google Scholar] [CrossRef] [PubMed]
- Anderson, J.W.; Blake, J.E.; Turner, J.; Smith, B.M. Effects of soy protein on renal function and proteinuria in patients with type 2 diabetes. Amer. J. Clin. Nutr. 1998, 68, 1347S–1353S. [Google Scholar] [PubMed]
- Cohen, A.E.; Johnston, C.S. Almond ingestion at mealtime reduces postprandial glycemia and chronic ingestion reduces hemoglobin A(1c) in individuals with well-controlled type 2 diabetes mellitus. Metabolism 2011, 60, 1312–1317. [Google Scholar] [CrossRef] [PubMed]
- Azadbakht, L.; Esmaillzadeh, A. Soy-protein consumption and kidney-related biomarkers among type 2 diabetics: A crossover, randomized clinical trial. J. Ren. Nutr. 2009, 19, 479–486. [Google Scholar] [CrossRef] [PubMed]
- Gobert, C.P.; Capes, S.E.; Darlington, G.A.; Lampe, J.W.; Duncan, A.M. Soya protein does not affect glycaemic control in adults with type 2 diabetes. Br. J. Nutr. 2010, 103, 412–421. [Google Scholar] [CrossRef] [PubMed]
- Abd-Mishani, M.; Hosseinpour-Niazi, S.; Delshad, H.; Bahadori-Monfared, A.; Mirmiran, P.; Azizi, F. Effect of modified diet on lipid profiles in type 2 diabetic patients. Iran. J. Endocrinol. Metab. 2014, 16, 103–110. [Google Scholar]
- Yang, B.; Chen, Y.; Xu, T.; Yu, Y.; Huang, T.; Hu, X.; Li, D. Systematic review and meta-analysis of soy products consumption in patients with type 2 diabetes mellitus. Asia Pac. J. Clin. Nutr. 2011, 20, 593–602. [Google Scholar] [PubMed]
- Liu, Z.M.; Chen, Y.M.; Ho, S.C. Effects of soy intake on glycemic control: A meta-analysis of randomized controlled trials. Am. J. Clin. Nutr. 2011, 93, 1092–1101. [Google Scholar] [CrossRef] [PubMed]
- Viguiliouk, E.; Kendall, C.W.; Blanco Mejia, S.; Cozma, A.I.; Ha, V.; Mirrahimi, A.; Jayalath, V.H.; Augustin, L.S.; Chiavaroli, L.; Leiter, L.A.; et al. Effect of tree nuts on glycemic control in diabetes: A systematic review and meta-analysis of randomized controlled dietary trials. PLoS ONE 2014, 9, e103376. [Google Scholar] [CrossRef] [PubMed]
- Blanco Mejia, S.; Kendall, C.W.; Viguiliouk, E.; Augustin, L.S.; Ha, V.; Cozma, A.I.; Mirrahimi, A.; Maroleanu, A.; Chiavaroli, L.; Leiter, L.A.; et al. Effect of tree nuts on metabolic syndrome criteria: A systematic review and meta-analysis of randomised controlled trials. BMJ Open 2014, 4, e004660. [Google Scholar] [CrossRef] [PubMed]
- Sievenpiper, J.L.; Esfahani, A.; Wong, J.M.; Carleton, A.J.; Jiang, H.Y.; Bazinet, R.P.; Vidgen, E.; Jenkins, D.J. Effect of non-oil-seed pulses on glycaemic control: A systematic review and meta-analysis of randomised controlled experimental trials in people with and without diabetes. Diabetologia 2009, 52, 1479–1495. [Google Scholar] [CrossRef] [PubMed]
- Puntarulo, S. Iron, oxidative stress and human health. Mol. Asp. Med. 2005, 26, 299–312. [Google Scholar] [CrossRef] [PubMed]
- Rajpathak, S.N.; Crandall, J.P.; Wylie-Rosett, J.; Kabat, G.C.; Rohan, T.E.; Hu, F.B. The role of iron in type 2 diabetes in humans. Biochim. Biophys. Acta 2009, 1790, 671–681. [Google Scholar] [CrossRef] [PubMed]
- Hurrell, R.; Egli, I. Iron bioavailability and dietary reference values. Am. J. Clin. Nutr. 2010, 91, 1461S–1467S. [Google Scholar] [CrossRef] [PubMed]
- Bao, W.; Rong, Y.; Rong, S.; Liu, L. Dietary iron intake, body iron stores, and the risk of type 2 diabetes: A systematic review and meta-analysis. BMC Med. 2012, 10, 119. [Google Scholar] [CrossRef] [PubMed]
- Lee, D.H.; Folsom, A.R.; Jacobs, D.R., Jr. Dietary iron intake and Type 2 diabetes incidence in postmenopausal women: The Iowa Women’s Health Study. Diabetologia 2004, 47, 185–194. [Google Scholar] [CrossRef] [PubMed]
- Fleming, D.J.; Jacques, P.F.; Dallal, G.E.; Tucker, K.L.; Wilson, P.W.; Wood, R.J. Dietary determinants of iron stores in a free-living elderly population: The Framingham Heart Study. Am. J. Clin. Nutr. 1998, 67, 722–733. [Google Scholar] [PubMed]
- Liu, J.M.; Stampfer, M.J.; Rifai, N.; Willett, W.C.; Ma, J. Body iron stores and their determinants in healthy postmenopausal US women. Am. J. Clin. Nutr. 2003, 78, 1160–1167. [Google Scholar] [PubMed]
- Barnard, N.D.; Katcher, H.I.; Jenkins, D.J.; Cohen, J.; Turner-McGrievy, G. Vegetarian and vegan diets in type 2 diabetes management. Nutr. Rev. 2009, 67, 255–263. [Google Scholar] [CrossRef] [PubMed]
- Fumeron, F.; Péan, F.; Driss, F.; Balkau, B.; Tichet, J.; Marre, M.; Grandchamp, B. Insulin Resistance Syndrome (DESIR) Study Group. Ferritin and transferrin are both predictive of the onset of hyperglycemia in men and women over 3 years: The Data from an Epidemiological Study on the Insulin Resistance Syndrome (DESIR) study. Diabetes Care 2006, 29, 2090–2094. [Google Scholar] [CrossRef] [PubMed]
- Jiang, R.; Manson, J.E.; Meigs, J.B.; Ma, J.; Rifai, N.; Hu, F.B. Body iron stores in relation to risk of type 2 diabetes in apparently healthy women. JAMA 2004, 291, 711–717. [Google Scholar] [CrossRef] [PubMed]
- Jehn, M.; Clark, J.M.; Guallar, E. Serum ferritin and risk of the metabolic syndrome in U.S. adults. Diabetes Care 2004, 27, 2422–2428. [Google Scholar] [CrossRef] [PubMed]
- Tsimihodimos, V.; Gazi, I.; Kalaitzidis, R.; Elisaf, M.; Siamopoulos, K.C. Increased serum ferritin concentrations and liver enzyme activities in patients with metabolic syndrome. Metab. Syndr. Relat. Disord. 2006, 4, 196–203. [Google Scholar] [CrossRef] [PubMed]
- Houschyar, K.S.; Ludtke, R.; Dobos, G.J.; Kalus, U.; Broecker-Preuss, M.; Rampp, T.; Brinkhaus, B.; Michalsen, A. Effects of phlebotomy-induced reduction of body iron stores on metabolic syndrome: Results from a randomized clinical trial. BMC Med. 2012, 10, 54. [Google Scholar] [CrossRef] [PubMed]
- Fernandez-Real, J.M.; Penarroja, G.; Castro, A.; Garcia-Bragado, F.; Hernandez-Aguado, I.; Ricart, W. Blood letting in high-ferritin type 2 diabetes: Effects on insulin sensitivity and beta-cell function. Diabetes 2002, 51, 1000–1004. [Google Scholar] [CrossRef] [PubMed]
- Lucotti, P.; Setola, E.; Monti, L.D.; Galluccio, E.; Costa, S.; Sandoli, E.P.; Fermo, I.; Rabaiotti, G.; Gatti, R.; Piatti, P. Beneficial effects of a long-term oral l-arginine treatment added to a hypocaloric diet and exercise training program in obese, insulin-resistant type 2 diabetic patients. Am. J. Physiol. Endocrinol. Metab. 2006, 291, E906–E912. [Google Scholar] [CrossRef] [PubMed]
- Piatti, P.M.; Monti, L.D.; Valsecchi, G.; Magni, F.; Setola, E.; Marchesi, F.; Galli-Kienle, M.; Pozza, G.; Alberti, K.G. Long-term oral l-arginine administration improves peripheral and hepatic insulin sensitivity in type 2 diabetic patients. Diabetes Care 2001, 24, 875–880. [Google Scholar] [CrossRef] [PubMed]
- Charles, S.; Henquin, J.C. Distinct effects of various amino acids on 45Ca2+ fluxes in rat pancreatic islets. Biochem J. 1983, 214, 899–907. [Google Scholar] [CrossRef] [PubMed]
- Henquin, J.C.; Meissner, H.P. Effects of amino acids on membrane potential and 86Rb+ fluxes in pancreatic beta-cells. Am. J. Physiol. 1981, 240, E245–E252. [Google Scholar] [PubMed]
- Herchuelz, A.; Lebrun, P.; Boschero, A.C.; Malaisse, W.J. Mechanism of arginine-stimulated Ca2+ influx into pancreatic B cell. Am. J. Physiol. 1984, 246, E38–E43. [Google Scholar] [PubMed]
- Newsholme, P.; Brennan, L.; Bender, K. Amino Acid Metabolism, β-Cell Function, and Diabetes. Diabetes 2006, 55, S39–S47. [Google Scholar] [CrossRef]
- Sener, A.; Best, L.C.; Yates, A.P.; Kadiata, M.M.; Olivares, E.; Louchami, K.; Jijakli, H.; Ladrière, L.; Malaisse, W.J. Stimulus-secretion coupling of arginine-induced insulin release: Comparison between the cationic amino acid and its methyl ester. Endocrine 2000, 13, 329–340. [Google Scholar] [CrossRef]
- Matsuda, M.; DeFronzo, R.A. Insulin sensitivity indices obtained from oral glucose tolerance testing: Comparison with the euglycemic insulin clamp. Diabetes Care 1999, 22, 1462–1470. [Google Scholar] [CrossRef] [PubMed]
- Thomas, D.E.; Elliott, E.J. The use of low-glycaemic index diets in diabetes control. Br. J. Nutr. 2010, 104, 797–802. [Google Scholar] [CrossRef] [PubMed]
- Wang, Q.; Xia, W.; Zhao, Z.; Zhang, H. Effects comparison between low glycemic index diets and high glycemic index diets on HbA1c and fructosamine for patients with diabetes: A systematic review and meta-analysis. Prim. Care Diabetes 2015, 9, 362–369. [Google Scholar] [CrossRef] [PubMed]
- Pereira, E.C.; Ferderbar, S.; Bertolami, M.C.; Faludi, A.A.; Monte, O.; Xavier, H.T.; Pereira, T.V.; Abdalla, D.S. Biomarkers of oxidative stress and endothelial dysfunction in glucose intolerance and diabetes mellitus. Clin. Biochem. 2008, 41, 1454–1460. [Google Scholar] [CrossRef] [PubMed]
- Tong, M.; Neusner, A.; Longato, L.; Lawton, M.; Wands, J.R.; de la Monte, S.M. Nitrosamine exposure causes insulin resistance diseases: Relevance to type 2 diabetes mellitus, non-alcoholic steatohepatitis, and Alzheimer’s disease. JAD 2009, 17, 827–844. [Google Scholar] [PubMed]
- Saudek, C.D.; Derr, R.L.; Kalyani, R.R. Assessing Glycemia in Diabetes Using Self-monitoring Blood Glucose and Hemoglobin A1c. JAMA 2006, 295, 1688–1697. [Google Scholar] [CrossRef] [PubMed]
- Center for Drug Evaluation and Research. Guidance for Industry: Diabetes Mellitus: Developing Drugs and Therapeutic Biologics for Treatment and Prevention (DRAFT GUIDANCE); U.S. Department of Health and Human Services Food and Drug Administration: Silver Spring, MD, USA, 2008; pp. 1–30. [Google Scholar]
- Mudryj, A.N.; Aukema, H.M.; Yu, N. Intake patterns and dietary associations of soya protein consumption in adults and children in the Canadian Community Health Survey, Cycle 2.2. Br. J. Nutr. 2015, 113, 299–309. [Google Scholar] [CrossRef] [PubMed]
- Phillips, S.M.; Fulgoni, V.L., 3rd; Heaney, R.P.; Nicklas, T.A.; Slavin, J.L.; Weaver, C.M. Commonly consumed protein foods contribute to nutrient intake, diet quality, and nutrient adequacy. Am. J. Clin. Nutr. 2015, 101, 1346S–1352S. [Google Scholar] [CrossRef] [PubMed]
- Berner, L.A.; Becker, G.; Wise, M.; Doi, J. Characterization of dietary protein among older adults in the United States: Amount, animal sources, and meal patterns. J. Acad. Nutr. Diet. 2013, 113, 809–815. [Google Scholar] [CrossRef] [PubMed]
- Smit, E.; Nieto, F.J.; Crespo, C.J.; Mitchell, P. Estimates of animal and plant protein intake in US adults: Results from the Third National Health and Nutrition Examination Survey, 1988–1991. J. Am. Diet. Assoc. 1999, 99, 813–820. [Google Scholar] [CrossRef]
- O’Neil, C.E.; Keast, D.R.; Fulgoni, V.L., III; Nicklas, T.A. Food sources of energy and nutrients among adults in the US: NHANES 2003–2006. Nutrients 2012, 4, 2097–2120. [Google Scholar]
© 2015 by the authors; licensee MDPI, Basel, Switzerland. This article is an open access article distributed under the terms and conditions of the Creative Commons by Attribution (CC-BY) license (http://creativecommons.org/licenses/by/4.0/).
Share and Cite
Viguiliouk, E.; Stewart, S.E.; Jayalath, V.H.; Ng, A.P.; Mirrahimi, A.; De Souza, R.J.; Hanley, A.J.; Bazinet, R.P.; Blanco Mejia, S.; Leiter, L.A.; et al. Effect of Replacing Animal Protein with Plant Protein on Glycemic Control in Diabetes: A Systematic Review and Meta-Analysis of Randomized Controlled Trials. Nutrients 2015, 7, 9804-9824. https://doi.org/10.3390/nu7125509
Viguiliouk E, Stewart SE, Jayalath VH, Ng AP, Mirrahimi A, De Souza RJ, Hanley AJ, Bazinet RP, Blanco Mejia S, Leiter LA, et al. Effect of Replacing Animal Protein with Plant Protein on Glycemic Control in Diabetes: A Systematic Review and Meta-Analysis of Randomized Controlled Trials. Nutrients. 2015; 7(12):9804-9824. https://doi.org/10.3390/nu7125509
Chicago/Turabian StyleViguiliouk, Effie, Sarah E. Stewart, Viranda H. Jayalath, Alena Praneet Ng, Arash Mirrahimi, Russell J. De Souza, Anthony J. Hanley, Richard P. Bazinet, Sonia Blanco Mejia, Lawrence A. Leiter, and et al. 2015. "Effect of Replacing Animal Protein with Plant Protein on Glycemic Control in Diabetes: A Systematic Review and Meta-Analysis of Randomized Controlled Trials" Nutrients 7, no. 12: 9804-9824. https://doi.org/10.3390/nu7125509
APA StyleViguiliouk, E., Stewart, S. E., Jayalath, V. H., Ng, A. P., Mirrahimi, A., De Souza, R. J., Hanley, A. J., Bazinet, R. P., Blanco Mejia, S., Leiter, L. A., Josse, R. G., Kendall, C. W. C., Jenkins, D. J. A., & Sievenpiper, J. L. (2015). Effect of Replacing Animal Protein with Plant Protein on Glycemic Control in Diabetes: A Systematic Review and Meta-Analysis of Randomized Controlled Trials. Nutrients, 7(12), 9804-9824. https://doi.org/10.3390/nu7125509