Piper and Vismia Species from Colombian Amazonia Differentially Affect Cell Proliferation of Hepatocarcinoma Cells

Abstract
:
1. Introduction
2. Experimental Section
2.1. Materials
2.2. Preparation and Characterization of the Plant Extracts
2.3. Rat Liver Hepatocyte Isolation and Maintenance in Primary Cultures
2.4. Culture and Maintenance of Hepatocarcinoma Cell Lines
2.5. Cellular Toxicity
2.6. Cell Cycle Analysis
2.7. Intracellular ROS Detection
2.8. Cell Protein Assay
2.9. Enzymatic Assays
2.9.1. Superoxide Dismutase
2.9.2. Glutathione Peroxidase
2.9.3. Catalase
2.10. Statistical Analysis
3. Results
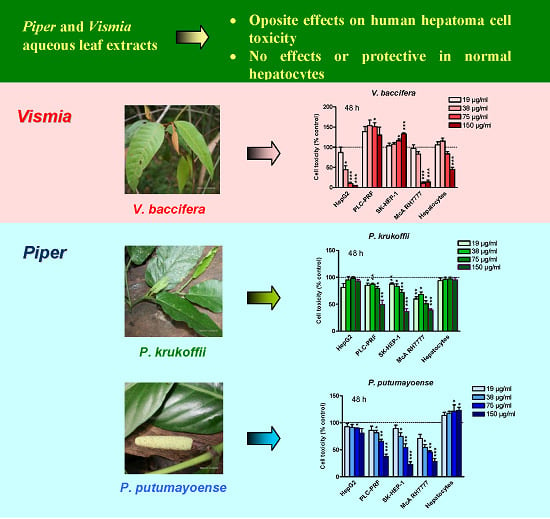
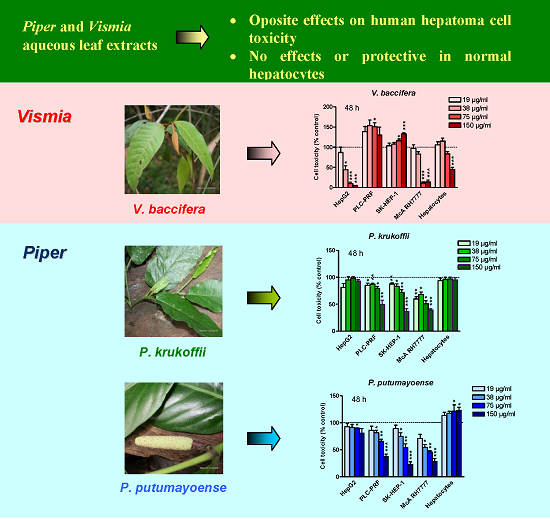
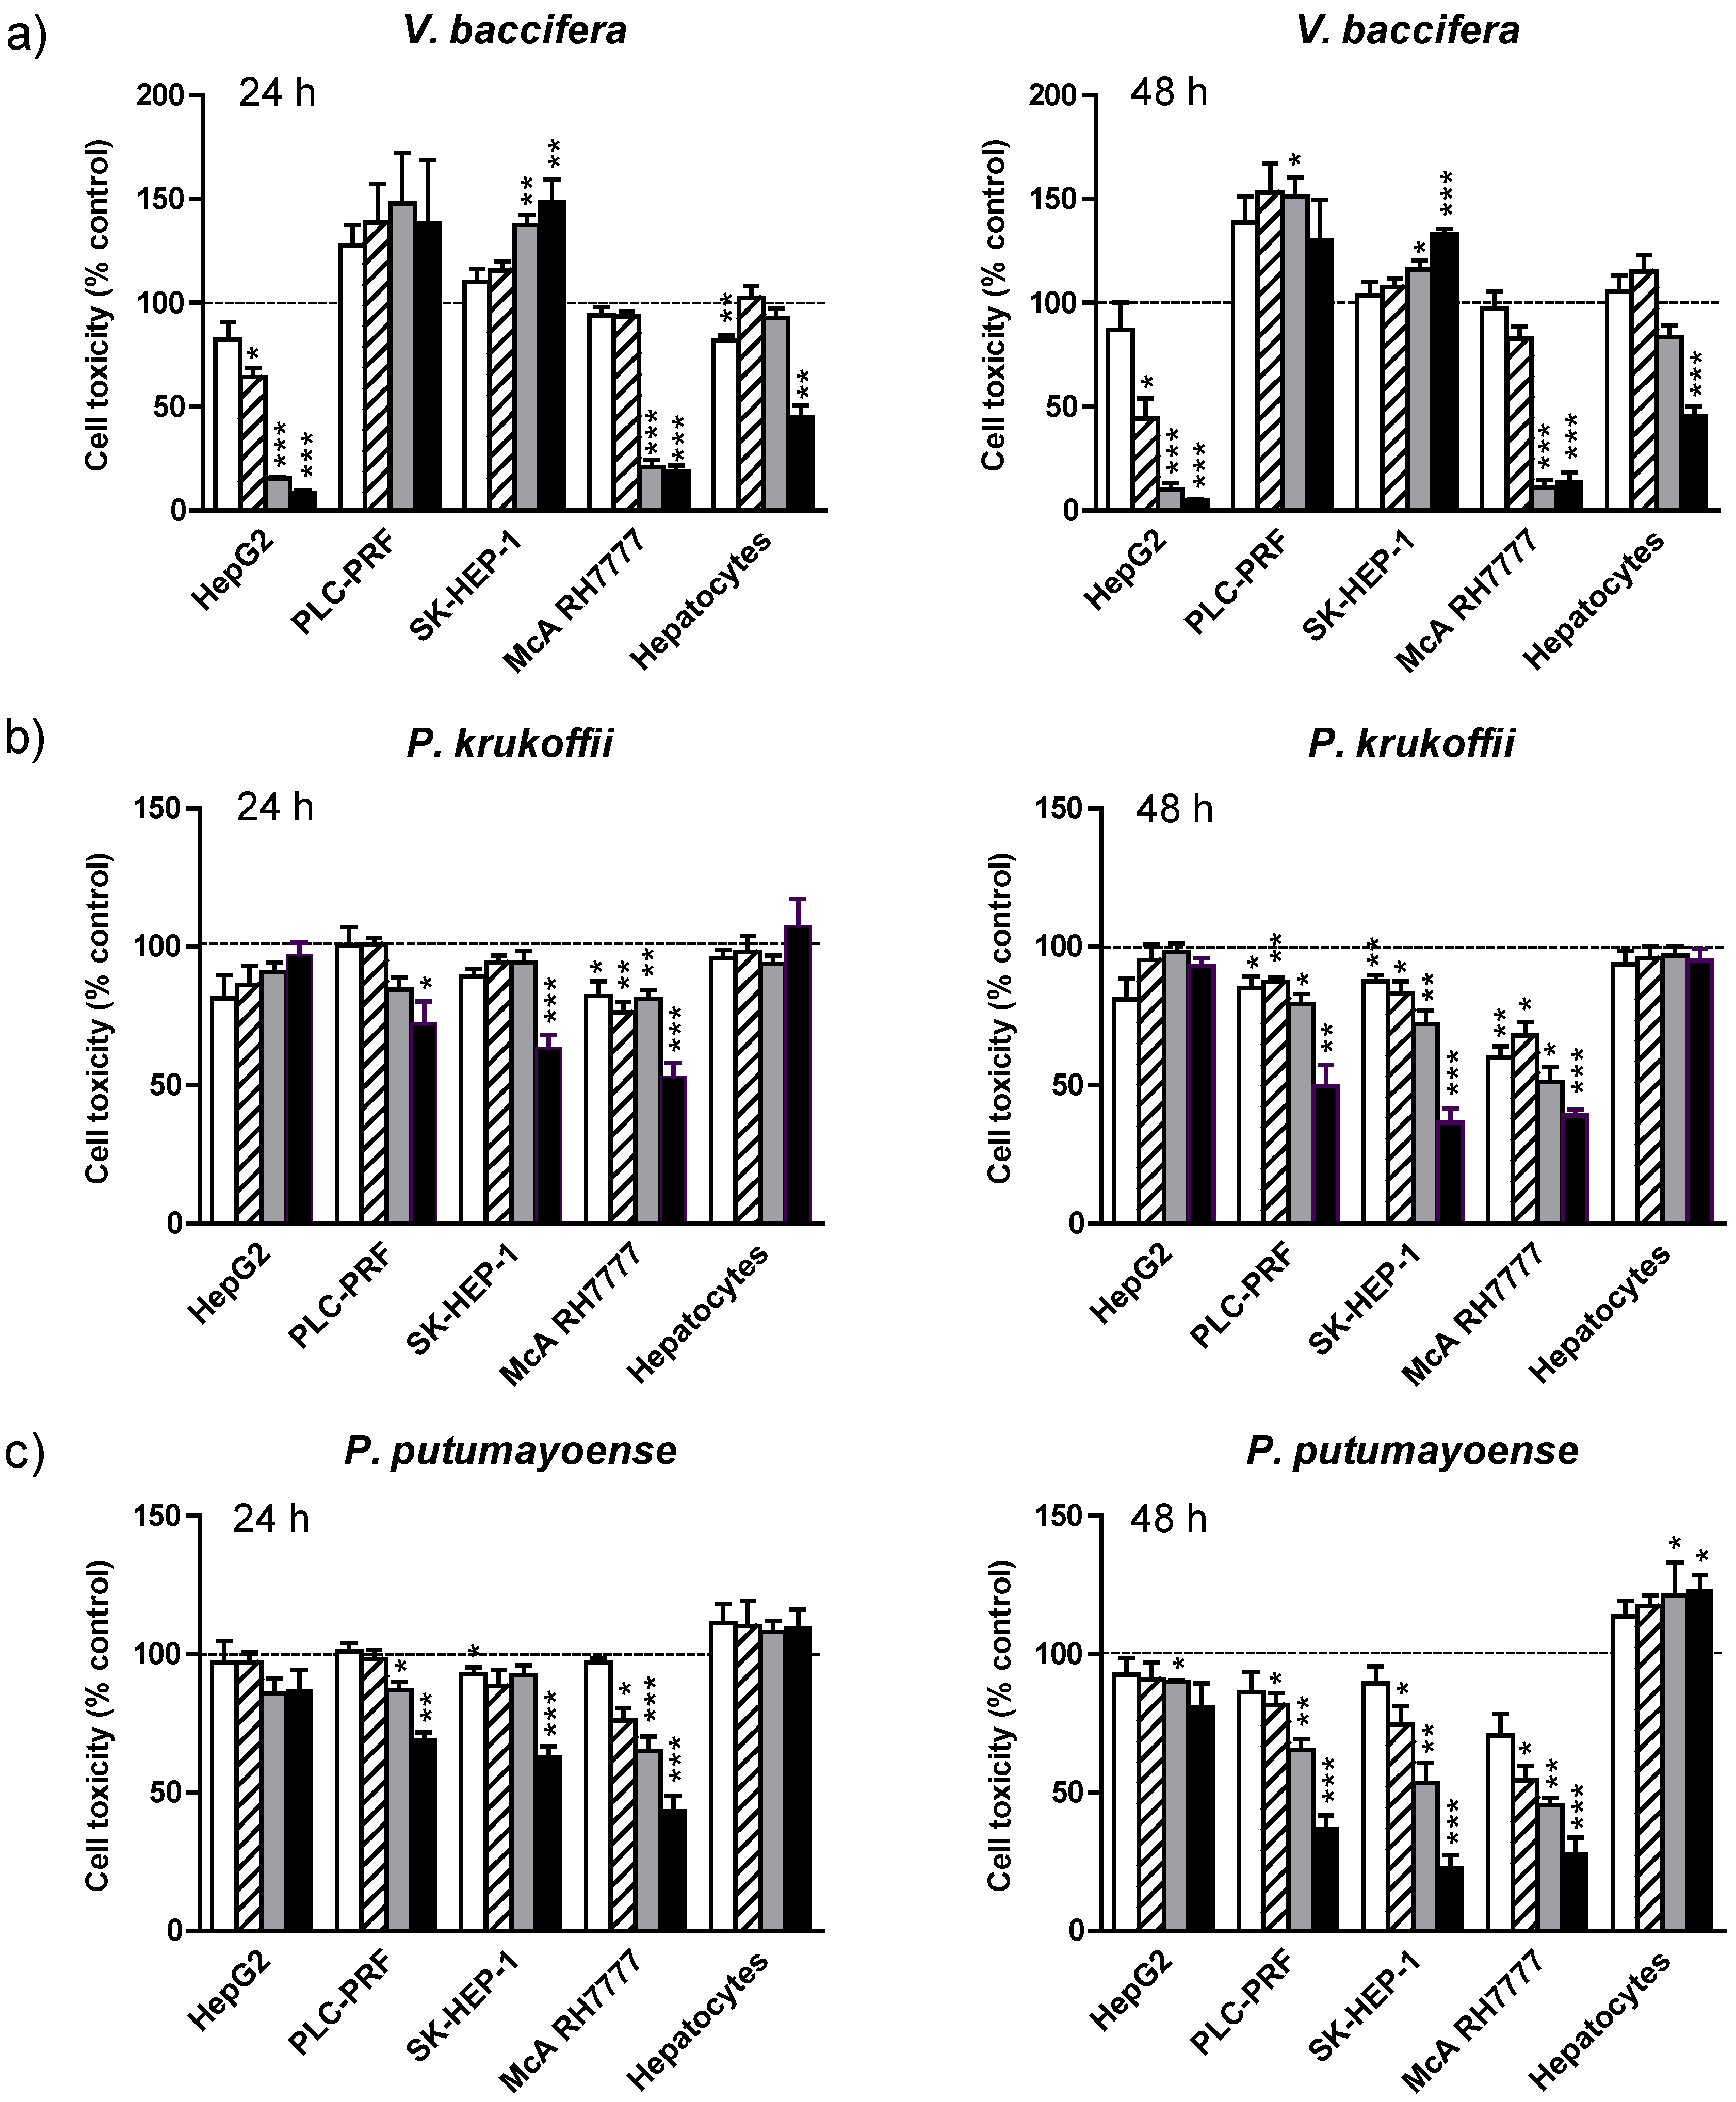
3.1. Cell Toxicity
 19 µg/mL;
  38 µg/mL;
  75 µg/mL;
  150 µg/mL for 24 h and 48 h. Cell toxicity was determined by the MTT cholorimetric assay, as described in Mat and Met. Results are the means + standard error (SE) of the mean of n = 3–6 experiments. * p < 0.05; ** p < 0.01; *** p < 0.005.
19 µg/mL; 38 µg/mL; 75 µg/mL; 150 µg/mL for 24 h and 48 h. Cell toxicity was determined by the MTT cholorimetric assay, as described in Mat and Met. Results are the means + standard error (SE) of the mean of n = 3–6 experiments. * p < 0.05; ** p < 0.01; *** p < 0.005.
150 µg/mL for 24 h and 48 h. Cell toxicity was determined by the MTT cholorimetric assay, as described in Mat and Met. Results are the means + standard error (SE) of the mean of n = 3–6 experiments. * p < 0.05; ** p < 0.01; *** p < 0.005.
19 µg/mL; 38 µg/mL; 75 µg/mL; 150 µg/mL for 24 h and 48 h. Cell toxicity was determined by the MTT cholorimetric assay, as described in Mat and Met. Results are the means + standard error (SE) of the mean of n = 3–6 experiments. * p < 0.05; ** p < 0.01; *** p < 0.005.

| Cell type | LC50 (µg/mL) | ||
|---|---|---|---|
| V. baccifera | P. krukoffii | P. putumayoense | |
| HepG2 | 35 | n.d. | n.d. |
| PLC-PRF | Proliferative | 149 | 106 |
| SK-HEP-1 | Proliferative | 126 | 83 |
| McA RH7777 | 57 | 76 | 47 |
| Primary cultured hepatocytes | 100 | n.d. | Protective against basal cell death |
3.2. Mechanism of Toxicity
3.2.1. Cell Cycle Arrest
| Treatment | SubG0 (%) | Cell cycle | ||
|---|---|---|---|---|
| G0/G1(%) | S (%) | G2/M (%) | ||
| No additions | 8.9 ± 3.1 | 59.8 ± 1.0 | 27.8 ± 1.9 | 12.8 ± 1.3 |
| V. baccifera (75 µg/mL) | 66.1 ± 14.5 * | 39.6 ± 7.5 * | 27.1 ± 2.0 * | 33.3 ± 4.9 * |
| P. krukoffii (150 µg/mL) | 9.5 ± 2.3 | 57.2 ± 2.2 | 29.0 ± 0.4 | 13.8 ± 0.7 |
| P. putumayoense (150 µg/mL) | 16.3 ± 1.4 *** | 45.9 ± 1.4 *** | 36.2 ± 1.5 * | 17.9 ± 1.8 * |
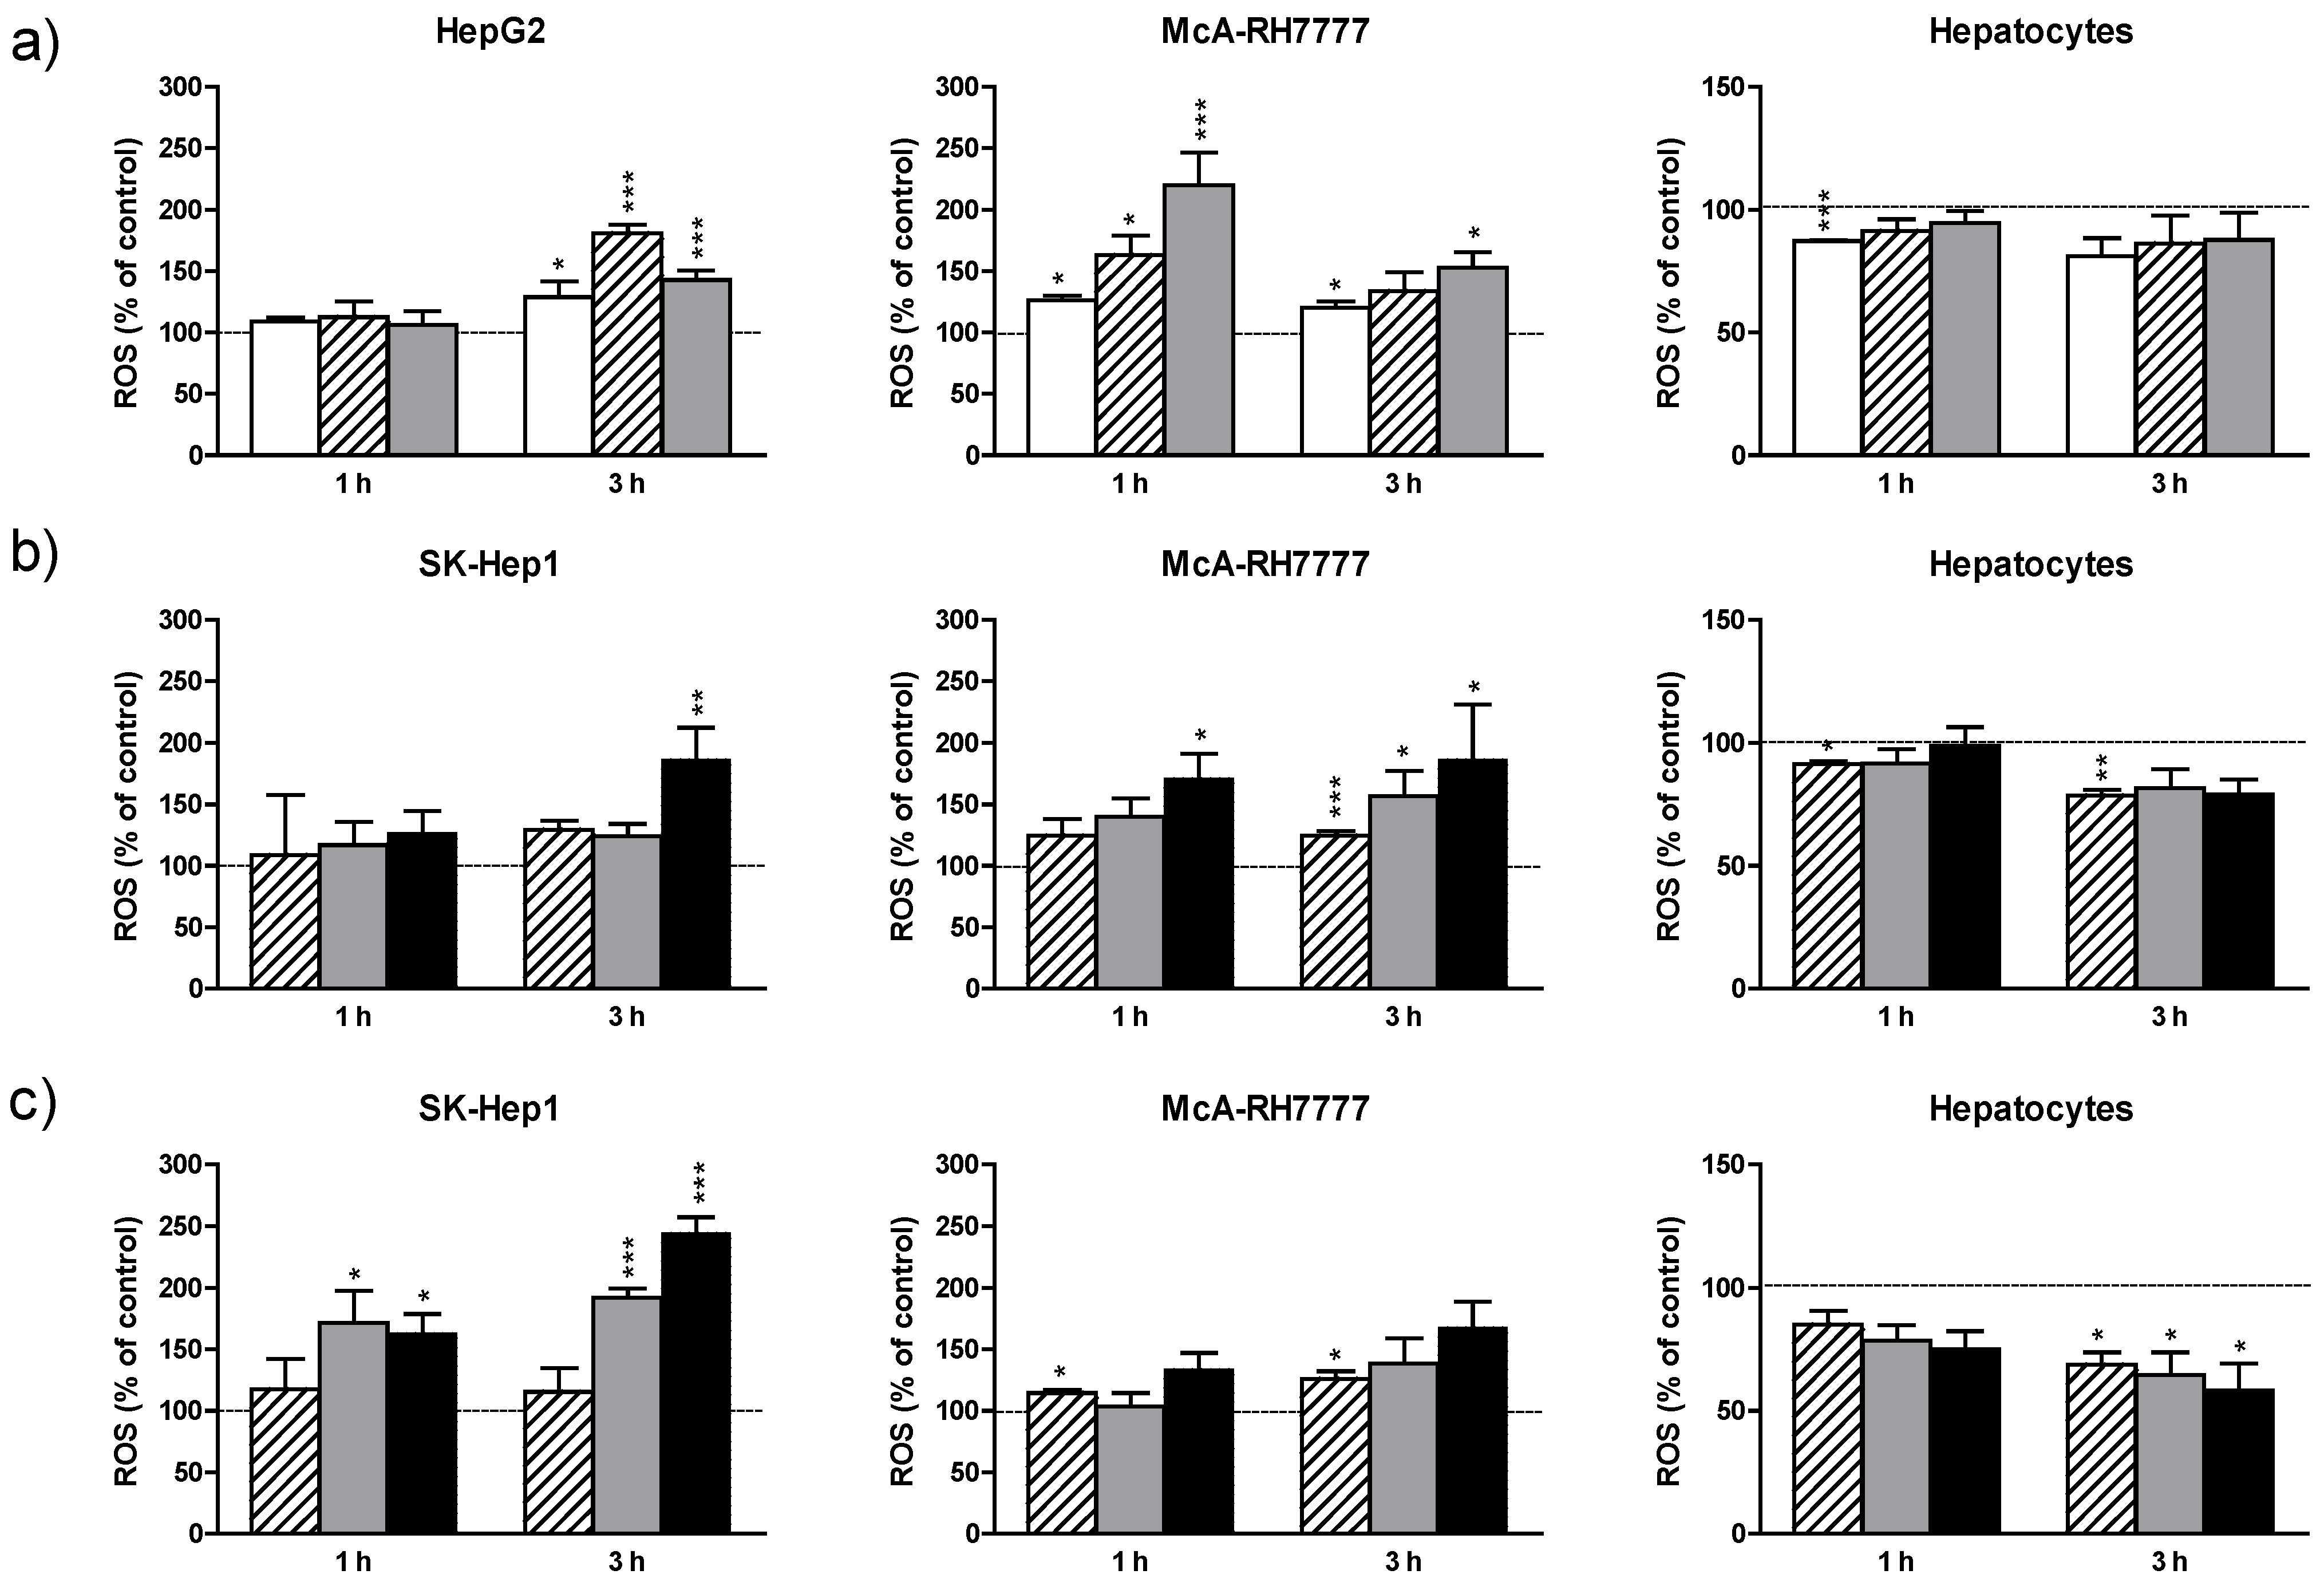
3.2.2. ROS Production
3.3. Antioxidant Activities
19 µg/mL; 38 µg/mL; 75 µg/mL; 150 µg/mL for 1 and 3 h. After incubation, cells were loaded with the fluorescent probe as described in Mat. and Meth. Results are expressed as the percentage of the control values and are the mean + standard error (SE) of the mean of n = 3 experiments. * p < 0.05; ** p < 0.01; *** p < 0.005.
19 µg/mL; 38 µg/mL; 75 µg/mL; 150 µg/mL for 1 and 3 h. After incubation, cells were loaded with the fluorescent probe as described in Mat. and Meth. Results are expressed as the percentage of the control values and are the mean + standard error (SE) of the mean of n = 3 experiments. * p < 0.05; ** p < 0.01; *** p < 0.005.
| Treatment | 24 h | 48 h | |||||
|---|---|---|---|---|---|---|---|
| SOD U/mg | GPx nmol/min/mg | Catalase µmol/min/mg | SOD U/mg | GPx nmol/min/mg | Catalase µmol/min/mg | ||
| McA-RH7777 | Control | 22.0 ± 0.9 | 38.0 ± 4.2 | 134.0 ± 8.6 | 23.4 ± 5.2 | 40.6 ± 3.6 | 143.7 ± 5.2 |
| V. baccifera | 19.3 ± 3.4 | 44.6 ± 7.4 | 108.2 ± 8.1 * | 14.8 ± 3.2 * | 54.6 ± 9.3 | 95.8 ± 15.8 ** | |
| P. krukoffii | 22.1 ± 2.3 | 47.0 ± 1.7 ** | 80.4 ± 3.6 *** | 23.3 ± 1.8 | 45.8 ± 3.1 | 77.3 ± 6.6 ** | |
| P. putumayoense | 21.0 ± 1.7 | 47.9 ± 3.5 ** | 103.2 ± 5.9 *** | 23.4 ± 1.9 | 49.5 ± 2.3 * | 81.0 ± 7.3 ** | |
| HepG2 | Control | 15.5 ± 1.5 | 1.86 ± 0.50 | 104.6 ± 10.1 | 18.9 ± 1.7 | 1.84 ± 0.16 | 101.2 ± 8.0 |
| V. baccifera | 21.4 ± 1.8 * | 1.57 ± 0.27 | 65.2 ± 15.5* | 20.8 ± 2.8 | 1.76 ± 0.51 | 73.0 ± 17.5 | |
| SK-HEP-1 | Control | 16.0 ± 1.0 | 2.18 ± 0.46 | 11.6 ± 2.3 | 17.4 ± 0.7 | 3.72 ± 0.63 | 13.6 ± 3.3 |
| P. krukoffii | 19.0 ± 1.0 * | 2.62 ± 0.69 | 3.9 ± 3.0 | 22.9 ± 1.1 *** | 2.57 ± 1.33 | 7.8 ± 1.9 | |
| P. putumayoense | 19.4 ± 0.4 *** | 1.30 ± 0.80 | 7.6 ± 3.4 | 25.3 ± 1.1 *** | 2.10 ± 0.26* | 9.6 ± 5.3 | |
4. Discussion
5. Conclusions
Supplementary Files
Supplementary File 1Acknowledgments
Author Contributions
Conflicts of Interest
References
- Ferlay, J.; Shin, H.R.; Bray, F.; Forman, D.; Mathers, C.; Parkin, D.M. Estimates of worldwide burden of cancer in 2008, GLOBOCAN 2008. Int. J. Cancer 2010, 127, 2893–2917. [Google Scholar] [CrossRef] [PubMed]
- Parkin, D.M.; Bray, F.; Ferlay, J.; Pisani, P. Global cancer statistics, 2002. C.A. Cancer J. Clin. 2005, 55, 74–108. [Google Scholar] [CrossRef]
- Acebo, P.; Giner, D.; Calvo, P.; Blanco-Rivero, A.; Ortega, A.D.; Fernández, P.L.; Roncador, G.; Fernández-Malavé, E.; Chamorro, M.; Cuezva, J.M. Cancer abolishes the tissue type-specific differences in the phenotype of energetic metabolism. Transl. Oncol. 2009, 2, 138–145. [Google Scholar] [CrossRef] [PubMed]
- Bensinger, S.J.; Christofk, H.R. New aspects of the Warburg effect in cancer cell biology. Semin. Cell. Dev. Biol. 2012, 23, 352–361. [Google Scholar] [CrossRef] [PubMed]
- Dang, C.V. Links between metabolism and cancer. Genes Dev. 2012, 26, 877–890. [Google Scholar] [CrossRef] [PubMed]
- Granchi, C.; Minutolo, F. Anticancer agents that counteract tumor glycolysis. Chem. Med. Chem. 2012, 7, 1318–1350. [Google Scholar] [CrossRef] [PubMed]
- Mucaj, V.; Shay, J.E.; Simon, M.C. Effects of hypoxia and HIFs on cancer metabolism. Int. J. Hematol. 2012, 95, 464–470. [Google Scholar] [CrossRef] [PubMed]
- Aninat, C.; Piton, A.; Glaise, D.; Le Charpentier, T.; Langouët, S.; Morel, F.; Guguen-Guillouzo, C.; Guillouzo, A. Expression of cytochromes P450, conjugating enzymes and nuclear receptors in human hepatoma HepaRG cells. Drug Metab. Dispos. 2006, 34, 75–83. [Google Scholar] [CrossRef] [PubMed]
- Donato, M.T.; Lahoz, A.; Castell, J.V.; Gómez-Lechón, M.J. Cell lines: A tool for in vitro drug metabolism studies. Curr. Drug Metab. 2008, 9, 1–11. [Google Scholar] [CrossRef] [PubMed]
- Vane, J.R.; Botting, R.M. Anti-inflammatory drugs and their mechanism of action. Inflamm. Res. 1998, 47, S78–S87. [Google Scholar] [CrossRef] [PubMed]
- Surh, Y.J.; Chun, K.S.; Cha, H.H.; Han, S.S.; Keum, Y.S.; Park, K.K.; Lee, S.S. Molecular mechanisms underlying chemopreventive activities of anti-inflammatory phytochemicals: Down-regulation of COx-2 and iNOS through suppression of NF-kappa B activation. Mutat. Res. 2001, 480–481, 243–268. [Google Scholar] [CrossRef] [PubMed]
- Kuete, V.; Nguemeving, J.R.; Beng, V.P.; Azebaze, A.G.B.; Etoa, F.X.; Meyer, M.; Bodo, B.; Nkengfack, A.E. Antimicrobial activity of the methanolic extracts and compounds from Vismia laurentii De Wild (Guttiferae). J. Ethnopharmacol. 2007, 109, 372–379. [Google Scholar] [CrossRef] [PubMed]
- Osorio, E.; Arango, G.J.; Jiménez, N.; Alzate, F.; Ruiz, G.; Gutiérrez, D.; Paco, M.A.; Giménez, A.; Robledo, S. Antiprotozoal and cytotoxic activities in vitro of Colombian Annonaceae. J. Ethnopharmacol. 2007, 111, 630–635. [Google Scholar] [CrossRef] [PubMed]
- Carvalho, M.V.; Penido, C.; Siani, A.C.; Valente, L.M.; Henriques, M.G. Investigations on the anti-inflammatory and anti-allergic activities of the leaves of Uncaria guianensis (Aublet) J. F. Gmelin. Inflammopharmacology 2006, 14, 48–56. [Google Scholar] [CrossRef] [PubMed]
- Fuller, R.W.; Westergaard, C.K.; Collins, J.W.; Cardellina, J.H.; Boyd, M.R. Vismiaphenones D-G, new prenylated benzophenones from Vismia cayennensis. J. Nat. Prod. 1999, 62, 67–69. [Google Scholar] [CrossRef] [PubMed]
- Hussein, A.A.; Bozzi, B.; Correa, M.; Capson, T.L.; Kursar, T.A.; Coley, P.D.; Solis, P.N.; Gupta, M.P. Bioactive constituents from three Vismia species. J. Nat. Prod. 2003, 66, 858–860. [Google Scholar] [CrossRef] [PubMed]
- Lizcano, L.J.; Bakkali, F.; Ruiz-Larrea, M.B.; Ruiz-Sanz, J.I. Antioxidant activity and polyphenol content of Colombian Amazonian plants with medicinal use. Food Chem. 2010, 119, 1566–1570. [Google Scholar] [CrossRef]
- Lizcano, L.J.; Viloria-Bernal, M.; Vicente, F.; Berrueta, L.A.; Gallo, B.; Martínez-Cañamero, M.; Ruiz-Larrea, M.B.; Ruiz-Sanz, J.I. Lipid oxidation inhibitory effects and phenolic composition of aqueous extracts from medicinal plants of Colombian Amazonia. Int. J. Mol. Sci. 2012, 13, 5454–5467. [Google Scholar] [CrossRef] [PubMed]
- Ruiz-Larrea, M.B.; Garrido, M.J.; Lacort, M. Estradiol-induced effects on glutathione metabolism in rat hepatocytes. J. Biochem. 1993, 113, 563–567. [Google Scholar] [PubMed]
- Navarro, R.; Martínez, R.; Busnadiego, I.; Ruiz-Larrea, M.B.; Ruiz-Sanz, J.I. Doxorubicin-induced MAPK activation in hepatocyte cultures is independent of oxidant damage. Ann. N. Y. Acad. Sci. 2006, 1090, 408–418. [Google Scholar] [CrossRef] [PubMed]
- Mosmann, T. Rapid colorimetric assay for cellular growth and survival: Application to proliferation and cytotoxicity assays. J. Immunol. Methods 1983, 65, 55–63. [Google Scholar] [CrossRef] [PubMed]
- Bradford, M.M. A rapid and sensitive method for the quantification of microgram quantities of protein utilizing the principle of protein-dye binding. Anal. Biochem. 1976, 72, 248–254. [Google Scholar] [CrossRef] [PubMed]
- Flohé, L.; Günzler, W.A. Assay of glutathione peroxidase. Methods Enzymol. 1984, 105, 114–121. [Google Scholar] [PubMed]
- Aebi, H. Catalase in Vitro. In Methods in Enzymology, Oxygen Radicals in Biological Systems; Packer, L., Ed.; Academic Press: San Diego, CA, USA, 1984; Volume 105, pp. 121–126. [Google Scholar]
- López-Torres, M.; Pérez-Campo, R.; Rojas, C.; Cadenas, S.; Barja, G. Simultaneous induction of sod, glutathione reductase, GSH, and ascorbate in liver and kidney correlates with survival during aging. Free Radic. Biol. Med. 1993, 15, 133–142. [Google Scholar] [CrossRef] [PubMed]
- Van Staveren, W.C.; Solis, D.Y.; Hebrant, A.; Detours, V.; Dumont, J.E.; Maenhaut, C. Human cancer cell lines: Experimental models for cancer cells in situ? For cancer stem cells? Biochim. Biophys. Acta 2009, 1795, 92–103. [Google Scholar] [PubMed]
- Gazdar, A.F.; Girard, L.; Lockwood, W.W.; Lam, W.L.; Minna, J.D. Lung cancer cell lines as tools for biomedical discovery and research. JNCI-J. Natl. Cancer Inst. 2010, 102, 1310–1321. [Google Scholar] [CrossRef]
- Finlay, G.J.; Baguley, B.C. The use of human cancer cell lines as a primary screening system for antineoplastic compounds. Eur. J. Cancer Clin. Oncol. 1984, 20, 947–954. [Google Scholar] [CrossRef] [PubMed]
- Fujiyama, S.; Tanaka, M.; Maeda, S.; Ashihara, H.; Hirata, R.; Tomita, K. Tumor markers in early diagnosis, follow-up and management of patients with hepatocellular carcinoma. Oncology 2002, 62, 57–63. [Google Scholar] [CrossRef] [PubMed]
- Knowles, B.B.; Howe, C.C.; Aden, D.P. Human hepatocellular carcinoma cell lines secrete the major plasma proteins and hepatitis B surface antigen. Science 2001, 209, 497–499. [Google Scholar] [CrossRef]
- Shouval, D.; Schuger, L.; Levij, I.S.; Reid, L.M.; Neeman, Z.; Shafritz, D.A. Comparative morphology and tumourigenicity of human hepatocellular carcinoma cell lines in athymic rats and mice. Virchows Arch. A. 1988, 412, 595–606. [Google Scholar] [CrossRef]
- Chen, C.H.; Su, K.Y.; Tao, M.H.; Lin, S.W.; Su, Y.H.; Tsai, Y.C.; Cheng, K.C.; Jeng, Y.M.; Sheu, J.C. Decreased expressions of hepsin in human hepatocellular carcinomas. Liver Int. 2006, 26, 774–780. [Google Scholar] [CrossRef] [PubMed]
- Seow, T.K.; Liang, R.C.; Leow, C.K.; Chung, M.C. Hepatocellular carcinoma: From bedside to proteomics. Proteomics 2001, 1, 1469. [Google Scholar] [CrossRef]
- Sun, Y.; Mi, W.; Cai, J.; Ying, W.; Liu, F.; Lu, H.; Qiao, Y.; Jia, W.; Bi, X.; Lu, N.; et al. Quantitative proteomic signature of liver cancer cells: Tissue transglutaminase 2 could be a novel protein candidate of human hepatocellular carcinoma. J. Proteome Res. 2008, 7, 3847–3859. [Google Scholar] [CrossRef] [PubMed]
- Ramos, S. Cancer chemoprevention and chemotherapy: Dietary polyphenols and signalling pathways. Mol. Nutr. Food Res. 2008, 52, 507–526. [Google Scholar] [CrossRef] [PubMed]
- Keum, Y.S.; Han, Y.H.; Liew, C.; Kim, J.H.; Xu, C.; Yuan, X.; Shakarjian, M.P.; Chong, S.; Kong, A.N. Induction of heme oxygenase-1 (HO-1) and NAD[P]H: Quinone oxidoreductase 1 (NQO1) by a phenolic antioxidant, butylated hydroxyanisole (BHA) and its metabolite, tert-butylhydroquinone (tBHQ) in primary-cultured human and rat hepatocytes. Pharm. Res. 2006, 23, 2586–2594. [Google Scholar] [CrossRef] [PubMed]
- Zanichelli, F.; Capasso, S.; Di Bernardo, G.; Cipollaro, M.; Pagnotta, E.; Cartenì, M.; Casale, F.; Iori, R.; Giordano, A.; Galderisi, U. Low concentrations of isothiocyanates protect mesenchymal stem cells from oxidative injuries, while high concentrations exacerbate DNA damage. Apoptosis 2012, 17, 964–974. [Google Scholar] [CrossRef] [PubMed]
- Zanichelli, F.; Capasso, S.; Cipollaro, M.; Pagnotta, E.; Cartenì, M.; Casale, F.; Iori, R.; Galderisi, U. Dose-dependent effects of R-sulforaphane isothiocyanate on the biology of human mesenchymal stem cells, at dietary amounts, it promotes cell proliferation and reduces senescence and apoptosis, while at anti-cancer drug doses, it has a cytotoxic effect. Age 2012, 34, 281–293. [Google Scholar] [CrossRef] [PubMed]
- Prasad, S.; Kaur, J.; Roy, P.; Kalra, N.; Shukla, Y. Theaflavins induce G2/M arrest by modulating expression of p21waf1/cip1, cdc25c and cyclin B in human prostate carcinoma PC-3 cells. Life Sci. 2007, 81, 1323–1331. [Google Scholar] [CrossRef] [PubMed]
- Ohata, M.; Koyama, Y.; Suzuki, T.; Hayakawa, S.; Saeki, K.; Nakamura, Y.; Isemura, M. Effects of tea constituents on cell cycle progression of human leukemia U937 cells. Biomed. Res. 2005, 26, 1–7. [Google Scholar] [CrossRef] [PubMed]
- Ehrenfeld, G.M.; Shipley, J.B.; Heimbrook, D.C.; Sugiyama, H.; Long, E.C.; van Boom, J.H.; van der Marel, G.A.; Oppenheimer, N.J.; Hecht, S.M. Copper-dependent cleavage of DNA by bleomycin. Biochemistry 1987, 26, 931–942. [Google Scholar] [CrossRef] [PubMed]
- Hadi, S.M.; Ullah, M.F.; Shamim, U.; Bhatt, S.H.; Azmi, A.S. Catalytic therapy of cancer by ascorbic acid involves redox cycling of exogenous/endogenous copper ions and generation of reactive oxygen species. Chemotherapy 2010, 56, 280–284. [Google Scholar] [CrossRef] [PubMed]
- Rahman, A.; Shahabuddin; Hadi, S.M.; Parish, J.H. Complexes involving quercetin, DNA and Cu(II). Carcinogenesis 1990, 11, 2001–2003. [Google Scholar] [CrossRef] [PubMed]
- Choi, H.Y.; Chong, S.A.; Nam, M.J. Resveratrol induces apoptosis in human SK-HEP-1 hepatic cancer cells. Cancer Genomics Proteomics 2009, 6, 263–268. [Google Scholar] [PubMed]
- Babich, H.; Krupka, M.E.; Nissim, H.A.; Zuckerbraun, H.L. Differential in vitro cytotoxicity of (−)-epicatechin gallate (ECG) to cancer and normal cells from the human oral cavity. Toxicol In Vitro 2005, 19, 231–242. [Google Scholar]
- Clere, N.; Faure, S.; Martinez, M.C.; Andriantsitohaina, R. Anticancer properties of flavonoids: Roles in various stages of carcinogenesis. Cardiovasc. Hematol. Agents Med. Chem. 2011, 9, 62–77. [Google Scholar] [CrossRef] [PubMed]
- Shimizu, M.; Adachi, S.; Masuda, M.; Kozawa, O.; Moriwaki, H. Cancer chemoprevention with green tea catechins by targeting receptor tyrosine kinases. Mol. Nutr. Food Res. 2011, 55, 832–843. [Google Scholar] [CrossRef] [PubMed]
- Yang, C.S.; Lambert, J.D.; Sang, S. Antioxidative and anti-carcinogenic activities of tea polyphenols. Arch. Toxicol. 2009, 83, 11–21. [Google Scholar] [CrossRef] [PubMed]
© 2014 by the authors; licensee MDPI, Basel, Switzerland. This article is an open access article distributed under the terms and conditions of the Creative Commons Attribution license (http://creativecommons.org/licenses/by/4.0/).
Share and Cite
Lizcano, L.J.; Siles, M.; Trepiana, J.; Hernández, M.L.; Navarro, R.; Ruiz-Larrea, M.B.; Ruiz-Sanz, J.I. Piper and Vismia Species from Colombian Amazonia Differentially Affect Cell Proliferation of Hepatocarcinoma Cells. Nutrients 2015, 7, 179-195. https://doi.org/10.3390/nu7010179
Lizcano LJ, Siles M, Trepiana J, Hernández ML, Navarro R, Ruiz-Larrea MB, Ruiz-Sanz JI. Piper and Vismia Species from Colombian Amazonia Differentially Affect Cell Proliferation of Hepatocarcinoma Cells. Nutrients. 2015; 7(1):179-195. https://doi.org/10.3390/nu7010179
Chicago/Turabian StyleLizcano, Leandro J., Maite Siles, Jenifer Trepiana, M. Luisa Hernández, Rosaura Navarro, M. Begoña Ruiz-Larrea, and José Ignacio Ruiz-Sanz. 2015. "Piper and Vismia Species from Colombian Amazonia Differentially Affect Cell Proliferation of Hepatocarcinoma Cells" Nutrients 7, no. 1: 179-195. https://doi.org/10.3390/nu7010179
APA StyleLizcano, L. J., Siles, M., Trepiana, J., Hernández, M. L., Navarro, R., Ruiz-Larrea, M. B., & Ruiz-Sanz, J. I. (2015). Piper and Vismia Species from Colombian Amazonia Differentially Affect Cell Proliferation of Hepatocarcinoma Cells. Nutrients, 7(1), 179-195. https://doi.org/10.3390/nu7010179