Association between Polymorphisms in the Fatty Acid Desaturase Gene Cluster and the Plasma Triacylglycerol Response to an n-3 PUFA Supplementation


Abstract
:1. Introduction
2. Subjects and Methods
2.1. Study Population
2.2. Study Design and Diets
3. Anthropometric Measurements
4. Biochemical Parameters
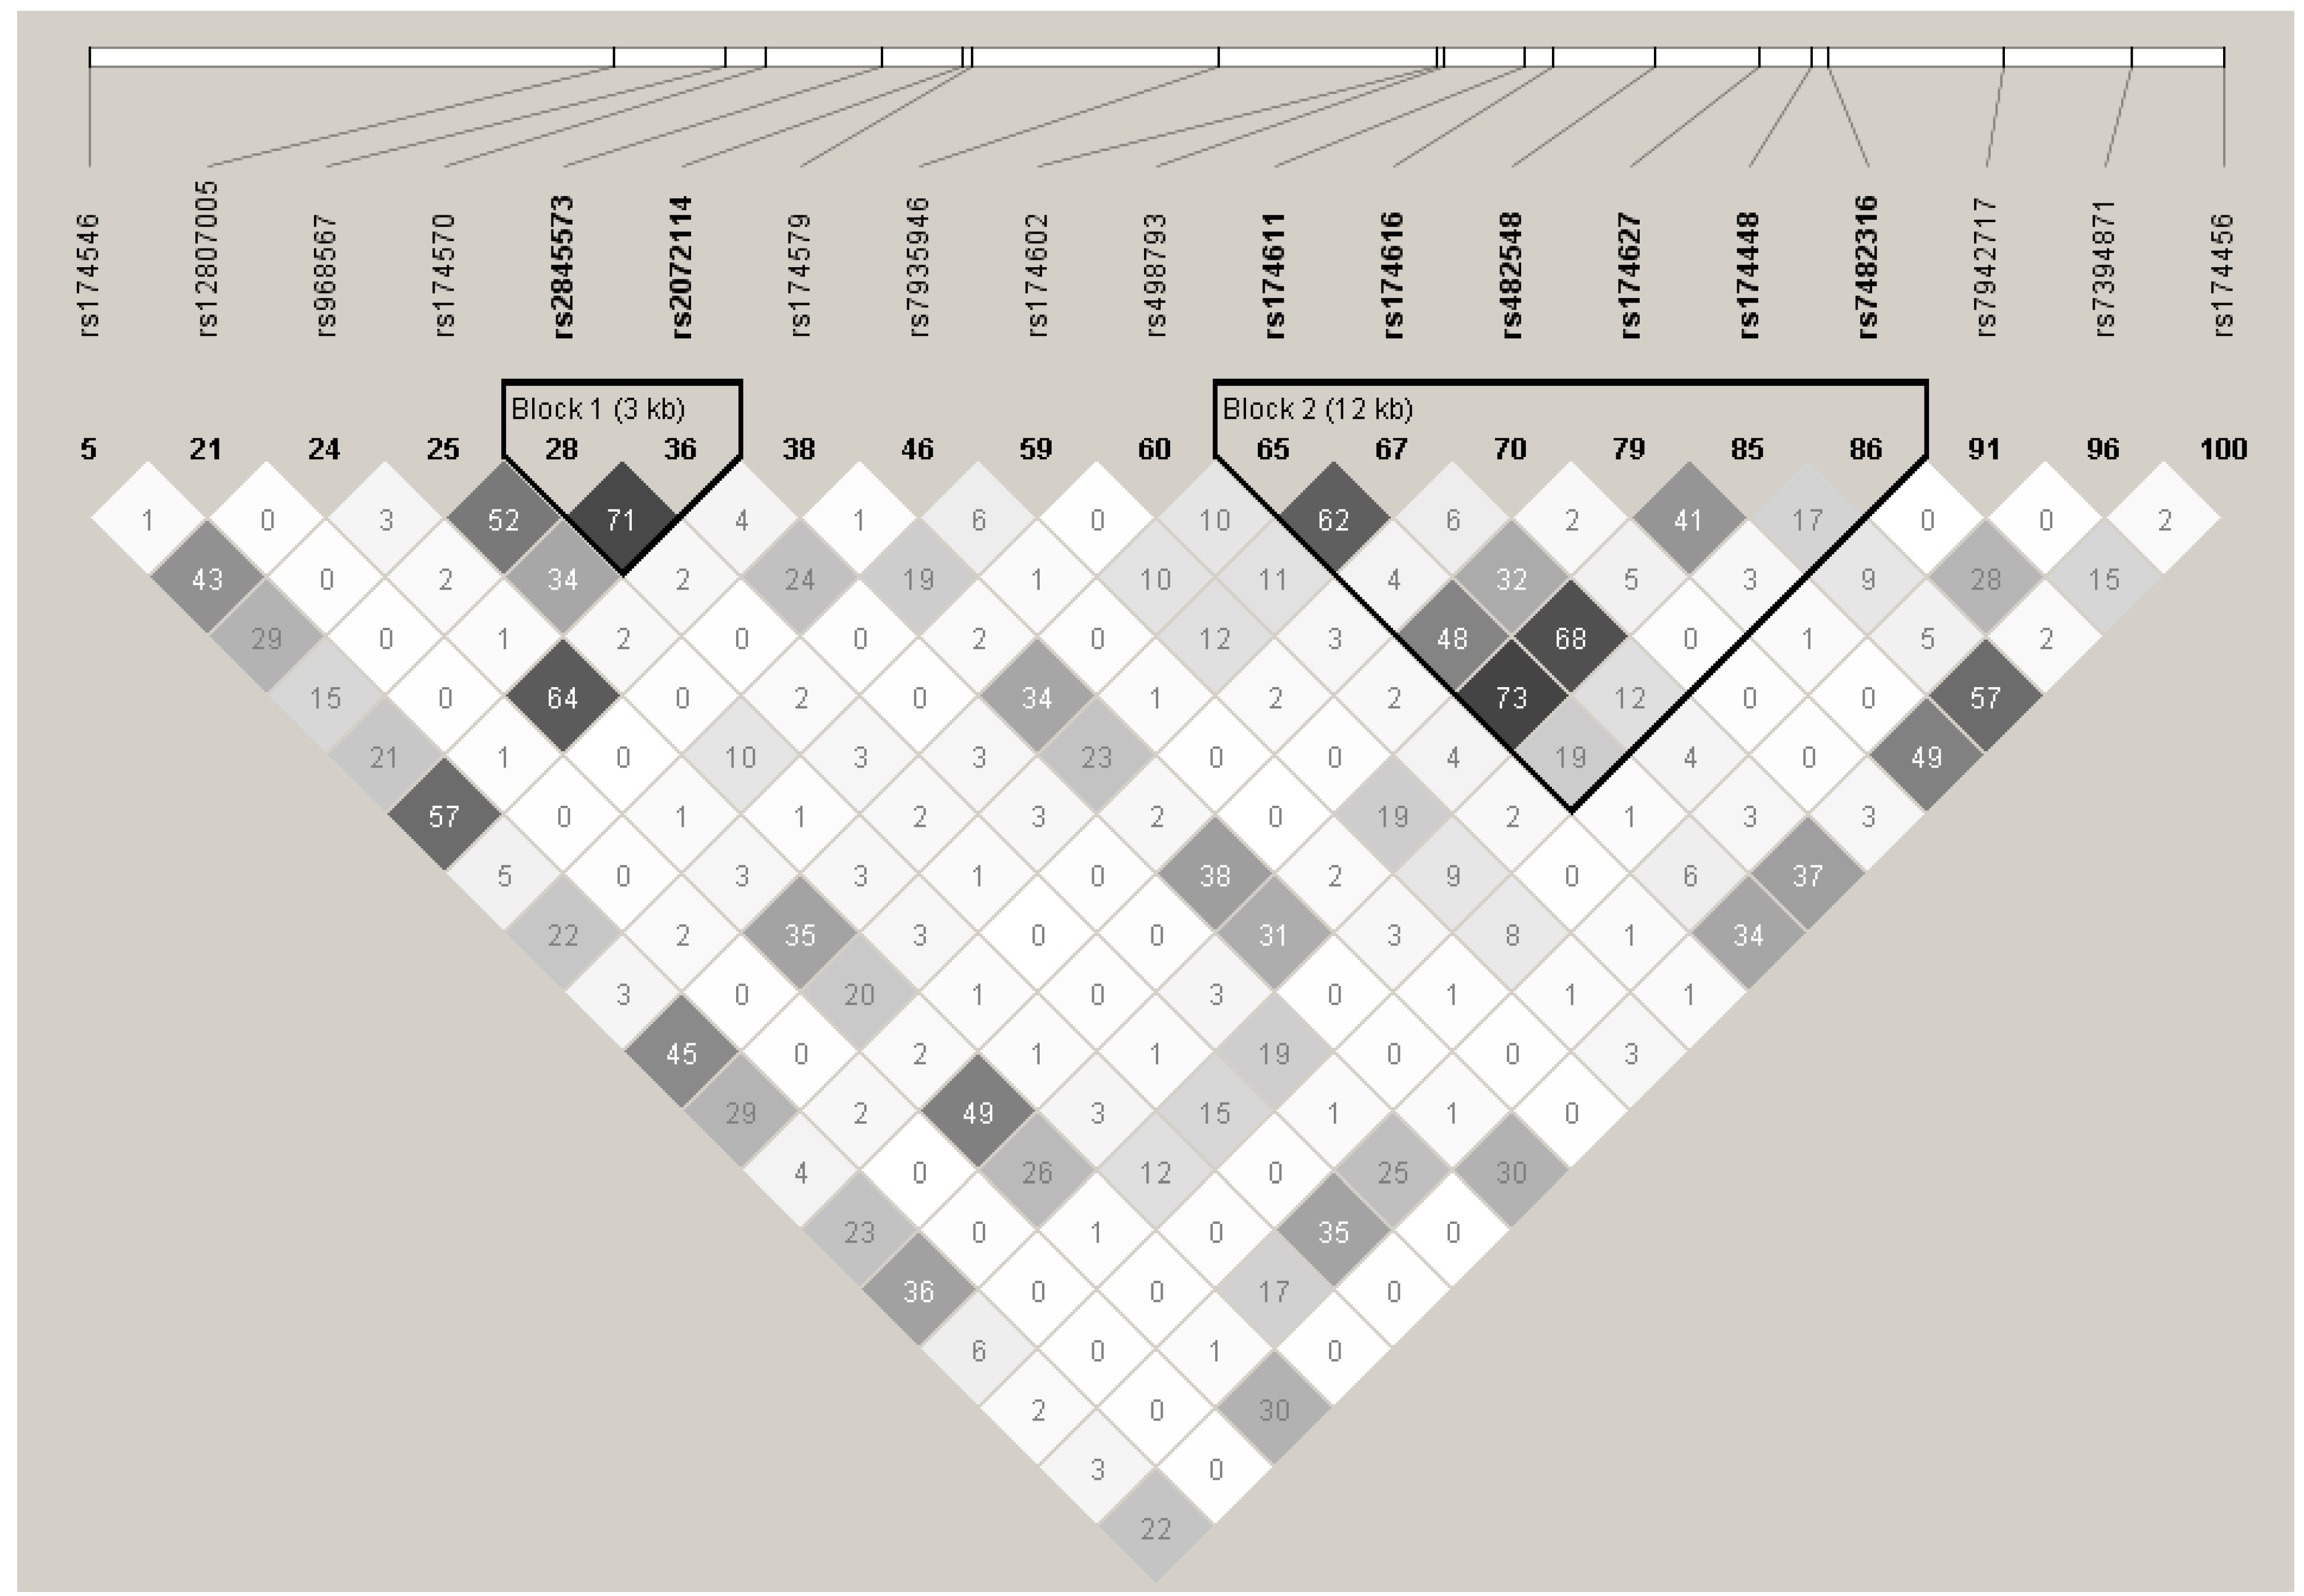
4.1. SNP Selection and Genotyping

| Gene | dbSNP No. 1 | Sequence 2 | Position | MAF | Genotype/Frequency | ||
|---|---|---|---|---|---|---|---|
| FADS3 | rs174456 | CTACTAC[A/C]TGGCAGC | intron | 0.299 | A/A (n = 102) | A/C (n = 89) | C/C (n = 18) |
| 0.488 | 0.426 | 0.086 | |||||
| Intergenic | rs174627 | TTATCTG[C/T]GTAGCTA | Intergenic | 0.124 | A/A (n = 2) | A/G (n = 48) | G/G (n = 159) |
| FADS 2- | 0.010 | 0.230 | 0.761 | ||||
| FADS 3 | |||||||
| FADS2 | rs482548 | GGGACAC[C/T]GTGGGGA | 3′ UTR | 0.126 | C/C (n = 161) | C/T (n = 40) | T/T (n = 6) |
| 0.778 | 0.193 | 0.029 | |||||
| FADS2 | rs2072114 | AGAGTTC[A/G]GGTCTTA | Intron | 0.110 | A/A (n = 167) | A/G (n = 38) | G/G (n = 4) |
| 0.799 | 0.182 | 0.019 | |||||
| Intergenic | rs12807005 | GATCATG[A/G]ATCACTG | Intergenic | 0.012 | A/A (n = 0) | A/G (n = 5) | G/G (n = 204) |
| FADS 1- | |||||||
| FADS 2 | 0.000 | 0.024 | 0.976 | ||||
| Intergenic | rs174448 | ACCCTGA[C/T]TTCTGGG | Intergenic | 0.363 | A/A (n = 78) | A/G (n = 109) | G/G (n = 21) |
| FADS 2- | |||||||
| FADS 3 | 0.375 | 0.524 | 0.101 | ||||
| FADS2 | rs2845573 | TTGCTCA[C/T]GTTACTC | Intron | 0.081 | A/A (n = 177) | A/G (n = 30) | G/G (n = 2) |
| 0.847 | 0.144 | 0.010 | |||||
| FADS3 | rs7394871 | AAGGGAC[A/C]CCTGCCC | Intron | 0.072 | A/A (n = 2) | A/C (n = 26) | C/C (n = 181) |
| 0.010 | 0.124 | 0.866 | |||||
| FADS3 | rs7942717 | CCAAACG[A/G]GTGCCTG | Intron | 0.117 | A/A (n = 161) | A/G (n = 47) | G/G (n = 1) |
| 0.770 | 0.225 | 0.005 | |||||
| Intergenic | rs7482316 | TTTTCAA[A/G]CTGCCGA | Intergenic | 0.103 | A/A (n = 168) | A/G (n = 39) | G/G (n = 2) |
| FADS 2- | |||||||
| FADS 3 | 0.804 | 0.187 | 0.010 | ||||
| FADS2 | rs174602 | CCAACCC[A/G]TCCTGC | Intron | 0.184 | C/C (n = 9) | C/T (n = 59) | T/T (n = 141) |
| 0.043 | 0.282 | 0.675 | |||||
| FADS2 | rs498793 | CTGTAAC[A/G]CAGGCTG | Intron | 0.456 | C/C (n = 62) | C/T (n = 99) | T/T (n = 43) |
| 0.098 | 0.717 | 0.186 | |||||
| FADS2 | rs7935946 | AAGGTTC[C/T]GGGAACT | Intron | 0.041 | C/C (n = 195) | C/T (n = 11) | T/T (n = 3) |
| 0.933 | 0.053 | 0.014 | |||||
| FADS1 | rs174546 | CCTCTGC[C/T]TTGGCTC | 3′ UTR | 0.297 | C/C (n = 103) | C/T (n = 86) | T/T (n = 19) |
| 0.498 | 0.412 | 0.091 | |||||
| FADS2 | rs174570 | AACTTGA[C/T]GTAGATC | Intron | 0.125 | C/C (n = 159) | C/T (n = 46) | T/T (n = 3) |
| 0.764 | 0.221 | 0.014 | |||||
| FADS2 | rs174579 | TCCCTTT[C/T]CAGGAAG | Intron | 0.202 | C/C (n = 127) | C/T (n = 78) | T/T (n = 3) |
| 0.611 | 0.375 | 0.014 | |||||
| FADS2 | rs174611 | TCCTGGA[C/T]CCTGAGA | Intron | 0.258 | C/C (n = 12) | C/T (n = 84) | T/T (n = 113) |
| 0.057 | 0.402 | 0.541 | |||||
| FADS2 | rs174616 | GACCTCA[C/T]GTTCCAA | Intron | 0.498 | A/A (n = 51) | A/G (n = 108) | G/G (n = 50) |
| 0.244 | 0.517 | 0.239 | |||||
| FADS2 | rs968567 | TCCCCGG[A/G]AGCTCAG | 5′ UTR | 0.160 | A/A (n = 2) | A/G (n = 63) | G/G (n = 144) |
| 0.010 | 0.301 | 0.689 | |||||
4.2. Gene Expression of the FADS Gene Cluster
5. Statistical Analyses
6. Results
| All 1 | Men 1 | Women 1 | p Values | ||
|---|---|---|---|---|---|
| Population: Men/Women | 208 | 96 | 112 | ||
| Age (years) | 30.8 ± 8.7 | 31.2 ± 8.1 | 30.5 ± 9.1 | 0.55 | |
| Weight (kg) 3 | 81.4 ± 13.9 | 87.2 ± 13.4 | 76.4 ± 12.3 | <0.0001 | |
| BMI (kg/m2) 2,3 | 27.8 ± 3.7 | 27.5 ± 3.6 | 28.2 ± 3.8 | 0.13 | |
| Waist circumference (cm) 3 | 93.3 ± 10.8 | 94.8 ± 11.0 | 92.0 ± 10.4 | 0.06 | |
| Cholesterol (mM) 4 | |||||
| Total | 4.82 ± 1.00 | 4.80 ± 1.00 | 4.83 ± 1.02 | 0.75 | |
| HDL | 1.46 ± 0.39 | 1.29 ± 0.31 | 1.61 ± 0.39 | <0.0001 | |
| LDL | 2.79 ± 0.87 | 2.91 ± 0.87 | 2.69 ± 0.86 | 0.08 | |
| Total chol./HDL ratio 4 | 3.49 ± 1.04 | 3.91 ± 1.13 | 3.12 ± 0.80 | <0.0001 | |
| Triacylglycerols (mM) 2,4 | 1.23 ± 0.64 | 1.32 ± 0.74 | 1.15 ± 0.53 | 0.04 | |
| ApoB100 (g/L) 4 | 0.86 ± 0.25 | 0.89 ± 0.25 | 0.84 ± 0.25 | 0.12 | |
| CRP (mg/L) 2,4 | 3.13 ± 7.10 | 1.66 ± 2.45 | 4.39 ± 9.24 | 0.02 | |
| Nutrients | Pre-n-3 PUFA | Post-n-3 PUFA | p |
|---|---|---|---|
| Energy, Kcal | 2272 ± 590 | 2143 ± 566 | 0.08 |
| Total lipids, g | 86.5 ± 29.2 | 86.6 ± 29.8 | 0.48 |
| MUFA, g | 30.8 ± 11.8 | 29.6 ± 12.4 | 0.13 |
| PUFA, g | 15.2 ± 6.6 | 17.1 ± 6.9 | 0.003 |
| SFA, g | 29.0 ± 12.0 | 25.5 ± 10.4 | 0.0008 |
| Cholesterol, mg | 303.7 ± 147.4 | 297.3 ± 169.4 | 0.41 |
| Carbohydrates, g | 286.7 ± 78.9 | 263.4 ± 77.7 | 0.0005 |
| Protein, g | 97.8 ± 30.2 | 92.6 ± 29.6 | 0.02 |
| Alcohol, g | 3.2 ± 6.0 | 3.2 ± 6.1 | 0.81 |
| SNPs | Genotype | Supplementation | Interaction |
|---|---|---|---|
| p | p | p | |
| β | β | β | |
| rs174456 | 0.77 | 0.0001 * | 0.67 |
| 0.0013 ± 0.027 | 0.081 ± 0.027 | −0.016 ± 0.038 | |
| rs174627 | 0.23 | 0.0002 * | 0.51 |
| −0.013 ± 0.031 | 0.094 ± 0.038 | −0.027 ± 0.044 | |
| rs482548 | 0.79 | 0.0001 * | 0.48 |
| −0.023 ± 0.032 | 0.048 ± 0.039 | 0.032 ± 0.045 | |
| rs2072114 | 0.85 | 0.002 * | 0.99 |
| 0.0046 ± 0.034 | 0.073 ± 0.042 | −0.00012 ± 0.047 | |
| rs12807005 | 0.06 | 0.35 | 0.68 |
| −0.13 ± 0.080 | 0.027 ± 0.11 | 0.048 ± 0.11 | |
| rs174448 | 0.22 | 0.0003 * | 0.49 |
| −0.010 ± 0.028 | 0.083 ± 0.024 | −0.027 ± 0.039 | |
| rs2845573 | 0.61 | 0.01 * | 0.57 |
| −0.028 ± 0.037 | 0.049 ± 0.048 | 0.020 ± 0.052 | |
| rs7394871 | 0.46 | 0.009 * | 0.87 |
| 0.017 ± 0.039 | 0.066 ± 0.051 | 0.0082 ± 0.055 | |
| rs7942717 | 0.56 | 0.0007 * | 0.9 |
| 0.014 ± 0.032 | 0.078 ± 0.039 | −0.0057 ± 0.045 | |
| rs7482316 | 0.69 | 0.002 * | 0.99 |
| −0.0070 ± 0.033 | 0.074 ± 0.042 | −0.0013 ± 0.047 | |
| rs174602 | 0.8 | 0.0001 * | 0.5 |
| 0.017 ± 0.029 | 0.091 ± 0.033 | −0.026 ± 0.041 | |
| rs498793 | 0.83 | 0.01* | 0.78 |
| −0.029 ± 0.029 | 0.071 ± 0.023 | 0.0080 ± 0.042 | |
| rs174546 | 0.02 * | <0.0001 * | 0.55 |
| −0.035 ± 0.027 | 0.084 ± 0.026 | −0.023 ± 0.038 | |
| rs174570 | 0.58 | 0.001 * | 0.64 |
| −0.022 ± 0.032 | 0.058 ± 0.039 | 0.020 ± 0.044 | |
| rs174611 | 0.09 | <0.0001 * | 0.7 |
| −0.025 ± 0.027 | 0.081 ± 0.028 | −0.014 ± 0.038 | |
| rs174616 | 0.37 | 0.0005 * | 0.84 |
| −0.022 ± 0.031 | 0.071 ± 0.022 | 0.0073 ± 0.044 | |
| rs968567 | 0.13 | 0.0001 * | 0.54 |
| −0.019 ± 0.029 | 0.090 ± 0.033 | −0.024 ± 0.041 |
| SNPs | Pre- n-3 PUFA supplementation | Post- n-3 PUFA supplementation | |||||
|---|---|---|---|---|---|---|---|
| 11 | 12 + 22 | p | 11 | 12 + 22 | p | ||
| rs174456 | Genotype | AA (n = 102) | AC + CC (n = 106) | AA (n = 102) | AC + CC (n = 106) | ||
| TG levels | 1.19 ± 0.61 | 1.23±0.65 | 0.45 | 1.03±0.58 | 1.01±0.47 | 0.96 | |
| rs174627 | Genotype | CC (n = 159) | AC + AA (n = 49) | CC (n = 159) | AC + AA (n = 49) | ||
| TG levels | 1.18±0.58 | 1.31±0.74 | 0.06 | 1.01±0.47 | 1.05±0.66 | 0.55 | |
| rs482548 | Genotype | CC (n = 161) | CT + TT (n = 46) | CC (n = 161) | CT+TT (n = 46) | ||
| TG levels | 1.22±0.64 | 1.17±0.58 | 0.62 | 1.02±0.53 | 1.03±0.50 | 0.29 | |
| rs2072114 | Genotype | AA (n = 166) | AG + GG (n = 42) | AA (n = 166) | AG + GG (n = 42) | ||
| TG levels | 1.20±0.64 | 1.22±0.59 | 0.83 | 1.02±0.55 | 1.03±0.42 | 0.87 | |
| rs12807005 | Genotype | CC (n = 204) | AC + AA (n = 4) | CC (n = 204) | AC + AA (n = 4) | ||
| TG levels | 1.21±0.63 | 1.26± 0.52 | 0.15 | 1.01±0.52 | 1.21±0.53 | 0.02 * | |
| rs174448 | Genotype | AA (n = 78) | AG + GG (n = 130) | AA (n = 78) | AG + GG (n = 130) | ||
| TG levels | 1.14±0.57 | 1.25±0.66 | 0.06 | 0.99±0.50 | 1.04±0.54 | 0.59 | |
| rs2845573 | Genotype | AA (n = 176) | AG + GG (n = 32) | AA (n = 176) | AG + GG (n = 32) | ||
| TG levels | 1.22±0.67 | 1.15±0.36 | 0.98 | 1.02±0.54 | 1.05±0.39 | 0.30 | |
| rs7394871 | Genotype | CC (n = 180) | AC + AA (n = 28) | CC (n = 180) | AC + AA (n = 28) | ||
| TG levels | 1.22±0.65 | 1.13±0.42 | 0.37 | 1.03±0.54 | 0.98±0.40 | 0.53 | |
| rs7942717 | Genotype | AA (n = 160) | AG + GG (n = 48) | AA (n = 160) | AG + GG (n = 48) | ||
| TG levels | 1.20±0.59 | 1.25±0.73 | 0.64 | 1.02±0.52 | 1.04±0.53 | 0.61 | |
| rs7482316 | Genotype | AA (n = 167) | AG + GG (n = 41) | AA (n = 167) | AG + GG (n = 41) | ||
| TG levels | 1.19±0.58 | 1.28±0.79 | 0.73 | 1.01±0.52 | 1.07±0.55 | 0.77 | |
| rs174602 | Genotype | TT (n = 140) | CT + TT (n = 68) | TT (n = 140) | CT + TT (n = 68) | ||
| TG levels | 1.19±0.61 | 1.24±0.67 | 0.65 | 1.03±0.56 | 0.99±0.44 | 0.42 | |
| rs498793 | Genotype | CC (n = 62) | CT + TT (n = 142) | CC (n = 62) | CT + TT (n = 142) | ||
| TG levels | 1.19±0.67 | 1.21±0.61 | 0.30 | 0.99±0.54 | 1.03±0.52 | 0.17 | |
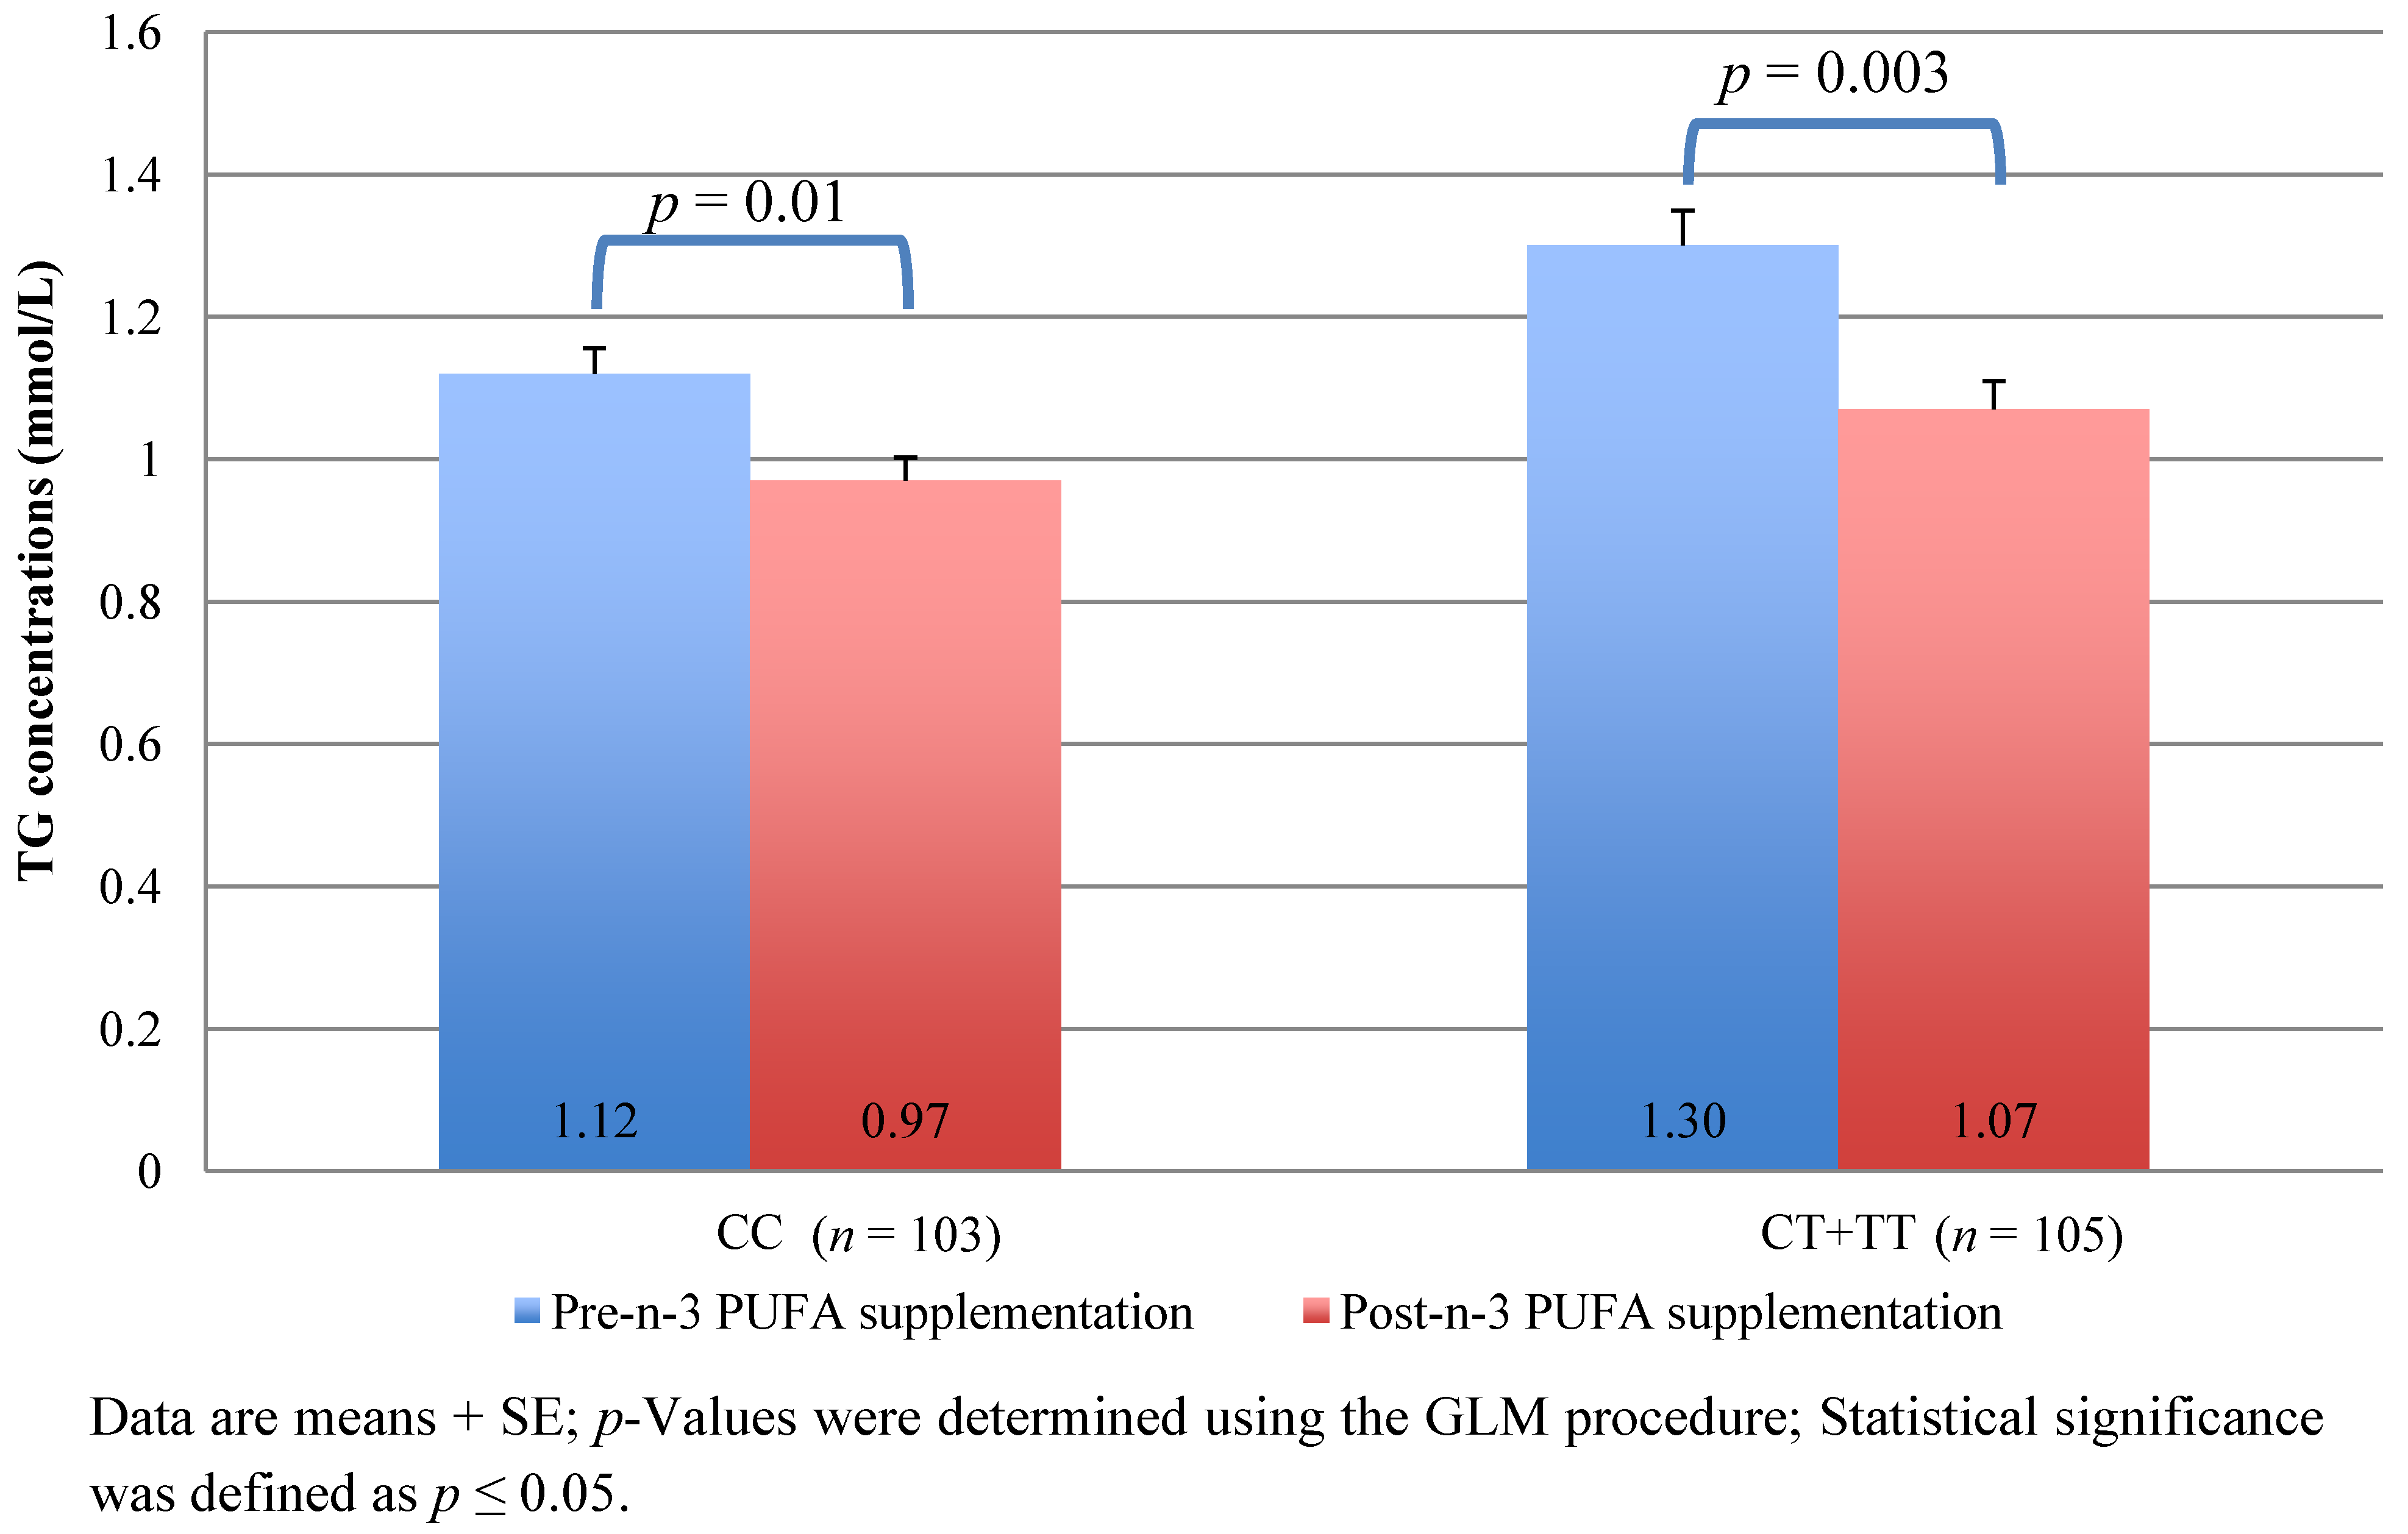
| rs174546 | Genotype | CC (n = 103) | CT + TT (n = 105) | CC (n = 103) | CT + TT (n = 105) | ||
| TG levels | 1.12±0.51 | 1.30±0.71 | 0.002 * | 0.97±0.46 | 1.07±0.58 | 0.07 | |
| rs174570 | Genotype | CC (n = 159) | CT + TT (n = 49) | CC (n = 159) | CT + TT (n = 49) | ||
| TG levels | 1.21±0.65 | 1.19±0.54 | 0.91 | 1.01±0.54 | 1.06±0.46 | 0.33 | |
| rs174611 | Genotype | TT (n = 113) | CT + CC (n = 95) | TT (n = 113) | CT + CC (n = 95) | ||
| TG levels | 1.14±0.48 | 1.29±0.75 | 0.04 * | 0.99±0.45 | 1.06±0.60 | 0.19 | |
| rs174616 | Genotype | AA (n = 51) | AG + GG (n = 157) | AA (n = 51) | AG + GG (n = 157) | ||
| TG levels | 1.24±0.73 | 1.20±0.59 | 0.48 | 1.00±0.53 | 1.03±0.52 | 0.32 | |
| rs968567 | Genotype | GG (n = 143) | AG + GG (n = 65) | GG (n = 143) | AG + GG (n = 65) | ||
| TG levels | 1.17±0.58 | 1.30±0.71 | 0.03 * | 1.00±0.47 | 1.06±0.62 | 0.36 | |
7. Discussion
8. Conclusions
Acknowledgements
Authors’ Contribution to Manuscript
References
- Sarwar, N.; Danesh, J.; Eiriksdottir, G.; Sigurdsson, G.; Wareham, N.; Bingham, S.; Boekholdt, S.M.; Khaw, K.T.; Gudnason, V. Triglycerides and the risk of coronary heart disease: 10,158 Incident cases among 262,525 participants in 29 Western prospective studies. Circulation 2007, 115, 450–458. [Google Scholar]
- Carroll, M.D.; Lacher, D.A.; Sorlie, P.D.; Cleeman, J.I.; Gordon, D.J.; Wolz, M.; Grundy, S.M.; Johnson, C.L. Trends in serum lipids and lipoproteins of adults, 1960–2002. JAMA 2005, 294, 1773–1781. [Google Scholar]
- Flegal, K.M.; Carroll, M.D.; Ogden, C.L.; Curtin, L.R. Prevalence and trends in obesity among US adults, 1999–2008. JAMA 2010, 303, 235–241. [Google Scholar]
- Cullen, P. Evidence that triglycerides are an independent coronary heart disease risk factor. Am. J. Cardiol. 2000, 86, 943–949. [Google Scholar]
- Hokanson, J.E.; Austin, M.A. Plasma triglyceride level is a risk factor for cardiovascular disease independent of high-density lipoprotein cholesterol level: A meta-analysis of population-based prospective studies. J. Cardiovasc. Risk 1996, 3, 213–219. [Google Scholar] [CrossRef]
- Harris, W. Fish oil and plasma lipids and lipoprotein metabolism in humans; a critical review. J. Lipid Res. 1989, 30, 785–807. [Google Scholar]
- Weber, P.; Raederstorff, D. Triglyceride-lowering effect of omega-3 LC-polyunsaturated fatty acids—A review. Nutr. Metab. Cardiovasc. Dis. 2000, 10, 28–37. [Google Scholar]
- Harris, W.S. n-3 Fatty acids and serum lipoproteins; human studies. Am. J. Clin. Nutr. 1997, 65, 1645S–1654S. [Google Scholar]
- Durrington, P.N.; Bhatnagar, D.; Mackness, M.I.; Morgan, J.; Julier, K.; Khan, M.A.; France, M. An omega-3 polyunsaturated fatty acid concentrate administered for one year decreased triglycerides in simvastatin treated patients with coronary heart disease and persisting hypertriglyceridaemia. Heart 2001, 85, 544–548. [Google Scholar] [CrossRef]
- Hooper, L.; Thompson, R.L.; Harrison, R.A.; Summerbell, C.D.; Ness, A.R.; Moore, H.J.; Worthington, H.V.; Durrington, P.N.; Higgins, J.P.; Capps, N.E.; et al. Risks and benefits of omega 3 fats for mortality, cardiovascular disease, and cancer: Systematic review. BMJ 2006, 332, 752–760. [Google Scholar]
- Bucher, H.C.; Hengstler, P.; Schindler, C.; Meier, G. n-3 Polyunsaturated fatty acids in coronary heart disease: A meta-analysis of randomized controlled trials. Am. J. Med. 2002, 112, 298–304. [Google Scholar] [CrossRef]
- Kris-Etherton, P.M.; Harris, W.S.; Appel, L.J. Fish consumption, fish oil, omega-3 fatty acids, and cardiovascular disease. Arterioscler. Thromb. Vasc. Biol. 2003, 23, e20–e30. [Google Scholar] [CrossRef]
- Harris, W.S.; Bulchandani, D. Why do omega-3 fatty acids lower serum triglycerides? Curr. Opin. Lipidol. 2006, 17, 387–393. [Google Scholar] [CrossRef]
- Caslake, M.J.; Miles, E.A.; Kofler, B.M.; Lietz, G.; Curtis, P.; Armah, C.K.; Kimber, A.C.; Grew, J.P.; Farrell, L.; Stannard, J.; et al. Effect of sex and genotype on cardiovascular biomarker response to fish oils: The FINGEN Study. Am. J. Clin. Nutr. 2008, 88, 618–629. [Google Scholar]
- Madden, J.; Williams, C.M.; Calder, P.C.; Lietz, G.; Miles, E.A.; Cordell, H.; Mathers, J.C.; Minihane, A.M. The impact of common gene variants on the response of biomarkers of cardiovascular disease (CVD) risk to increased fish oil fatty acids intakes. Annu. Rev. Nutr. 2011, 31, 203–234. [Google Scholar] [CrossRef]
- Masson, L.F.; McNeill, G.; Avenell, A. Genetic variation and the lipid response to dietary intervention: A systematic review. Am. J. Clin. Nutr. 2003, 77, 1098–1111. [Google Scholar]
- Malerba, G.; Schaeffer, L.; Xumerle, L.; Klopp, N.; Trabetti, E.; Biscuola, M.; Cavallari, U.; Galavotti, R.; Martinelli, N.; Guarini, P.; et al. SNPs of the FADS gene cluster are associated with polyunsaturated fatty acids in a cohort of patients with cardiovascular disease. Lipids 2008, 43, 289–299. [Google Scholar] [CrossRef]
- Warensjo, E.; Rosell, M.; Hellenius, M.L.; Vessby, B.; De Faire, U.; Riserus, U. Associations between estimated fatty acid desaturase activities in serum lipids and adipose tissue in humans: Links to obesity and insulin resistance. Lipids Health Dis. 2009, 8, 37. [Google Scholar] [CrossRef]
- Rzehak, P.; Heinrich, J.; Klopp, N.; Schaeffer, L.; Hoff, S.; Wolfram, G.; Illig, T.; Linseisen, J. Evidence for an association between genetic variants of the fatty acid desaturase 1 fatty acid desaturase 2 (FADS1 FADS2) gene cluster and the fatty acid composition of erythrocyte membranes. Br. J. Nutr. 2009, 101, 20–26. [Google Scholar] [CrossRef]
- Marquardt, A.; Stohr, H.; White, K.; Weber, B.H. cDNA cloning, genomic structure, and chromosomal localization of three members of the human fatty acid desaturase family. Genomics 2000, 66, 175–183. [Google Scholar]
- Goulet, J.; Nadeau, G.; Lapointe, A.; Lamarche, B.; Lemieux, S. Validity and reproducibility of an interviewer-administered food frequency questionnaire for healthy French-Canadian men and women. Nutr. J. 2004, 3. [Google Scholar]
- Callaway, C.W.; Chumlea, W.C.; Bouchard, C.; Himes, J.H.; Lohman, T.G.; Martin, A.D.; Mitchell, C.D.; Mueller, W.H.; Roche, A.F.; Seefeldt, V.D. Standardization of Anthropometric Measurements. In The Airlie (VA) Consensus Conference; Lohman, T., Roche, A., Martorel, R., Eds.; Human Kinetics Publishers: Champaign, IR, USA, 1988; pp. 39–80. [Google Scholar]
- McNamara, J.R.; Schaefer, E.J. Automated enzymatic standardized lipid analyses for plasma and lipoprotein fractions. Clin. Chim. Acta 1987, 166, 1–8. [Google Scholar] [CrossRef]
- Albers, J.J.; Warnick, G.R.; Wiebe, D.; King, P.; Steiner, P.; Smith, L.; Breckenridge, C.; Chow, A.; Kuba, K.; Weidman, S.; et al. Multi-laboratory comparison of three heparin-Mn2+ precipitation procedures for estimating cholesterol in high-density lipoprotein. Clin. Chem. 1978, 24, 853–856. [Google Scholar]
- Friedewald, W.T.; Levy, R.I.; Fredrickson, D.S. Estimation of the concentration of low-density lipoprotein cholesterol in plasma, without use of the preparative ultracentrifuge. Clin. Chem. 1972, 18, 499–502. [Google Scholar]
- Laurell, C.B. Quantitative estimation of proteins by electrophoresis in agarose gel containing antibodies. Anal. Biochem. 1966, 15, 45–52. [Google Scholar] [CrossRef]
- Pirro, M.; Bergeron, J.; Dagenais, G.R.; Bernard, P.M.; Cantin, B.; Despres, J.P.; Lamarche, B. Age and duration of follow-up as modulators of the risk for ischemic heart disease associated with high plasma C-reactive protein levels in men. Arch. Intern. Med. 2001, 161, 2474–2480. [Google Scholar] [CrossRef]
- Livak, K.J. Allelic discrimination using fluorogenic probes and the 5′ nuclease assay. Genet. Anal. 1999, 14, 143–149. [Google Scholar] [CrossRef]
- Miller, M.; Stone, N.J.; Ballantyne, C.; Bittner, V.; Criqui, M.H.; Ginsberg, H.N.; Goldberg, A.C.; Howard, W.J.; Jacobson, M.S.; Kris-Etherton, P.M.; et al. Triglycerides and cardiovascular disease: A scientific statement from the American Heart Association. Circulation 2011, 123, 2292–2333. [Google Scholar] [CrossRef]
- Sprecher, H.; Luthria, D.L.; Mohammed, B.S.; Baykousheva, S.P. Reevaluation of the pathways for the biosynthesis of polyunsaturated fatty acids. J. Lipid Res. 1995, 36, 2471–2477. [Google Scholar]
- Tanaka, T.; Shen, J.; Abecasis, G.R.; Kisialiou, A.; Ordovas, J.M.; Guralnik, J.M.; Singleton, A.; Bandinelli, S.; Cherubini, A.; Arnett, D.; Tsai, M.Y.; Ferrucci, L. Genome-wide association study of plasma polyunsaturated fatty acids in the InCHIANTI Study. PLoS Genet. 2009, 5, e1000338. [Google Scholar] [CrossRef]
- Dumont, J.; Huybrechts, I.; Spinneker, A.; Gottrand, F.; Grammatikaki, E.; Bevilacqua, N.; Vyncke, K.; Widhalm, K.; Kafatos, A.; Molnar, D.; et al. FADS1 genetic variability interacts with dietary alpha-linolenic acid intake to affect serum non-HDL-cholesterol concentrations in European adolescents. J. Nutr. 2011, 141, 1247–1253. [Google Scholar] [CrossRef]
- Lu, Y.; Feskens, E.J.; Dolle, M.E.; Imholz, S.; Verschuren, W.M.; Muller, M.; Boer, J.M. Dietary n-3 and n-6 polyunsaturated fatty acid intake interacts with FADS1 genetic variation to affect total and HDL-cholesterol concentrations in the Doetinchem Cohort Study. Am. J. Clin. Nutr. 2010, 92, 258–265. [Google Scholar] [CrossRef]
- Merino, D.M.; Johnston, H.; Clarke, S.; Roke, K.; Nielsen, D.; Badawi, A.; El-Sohemy, A.; Ma, D.W.; Mutch, D.M. Polymorphisms in FADS1 and FADS2 alter desaturase activity in young Caucasian and Asian adults. Mol. Genet. Metab. 2011, 103, 171–178. [Google Scholar] [CrossRef]
- Ameur, A.; Enroth, S.; Johansson, A.; Zaboli, G.; Igl, W.; Johansson, A.C.V.; Rivas, M.A.; Daly, M.J.; Schmitz, G.; Hicks, A.A.; et al. Genetic adaptation of fatty-acid metabolism: A human-specific haplotype increasing the biosynthesis of long-chain omega-3 and omega-6 fatty acids. Am. J. Hum. Genet. 2012, 90, 809–820. [Google Scholar] [CrossRef]
- Minihane, A.M. Fatty acid-genotype interactions and cardiovascular risk. Prostaglandins Leukot. Essent. Fatty Acids 2010, 82, 259–264. [Google Scholar] [CrossRef]
- Warnick, G.R.; Albers, J.J. Physiological and analytical variation in cholesterol and triglycerides. Lipids 1976, 11, 203–208. [Google Scholar] [CrossRef]
© 2012 by the authors; licensee MDPI, Basel, Switzerland. This article is an open-access article distributed under the terms and conditions of the Creative Commons Attribution license (http://creativecommons.org/licenses/by/3.0/).
Share and Cite
Cormier, H.; Rudkowska, I.; Paradis, A.-M.; Thifault, E.; Garneau, V.; Lemieux, S.; Couture, P.; Vohl, M.-C. Association between Polymorphisms in the Fatty Acid Desaturase Gene Cluster and the Plasma Triacylglycerol Response to an n-3 PUFA Supplementation. Nutrients 2012, 4, 1026-1041. https://doi.org/10.3390/nu4081026
Cormier H, Rudkowska I, Paradis A-M, Thifault E, Garneau V, Lemieux S, Couture P, Vohl M-C. Association between Polymorphisms in the Fatty Acid Desaturase Gene Cluster and the Plasma Triacylglycerol Response to an n-3 PUFA Supplementation. Nutrients. 2012; 4(8):1026-1041. https://doi.org/10.3390/nu4081026
Chicago/Turabian StyleCormier, Hubert, Iwona Rudkowska, Ann-Marie Paradis, Elisabeth Thifault, Véronique Garneau, Simone Lemieux, Patrick Couture, and Marie-Claude Vohl. 2012. "Association between Polymorphisms in the Fatty Acid Desaturase Gene Cluster and the Plasma Triacylglycerol Response to an n-3 PUFA Supplementation" Nutrients 4, no. 8: 1026-1041. https://doi.org/10.3390/nu4081026
APA StyleCormier, H., Rudkowska, I., Paradis, A.-M., Thifault, E., Garneau, V., Lemieux, S., Couture, P., & Vohl, M.-C. (2012). Association between Polymorphisms in the Fatty Acid Desaturase Gene Cluster and the Plasma Triacylglycerol Response to an n-3 PUFA Supplementation. Nutrients, 4(8), 1026-1041. https://doi.org/10.3390/nu4081026