
The Association Between Metabolic Score for Visceral Fat and Cognitive Function Among Older Adults in the United States

Abstract
1. Introduction
2. Materials and Methods
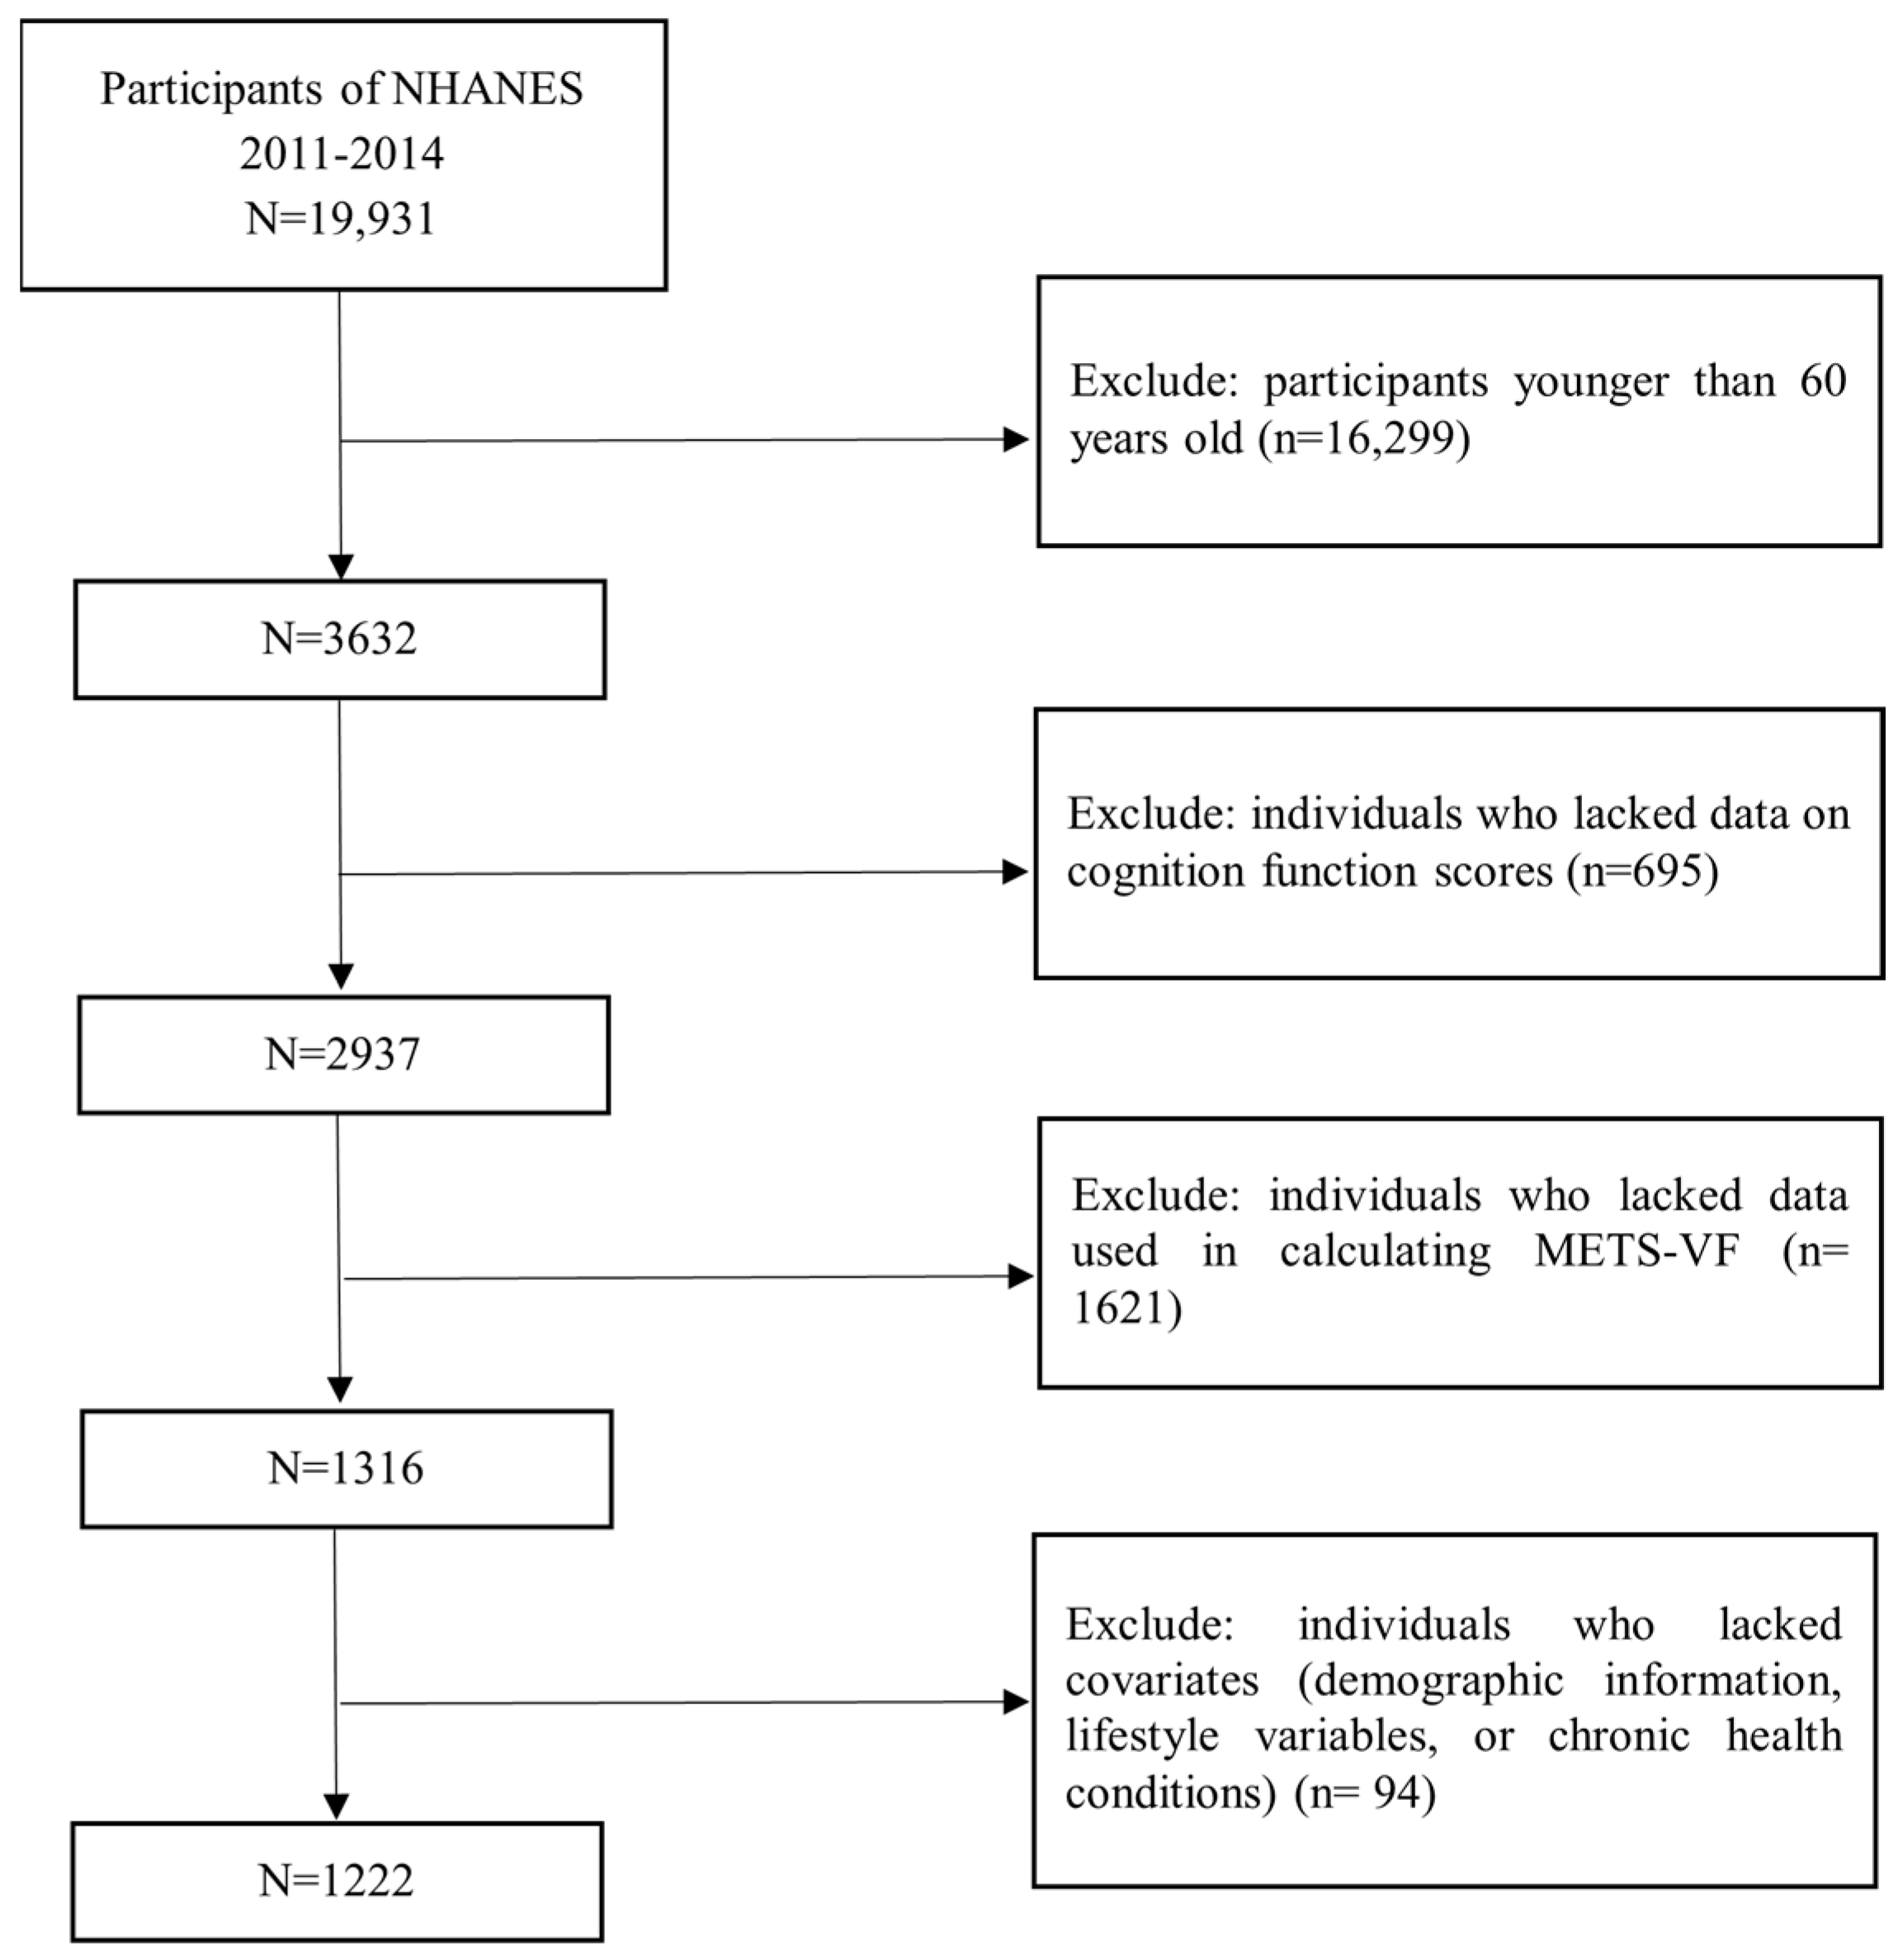
2.1. Study Population
2.2. Assessment of METS-VF and Obesity
2.3. Assessment of Cognitive Function
2.4. Assessment of Covariates
2.5. Statistical Analysis
3. Results
4. Discussion
5. Conclusions
Author Contributions
Funding
Institutional Review Board Statement
Informed Consent Statement
Data Availability Statement
Acknowledgments
Conflicts of Interest
References
- World Population Policies|Population Division. Available online: https://www.un.org/development/desa/pd/data/world-population-policies (accessed on 28 October 2023).
- Vega, J.N.; Newhouse, P.A. Mild Cognitive Impairment: Diagnosis, Longitudinal Course, and Emerging Treatments. Curr. Psychiatry Rep. 2014, 16, 490. [Google Scholar] [CrossRef] [PubMed]
- GBD 2019 Dementia Forecasting Collaborators Estimation of the Global Prevalence of Dementia in 2019 and Forecasted Prevalence in 2050: An Analysis for the Global Burden of Disease Study 2019. Lancet Public Health 2022, 7, e105–e125. [CrossRef]
- Corona, G.; Rastrelli, G.; Filippi, S.; Vignozzi, L.; Mannucci, E.; Maggi, M. Erectile Dysfunction and Central Obesity: An Italian Perspective. Asian J. Androl. 2014, 16, 581–591. [Google Scholar] [CrossRef]
- Elias, M.F.; Elias, P.K.; Sullivan, L.M.; Wolf, P.A.; D’Agostino, R.B. Obesity, Diabetes and Cognitive Deficit: The Framingham Heart Study. Neurobiol. Aging 2005, 26 (Suppl. S1), 11–16. [Google Scholar] [CrossRef]
- Li, X.; Shi, X.; Tan, Y.; Yu, Y.; Tang, C.; Xu, G.; Zhang, X.; Liao, H.; Mai, X.; Chen, W.; et al. Metabolic Indexes of Obesity in Patients with Common Mental Disorders in Stable Stage. BMC Psychiatry 2022, 22, 91. [Google Scholar] [CrossRef]
- Więckowska-Gacek, A.; Mietelska-Porowska, A.; Wydrych, M.; Wojda, U. Western Diet as a Trigger of Alzheimer’s Disease: From Metabolic Syndrome and Systemic Inflammation to Neuroinflammation and Neurodegeneration. Ageing Res. Rev. 2021, 70, 101397. [Google Scholar] [CrossRef]
- Coppin, G.; Nolan-Poupart, S.; Jones-Gotman, M.; Small, D.M. Working Memory and Reward Association Learning Impairments in Obesity. Neuropsychologia 2014, 65, 146–155. [Google Scholar] [CrossRef]
- Dye, L.; Boyle, N.B.; Champ, C.; Lawton, C. The Relationship between Obesity and Cognitive Health and Decline. Proc. Nutr. Soc. 2017, 76, 443–454. [Google Scholar] [CrossRef]
- Isaac, V.; Sim, S.; Zheng, H.; Zagorodnov, V.; Tai, E.S.; Chee, M. Adverse Associations between Visceral Adiposity, Brain Structure, and Cognitive Performance in Healthy Elderly. Front. Aging Neurosci. 2011, 3, 12. [Google Scholar] [CrossRef] [PubMed]
- Nuttall, F.Q. Body Mass Index: Obesity, BMI, and Health: A Critical Review. Nutr. Today 2015, 50, 117–128. [Google Scholar] [CrossRef] [PubMed]
- Poirier, P.; Després, J.-P. Waist Circumference, Visceral Obesity, and Cardiovascular Risk. J. Cardiopulm. Rehabil. 2003, 23, 161–169. [Google Scholar] [CrossRef]
- Anand, S.S.; Friedrich, M.G.; Lee, D.S.; Awadalla, P.; Després, J.P.; Desai, D.; de Souza, R.J.; Dummer, T.; Parraga, G.; Larose, E.; et al. Evaluation of Adiposity and Cognitive Function in Adults. JAMA Netw. Open 2022, 5, e2146324. [Google Scholar] [CrossRef]
- Debette, S.; Beiser, A.; Hoffmann, U.; Decarli, C.; O’Donnell, C.J.; Massaro, J.M.; Au, R.; Himali, J.J.; Wolf, P.A.; Fox, C.S.; et al. Visceral Fat Is Associated with Lower Brain Volume in Healthy Middle-Aged Adults. Ann. Neurol. 2010, 68, 136–144. [Google Scholar] [CrossRef] [PubMed]
- Bello-Chavolla, O.Y.; Antonio-Villa, N.E.; Vargas-Vázquez, A.; Viveros-Ruiz, T.L.; Almeda-Valdes, P.; Gomez-Velasco, D.; Mehta, R.; Elias-López, D.; Cruz-Bautista, I.; Roldán-Valadez, E.; et al. Metabolic Score for Visceral Fat (METS-VF), a Novel Estimator of Intra-Abdominal Fat Content and Cardio-Metabolic Health. Clin. Nutr. 2020, 39, 1613–1621. [Google Scholar] [CrossRef]
- Liu, H.; Dong, H.; Zhou, Y.; Jin, M.; Hao, H.; Yuan, Y.; Jia, H. The Association between Metabolic Score for Visceral Fat and Depression in Overweight or Obese Individuals: Evidence from NHANES. Front. Endocrinol. 2024, 15, 1482003. [Google Scholar] [CrossRef] [PubMed]
- Zhu, Y.; Zou, H.; Guo, Y.; Luo, P.; Meng, X.; Li, D.; Xiang, Y.; Mao, B.; Pan, L.; Kan, R.; et al. Associations between Metabolic Score for Visceral Fat and the Risk of Cardiovascular Disease and All-Cause Mortality among Populations with Different Glucose Tolerance Statuses. Diabetes Res. Clin. Pract. 2023, 203, 110842. [Google Scholar] [CrossRef] [PubMed]
- Wu, W.; Pei, Y.; Wang, J.; Liang, Q.; Chen, W. Association between Visceral Lipid Accumulation Indicators and Gallstones: A Cross-Sectional Study Based on NHANES 2017–2020. Lipids Health Dis. 2024, 23, 345. [Google Scholar] [CrossRef] [PubMed]
- NHANES Questionnaires, Datasets, and Related Documentation. Available online: https://wwwn.cdc.gov/nchs/nhanes/default.aspx (accessed on 7 January 2025).
- Cheung, C.-L.; Sahni, S.; Cheung, B.M.Y.; Sing, C.-W.; Wong, I.C.K. Vitamin K Intake and Mortality in People with Chronic Kidney Disease from NHANES III. Clin. Nutr. 2015, 34, 235–240. [Google Scholar] [CrossRef] [PubMed]
- Schwartz, D.H.; Leonard, G.; Perron, M.; Richer, L.; Syme, C.; Veillette, S.; Pausova, Z.; Paus, T. Visceral Fat Is Associated with Lower Executive Functioning in Adolescents. Int. J. Obes. 2013, 37, 1336. [Google Scholar] [CrossRef]
- Darweesh, S.K.L.; Wolters, F.J.; Ikram, M.A.; de Wolf, F.; Bos, D.; Hofman, A. Inflammatory Markers and the Risk of Dementia and Alzheimer’s Disease: A Meta-Analysis. Alzheimer’s Dement. 2018, 14, 1450–1459. [Google Scholar] [CrossRef]
- Association between Visceral Fat and Brain Structural Changes or Cognitive Function. Available online: https://www.mdpi.com/2076-3425/11/8/1036 (accessed on 14 November 2024).
- Lampe, L.; Zhang, R.; Beyer, F.; Huhn, S.; Kharabian Masouleh, S.; Preusser, S.; Bazin, P.-L.; Schroeter, M.L.; Villringer, A.; Witte, A.V. Visceral Obesity Relates to Deep White Matter Hyperintensities via Inflammation. Ann. Neurol. 2019, 85, 194–203. [Google Scholar] [CrossRef] [PubMed]
- Forny-Germano, L.; De Felice, F.G.; Vieira, M.N.d.N. The Role of Leptin and Adiponectin in Obesity-Associated Cognitive Decline and Alzheimer’s Disease. Front. Neurosci. 2018, 12, 1027. [Google Scholar] [CrossRef] [PubMed]
- Kim, J.Y.; Barua, S.; Jeong, Y.J.; Lee, J.E. Adiponectin: The Potential Regulator and Therapeutic Target of Obesity and Alzheimer’s Disease. Int. J. Mol. Sci. 2020, 21, 6419. [Google Scholar] [CrossRef] [PubMed]
- Gruzdeva, O.; Borodkina, D.; Uchasova, E.; Dyleva, Y.; Barbarash, O. Leptin Resistance: Underlying Mechanisms and Diagnosis. Diabetes Metab. Syndr. Obes. 2019, 12, 191–198. [Google Scholar] [CrossRef]
- Hackert, V.H.; den Heijer, T.; Oudkerk, M.; Koudstaal, P.J.; Hofman, A.; Breteler, M.M.B. Hippocampal Head Size Associated with Verbal Memory Performance in Nondemented Elderly. Neuroimage 2002, 17, 1365–1372. [Google Scholar] [CrossRef] [PubMed]


| Characteristics | All Participants | Quartile of METS-VF | p-Value | |||
|---|---|---|---|---|---|---|
| Q1 (5.44–6.95) | Q2 (6.95–7.30) | Q3 (7.30–7.57) | Q4 (7.57–8.22) | |||
| No. of participants | 1222 | 306 | 305 | 306 | 305 | |
| Age, median (IQR) c | 69 (63, 76) | 66 (63, 72) | 68 (63, 75) | 69 (64, 76) | 70 (65, 77) | <0.001 |
| Gender, n (%) b | ||||||
| Male | 603 (49.35) | 94 (30.72) | 128 (41.97) | 161 (52.61) | 220 (72.13) | <0.001 |
| Female | 619 (50.65) | 212 (69.28) | 177 (58.03) | 145 (47.39) | 85 (27.87) | |
| Race, n (%) b | ||||||
| Mexican American | 108 (8.84) | 20 (6.54) | 22 (7.21) | 31 (10.13) | 35 (11.48) | <0.001 |
| Non-Hispanic White | 619 (50.65) | 151 (49.35) | 155 (50.82) | 142 (46.41) | 171 (56.07) | |
| Non-Hispanic Black | 245 (20.05) | 59 (19.28) | 68 (22.30) | 63 (20.59) | 55 (18.03) | |
| Other Hispanic | 128 (10.47) | 22 (7.19) | 34 (11.15) | 42 (13.73) | 30 (9.84) | |
| Other | 122 (9.98) | 54 (17.65) | 26 (8.52) | 28 (9.15) | 14 (4.59) | |
| Marital status, n (%) b | ||||||
| Married | 726 (59.41) | 176 (57.52) | 188 (61.64) | 180 (58.82) | 182 (59.67) | 0.674 |
| Widowed/Divorced/Separated | 388 (31.75) | 94 (30.72) | 90 (29.51) | 104 (33.99) | 100 (32.79) | |
| Never married | 70 (5.73) | 24 (7.84) | 16 (5.25) | 15 (4.90) | 15 (4.92) | |
| Living with a partner | 38 (3.11) | 12 (3.92) | 11 (3.61) | 7 (2.29) | 8 (2.62) | |
| BMI, mean (SD) a | 28.99 (6.13) | 23.14 (2.72) | 26.93 (2.76) | 30.22 (3.71) | 35.71 (6.04) | <0.001 |
| Education, n (%) b | ||||||
| ≤12 years | 305 (24.96) | 61 (19.93) | 73 (23.93) | 84 (27.45) | 87 (28.52) | 0.061 |
| >12 years | 917 (75.04) | 245 (80.07) | 232 (76.07) | 222 (72.55) | 218 (71.48) | |
| Smoking status, n (%) b | ||||||
| Non-Smokers | 605 (49.51) | 173 (56.54) | 149 (48.85) | 157 (51.31) | 126 (41.31) | 0.002 |
| Smokers | 617 (50.49) | 133 (43.46) | 156 (51.15) | 149 (48.69) | 179 (58.69) | |
| Alcohol drinking, n (%) b | ||||||
| Non-Drinkers | 193 (15.79) | 52 (16.99) | 50 (16.39) | 52 (16.99) | 39 (12.79) | 0.002 |
| Former Drinkers | 320 (26.19) | 53 (17.32) | 84 (27.54) | 85 (27.78) | 98 (32.13) | |
| Current Drinkers | 709 (58.02) | 201 (65.69) | 171 (56.07) | 169 (55.23) | 168 (55.08) | |
| Hypertension, n (%) b | 754 (61.70) | 144 (47.06) | 178 (58.36) | 213 (69.61) | 219 (71.08) | <0.001 |
| Stroke, n (%) b | 83 (6.79) | 16 (5.23) | 29 (9.51) | 12 (3.92) | 26 (8.52) | 0.017 |
| Heart attack, n (%) b | 226 (18.49) | 33 (10.78) | 42 (13.77) | 59 (19.28) | 93 (30.16) | <0.001 |
| Diabetes, n (%) b | 282 (23.08) | 30 (9.80) | 54 (17.70) | 83 (27.12) | 115 (37.70) | <0.001 |
| Cancer, n (%) b | 245 (20.05) | 63 (20.59) | 65 (21.31) | 51 (16.67) | 66 (21.64) | 0.388 |
| CERAD, mean (SD) a | 19.14 (4.54) | 20.17 (4.58) | 19.13 (4.39) | 19.03 (4.58) | 18.23 (4.34) | <0.001 |
| AFT, mean (SD) a | 16.84 (5.45) | 17.31 (5.53) | 17.11 (5.73) | 16.16 (5.07) | 16.76 (5.41) | 0.06 |
| DSST, mean (SD) a | 46.14 (17.27) | 50.51 (17.56) | 46.35 (17.43) | 45.32 (16.91) | 42.35 (16.23) | <0.001 |
| CERAD | p | DSST | p | AFT | p | Z-Score | p | |
|---|---|---|---|---|---|---|---|---|
| β (95% CI) | β (95% CI) | β (95% CI) | β (95% CI) | |||||
| Crude model a | ||||||||
| Per 1-Unit Increase in METS-VF | −1.51 (−2.28, −0.73) | <0.001 | −4.97 (−8.37, −1.58) | 0.005 | −0.98 (−1.96, 0.002) | 0.050 | −0.27 (−0.42, −0.11) | 0.001 |
| Quartile of METS-VF | ||||||||
| Q1 (5.44–6.95) | 1 (reference) | 1 (reference) | 1 (reference) | 1 (reference) | ||||
| Q2 (6.95–7.30) | −1.55 (−2.59, −0.50) | 0.005 | −4.02 (−8.29, 0.25) | 0.064 | −0.69 (−1.98, 0.60) | 0.282 | −0.23 (−0.44, −0.02) | 0.030 |
| Q3 (7.30–7.57) | −1.14 (−1.98, −0.31) | 0.009 | −4.77 (−8.25, −1.29) | 0.009 | −1.76 (−2.99, −0.52) | 0.007 | −0.28 (−0.45, −0.12) | 0.001 |
| Q4 (7.57–8.22) | −2.13 (−3.12, −1.14) | <0.001 | −8.09 (−12.89, −3.28) | 0.002 | −1.03 (−2.39, 0.33) | 0.133 | −0.38 (−0.59, −0.16) | 0.001 |
| p trend | <0.001 | 0.001 | 0.049 | 0.001 | ||||
| Adjusted model b | ||||||||
| Per 1-Unit Increase in METS-VF | −1.18 (−1.90, −0.47) | 0.002 | −1.84 (−5.04, 1.36) | 0.249 | −0.32 (−1.27, 0.63) | 0.495 | −0.14 (−0.29, 0.005) | 0.058 |
| Quartile of METS-VF | ||||||||
| Q1 (5.44–6.95) | 1 (reference) | 1 (reference) | 1 (reference) | 1 (reference) | ||||
| Q2 (6.95–7.30) | −1.36 (−2.33, −0.39) | 0.007 | −1.91 (−5.32, 1.50) | 0.262 | −0.24 (−1.43, 0.95) | 0.684 | −0.15 (−0.33, 0.03) | 0.094 |
| Q3 (7.30–7.57) | −0.80 (−1.61, 0.002) | 0.051 | −1.86 (−5.16, 1.44) | 0.259 | −1.03 (−2.30, 0.23) | 0.105 | −0.16 (−0.32, 0.001) | 0.052 |
| Q4 (7.57–8.22) | −1.52 (−2.43, −0.62) | 0.002 | −3.50 (−7.89, 0.89) | 0.114 | −0.05 (−1.33, 1.22) | 0.935 | −0.18 (−0.37, 0.008) | 0.060 |
| p trend | <0.001 | <0.001 | 0.123 | <0.001 |
| METS-VF | CERAD | DSST | AFT | Z-Score | ||||
|---|---|---|---|---|---|---|---|---|
| β (95% CI) | p-Value | β (95% CI) | p-Value | β (95% CI) | p-Value | β (95% CI) | p-Value | |
| Standard multivariable linear regression model | −1.05 (−1.59, −0.52) | <0.001 | −2.17 (−3.92, −0.42) | 0.015 | −0.20 (−0.82, 0.43) | 0.534 | −0.13 (−0.22, −0.05) | 0.002 |
| Inflection point (k) | 7.68 | 7.39 | 7.80 | 7.74 | ||||
| Less than k | −0.84 (−1.45, −0.23) | 0.007 | 0.193 (−2.17, 2.56) | 0.873 | −0.01 (−0.68, 0.66) | 0.976 | −0.09 (−0.18, 0.01) | 0.073 |
| More than k | −3.17 (−6.06, −0.27) | 0.032 | −9.05 (−14.01, −4.09) | <0.001 | −3.87 (−8.90, 1.16) | 0.131 | −0.76 (−1.31, −0.21) | 0.007 |
| p for log-likelihood ratio test | 0.142 | 0.003 | 0.146 | 0.022 | ||||
| Subgroups | Underweight/Normal Weight | Overweight | Obesity | |||
|---|---|---|---|---|---|---|
| β (95% CI) | p-Value | β (95% CI) | p-Value | β (95% CI) | p-Value | |
| CERAD | −2.52 (−3.98, −1.06) | 0.001 | −3.97 (−5.35, −2.58) | <0.001 | −3.62 (−5.43, −1.80) | <0.001 |
| DSST | −4.92 (−8.81, −1.03) | 0.015 | −18.60 (−24.09, −13.11) | <0.001 | −16.45 (−26.66, −8.23) | <0.001 |
| AFT | −1.35 (−2.84, 0.14) | 0.075 | −1.37 (−3.88, 1.14) | 0.275 | −2.47 (−5.15, 0.20) | 0.069 |
| Z-score | −0.36 (−0.59, −0.13) | 0.003 | −0.73 (−1.01, −0.46) | <0.001 | −0.73 (−1.05, −0.42) | <0.001 |
Disclaimer/Publisher’s Note: The statements, opinions and data contained in all publications are solely those of the individual author(s) and contributor(s) and not of MDPI and/or the editor(s). MDPI and/or the editor(s) disclaim responsibility for any injury to people or property resulting from any ideas, methods, instructions or products referred to in the content. |
© 2025 by the authors. Licensee MDPI, Basel, Switzerland. This article is an open access article distributed under the terms and conditions of the Creative Commons Attribution (CC BY) license (https://creativecommons.org/licenses/by/4.0/).
Share and Cite
Cheng, M.; Meng, Y.; Song, Z.; Zhang, L.; Zeng, Y.; Zhang, D.; Li, S. The Association Between Metabolic Score for Visceral Fat and Cognitive Function Among Older Adults in the United States. Nutrients 2025, 17, 236. https://doi.org/10.3390/nu17020236
Cheng M, Meng Y, Song Z, Zhang L, Zeng Y, Zhang D, Li S. The Association Between Metabolic Score for Visceral Fat and Cognitive Function Among Older Adults in the United States. Nutrients. 2025; 17(2):236. https://doi.org/10.3390/nu17020236
Chicago/Turabian StyleCheng, Murong, Yuchi Meng, Zhenxue Song, Ling Zhang, Yuanjun Zeng, Dongfeng Zhang, and Suyun Li. 2025. "The Association Between Metabolic Score for Visceral Fat and Cognitive Function Among Older Adults in the United States" Nutrients 17, no. 2: 236. https://doi.org/10.3390/nu17020236
APA StyleCheng, M., Meng, Y., Song, Z., Zhang, L., Zeng, Y., Zhang, D., & Li, S. (2025). The Association Between Metabolic Score for Visceral Fat and Cognitive Function Among Older Adults in the United States. Nutrients, 17(2), 236. https://doi.org/10.3390/nu17020236