
Systematic Review of Reflection Spectroscopy-Based Skin Carotenoid Assessment in Children

 , ,
, ,  , and
, and
Abstract
1. Introduction
- (1)
- To identify distributions of SCS across demographic groups (age, biological sex, race, and ethnicity);
- (2)
- To identify potential non-dietary correlates for RS-based SCS;
- (3)
- To summarize the validity and reliability of RS-based SCS assessment in children as a proxy for FVC;
- (4)
- To conduct a meta-analysis of studies examining the correlation between RS-based SCS and self-reported FVC in children.
2. Materials and Methods
2.1. Protocol Registration
2.2. Literature Search Strategy
2.3. Data Collection and Analysis
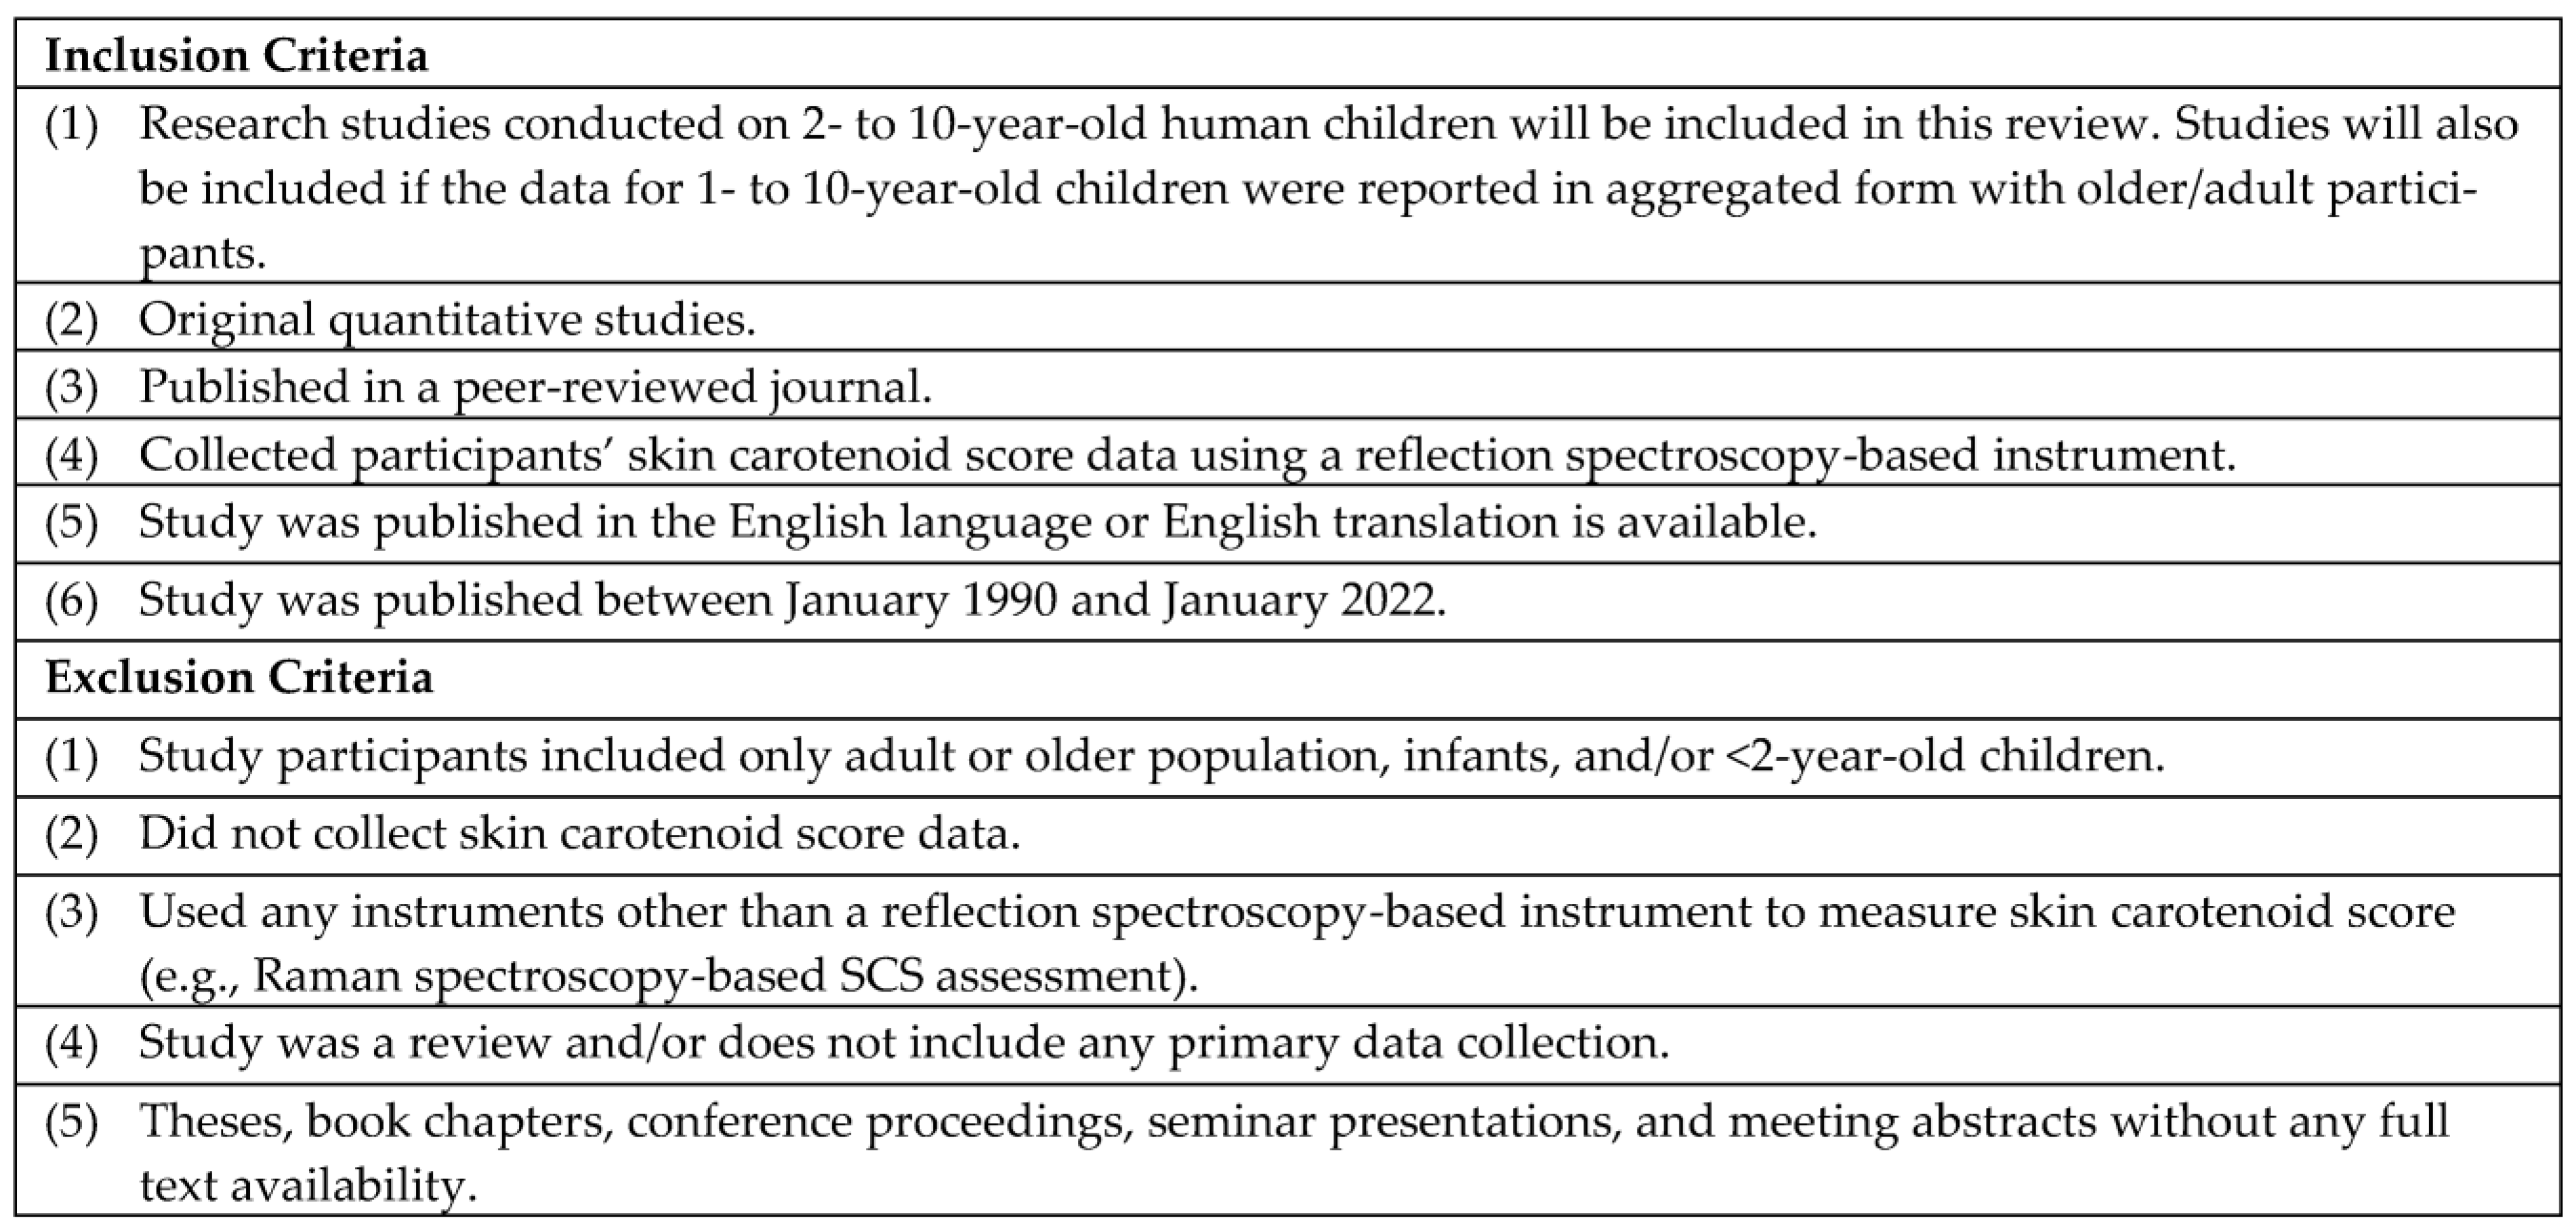
Selection of Studies
2.4. Data Extraction, Management, and Analysis
Statistical Analysis
2.5. Risk and Bias Assessment
3. Results
3.1. Overview of Search Results
3.2. Type of Studies
3.3. Study Characteristics
3.3.1. Study Research Objectives
3.3.2. Demographic Characteristics of Study Participants
3.3.3. Time and Location
3.3.4. Settings
3.3.5. Data Collection Timepoints
3.3.6. Methods Used for SCS Data Collection
3.3.7. Devices Used
3.3.8. Range of Mean SCS
3.4. Summary of Research Findings That Used RS-Based SCS Assessment in Children
3.4.1. Distributions of SCS across Demographic Groups
3.4.2. Potential Non-Dietary Correlates of Children’s RS-Based SCS
3.4.3. Summary of the Validity and Reliability of RS-Based SCS Assessment in Children as a Proxy for FVC
3.5. Meta-Analysis
3.6. Risk and Bias Assessment
4. Discussion
4.1. Validity and Reliability
4.2. Implications for Future Research
4.3. Implications for Policy and Practice
4.4. Limitations
5. Conclusions
Author Contributions
Funding
Institutional Review Board Statement
Informed Consent Statement
Data Availability Statement
Acknowledgments
Conflicts of Interest
Appendix A. Search Strategy
| Search Sets Forwarded for Review: #1|#23 Database: Ovid MEDLINE(R) and Epub Ahead of Print, In-Process, In-Data-Review & Other Non-Indexed Citations and Daily <1946 to 6 May 2021> Search Strategy: |
| -------------------------------------------------------------------------------- |
| 1 veggie$ met$.mp. (8) |
| 2 nuskin$.mp. (1) |
| 3 exp Spectrum Analysis/(559417) |
| 4 (spectroscop$ or spectometr$ or spectrum$ analy$ or spectophotometr$).mp. (606114) |
| 5 (reflectance$ or biophotonic$ or bio-photonic$).mp. (25352) |
| 6 (optical$ adj2 (detect$ or assess$ or sens$)).mp. (14533) |
| 7 (raman$ adj2 (microscop$ or imag$ or resonan$)).mp. (10190) |
| 8 or/2–7 (837113) |
| 9 exp Skin/(229427) |
| 10 (skin$ or derm$ or epiderm$).mp. (1153364) |
| 11 exp Blood/(1124991) |
| 12 (blood$ or plasma$ or serum$ or sera).mp. (4841063) |
| 13 or/9–12 (6269201) |
| 14 8 and 13 (118002) |
| 15 exp Carotenoids/(87199) |
| 16 caroten$.mp. (40527) |
| 17 (alphacaroten$ or betacaroten$).mp. (79) |
| 18 (astacen$ or cryptoxanthin$ or betacryptoxanthin$ or canthaxanthin$ or fucoxanthin$ or lutein$ or lycopen$ or zeaxanthin$).mp. (75804) |
| 19 or/15–18 (166545) |
| 20 14 and 19 (1024) |
| 21 ..l/20 lg = en (978) |
| 22 ..l/21 yr = 1990-current (760) |
| 23 remove duplicates from 22 (760) |
| *************************** |
Appendix B. Full Text Data Extraction Form
| 1. Country in which the study took place …………. |
| 2. Research Question/Objective/Hypothesis …………. |
| 3. Research method/study design (Select from the following options) |
| a. Cross-sectional study |
| b. Cohort |
| c. Case-control study |
| d. Intervention study without control group |
| e. Intervention study with control group |
| 4. Total sample size ………. |
| 5. Participant Characteristics |
| a. Gender ………… |
| b. Race/ethnicity …………… |
| c. Socioeconomic Status ………… |
| d. Weight status ………… |
| e. Age (mean, SD, range) ……………. |
| 6. Data collection setting (Select from the following options) |
| a. Child care/day care settings |
| b. Head Start |
| c. Preschool |
| d. School |
| e. Laboratory |
| f. Other, please specify ………. |
| 7. Duration of data collection over the year, mention particular month or season ……… |
| 8. Over how many months or years data were collected?............ |
| 9. Dependent variable ……………… |
| 10. Assessment/measure/tools used for measuring dependent variable …………. |
| 11. Independent variable …………… |
| 12. Assessment/measure/tools used for measuring independent variable …………. |
| 13. Statistical analysis used (e.g., Psychometric analysis of RS-based skin carotenoid in children as a proxy for fruit/vegetables consumption) …………… |
| 14. Reported correlates, covariates, and confounding factors …………… |
| 15. Test statistic values ………… |
| 16. Research Implications (areas and opportunities for research with RS-based carotenoid assessment in children …………. |
| 17. Any important point highlighted in the research about measuring skin-carotenoid …………. |
| 18. Study limitations …………… |
References
- Boeing, H.; Bechthold, A.; Bub, A.; Ellinger, S.; Haller, D.; Kroke, A.; Leschik-Bonnet, E.; Müller, M.J.; Oberritter, H.; Schulze, M.; et al. Critical Review: Vegetables and Fruit in the Prevention of Chronic Diseases. Eur. J. Nutr. 2012, 51, 637–663. [Google Scholar] [CrossRef]
- Slavin, J.L.; Lloyd, B. Health Benefits of Fruits and Vegetables. Adv. Nutr. 2012, 3, 506–516. [Google Scholar] [CrossRef]
- Gerritsen, S.; Renker-Darby, A.; Harré, S.; Rees, D.; Raroa, D.A.; Eickstaedt, M.; Sushil, Z.; Allan, K.; Bartos, A.E.; Waterlander, W.E.; et al. Improving Low Fruit and Vegetable Intake in Children: Findings from a System Dynamics, Community Group Model Building Study. PLoS ONE 2019, 14, e0221107. [Google Scholar] [CrossRef]
- Mihrshahi, S.; Myton, R.; Partridge, S.R.; Esdaile, E.; Hardy, L.L.; Gale, J. Sustained Low Consumption of Fruit and Vegetables in Australian Children: Findings from the Australian National Health Surveys. Health Promot. J. Austr. 2019, 30, 83–87. [Google Scholar] [CrossRef]
- Kim, S.A.; Moore, L.V.; Galuska, D.; Wright, A.P.; Harris, D.; Grummer-Strawn, L.M.; Merlo, C.L.; Nihiser, A.J.; Rhodes, D.G. Vital Signs: Fruit and Vegetable Intake among Children—United States, 2003–2010. MMWR Morb. Mortal. Wkly. Rep. 2014, 63, 671–676. [Google Scholar]
- Hamner, H.C.; Dooyema, C.A.; Blanck, H.M.; Flores-Ayala, R.; Jones, J.R.; Ghandour, R.M.; Petersen, R. Fruit, Vegetable, and Sugar-Sweetened Beverage Intake Among Young Children, by State—United States, 2021. MMWR Morb. Mortal. Wkly. Rep. 2023, 72. [Google Scholar] [CrossRef]
- Wolfenden, L.; Jones, J.; Williams, C.M.; Finch, M.; Wyse, R.J.; Kingsland, M.; Tzelepis, F.; Wiggers, J.; Williams, A.J.; Seward, K.; et al. Strategies to Improve the Implementation of Healthy Eating, Physical Activity and Obesity Prevention Policies, Practices or Programmes within Childcare Services. Cochrane Database Syst. Rev. 2016, 10, CD011779. [Google Scholar] [CrossRef]
- Hodder, R.K.; O’Brien, K.M.; Tzelepis, F.; Wyse, R.J.; Wolfenden, L. Interventions for Increasing Fruit and Vegetable Consumption in Children Aged Five Years and Under. Cochrane Database Syst. Rev. 2020, 2022, CD008552. [Google Scholar] [CrossRef]
- Livingstone, M.B.E.; Robson, P.J. Measurement of Dietary Intake in Children. Proc. Nutr. Soc. 2000, 59, 279–293. [Google Scholar] [CrossRef]
- Foster, E.; Adamson, A. Challenges Involved in Measuring Intake in Early Life: Focus on Methods. Proc. Nutr. Soc. 2014, 73, 201–209. [Google Scholar] [CrossRef]
- Kirkpatrick, S.I.; Raffoul, A. Measures Registry User Guide: Individual Diet; National Collaborative on Childhood Obesity Research (NCCOR), 2017. Available online: https://www.nccor.org/tools-mruserguides/individual-diet/introduction/ (accessed on 20 December 2022).
- Stage, V.C.; Downing, C.; Hegde, A.V.; Dev, D.A.; Peterson, A.D.; Goodell, L.S. Comparison of Parent and Child Ratings of Fruit and Vegetable Liking to Assess Parent Accuracy as Proxy Reporters. Ecol. Food Nutr. 2019, 58, 166–186. [Google Scholar] [CrossRef]
- Briefel, R.R.; Deming, D.M.; Reidy, K.C. Parents’ Perceptions and Adherence to Children’s Diet and Activity Recommendations: The 2008 Feeding Infants and Toddlers Study. Prev. Chronic Dis. 2015, 12, E159. [Google Scholar] [CrossRef]
- Benjamin-Neelon, S.E. Position of the Academy of Nutrition and Dietetics: Benchmarks for Nutrition in Child Care. J. Acad. Nutr. Diet. 2018, 118, 1291–1300. [Google Scholar] [CrossRef] [PubMed]
- Ball, S.C.; Benjamin, S.E.; Ward, D.S. Development and Reliability of an Observation Method to Assess Food Intake of Young Children in Child Care. J. Am. Diet. Assoc. 2007, 107, 656–661. [Google Scholar] [CrossRef] [PubMed]
- Nicklas, T.A.; Liu, Y.; Stuff, J.E.; Fisher, J.O.; Mendoza, J.A.; O’Neil, C.E. Characterizing Lunch Meals Served and Consumed by Pre-School Children in Head Start. Public Health Nutr. 2013, 16, 2169–2177. [Google Scholar] [CrossRef] [PubMed]
- Martin, C.K.; Han, H.; Coulon, S.M.; Allen, H.R.; Champagne, C.M.; Anton, S.D. A Novel Method to Remotely Measure Food Intake of Free-Living Individuals in Real Time: The Remote Food Photography Method. Br. J. Nutr. 2008, 101, 446–456. [Google Scholar] [CrossRef]
- Eggersdorfer, M.; Wyss, A. Carotenoids in Human Nutrition and Health. Arch. Biochem. Biophys. 2018, 652, 18–26. [Google Scholar] [CrossRef] [PubMed]
- Fiedor, J.; Burda, K. Potential Role of Carotenoids as Antioxidants in Human Health and Disease. Nutrients 2014, 6, 466–488. [Google Scholar] [CrossRef]
- Aguilar, S.S.; Wengreen, H.J.; Lefevre, M.; Madden, G.J.; Gast, J. Skin Carotenoids: A Biomarker of Fruit and Vegetable Intake in Children. J. Acad. Nutr. Diet. 2014, 114, 1174–1180. [Google Scholar] [CrossRef]
- Burrows, T.L.; Williams, R.; Rollo, M.; Wood, L.; Garg, M.L.; Jensen, M.; Collins, C.E. Plasma Carotenoid Levels as Biomarkers of Dietary Carotenoid Consumption: A Systematic Review of the Validation Studies. J. Nutr. Intermed. Metab. 2015, 2, 15–64. [Google Scholar] [CrossRef]
- Aguilar, S.S.; Wengreen, H.J.; Dew, J. Skin Carotenoid Response to a High-Carotenoid Juice in Children: A Randomized Clinical Trial. J. Acad. Nutr. Diet. 2015, 115, 1771–1778. [Google Scholar] [CrossRef]
- Scarmo, S.; Henebery, K.; Peracchio, H.; Cartmel, B.; Lin, H.; Ermakov, I.V.; Gellermann, W.; Bernstein, P.S.; Duffy, V.B.; Mayne, S.T. Skin Carotenoid Status Measured by Resonance Raman Spectroscopy as a Biomarker of Fruit and Vegetable Intake in Preschool Children. Eur. J. Clin. Nutr. 2012, 66, 555–560. [Google Scholar] [CrossRef] [PubMed]
- Mayne, S.T.; Cartmel, B.; Scarmo, S.; Lin, H.; Leffell, D.J.; Welch, E.; Ermakov, I.; Bhosale, P.; Bernstein, P.S.; Gellermann, W. Noninvasive Assessment of Dermal Carotenoids as a Biomarker of Fruit and Vegetable Intake. Am. J. Clin. Nutr. 2010, 92, 794–800. [Google Scholar] [CrossRef] [PubMed]
- Beccarelli, L.M.; Scherr, R.E.; Dharmar, M.; Ermakov, I.V.; Gellermann, W.; Jahns, L.; Linnell, J.D.; Keen, C.L.; Steinberg, F.M.; Young, H.M.; et al. Using Skin Carotenoids to Assess Dietary Changes in Students after 1 Academic Year of Participating in the Shaping Healthy Choices Program. J. Nutr. Educ. Behav. 2017, 49, 73–78.e1. [Google Scholar] [CrossRef]
- Jilcott Pitts, S.B.; Johnson, N.S.; Wu, Q.; Firnhaber, G.C.; Preet Kaur, A.; Obasohan, J. A Meta-Analysis of Studies Examining Associations between Resonance Raman Spectroscopy-Assessed Skin Carotenoids and Plasma Carotenoids among Adults and Children. Nutr. Rev. 2021, 80, 230–241. [Google Scholar] [CrossRef]
- Whiteside-Mansell, L.; Swindle, T.; Davenport, K. Evaluation of “Together, We Inspire Smart Eating” (WISE) Nutrition Intervention for Young Children: Assessment of Fruit and Vegetable Consumption with Parent Reports and Measurements of Skin Carotenoids as Biomarkers. J. Hunger Environ. Nutr. 2019, 16, 235–245. [Google Scholar] [CrossRef] [PubMed]
- Nguyen, L.M.; E Scherr, R.; Dharmar, M.; Ermakov, I.V.; Gellermann, W.; Jahns, L.; Linnell, J.D.; Keen, C.L.; Miyamoto, S.; Steinberg, F.M.; et al. Using Skin Carotenoids to Assess Potential Dietary Changes After One Academic Year in the Shaping Healthy Choices Program. FASEB J. 2016, 30, 896.19. [Google Scholar] [CrossRef]
- Ermakov, I.V.; Ermakova, M.R.; McClane, R.W.; Gellermann, W. Resonance Raman Detection of Carotenoid Antioxidants in Living Human Tissues. Opt. Lett. 2001, 26, 1179–1181. [Google Scholar] [CrossRef]
- Hammond, B.R.; Wooten, B.R. Resonance Raman Spectroscopic Measurement of Carotenoids in the Skin and Retina. J. Biomed. Opt. 2005, 10, 54002. [Google Scholar] [CrossRef]
- What is the S3 Scanner? Nu Skin. Available online: https://www.nuskin.com/en_US/products/pharmanex/scanner/s3_whatis.html (accessed on 15 November 2022).
- Jahns, L.; Johnson, L.A.K.; Conrad, Z.; Bukowski, M.; Raatz, S.K.; Jilcott Pitts, S.; Wang, Y.; Ermakov, I.V.; Gellermann, W. Concurrent Validity of Skin Carotenoid Status as a Concentration Biomarker of Vegetable and Fruit Intake Compared to Multiple 24-h Recalls and Plasma Carotenoid Concentrations across One Year: A Cohort Study. Nutr. J. 2019, 18, 78. [Google Scholar] [CrossRef] [PubMed]
- Ermakov, I.V.; Gellermann, W. Optical Detection Methods for Carotenoids in Human Skin. Arch. Biochem. Biophys. 2015, 572, 101–111. [Google Scholar] [CrossRef]
- Jilcott Pitts, S.B.; Moran, N.E.; Wu, Q.; Harnack, L.; Craft, N.E.; Hanchard, N.; Bell, R.; Moe, S.G.; Johnson, N.; Obasohan, J.; et al. Pressure-Mediated Reflection Spectroscopy Criterion Validity as a Biomarker of Fruit and Vegetable Intake: A 2-Site Cross-Sectional Study of 4 Racial or Ethnic Groups. J. Nutr. 2022, 152, 107–116. [Google Scholar] [CrossRef]
- Seguin-Fowler, R.A.; Hanson, K.L.; Marshall, G.A.; Belarmino, E.H.; Jilcott Pitts, S.B.; Kolodinsky, J.; Sitaker, M.; Ammerman, A. Fruit and Vegetable Intake Assessed by Repeat 24 h Recalls, but Not by a Dietary Screener, Is Associated with Skin Carotenoid Measurements in Children. Nutrients 2021, 13, 980. [Google Scholar] [CrossRef]
- Casperson, S.L.; Roemmich, J.N.; Larson, K.J.; Hess, J.M.; Palmer, D.G.; Jahns, L. Sensitivity of Pressure-Mediated Reflection Spectroscopy to Detect Changes in Skin Carotenoids in Adults without Obesity in Response to Increased Carotenoid Intake: A Randomized Controlled Trial. J. Nutr. 2023, in press. [Google Scholar] [CrossRef]
- Ermakov, I.V.; Gellermann, W. Dermal Carotenoid Measurements via Pressure Mediated Reflection Spectroscopy. J. Biophotonics 2012, 5, 559–570. [Google Scholar] [CrossRef]
- The VEGGIE METER®—Skin Carotenoids as Indicator of Fruit and Vegetable Intake and Biomarker Associated with Better Health. Longevity Link—Products. Available online: http://longevitylinkcorporation.com/products.html (accessed on 24 February 2022).
- Faraji, B.; Bukowski, M.R.; Thompson-Johnson, T.; Krusinski, L.; Goldberg, J.L.; Brooks, C.M.; Snyder, S. Skin Carotenoid Status of Black/African American College Students Correlates with Plasma Carotenoids and Fruit and Vegetable Intake Independent of Skin Tone. Int. J. Clin. Nutr. Diet. 2022, 8, IJCND-161. [Google Scholar] [CrossRef]
- Pitts, S.B.J.; Jahns, L.; Wu, Q.; Moran, N.E.; Bell, R.A.; Truesdale, K.P.; Laska, M.N. A Non-Invasive Assessment of Skin Carotenoid Status through Reflection Spectroscopy Is a Feasible, Reliable and Potentially Valid Measure of Fruit and Vegetable Consumption in a Diverse Community Sample. Public Health Nutr. 2018, 21, 1664–1670. [Google Scholar] [CrossRef]
- Radtke, M.D.; Pitts, S.J.; Jahns, L.; Firnhaber, G.C.; Loofbourrow, B.M.; Zeng, A.; Scherr, R.E. Criterion-Related Validity of Spectroscopy-Based Skin Carotenoid Measurements as a Proxy for Fruit and Vegetable Intake: A Systematic Review. Adv. Nutr. 2020, 11, 1282–1299. [Google Scholar] [CrossRef]
- Centers for Disease Control and Prevention [CDC]. Childhood Obesity Facts: Overweight & Obesity. Available online: https://www.cdc.gov/obesity/data/childhood.html (accessed on 20 December 2022).
- Moher, D.; Liberati, A.; Tetzlaff, J.; Altman, D.G.; Mulrow, C.; Gøtzsche, P.C.; Ioannidis, J.P.A.; Clarke, M.; Devereaux, P.J.; Kleijnen, J. The PRISMA Statement for Reporting Systematic Reviews and Meta-Analyses of Studies That Evaluate Health Care Interventions: Explanation and Elaboration. PLoS Med. 2009, 6, e1000100. [Google Scholar] [CrossRef]
- Roess, A.A.; Jacquier, E.F.; Catellier, D.J.; Carvalho, R.; Lutes, A.C.; Anater, A.S.; Dietz, W.H. Food Consumption Patterns of Infants and Toddlers: Findings from the Feeding Infants and Toddlers Study (FITS) 2016. J. Nutr. 2018, 148, 1525–1535. [Google Scholar] [CrossRef]
- World Health Organization. Adolescent Health. Available online: https://www.who.int/health-topics/adolescent-health (accessed on 3 January 2023).
- Moran, N.E.; Mohn, E.S.; Hason, N.; Erdman, J.W., Jr.; Johnson, E.J. Intrinsic and Extrinsic Factors Impacting Absorption, Metabolism, and Health Effects of Dietary Carotenoids. Adv. Nutr. 2018, 9, 465–492. [Google Scholar] [CrossRef]
- Livingstone, M.B.E.; Robson, P.J.; Wallace, J.M.W. Issues in Dietary Intake Assessment of Children and Adolescents. Br. J. Nutr. 2004, 92, S213–S222. [Google Scholar] [CrossRef]
- Radtke, M.D.; Poe, M.; Stookey, J.; Jilcott Pitts, S.; Moran, N.E.; Landry, M.J.; Rubin, L.P.; Stage, V.C.; Scherr, R.E. Recommendations for the Use of the Veggie Meter® for Spectroscopy-Based Skin Carotenoid Measurements in the Research Setting. Curr. Dev. Nutr. 2021, 5, nzab104. [Google Scholar] [CrossRef]
- Fink, A. Survey Research Methods. In International Encyclopedia of Education, 3rd ed.; Peterson, P., Baker, E., McGaw, B., Eds.; Elsevier: Oxford, UK, 2010; pp. 152–160. [Google Scholar] [CrossRef]
- Liu, R.; Edwards, C.G.; Cannavale, C.N.; Flemming, I.R.; Chojnacki, M.R.; Reeser, G.E.; Iwinski, S.J.; Renzi-Hammond, L.M.; Khan, N.A. Weight Status and Visceral Adiposity Mediate the Relation between Exclusive Breastfeeding Duration and Skin Carotenoids in Later Childhood. Curr. Dev. Nutr. 2021, 5, nzab010. [Google Scholar] [CrossRef] [PubMed]
- Martinelli, S.; Acciai, F.; Tasevska, N.; Ohri-Vachaspati, P. Using the Veggie Meter in Elementary Schools to Objectively Measure Fruit and Vegetable Intake: A Pilot Study. Methods Protoc. 2021, 4, 33. [Google Scholar] [CrossRef] [PubMed]
- Nagao-Sato, S.; Baltaci, A.; Peralta Reyes, A.O.; Zhang, Y.; Hurtado Choque, G.A.; Reicks, M. Skin Carotenoid Scores Assessed with Reflection Spectroscopy Are Associated with Self-Reported Fruit and Vegetable Intake Among Latino Early Adolescents. J. Acad. Nutr. Diet. 2021, 121, 1507–1514. [Google Scholar] [CrossRef]
- Takeuchi, J.; Kusunoki, T.; Morimoto, T. Association of Skin Carotenoid Score and Food Intake among School Children: A Multicenter Cross-Sectional Study. J. Nutr. Sci. Vitaminol. 2022, 68, 127–130. [Google Scholar] [CrossRef]
- National Heart, Lung, and Blood Institute (NHLBI). Study Quality Assessment Tools. Available online: https://www.nhlbi.nih.gov/health-topics/study-quality-assessment-tools (accessed on 20 December 2022).
- von Elm, E.; Altman, D.G.; Egger, M.; Pocock, S.J.; Gøtzsche, P.C.; Vandenbroucke, J.P. The Strengthening the Reporting of Observational Studies in Epidemiology (STROBE) Statement: Guidelines for Reporting Observational Studies. J. Clin. Epidemiol. 2008, 61, 344–349. [Google Scholar] [CrossRef]
- Bayles, J.; Peterson, A.D.; Jilcott Pitts, S.; Bian, H.; Goodell, L.S.; Burkholder, S.; Hegde, A.V.; Stage, V.C. Food-Based Science, Technology, Engineering, Arts, and Mathematics (STEAM) Learning Activities May Reduce Decline in Preschoolers’ Skin Carotenoid Status. J. Nutr. Educ. Behav. 2021, 53, 343–351. [Google Scholar] [CrossRef] [PubMed]
- Bakırcı-Taylor, A.L.; Reed, D.B.; McCool, B.; Dawson, J.A. MHealth Improved Fruit and Vegetable Accessibility and Intake in Young Children. J. Nutr. Educ. Behav. 2019, 51, 556–566. [Google Scholar] [CrossRef]
- Jones, A.M.; Keihner, A.; Mills, M.; MkNelly, B.; Khaira, K.K.; Pressman, J.; Scherr, R.E. Measuring Skin Carotenoids Using Reflection Spectroscopy in a Low-Income School Setting. Nutrients 2021, 13, 3796. [Google Scholar] [CrossRef]
- Jung, S.; Darvin, M.E.; Chung, H.-S.; Jung, B.; Lee, S.-H.; Lenz, K.; Chung, W.-S.; Yu, R.-X.; Patzelt, A.; Lee, B.-N.; et al. Antioxidants in Asian-Korean and Caucasian Skin: The Influence of Nutrition and Stress. Ski. Pharmacol. Physiol. 2014, 27, 293–302. [Google Scholar] [CrossRef]
- Burkholder, S.; Jilcott Pitts, S.; Wu, Q.; Bayles, J.; Baybutt, R.; Stage, V.C. Skin Carotenoid Status Over Time and Differences by Age and Sex Among Head Start Children (3–5 Years). J. Nutr. Educ. Behav. 2021, 53, 103–109. [Google Scholar] [CrossRef] [PubMed]
- May, K.; Jilcott Pitts, S.; Stage, V.C.; Kelley, C.J.; Burkholder, S.; Fang, X.; Zeng, A.; Lazorick, S. Use of the Veggie Meter R as a Tool to Objectively Approximate Fruit and Vegetable Intake among Youth for Evaluation of Preschool and School-Based Interventions. J. Hum. Nutr. Diet. 2020, 33, 869–875. [Google Scholar] [CrossRef] [PubMed]
- Ermakov, I.V.; Ermakova, M.; Sharifzadeh, M.; Gorusupudi, A.; Farnsworth, K.; Bernstein, P.S.; Stookey, J.; Evans, J.; Arana, T.; Tao-Lew, L.; et al. Optical Assessment of Skin Carotenoid Status as a Biomarker of Vegetable and Fruit Intake. Arch. Biochem. Biophys. 2018, 646, 46–54. [Google Scholar] [CrossRef]
- Darvin, M.E.; Sandhagen, C.; Koecher, W.; Sterry, W.; Lademann, J.; Meinke, M.C. Comparison of Two Methods for Noninvasive Determination of Carotenoids in Human and Animal Skin: Raman Spectroscopy versus Reflection Spectroscopy. J. Biophotonics 2012, 5, 550–558. [Google Scholar] [CrossRef] [PubMed]
- Jones, B.L. Making Time for Family Meals: Parental Influences, Home Eating Environments, Barriers and Protective Factors. Physiol. Behav. 2018, 193, 248–251. [Google Scholar] [CrossRef]
- Ferrucci, L.; Perry, J.R.B.; Matteini, A.; Perola, M.; Tanaka, T.; Silander, K.; Rice, N.; Melzer, D.; Murray, A.; Cluett, C.; et al. Common Variation in the β-Carotene 15,15′-Monooxygenase 1 Gene Affects Circulating Levels of Carotenoids: A Genome-Wide Association Study. Am. J. Hum. Genet. 2009, 84, 123–133. [Google Scholar] [CrossRef]
- Moran, N.E.; Thomas-Ahner, J.M.; Fleming, J.L.; McElroy, J.P.; Mehl, R.; Grainger, E.M.; Riedl, K.M.; Toland, A.E.; Schwartz, S.J.; Clinton, S.K. Single Nucleotide Polymorphisms in β-Carotene Oxygenase 1 Are Associated with Plasma Lycopene Responses to a Tomato-Soy Juice Intervention in Men with Prostate Cancer. J. Nutr. 2019, 149, 381–397. [Google Scholar] [CrossRef]
- Tahmasebi, H.; Trajcevski, K.; Higgins, V.; Adeli, K. Influence of Ethnicity on Population Reference Values for Biochemical Markers. Crit. Rev. Clin. Lab. Sci. 2018, 55, 359–375. [Google Scholar] [CrossRef] [PubMed]
- Whigham, L.D.; Redelfs, A.H. Optical Detection of Carotenoids in Living Tissue as a Measure of Fruit and Vegetable Intake. Annual International Conference of the IEEE Engineering in Medicine and Biology Society. IEEE Eng. Med. Biol. Society. Annu. Int. Conf. 2015, 2015, 8197–8200. [Google Scholar] [CrossRef]
- Jilcott Pitts, S.B.; Wu, Q.; Truesdale, K.P.; Haynes-Maslow, L.; McGuirt, J.T.; Ammerman, A.; Bell, R.; Laska, M.N. One-Year Follow-Up Examination of the Impact of the North Carolina Healthy Food Small Retailer Program on Healthy Food Availability, Purchases, and Consumption. Int. J. Environ. Res. Public Health 2018, 15, 2681. [Google Scholar] [CrossRef]
- Obana, A.; Gohto, Y.; Asaoka, R.; Gellermann, W.; Bernstein, P.S. Lutein and Zeaxanthin Distribution in the Healthy Macula and Its Association with Various Demographic Factors Examined in Pseudophakic Eyes. Antioxidants 2021, 10, 1857. [Google Scholar] [CrossRef]
- Massenti, R.; Perrone, A.; Livrea, M.A.; Bianco, R.L. Regular Consumption of Fresh Orange Juice Increases Human Skin Carotenoid Content. Int. J. Food Sci. Nutr. 2015, 66, 718–721. [Google Scholar] [CrossRef] [PubMed]
- Rush, E.; Amoah, I.; Diep, T.; Jalili-Moghaddam, S. Determinants and Suitability of Carotenoid Reflection Score as a Measure of Carotenoid Status. Nutrients 2020, 12, 113. [Google Scholar] [CrossRef]
- Forsum, E.; Flinke Carlsson, E.; Henriksson, H.; Henriksson, P.; Löf, M. Total Body Fat Content versus BMI in 4-Year-Old Healthy Swedish Children. J. Obes. 2013, 2013, 206715. [Google Scholar] [CrossRef]
- Luecking, C.T.; Mazzucca, S.; Vaughn, A.E.; Ward, D.S. Contributions of Early Care and Education Programs to Diet Quality in Children Aged 3 to 4 Years in Central North Carolina. J. Acad. Nutr. Diet. 2020, 120, 386–394. [Google Scholar] [CrossRef]
- Toh, D.W.K.; Sutanto, C.N.; Loh, W.W.; Lee, W.Y.; Yao, Y.; Ong, C.N.; Kim, J.E. Skin Carotenoids Status as a Potential Surrogate Marker for Cardiovascular Disease Risk Determination in Middle-Aged and Older Adults. Nutr. Metab. Cardiovasc. Dis. 2021, 31, 592–601. [Google Scholar] [CrossRef]
- Toh, D.W.K.; Loh, W.W.; Sutanto, C.N.; Yao, Y.; Kim, J.E. Skin Carotenoid Status and Plasma Carotenoids: Biomarkers of Dietary Carotenoids, Fruits and Vegetables for Middle-Aged and Older Singaporean Adults. Br. J. Nutr. 2021, 126, 1398–1407. [Google Scholar] [CrossRef]
- Matsumoto, M.; Suganuma, H.; Hayashi, H.; Shimizu, S.; Sawada, K.; Tokuda, I.; Ihara, K.; Nakaji, S. Skin Carotenoid Level as an Alternative Marker of Serum Total Carotenoid Concentration and Vegetable Intake Correlates with Biomarkers of Circulatory Diseases and Metabolic Syndrome. Nutrients 2020, 12, 1825. [Google Scholar] [CrossRef]
- Huedo-Medina, T.B.; Sánchez-Meca, J.; Marín-Martínez, F.; Botella, J. Assessing Heterogeneity in Meta-Analysis: Q Statistic or I2 Index? Psychol. Methods 2006, 11, 193–206. [Google Scholar] [CrossRef] [PubMed]


| Study/Location | Objectives | Participant Characteristics (Total, % Male, % Race/Ethnicity) | Children’s Age (In Years) Range (M ± SD) | Weight Status | Setting for Data Collection | How Many Times the Skin Carotenoid Data Were Collected; Average Time between the Data Collection Points | Data Collection Months |
|---|---|---|---|---|---|---|---|
| Controlled Intervention Study | |||||||
| Bakırcı et al. (2019); TX, USA [57] | To determine post-nutrition intervention increase in skin carotenoid score | n = 30, 50% male; Intervention (I): White 80%, Hispanic/Latino 7%, Asian/Pacific Islander 7%, Other 7%; Control (C):White 67%, Hispanic/Latino 20%, Black 7%, Asian 7% | 3–5; (I = 3.6 ± 1.4, C = 3.8 ± 0.8) | I: Healthy weight 100%; C: Healthy weight 80%, Overweight/obese 20% | Library | 3 times; 5 weeks | NR * |
| Bayles et al. (2021); NC, USA [56] | To investigate effectiveness of vegetable exposure through food-based science, technology, engineering, arts, mathematics (STEAM) learning activities in classroom to increase liking for vegetables and objectively assessed FV intake. | N = 112, 49% male; Intervention (I): Black 85.7%, White 4.1%, Hispanic/Latino 2%, Asian 0%, Other 8.2%; Control (C): Black 76.6%, White 6.3%, Hispanic/Latino 9.4%, Asian 1.6%, Other 4.7%. | 3–5; (I = 3.8 ± 0.6, C = 3.6 ± 0.6) | I: BMI-Z (0.7 ± 1.4); Underweight 4.1%, Normal 57.1%, Overweight 10.2%, Obese 28.6%; C: BMI-Z (0.7 ± 1.4); Underweight 4.7%, Normal 50%, Overweight 20.3%, Obese 25%. | Head Start | 3 times; 2 months | September 2019–February 2020 |
| Intervention Study without Control Group | |||||||
| Jones et al. (2021); CA, USA [58] | (a) To determine efficiency of the VM® to assess changes in FV consumption in a school-based intervention (b) To refine the protocol for using the VM® in low-income schools to collect SCS | n = 35, 48.6% male; American Indian/Alaskan Native 2.9% Asian/Pacific Islander 20% White 34.3% Mixed 14.3% Other 2.9% Latino/Hispanic 22.9% | 9–10 | BMI (64 ± 30.1) | Supplemental Nutrition Assistance Program Education qualifying schools | 3 times; 4 months | Fall 2018, spring 2019, fall 2019 |
| Cross-sectional Study | |||||||
| Burkholder et al. (2021); NC, USA [60] | To investigate the change in skin carotenoid score regarding seasonal variation, availability of fruit and vegetables, and across different ages and genders | n = 112, 57% male; African American 80.5% | 3–5 (NR) | BMI-Z (0.7 ± 1.4); Overweight 16%, Obese 27% | Head Start | 3 times; 2 months | October 2018–February 2019 |
| Ermakov et al. (2018); CA, USA [62] | To understand the distribution of reflection spectroscopy-based skin carotenoid score in preschool children | n = 947, NR | 2–5 (NR) | NR | Childcare Center | 1 time; NA * | Fall 2017–spring 2018 |
| Jung et al. (2014); Korea and Germany [59] | To investigate how the nutritional and cultural habits including stress behavior are reflected in the antioxidant status of the skin | n = 714, 53.2% male; Korean 53.5%, German 46.5% | Total 7–75; Percent of children in the total sample (n = 11.9%) 7–13 | Underweight 3.5%, Overweight 19.6%, Obese 2.9% | NR | NR; NA | June–August, NR |
| Liu et al. (2021); IL, USA [50] | To investigate interrelations between breastfeeding exposure, weight status, adiposity, and carotenoid status among children at school age | n = 81, 51.9% male; Hispanic 6.2%; Asian 14.8%, Black or African American 6.2%, White 67.9%, Mixed/other 11.1% | 7–12 (9.4 ± 1.6) | Normal weight 73%, Overweight or obese 22% | Laboratory | 3 times, 15.9 days | NR |
| Martinelli et al. (2021); AZ, USA [51] | (a) To assess feasibility of using Veggie Meter® in an elementary school setting; (b) the distribution of skin carotenoids among elementary-school-age children; (c) exploring variation in skin carotenoid score with demographic characteristics; (d) To compare skin carotenoid score with self-reported FV intake on the previous day | n = 143, 47.6% male; Hispanic 45.5%, White 37.1%, Other 17.5% | 9–11 | NR | School | 1 time, NA | November 2019 |
| May et al. (2020); NC, USA [61] | (a) Association between skin carotenoid score and fruit and vegetable intake. (b) Age-, gender-, and weight category-related group differences in skin carotenoid score | n = 112, 57% male; Black 81.3%, White 5.4%, Other 13.3% | 3–5 (4.1 ± 0.5) | BMI (67.5 ± 32.1) Overweight or obese 43%, Healthy weight 57% | Head Start | 1 time, NA | October–December 2018 |
| Nagao-Sato et al. (2021); MN-WI, USA [52] | To explore association between reflection spectroscopy-based skin carotenoid score with fruit and vegetable intake controlling for potential confounding factors | n = 195, 50% male; Latino 100% | 10–14 (12 ± 1.4) | Underweight/Normal weight 43%, Overweight/obesity 57% | Three churches and two Latino-serving nonprofit community centers | 1 time, NA | January, February, March, September, and October; 2017–2020. |
| Takeuchi et al. (2022), Japan [53] | To evaluate the association between skin carotenoid score with fruit and vegetable intake and other dietary habits in children | n = 328, 50.8% male; Japanese | 10 (NR) | CD | NR | 1 time, NA | January, 2020 |
| Recommendations for Using Veggie Meter® a | Studies Following Recommendation |
|---|---|
| None |
| Nagao-Sato et al. (2021) [52]; Martinelli et al. (2021) [51]; Liu et al. (2021) [50]; Jones et al. (2021) [58] |
| Bakırcı et al. (2019) [57] Martinelli et al. (2021) [51] |
| Bayles et al. (2021) [56]; Burkholder et al. (2021) [60]; Ermakov et al. (2018) [62]; Bakırcı-Taylor et al. (2019) [57]; Liu et al. (2021) [50]; Martinelli et al. (2021) [51]; May et al. (2020) [61]; Nagao-Sato et al. (2021) [52]; Jones et al. (2021) [58] |
| None |
| Jones et al. (2021) [58] |
| Burkholder et al. (2021) [60]; Bayles et al. (2021) [56]; Ermakov et al. (2018) [62]; Jones et al. (2021) [58] |
| Martinelli et al. (2021) [51]; Nagao-Sato et al. (2021) [52] |
| Study, Device Used | Skin Carotenoid Score (M ± SD); Range | Operationalization of Fruit and Vegetable Consumption | Assessment Used | Correlation |
|---|---|---|---|---|
| Bakırcı et al. (2019); Veggie Meter® [57] | NR | Accessibility and availability of fruit and vegetables at home | (a) Parent-reported online survey: Focus on Veggies. This is a two-item questionnaire: Item 1—Child behaviors measured with six questions; Item 2—Parent behavior measured with four questions. (b) Electronic food photos: Parents were trained and reminded to send photos via text or email of each meal and snack the child ate on the selected days using their own mobile devices. The goal for this measure was to determine the effect of intervention on fruit and vegetable accessibility. The photos were manually coded to count total fruits and vegetables served in captured meals and snacks. | NR |
| Bayles et al. (2021); Veggie Meter® [56] | I = 267.2 ± 100.2; Seasonal Variation: Fall (268.6 ± 13.2); Winter (271.3 ± 12.5); After Winter Vacation (267.8 ± 11.3). C = 265 ± 67.5; Seasonal Variation: Fall (270.9 ± 12.1); Winter (275.6 ± 11.5); After Winter Vacation (229.6 ± 10.3). | Fruit and vegetable liking score | Self-reported pictorial liking tool was used to identify preschool children’s liking for nine target vegetables (broccoli, cauliflower, spinach, radish, sweet potato, cucumber, tomato, carrot, and pea pod) and other foods commonly consumed by children (e.g., hotdog, yogurt). | NR |
| Burkholder et al. (2021); Veggie Meter® [60] | Total 266 ± 82.9; NR Sex: Male 282.5 ± 75.1 Female 243.4 ± 88.9 Age: 3 years 241 ± 79.4; 4 years 267 ± 68.8; 5 years 339 ± 137.5. Seasonal Variation: Fall (267.6 ± 8.7); Before Winter Vacation (273.8 ± 9.3); After Winter Vacation (228.7 ± 10.3). | Fruits and vegetable availability across summer, fall, and winter | Head Start menu for study duration | NA |
| Ermakov et al. (2018); Veggie Meter® [62] | Total 380 ± NR; NR | NA | NA | |
| Jung et al. (2014); LED-based compact scanner system, Opsolution GmbH, Kassel, Germany [59] | Korean 5.81 ± 0.1; German 4.62 ± 0.1; Immigrant Korean 4.77 ± 0.2 | Fruit and vegetable consumption | Self-reported questionnaire asking about sex, age, BMI, subjective stress level (personal and occupational), vegetable and fruit consumption, smoking, and Korean or Western dietary habits. | NR |
| Jones et al. (2021); Veggie Meter® [58] | Seasonal Variation: Fall 2018 156.2 ± 78; Spring 2019 211 ± 76.5; Fall 2019 195.4 ± 64.1. | NA | NA | NA |
| Liu et al. (2021); Veggie Meter® [50] | Total 304.1 ± 100.7; NR | Total carotenoid intake | Seven-day diet record, parent- and participant-reported | r = 0.25; p < 0.05 |
| Martinelli et al. (2021); Veggie Meter® [51] | Total 210 ± 72; 34–447 High-income school 201 ± 80 Low-income school 221 ± 59 | Fruit and vegetable consumption | Self-reported School Physical Activity and Nutrition (SPAN) survey | r = 0.17, p = 0.042 |
| May et al. (2020); Veggie Meter® [61] | Total 266 ± 82.9; NR Sex: Male 282.5 ± 75.1 Female 243.4 ± 88.9 Race: Black 265.23 ± 84.4 White 281 ± 91.6 Other 263 ± 77.9 Weight Status: Healthy 260.4 ± 89.1 Overweight/Obese 274.6 ± 75 | Fruit and vegetable liking score | Self-reported pictorial liking tool was used to identify preschool children’s liking for 2 fruits and 10 vegetables. | NS range of correlation for the liking score of 12 fruits and vegetables, r = [−0.1 to 0.1]; range of p values [0.3 to 1] |
| Nagao-Sato et al. (2021); Veggie Meter® [52] | Total 225 ± 95; (All Latino) Sex: Male 229 ± 89 Female 221 ± 100 Annual Household Income: USD <25,000 231 ± 105 USD ≥25,000 218 ± 86 Weight Status: Underweight/normal weight 235 ± 90 Overweight/Obese 218 ± 98 Seasonal Variation: Fall 242 ± 102; Winter 211 ± 86; | Fruit and vegetable intake, total carotenoid intake | Three 24 h dietary recall interviews were completed, where one interview was conducted in-person and two others were via phone calls over three weeks. | Fruit and vegetable intake, rf = 0.27, p < 0.05 Total carotenoid intake, r2 = 0.25, p < 0.05. |
| Takeuchi et al. (2022); Veggie Meter® [53] | Total 349 ± 104; 138–822 | Fruit intake, green-yellow vegetable intake, light yellow vegetable intake | Child-reported food frequency questionnaire administered by guardians | Fruit intake, ß1 (unstandardized beta coefficient) = 13.7, p = 0.04 Green-yellow vegetable intake, ß2 (Unstandardized beta coefficient) = 16.0, p = 0.01 Light yellow vegetable intake, ß3 = −5.17, p = 0.56 |
| Covariates | Types of Relationship Found in Studies a | ||
|---|---|---|---|
| Positive | Inverse | None | |
| Demographic Characteristics | |||
| Sex (Female = 0, Male = 1) | Burkholder et al. (2021) [60] Jung et al. (2014) [59] May et al. (2020) [61] | Martinelli et al. (2021) [51] Nagao-Sato et al. (2021) [52] Liu et al. (2021) [50] Takeuchi et al. (2022) [53] | |
| Age | Burkholder et al. (2021) [60] Jung et al. (2014) [59] | Martinelli et al. (2021) [51] Nagao-Sato et al. (2021) [52] | |
| Race (Other = 0, White = 1) | Martinelli et al. (2021) [51] May et al. (2020) [61] | ||
| Ethnicity (Non-Hispanic = 0, Hispanic = 1) | Martinelli et al. (2021) [51] | ||
| Nationality (German = 0, Korean = 1) | Jung et al. (2014) [59] | ||
| Income | Martinelli et al. (2021) [51] | Nagao-Sato et al. (2021) [52] Liu et al. (2021) [50] | |
| Employment status | Nagao-Sato et al. (2021) [52] | ||
| Mother’s education | Liu et al. (2021) [50] | ||
| Body Weight | |||
| Overweight/obesity/BMI percentile | Jung et al. (2014) [59] Liu et al. (2021) [50] | May et al. (2020) [61] Nagao-Sato et al. (2021) [52] Jones et al. (2021) [58] | |
| Percent body fat | Liu et al. (2021) [50] | ||
| Visceral adiposity | Liu et al. (2021) [50] | ||
| Weight for gestational age percentile | Liu et al. (2021) [50] | ||
| Others | |||
| Seasonal variation (Winter) | Nagao-Sato et al. (2021) Bayles et al. (2021) [56] Burkholder et al. (2021) | ||
| Home food availability and accessibility | Nagao-Sato et al. (2021) [52] | ||
| Breastfeeding exposure | Liu et al. (2021) [50] | ||
| Nutritional knowledge | Jones et al. (2021) [58] | ||
| Exercises | Takeuchi et al. (2022) [53] | ||
| Passive smoking | Takeuchi et al. (2022) [53] | ||
Disclaimer/Publisher’s Note: The statements, opinions and data contained in all publications are solely those of the individual author(s) and contributor(s) and not of MDPI and/or the editor(s). MDPI and/or the editor(s) disclaim responsibility for any injury to people or property resulting from any ideas, methods, instructions or products referred to in the content. |
© 2023 by the authors. Licensee MDPI, Basel, Switzerland. This article is an open access article distributed under the terms and conditions of the Creative Commons Attribution (CC BY) license (https://creativecommons.org/licenses/by/4.0/).
Share and Cite
Hasnin, S.; Dev, D.A.; Swindle, T.; Sisson, S.B.; Pitts, S.J.; Purkait, T.; Clifton, S.C.; Dixon, J.; Stage, V.C. Systematic Review of Reflection Spectroscopy-Based Skin Carotenoid Assessment in Children. Nutrients 2023, 15, 1315. https://doi.org/10.3390/nu15061315
Hasnin S, Dev DA, Swindle T, Sisson SB, Pitts SJ, Purkait T, Clifton SC, Dixon J, Stage VC. Systematic Review of Reflection Spectroscopy-Based Skin Carotenoid Assessment in Children. Nutrients. 2023; 15(6):1315. https://doi.org/10.3390/nu15061315
Chicago/Turabian StyleHasnin, Saima, Dipti A. Dev, Taren Swindle, Susan B. Sisson, Stephanie Jilcott Pitts, Tirna Purkait, Shari C. Clifton, Jocelyn Dixon, and Virginia C. Stage. 2023. "Systematic Review of Reflection Spectroscopy-Based Skin Carotenoid Assessment in Children" Nutrients 15, no. 6: 1315. https://doi.org/10.3390/nu15061315
APA StyleHasnin, S., Dev, D. A., Swindle, T., Sisson, S. B., Pitts, S. J., Purkait, T., Clifton, S. C., Dixon, J., & Stage, V. C. (2023). Systematic Review of Reflection Spectroscopy-Based Skin Carotenoid Assessment in Children. Nutrients, 15(6), 1315. https://doi.org/10.3390/nu15061315