
Maternal Diet Quality during Pregnancy Is Associated with Neonatal Brain White Matter Development


Abstract
:1. Introduction
2. Materials and Methods
2.1. Subjects
2.2. HEI Assessment of Pregnant Women
2.3. MRI Data Acquisition
2.4. MRI Data Analysis
2.5. Statistics
3. Results
4. Discussion
5. Conclusions
Author Contributions
Funding
Institutional Review Board Statement
Informed Consent Statement
Data Availability Statement
Acknowledgments
Conflicts of Interest
References
- Gropper, S.S. The Role of Nutrition in Chronic Disease. Nutrients 2023, 15, 664. [Google Scholar] [CrossRef] [PubMed]
- U.S. Department of Health and Human Services and U.S. Department of Agriculture. 2015–2020 Dietary Guidelines for Americans, 8th ed.; 2015. Available online: http://health.gov/dietaryguidelines/2015/guidelines/ (accessed on 30 October 2023).
- Hanley, B.; Dijane, J.; Fewtrell, M.; Grynberg, A.; Hummel, S.; Junien, C.; Koletzko, B.; Lewis, S.; Renz, H.; Symonds, M.; et al. Metabolic imprinting, programming and epigenetics—A review of present priorities and future opportunities. Br. J. Nutr. 2010, 104, S1–S25. [Google Scholar] [CrossRef] [PubMed]
- Bazer, F.W.; Spencer, T.E.; Wu, G.; Cudd, T.A.; Meininger, C.J. Maternal Nutrition and Fetal Development. J. Nutr. 2004, 134, 2169–2172. [Google Scholar] [CrossRef] [PubMed]
- Mahmassani, H.A.; Switkowski, K.M.; Scott, T.M.; Johnson, E.J.; Rifas-Shiman, S.L.; Oken, E.; Jacques, P.F. Maternal diet quality during pregnancy and child cognition and behavior in a US cohort. Am. J. Clin. Nutr. 2022, 115, 128–141. [Google Scholar] [CrossRef] [PubMed]
- Crovetto, F.; Nakaki, A.; Arranz, A.; Borras, R.; Vellvé, K.; Paules, C.; Boutet, M.L.; Castro-Barquero, S.; Freitas, T.; Casas, R.; et al. Effect of a Mediterranean Diet or Mindfulness-Based Stress Reduction During Pregnancy on Child Neurodevelopment. JAMA Netw. Open 2023, 6, e2330255. [Google Scholar] [CrossRef] [PubMed]
- Zupo, R.; Castellana, F.; Boero, G.; Matera, E.; Colacicco, G.; Piscitelli, P.; Clodoveo, M.L.; Rondanelli, M.; Panza, F.; Lozupone, M.; et al. Processed foods and diet quality in pregnancy may affect child neurodevelopment disorders: A narrative review. Nutr. Neurosci. 2023, 1–21. [Google Scholar] [CrossRef] [PubMed]
- Hibbeln, J.R.; Spiller, P.; Brenna, J.T.; Golding, J.; Holub, B.J.; Harris, W.S.; Kris-Etherton, P.; Lands, B.; Connor, S.L.; Myers, G.; et al. Relationships between seafood consumption during pregnancy and childhood and neurocognitive development: Two systematic reviews. Prostaglandins Leukot. Essent. Fat. Acids 2019, 151, 14–36. [Google Scholar] [CrossRef] [PubMed]
- Golding, J.; Taylor, C.; Iles-Caven, Y.; Gregory, S. The benefits of fish intake: Results concerning prenatal mercury exposure and child outcomes from the ALSPAC prebirth cohort. Neurotoxicology 2022, 91, 22–30. [Google Scholar] [CrossRef]
- Bolduc, F.V.; Lau, A.; Rosenfelt, C.S.; Langer, S.; Wang, N.; Smithson, L.; Lefebvre, D.; Alexander, R.T.; Dickson, C.T.; Li, L.; et al. Cognitive Enhancement in Infants Associated with Increased Maternal Fruit Intake During Pregnancy: Results from a Birth Cohort Study with Validation in an Animal Model. Ebiomedicine 2016, 8, 331–340. [Google Scholar] [CrossRef]
- Freitas-Vilela, A.A.; Pearson, R.M.; Emmett, P.; Heron, J.; Smith, A.D.A.C.; Emond, A.; Hibbeln, J.R.; Castro, M.B.T.; Kac, G. Maternal dietary patterns during pregnancy and intelligence quotients in the offspring at 8 years of age: Findings from the ALSPAC cohort. Matern. Child Nutr. 2018, 14, e12431. [Google Scholar] [CrossRef]
- Gignac, F.; Romaguera, D.; Fernandez-Barres, S.; Phillipat, C.; Garcia Esteban, R.; Lopez-Vicente, M.; Vioque, J.; Fernandez-Somoano, A.; Tardon, A.; Iniguez, C.; et al. Maternal nut intake in pregnancy and child neuropsychological development up to 8 years old: A population-based cohort study in Spain. Eur. J. Epidemiol. 2019, 34, 661–673. [Google Scholar] [CrossRef] [PubMed]
- Taylor, R.M.; Blumfield, M.L.; Ashton, L.M.; Hure, A.J.; Smith, R.; Buckley, N.; Drysdale, K.; Collins, C.E. Macronutrient Intake in Pregnancy and Child Cognitive and Behavioural Outcomes. Children 2021, 8, 425. [Google Scholar] [CrossRef] [PubMed]
- Cohen, J.F.W.; Rifas-Shiman, S.L.; Young, J.; Oken, E. Associations of Prenatal and Child Sugar Intake With Child Cognition. Am. J. Prev. Med. 2018, 54, 727–735. [Google Scholar] [CrossRef] [PubMed]
- Lebel, C.; Treit, S.; Beaulieu, C. A review of diffusion MRI of typical white matter development from early childhood to young adulthood. NMR Biomed. 2019, 32, e3778. [Google Scholar] [CrossRef] [PubMed]
- Sowell, E.R.; Thompson, P.M.; Leonard, C.M.; Welcome, S.E.; Kan, E.; Toga, A.W. Longitudinal mapping of cortical thickness and brain growth in normal children. J. Neurosci. 2004, 24, 8223–8231. [Google Scholar] [CrossRef]
- Le Bihan, D.; Mangin, J.-F.o.; Poupon, C.; Clark, C.A.; Pappata, S.; Molko, N.; Chabriat, H. Diffusion tensor imaging: Concepts and applications. J. Magn. Reson. Imaging 2001, 13, 534–546. [Google Scholar] [CrossRef] [PubMed]
- Schmithorst, V.J.; Yuan, W. White matter development during adolescence as shown by diffusion MRI. Brain Cogn. 2010, 72, 16–25. [Google Scholar] [CrossRef]
- Schmithorst, V.J.; Wilke, M.; Dardzinski, B.J.; Holland, S.K. Cognitive functions correlate with white matter architecture in a normal pediatric population: A diffusion tensor MRI study. Hum. Brain Mapp. 2005, 26, 139–147. [Google Scholar] [CrossRef]
- Feng, K.; Rowell, A.C.; Andres, A.; Bellando, B.J.; Lou, X.; Glasier, C.M.; Ramakrishnaiah, R.H.; Badger, T.M.; Ou, X. Diffusion Tensor MRI of White Matter of Healthy Full-term Newborns: Relationship to Neurodevelopmental Outcomes. Radiology 2019, 292, 179–187. [Google Scholar] [CrossRef]
- Diaz, E.C.; Williams, D.K.; Cotter, M.; Sims, C.R.; Wolfe, R.R.; Andres, A.; Borsheim, E. Breastfeeding duration modifies the association between maternal weight status and offspring dietary palmitate oxidation. Am. J. Clin. Nutr. 2022, 116, 404–414. [Google Scholar] [CrossRef]
- Reedy, J.; Lerman, J.L.; Krebs-Smith, S.M.; Kirkpatrick, S.I.; Pannucci, T.E.; Wilson, M.M.; Subar, A.F.; Kahle, L.L.; Tooze, J.A. Evaluation of the Healthy Eating Index-2015. J. Acad. Nutr. Diet. 2018, 118, 1622–1633. [Google Scholar] [CrossRef] [PubMed]
- Krebs-Smith, S.M.; Pannucci, T.E.; Subar, A.F.; Kirkpatrick, S.I.; Lerman, J.L.; Tooze, J.A.; Wilson, M.M.; Reedy, J. Update of the Healthy Eating Index: HEI-2015. J. Acad. Nutr. Diet. 2018, 118, 1591–1602. [Google Scholar] [CrossRef] [PubMed]
- Schap, T.; Kuczynski, K.; Hiza, H. Healthy Eating Index—Beyond the Score. J. Acad. Nutr. Diet. 2017, 117, 519–521. [Google Scholar] [CrossRef] [PubMed]
- Pick, M.E.; Edwards, M.; Moreau, D.; Ryan, E.A. Assessment of diet quality in pregnant women using the Healthy Eating Index. J. Am. Diet. Assoc. 2005, 105, 240–246. [Google Scholar] [CrossRef]
- Smith, S.M.; Jenkinson, M.; Johansen-Berg, H.; Rueckert, D.; Nichols, T.E.; Mackay, C.E.; Watkins, K.E.; Ciccarelli, O.; Cader, M.Z.; Matthews, P.M.; et al. Tract-based spatial statistics: Voxelwise analysis of multi-subject diffusion data. Neuroimage 2006, 31, 1487–1505. [Google Scholar] [CrossRef]
- Ou, X.; Glasier, C.M.; Ramakrishnaiah, R.H.; Kanfi, A.; Rowell, A.C.; Pivik, R.T.; Andres, A.; Cleves, M.A.; Badger, T.M. Gestational Age at Birth and Brain White Matter Development in Term-Born Infants and Children. Am. J. Neuroradiol. 2017, 38, 2373–2379. [Google Scholar] [CrossRef]
- Na, X.; Phelan, N.E.; Tadros, M.R.; Wu, Z.; Andres, A.; Badger, T.M.; Glasier, C.M.; Ramakrishnaiah, R.R.; Rowell, A.C.; Wang, L.; et al. Maternal Obesity during Pregnancy is Associated with Lower Cortical Thickness in the Neonate Brain. Am. J. Neuroradiol. 2021, 42, 2238–2244. [Google Scholar] [CrossRef]
- Salzwedel, A.P.; Gao, W.; Andres, A.; Badger, T.M.; Glasier, C.M.; Ramakrishnaiah, R.H.; Rowell, A.C.; Ou, X. Maternal Adiposity Influences Neonatal Brain Functional Connectivity. Front. Hum. Neurosci. 2019, 12, 514. [Google Scholar] [CrossRef]
- Sotardi, S.; Gollub, R.L.; Bates, S.V.; Weiss, R.; Murphy, S.N.; Grant, P.E.; Ou, Y. Voxelwise and Regional Brain Apparent Diffusion Coefficient Changes on MRI from Birth to 6 Years of Age. Radiology 2021, 298, 415–424. [Google Scholar] [CrossRef]
- Bartha, A.L.; Yap, K.R.L.; Miller, S.P.; Jeremy, R.J.; Nishimoto, M.; Vigneron, D.B.; Barkovich, A.J.; Ferriero, D.M. The normal neonatal brain: MR imaging, diffusion tensor imaging, and 3D MR spectroscopy in healthy term neonates. Am. J. Neuroradiol. 2007, 28, 1015–1021. [Google Scholar] [CrossRef]
- Hermoye, L.; Saint-Maitin, C.; Cosnard, G.; Lee, S.K.; Kim, J.; Nassogne, M.C.; Menten, R.; Clapuyt, P.; Donohue, P.K.; Hua, K.G.; et al. Pediatric diffusion tensor imaging: Normal database and observation of the white matter maturation in early childhood. Neuroimage 2006, 29, 493–504. [Google Scholar] [CrossRef] [PubMed]
- Vinyard, M.; Zimmer, M.; Herrick, K.A.; Story, M.; Juan, W.; Reedy, J. Healthy Eating Index-2015 Scores Vary by Types of Food Outlets in the United States. Nutrients 2021, 13, 2717. [Google Scholar] [CrossRef] [PubMed]
- Araya, B.R.; Ziegler, A.A.; Grobe, C.C.; Grobe, J.L.; Segar, J.L. Sodium and Growth in Preterm Infants: A Review. Newborn 2023, 2, 142–147. [Google Scholar] [CrossRef] [PubMed]
- Al-Dahhan, J. Effect of salt supplementation of newborn premature infants on neurodevelopmental outcome at 10–13 years of age. Arch. Dis. Child. Fetal Neonatal Ed. 2002, 86, F120–F123. [Google Scholar] [CrossRef] [PubMed]
- Yang, H.-Y.; Lee, C.-H.; Chen, H.-N.; Tsao, L.-Y.; Chen, J.-Y.; Chang, Y.-J.; Hsiao, C.-C. Neurodevelopment of preterm infants with glucose and sodium abnormalities. Pediatr. Neonatol. 2021, 62, 647–654. [Google Scholar] [CrossRef] [PubMed]
- Sibley, C.P.; Glazier, J.D.; Greenwood, S.L.; Lacey, H.; Mynett, K.; Speake, P.; Jansson, T.; Johansson, M.; Powell, T.L. Regulation of Placental Transfer: The Na+/H+ Exchanger—A Review. Placenta 2002, 23, S39–S46. [Google Scholar] [CrossRef] [PubMed]
- Faraco, G.; Brea, D.; Garcia-Bonilla, L.; Wang, G.; Racchumi, G.; Chang, H.; Buendia, I.; Santisteban, M.M.; Segarral, S.G.; Koizumi, K.; et al. Dietary salt promotes neurovascular and cognitive dysfunction through a gut-initiated TH17 response. Nat. Neurosci. 2018, 21, 240–249. [Google Scholar] [CrossRef]
- Faraco, G.; Hochrainer, K.; Segarra, S.G.; Schaeffer, S.; Santisteban, M.M.; Menon, A.; Jiang, H.; Holtzman, D.M.; Anrather, J.; Iadecola, C. Dietary salt promotes cognitive impairment through tau phosphorylation. Nature 2019, 574, 686–690. [Google Scholar] [CrossRef]
- Kubota, H.; Kunisawa, K.; Wulaer, B.; Hasegawa, M.; Kurahashi, H.; Sakata, T.; Tezuka, H.; Kugita, M.; Nagao, S.; Nagai, T.; et al. High salt induces cognitive impairment via the interaction of the angiotensin II-AT1 and prostaglandin E2-EP1 systems. Br. J. Pharmacol. 2023, 180, 2393–2411. [Google Scholar] [CrossRef]
- Gilman, T.L.; Mitchell, N.C.; Daws, L.C.; Toney, G.M. Neuroinflammation Contributes to High Salt Intake-Augmented Neuronal Activation and Active Coping Responses to Acute Stress. Int. J. Neuropsychopharmacol. 2019, 22, 137–142. [Google Scholar] [CrossRef]
- Hu, L.; Zhu, S.; Peng, X.; Li, K.; Peng, W.; Zhong, Y.; Kang, C.; Cao, X.; Liu, Z.; Zhao, B. High Salt Elicits Brain Inflammation and Cognitive Dysfunction, Accompanied by Alternations in the Gut Microbiota and Decreased SCFA Production. J. Alzheimer’s Dis. 2020, 77, 629–640. [Google Scholar] [CrossRef]
- Liu, G.; Cheng, J.; Zhang, T.; Shao, Y.; Chen, X.; Han, L.; Zhou, R.; Wu, B. Inhibition of Microbiota-dependent Trimethylamine N-Oxide Production Ameliorates High Salt Diet-Induced Sympathetic Excitation and Hypertension in Rats by Attenuating Central Neuroinflammation and Oxidative Stress. Front. Pharmacol. 2022, 13, 856914. [Google Scholar] [CrossRef]
- Shin, J.-A.; Ahn, Y.-M.; Lee, H.-A.; Park, H.; Kim, Y.-J.; Lee, H.-Y. Effect of maternal excessive sodium intake on postnatal brain development in rat offspring. Nutr. Neurosci. 2014, 18, 118–124. [Google Scholar] [CrossRef]
- Ge, Q.; Hu, X.; Ma, N.; Sun, M.; Zhang, L.; Cai, Z.; Tan, R.; Lu, H. Maternal high-salt diet during pregnancy impairs synaptic plasticity and memory in offspring. FASEB J. 2021, 35, e21244. [Google Scholar] [CrossRef]
- Bendlin, B.B.; Fitzgerald, M.E.; Ries, M.L.; Xu, G.; Kastman, E.K.; Thiel, B.W.; Rowley, H.A.; Lazar, M.; Alexander, A.L.; Johnson, S.C. White Matter in Aging and Cognition: A Cross-Sectional Study of Microstructure in Adults Aged Eighteen to Eighty-Three. Dev. Neuropsychol. 2010, 35, 257–277. [Google Scholar] [CrossRef]
- Kochunov, P.; Coyle, T.R.; Rowland, L.M.; Jahanshad, N.; Thompson, P.M.; Kelly, S.; Du, X.; Sampath, H.; Bruce, H.; Chiappelli, J.; et al. Association of White Matter With Core Cognitive Deficits in Patients With Schizophrenia. JAMA Psychiatry 2017, 74, 958. [Google Scholar] [CrossRef]
- Ngo, C.T.; Alm, K.H.; Metoki, A.; Hampton, W.; Riggins, T.; Newcombe, N.S.; Olson, I.R. White matter structural connectivity and episodic memory in early childhood. Dev. Cogn. Neurosci. 2017, 28, 41–53. [Google Scholar] [CrossRef]
- Samara, A.; Feng, K.; Pivik, R.T.; Jarratt, K.P.; Badger, T.M.; Ou, X. White Matter Microstructure Correlates with Memory Performance in Healthy Children: A Diffusion Tensor Imaging Study. J. Neuroimaging 2018, 29, 233–241. [Google Scholar] [CrossRef]
- Rollins, C.K.; Watson, C.G.; Asaro, L.A.; Wypij, D.; Vajapeyam, S.; Bellinger, D.C.; DeMaso, D.R.; Robertson, R.L.; Newburger, J.W.; Rivkin, M.J. White Matter Microstructure and Cognition in Adolescents with Congenital Heart Disease. J. Pediatr. 2014, 165, 936–944.e932. [Google Scholar] [CrossRef]
- Kooistra, C.A.; Heilman, K.M. Memory loss from a subcortical white matter infarct. J. Neurol. Neurosurg. Psychiatry 1988, 51, 866–869. [Google Scholar] [CrossRef]
- Theilmann, R.J.; Reed, J.D.; Song, D.D.; Huang, M.X.; Lee, R.R.; Litvan, I.; Harrington, D.L. White-Matter Changes Correlate with Cognitive Functioning in Parkinson’s Disease. Front. Neurol. 2013, 4, 37. [Google Scholar] [CrossRef]
- Chen, Y.; Wang, A.; Tang, J.; Wei, D.; Li, P.; Chen, K.; Wang, Y.; Zhang, Z. Association of white matter integrity and cognitive functions in patients with subcortical silent lacunar infarcts. Stroke 2015, 46, 1123–1126. [Google Scholar] [CrossRef]
- Stasenko, A.; Kaestner, E.; Reyes, A.; Lalani, S.J.; Paul, B.; Hegde, M.; Helm, J.L.; Ben-Haim, S.; McDonald, C.R. Association Between Microstructural Asymmetry of Temporal Lobe White Matter and Memory Decline After Anterior Temporal Lobectomy. Neurology 2022, 98, e1151–e1162. [Google Scholar] [CrossRef]
- Horgos, B.; Mecea, M.; Boer, A.; Szabo, B.; Buruiana, A.; Stamatian, F.; Mihu, C.-M.; Florian, I.Ş.; Susman, S.; Pascalau, R. White Matter Dissection of the Fetal Brain. Front. Neuroanat. 2020, 14, 584266. [Google Scholar] [CrossRef]
- U.S. Department of Agriculture, Food and Nutrition Service, Center for Nutrition Policy and Promotion. Average Healthy Eating Index-2015 Scores for Non-Pregnant Non-Lactating, Pregnant and Lactating Women 20–44 Years. In What We Eat in America, NHANES 2013–2018; 2021; Available online: https://fns-prod.azureedge.us/sites/default/files/media/file/HEI-2015_PregnantAndLactatingWomen20-44Years_NHANES2013-2018.pdf (accessed on 30 October 2023).
- Zoellner, J.; You, W.; Connell, C.; Smith-Ray, R.L.; Allen, K.; Tucker, K.L.; Davy, B.M.; Estabrooks, P. Health Literacy Is Associated with Healthy Eating Index Scores and Sugar-Sweetened Beverage Intake: Findings from the Rural Lower Mississippi Delta. J. Am. Diet. Assoc. 2011, 111, 1012–1020. [Google Scholar] [CrossRef]
- Rose, C.M.; Gupta, S.; Buszkiewicz, J.; Ko, L.K.; Mou, J.; Cook, A.; Moudon, A.V.; Aggarwal, A.; Drewnowski, A. Small increments in diet cost can improve compliance with the Dietary Guidelines for Americans. Soc. Sci. Med. 2020, 266, 113359. [Google Scholar] [CrossRef]
- Crawford, P.B.; Obarzanek, E.; Morrison, J.; Sabry, Z.I. Comparative advantage of 3-day food records over 24-hour recall and 5-day food frequency validated by observation of 9- and 10-year-old girls. J. Am. Diet. Assoc. 1994, 94, 626–630. [Google Scholar] [CrossRef]


| Component | Range | Scoring Standard | |
|---|---|---|---|
| Minimum Score | Maximum Score | ||
| Total fruits | [0, 5] | No fruit | ≥0.8 cup equivalents/1000 kcal |
| Whole fruits | [0, 5] | No whole fruit | ≥0.4 cup equivalents/1000 kcal |
| Total vegetables | [0, 5] | No vegetables | ≥1.1 cup equivalents/1000 kcal |
| Greens and beans | [0, 5] | No dark green vegetables or beans and peas | ≥0.2 cup equivalents/1000 kcal |
| Whole grains | [0, 10] | No whole grains | ≥1.5 oz equivalents/1000 kcal |
| Dairy | [0, 10] | No dairy | ≥1.3 cup equivalents/1000 kcal |
| Total protein foods | [0, 5] | No protein foods | ≥2.5 oz equivalents/1000 kcal |
| Seafood and plant proteins | [0, 5] | No seafood or plant proteins | ≥0.8 oz equivalents/1000 kcal |
| Fatty acids * | [0, 10] | (PUFAs + MUFAs)/SFAs ≤1.2 | (PUFAs + MUFAs)/SFAs ≥ 2.5 |
| Refined grains | [0, 10] | ≥4.3 oz equivalents/1000 kcal | ≤1.8 oz equivalents/1000 kcal |
| Sodium | [0, 10] | ≥2.0 g/1000 kcal | ≤1.1 g/1000 kcal |
| Saturated fats | [0, 10] | ≥16% of energy | ≤8% of energy |
| Added sugars | [0, 10] | ≥26% of energy | ≤6.5% of energy |
| Mean ± SD (or Counts) | Range (If Applicable) | |
|---|---|---|
| Maternal age at delivery (years) | 29.4 ± 4.0 | [22.1, 38.2] |
| Maternal BMI at time of enrollment | 26.2 ± 5.6 | [18.3, 36.5] |
| Child sex (boys/girls) | 23/21 | |
| Age at MRI (days) | 14.3 ± 1.6 | [11, 19] |
| Gestational age at birth (weeks) | 39.3 ± 1.0 | [37.3, 40.7] |
| Postmenstrual age at MRI (days) | 289.3 ± 6.5 | [277, 300] |
| Birth weight (kg) | 3.5 ± 0.5 | [2.2, 4.6] |
| Birth length (cm) | 50.6 ± 2.7 | [43.2, 54.6] |
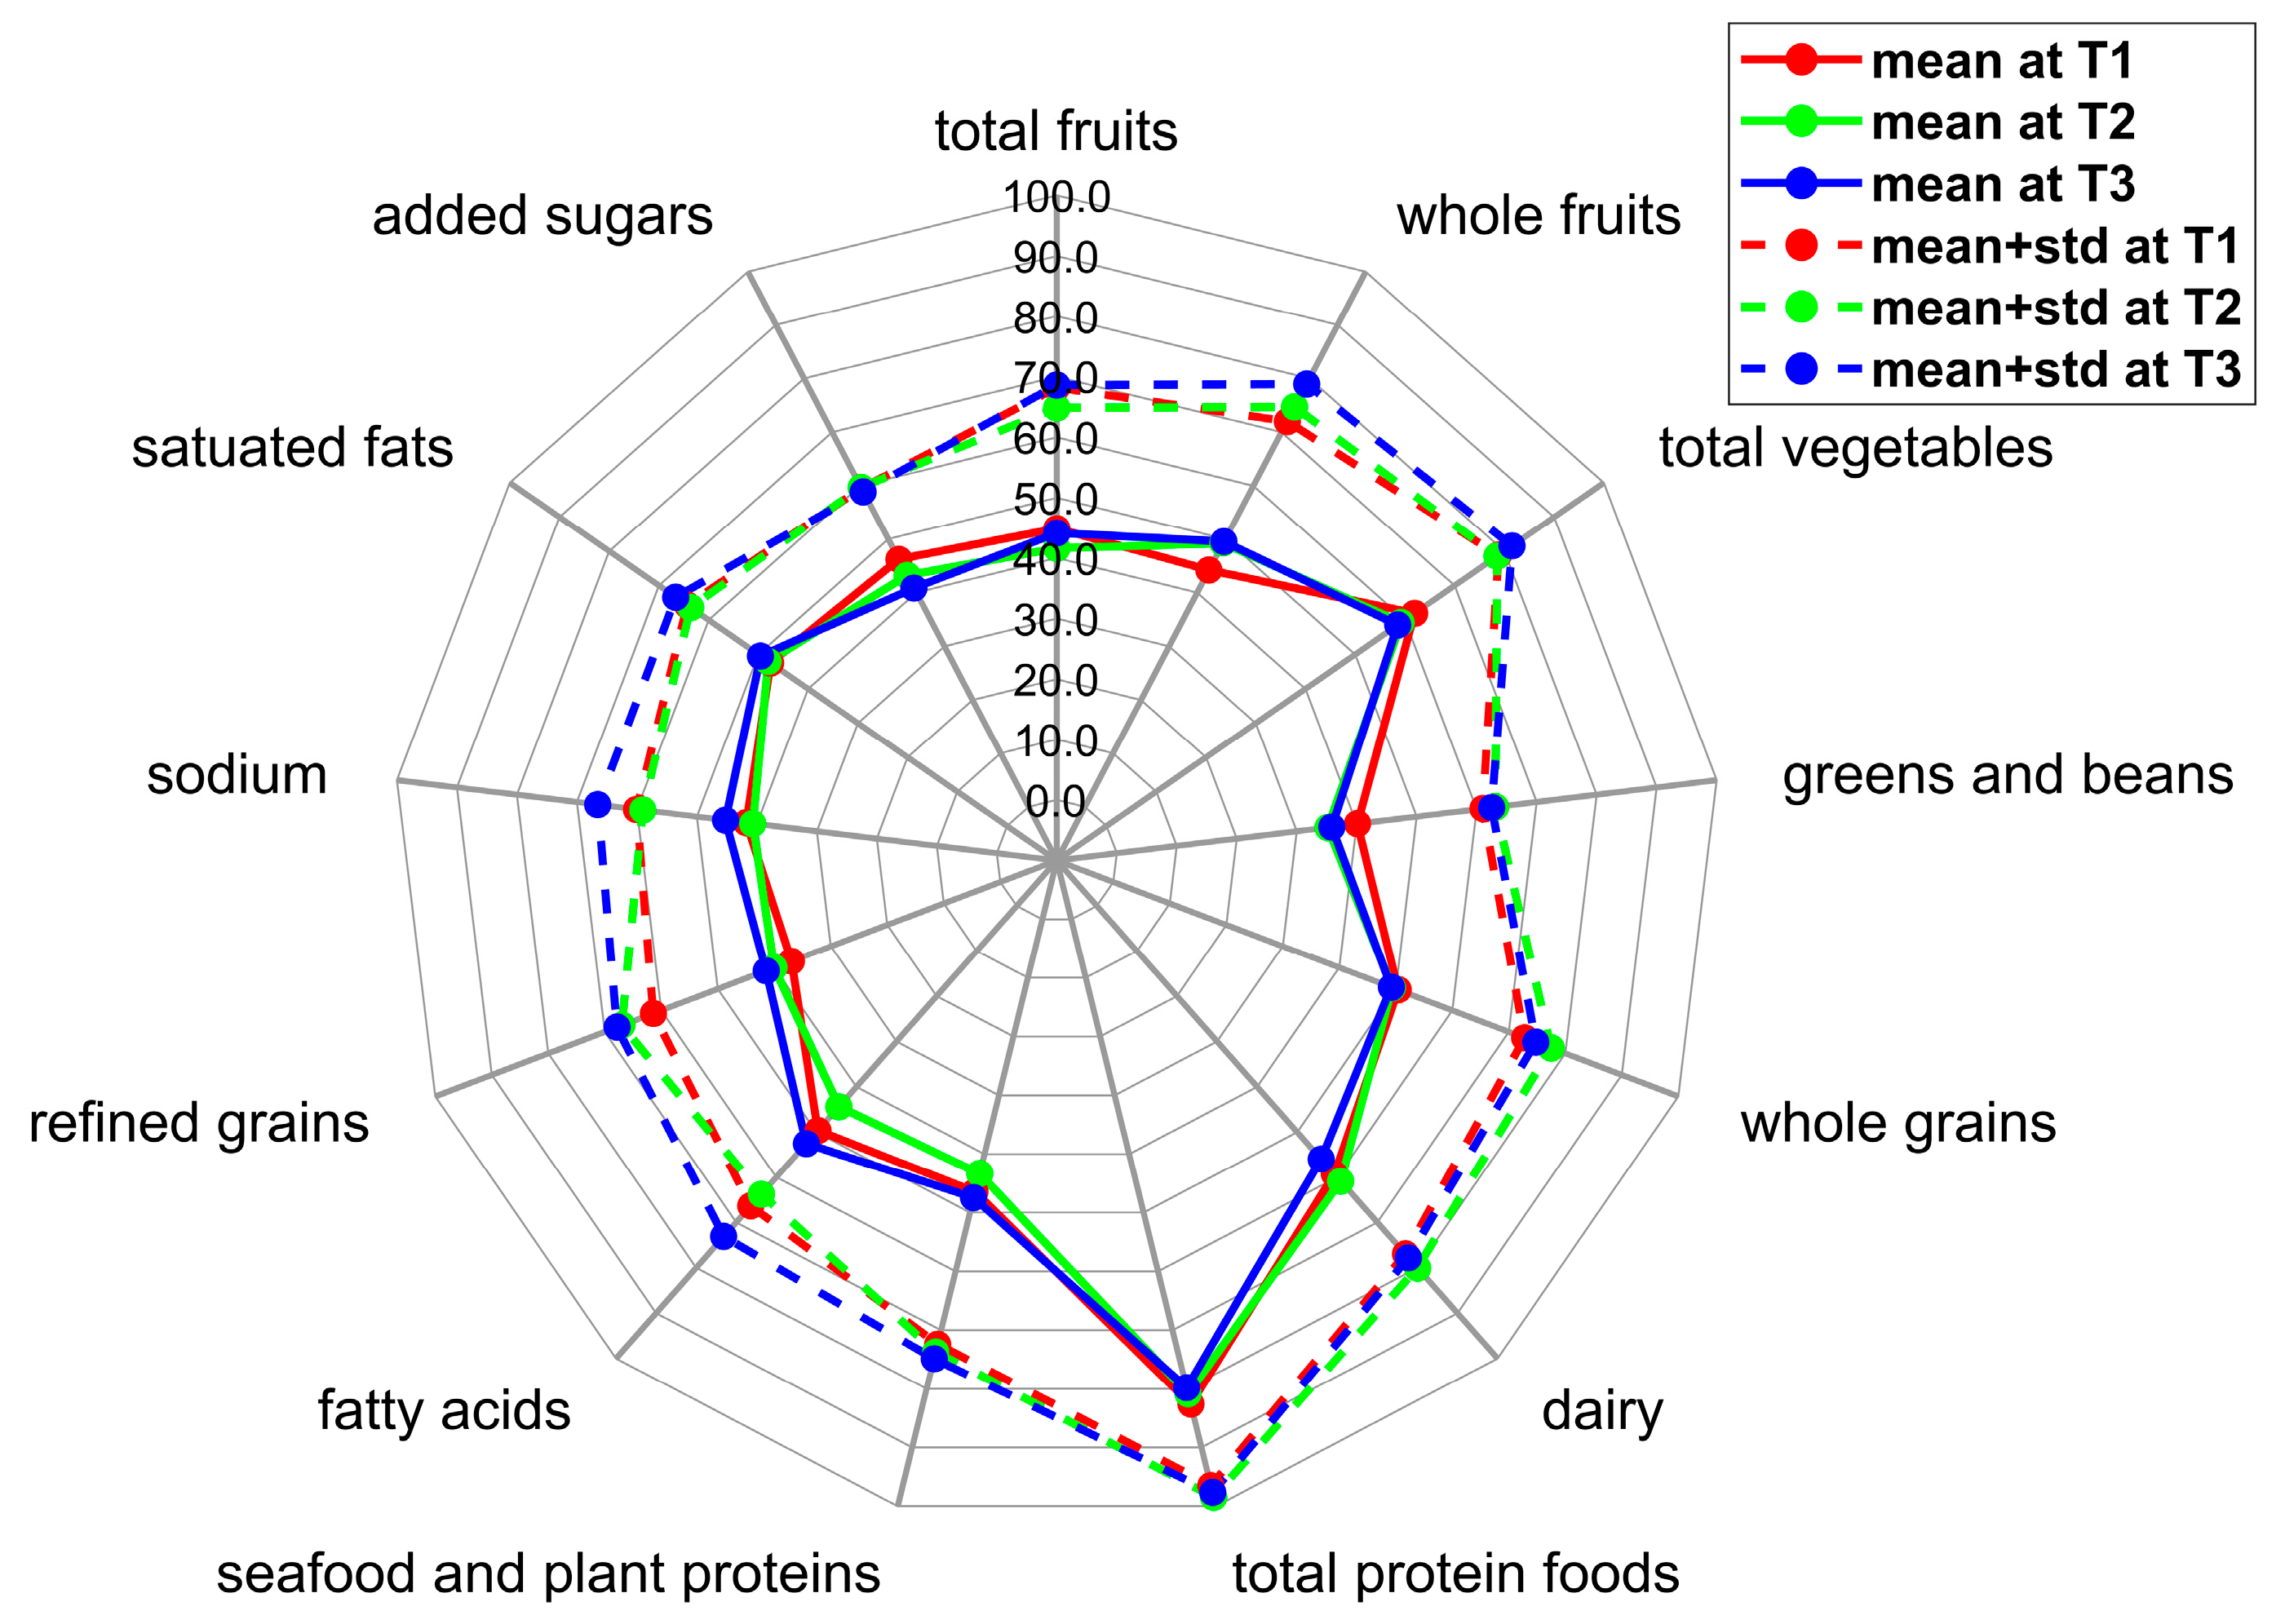
| T1 (N = 43) | T2 (N = 44) | T3 (N = 44) | ||||
|---|---|---|---|---|---|---|
| Mean ± Std | Range | Mean ± Std | Range | Mean ± Std | Range | |
| Total fruits | 2.2 ± 1.2 | [0.0, 5.0] | 2.1 ± 1.2 | [0.0, 5.0] | 2.2 ± 1.2 | [0.1, 4.9] |
| Whole fruits | 2.2 ± 1.4 | [0.0, 4.9] | 2.5 ± 1.3 | [0.0, 5.0] | 2.5 ± 1.5 | [0.0, 5.0] |
| Total vegetables | 3.1 ± 0.8 | [1.5, 5.0] | 3.0 ± 1.0 | [0.9, 4.7] | 2.9 ± 1.2 | [0.6, 5.0] |
| Greens and beans | 2.0 ± 1.0 | [0.0, 4.2] | 1.8 ± 1.4 | [0.0, 4.7] | 1.8 ± 1.3 | [0.0, 5.0] |
| Whole grains | 5.0 ± 2.2 | [0.7, 9.1] | 4.9 ± 2.8 | [0.0, 10.0] | 4.9 ± 2.6 | [0.2, 9.9] |
| Dairy | 5.9 ± 1.8 | [0.8, 9.6] | 6.1 ± 1.9 | [2.3, 9.9] | 5.6 ± 2.2 | [2.0, 10.0] |
| Total protein foods | 4.1 ± 0.7 | [1.5, 5.0] | 4.0 ± 0.9 | [1.7, 5.0] | 4.0 ± 0.9 | [1.0, 5.0] |
| Seafood and plant proteins | 2.3 ± 1.3 | [0.0, 5.0] | 2.2 ± 1.5 | [0.0, 5.0] | 2.4 ± 1.4 | [0.0, 5.0] |
| Fatty acids | 5.0 ± 1.7 | [1.5, 8.9] | 4.4 ± 1.9 | [0.3, 8.5] | 5.3 ± 2.1 | [1.1, 9.8] |
| Refined grains | 3.7 ± 2.4 | [0.0, 9.7] | 4.0 ± 2.7 | [0.0, 10.0] | 4.1 ± 2.6 | [0.0, 10.0] |
| Sodium | 4.2 ± 1.8 | [0.0, 9.2] | 4.1 ± 1.8 | [0.9, 7.7] | 4.5 ± 2.1 | [0.0, 10.0] |
| Saturated fats | 4.8 ± 1.7 | [0.7, 8.2] | 4.8 ± 1.6 | [0.6, 8.4] | 5.0 ± 1.7 | [1.1, 9.0] |
| Added sugars | 4.6 ± 1.3 | [1.9, 7.7] | 4.3 ± 1.6 | [0.0, 7.9] | 4.1 ± 1.8 | [0.0, 7.1] |
| Total score | 49.2 ± 7.2 | [35.3, 63.6] | 48.1 ± 10.1 | [28.3, 68.7] | 49.2 ± 8.5 | [34.8, 66.8] |
Disclaimer/Publisher’s Note: The statements, opinions and data contained in all publications are solely those of the individual author(s) and contributor(s) and not of MDPI and/or the editor(s). MDPI and/or the editor(s) disclaim responsibility for any injury to people or property resulting from any ideas, methods, instructions or products referred to in the content. |
© 2023 by the authors. Licensee MDPI, Basel, Switzerland. This article is an open access article distributed under the terms and conditions of the Creative Commons Attribution (CC BY) license (https://creativecommons.org/licenses/by/4.0/).
Share and Cite
Na, X.; Glasier, C.M.; Andres, A.; Ou, X. Maternal Diet Quality during Pregnancy Is Associated with Neonatal Brain White Matter Development. Nutrients 2023, 15, 5114. https://doi.org/10.3390/nu15245114
Na X, Glasier CM, Andres A, Ou X. Maternal Diet Quality during Pregnancy Is Associated with Neonatal Brain White Matter Development. Nutrients. 2023; 15(24):5114. https://doi.org/10.3390/nu15245114
Chicago/Turabian StyleNa, Xiaoxu, Charles M. Glasier, Aline Andres, and Xiawei Ou. 2023. "Maternal Diet Quality during Pregnancy Is Associated with Neonatal Brain White Matter Development" Nutrients 15, no. 24: 5114. https://doi.org/10.3390/nu15245114
APA StyleNa, X., Glasier, C. M., Andres, A., & Ou, X. (2023). Maternal Diet Quality during Pregnancy Is Associated with Neonatal Brain White Matter Development. Nutrients, 15(24), 5114. https://doi.org/10.3390/nu15245114