
Association between Neck Circumference and Chronic Kidney Disease in Korean Adults in the 2019–2021 Korea National Health and Nutrition Examination Survey
 ,
,
Abstract
:1. Introduction
2. Materials and Methods
2.1. Study Population
2.2. Demographic Characteristics and Lifestyle Survey
2.3. Anthropometric and Laboratory Measurements
2.4. The Definition of CKD and Metabolic Syndrome
2.5. Statistical Analysis
3. Results
3.1. Characteristics of Study Participants
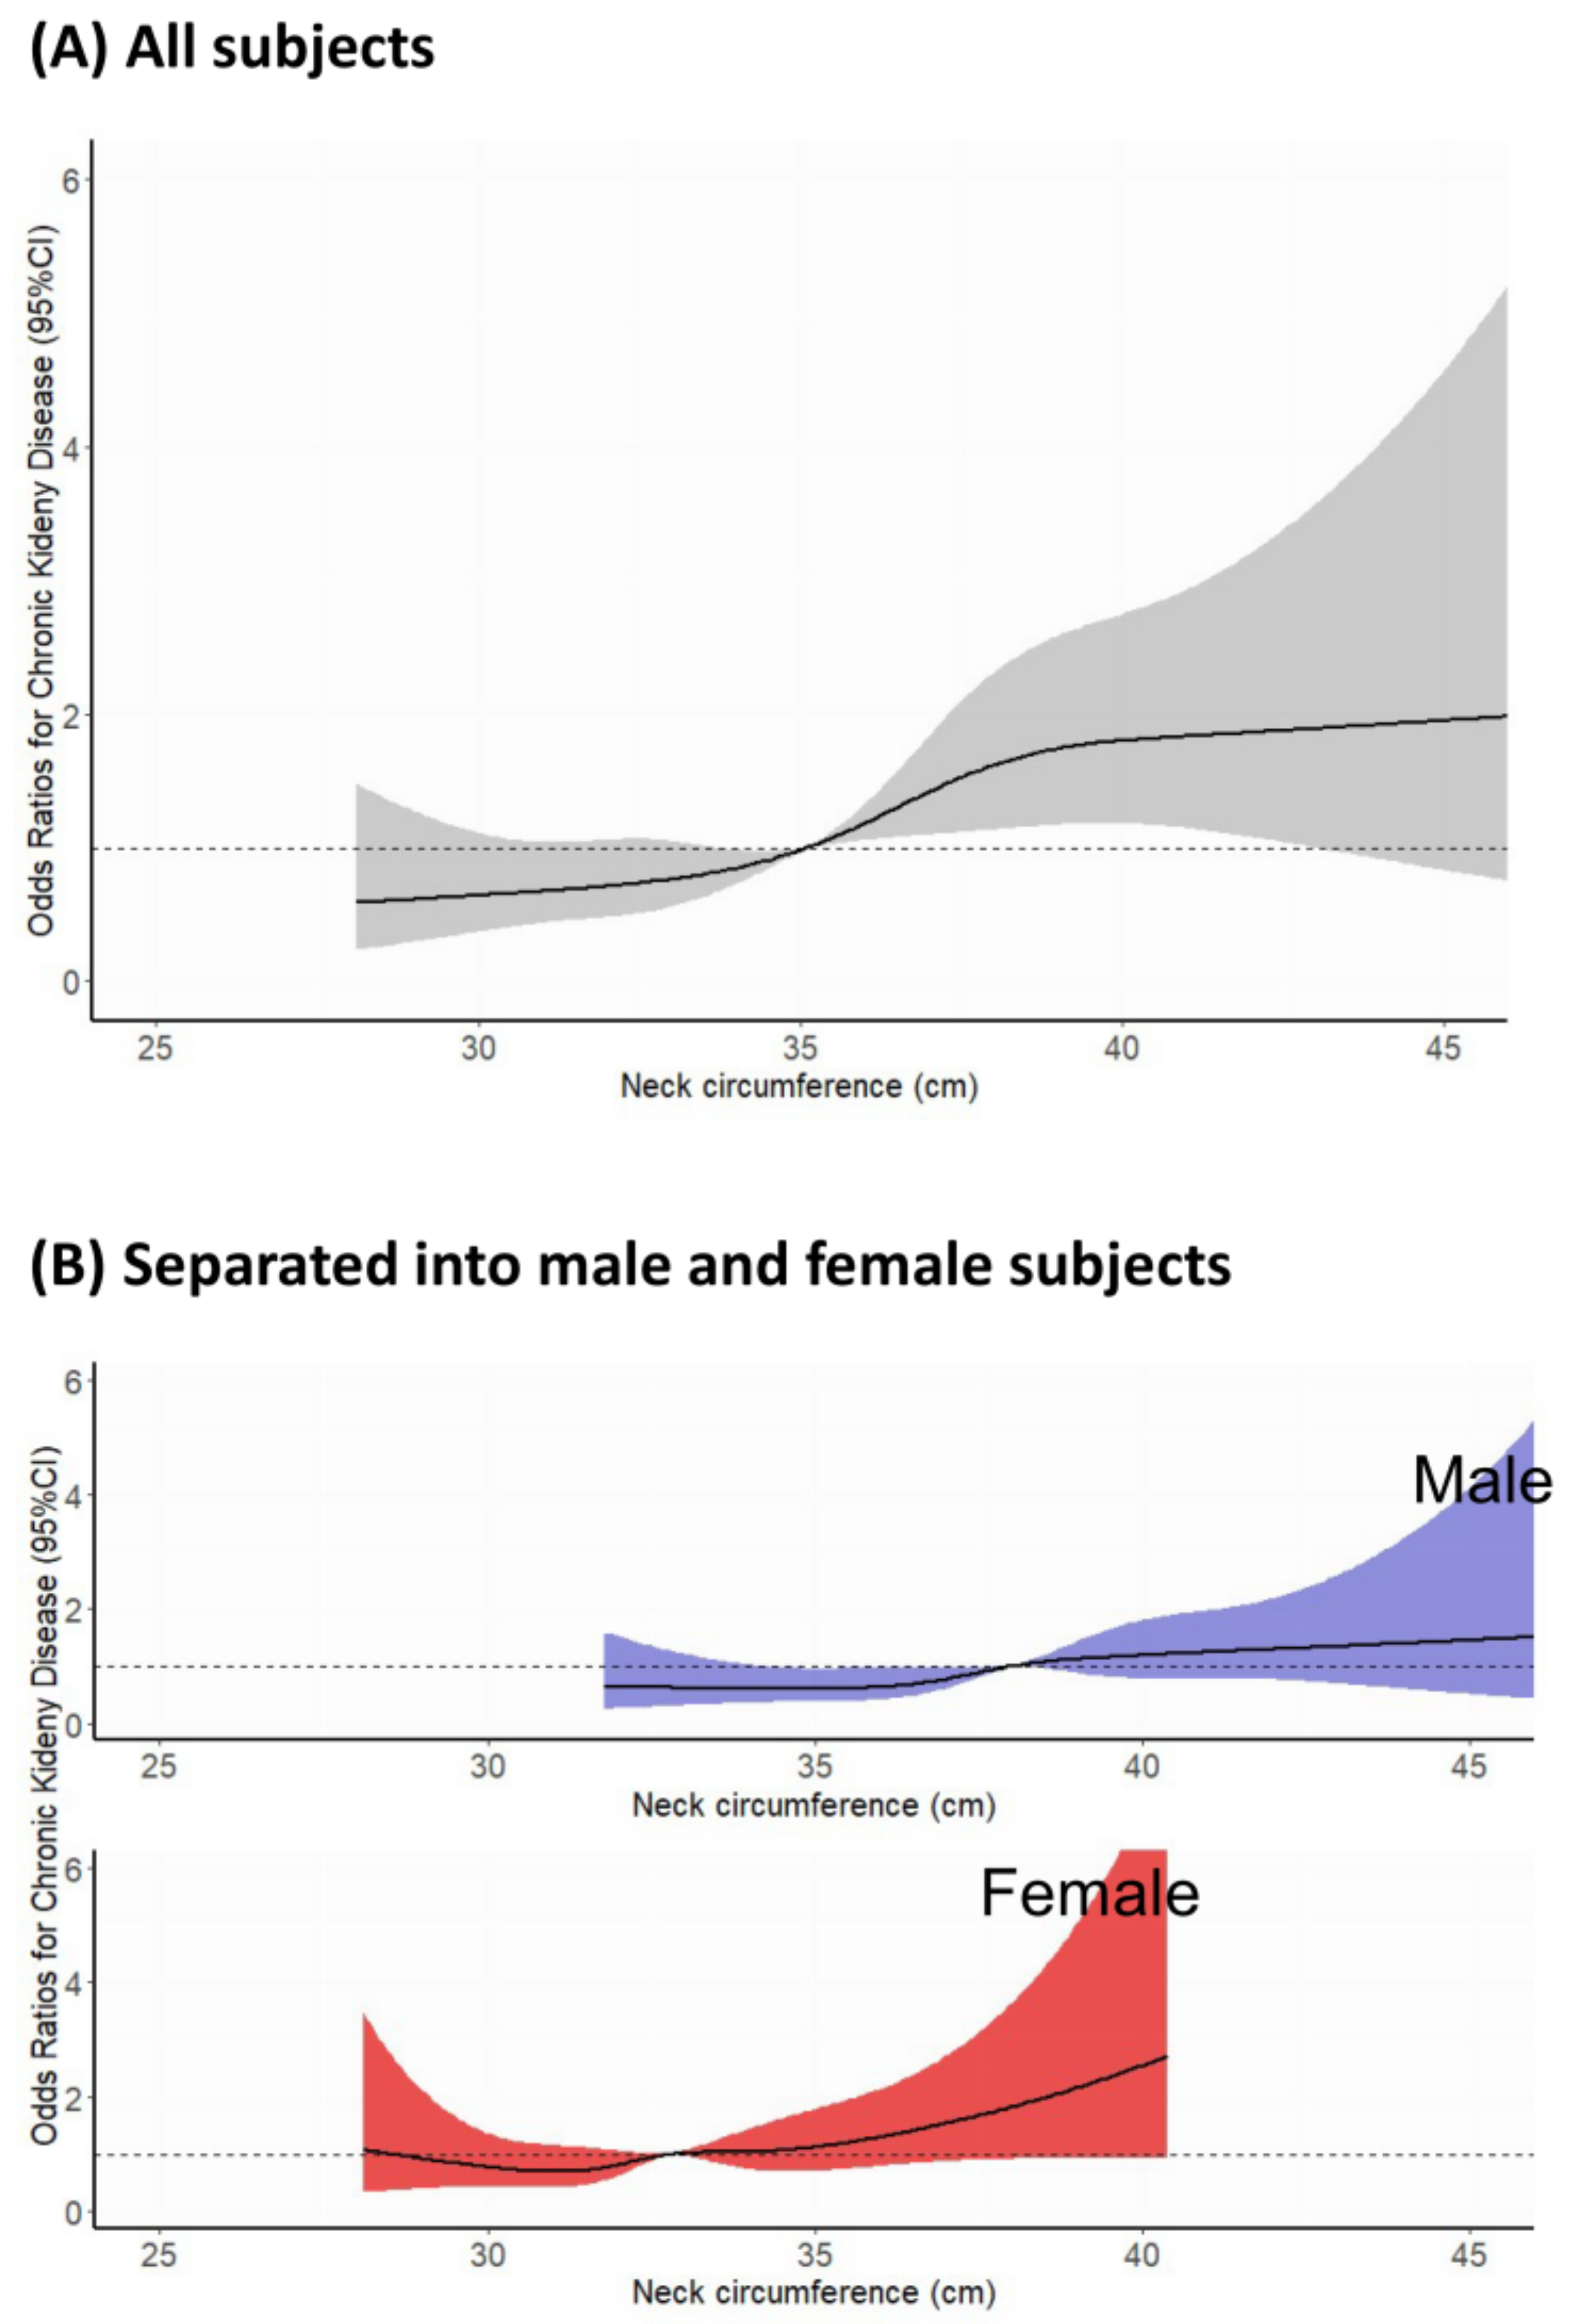
3.2. Association between NC and Prevalence of CKD
3.3. Correlation between Neck Circumference and Incidence of CKD, as Revealed by Subgroup Analysis
4. Discussion
5. Conclusions
Author Contributions
Funding
Institutional Review Board Statement
Informed Consent Statement
Data Availability Statement
Conflicts of Interest
References
- Eknoyan, G.; Lameire, N.; Eckardt, K.; Kasiske, B.; Wheeler, D.; Levin, A.; Stevens, P.; Bilous, R.; Lamb, E.; Coresh, J. KDIGO 2012 clinical practice guideline for the evaluation and management of chronic kidney disease. Kidney Int. 2013, 3, 5–14. [Google Scholar]
- Pottel, H.; Björk, J.; Rule, A.D.; Ebert, N.; Eriksen, B.O.; Dubourg, L.; Vidal-Petiot, E.; Grubb, A.; Hansson, M.; Lamb, E.J. Cystatin C–based equation to estimate GFR without the inclusion of race and sex. N. Engl. J. Med. 2023, 388, 333–343. [Google Scholar] [CrossRef]
- Inker, L.A.; Schmid, C.H.; Tighiouart, H.; Eckfeldt, J.H.; Feldman, H.I.; Greene, T.; Kusek, J.W.; Manzi, J.; Van Lente, F.; Zhang, Y.L. Estimating glomerular filtration rate from serum creatinine and cystatin C. N. Engl. J. Med. 2012, 367, 20–29. [Google Scholar] [CrossRef]
- Kovesdy, C.P. Epidemiology of chronic kidney disease: An update 2022. Kidney Int. Suppl. 2022, 12, 7–11. [Google Scholar] [CrossRef] [PubMed]
- Aitken, G.R.; Roderick, P.J.; Fraser, S.; Mindell, J.S.; O’Donoghue, D.; Day, J.; Moon, G. Change in prevalence of chronic kidney disease in England over time: Comparison of nationally representative cross-sectional surveys from 2003 to 2010. BMJ Open 2014, 4, e005480. [Google Scholar] [CrossRef] [PubMed]
- Bikbov, B.; Purcell, C.A.; Levey, A.S.; Smith, M.; Abdoli, A.; Abebe, M.; Adebayo, O.M.; Afarideh, M.; Agarwal, S.K.; Agudelo-Botero, M. Global, regional, and national burden of chronic kidney disease, 1990–2017: A systematic analysis for the Global Burden of Disease Study 2017. Lancet 2020, 395, 709–733. [Google Scholar] [CrossRef]
- Jha, V.; Al-Ghamdi, S.M.; Li, G.; Wu, M.-S.; Stafylas, P.; Retat, L.; Card-Gowers, J.; Barone, S.; Cabrera, C.; Garcia Sanchez, J.J. Global Economic Burden Associated with Chronic Kidney Disease: A Pragmatic Review of Medical Costs for the Inside CKD Research Programme. Adv. Ther. 2023, 40, 4405–4420. [Google Scholar] [CrossRef] [PubMed]
- Jian, Y.; Zhu, D.; Zhou, D.; Li, N.; Du, H.; Dong, X.; Fu, X.; Tao, D.; Han, B. ARIMA model for predicting chronic kidney disease and estimating its economic burden in China. BMC Public Health 2022, 22, 2456. [Google Scholar] [CrossRef]
- Manns, B.; Hemmelgarn, B.; Tonelli, M.; Au, F.; So, H.; Weaver, R.; Quinn, A.E.; Klarenbach, S.; Solutions, C.S.; Disease, I.t.O.C.K. The cost of care for people with chronic kidney disease. Can. J. Kidney Health Dis. 2019, 6, 2054358119835521. [Google Scholar] [CrossRef]
- Ninomiya, T.; Kiyohara, Y. Albuminuria and chronic kidney disease in association with the metabolic syndrome. J. Cardiometabolic Syndr. 2007, 2, 104–107. [Google Scholar] [CrossRef]
- Butt, L.; Unnersjö-Jess, D.; Höhne, M.; Edwards, A.; Binz-Lotter, J.; Reilly, D.; Hahnfeldt, R.; Ziegler, V.; Fremter, K.; Rinschen, M.M. A molecular mechanism explaining albuminuria in kidney disease. Nat. Metab. 2020, 2, 461–474. [Google Scholar] [CrossRef]
- Pasternak, M.; Liu, P.; Quinn, R.; Elliott, M.; Harrison, T.G.; Hemmelgarn, B.; Lam, N.; Ronksley, P.; Tonelli, M.; Ravani, P. Association of albuminuria and regression of chronic kidney disease in adults with newly diagnosed moderate to severe chronic kidney disease. JAMA Netw. Open 2022, 5, e2225821. [Google Scholar] [CrossRef] [PubMed]
- Szaboova, E.; Lisovszki, A.; Fatľová, E.; Kolarčik, P.; Szabo, P.; Molnár, T. Prevalence of microalbuminuria and its association with subclinical carotid atherosclerosis in middle aged, nondiabetic, low to moderate cardiovascular risk individuals with or without hypertension. Diagnostics 2021, 11, 1716. [Google Scholar] [CrossRef] [PubMed]
- Seliger, S.L.; Salimi, S.; Pierre, V.; Giffuni, J.; Katzel, L.; Parsa, A. Microvascular endothelial dysfunction is associated with albuminuria and CKD in older adults. BMC Nephrol. 2016, 17, 82. [Google Scholar] [CrossRef] [PubMed]
- Naidoo, D. The link between microalbuminuria, endothelial dysfunction and cardiovascular disease in diabetes. Cardiovasc. J. S. Afr. 2002, 13, 194–199. [Google Scholar]
- Heerspink, H.J.L.; Gansevoort, R.T. Albuminuria is an appropriate therapeutic target in patients with CKD: The pro view. Clin. J. Am. Soc. Nephrol. CJASN 2015, 10, 1079. [Google Scholar] [CrossRef] [PubMed]
- Forst, T.; Mathieu, C.; Giorgino, F.; Wheeler, D.C.; Papanas, N.; Schmieder, R.E.; Halabi, A.; Schnell, O.; Streckbein, M.; Tuttle, K.R. New strategies to improve clinical outcomes for diabetic kidney disease. BMC Med. 2022, 20, 337. [Google Scholar] [CrossRef]
- Sharma, P.; Blackburn, R.C.; Parke, C.L.; McCullough, K.; Marks, A.; Black, C. Angiotensin-converting enzyme inhibitors and angiotensin receptor blockers for adults with early (stage 1 to 3) non-diabetic chronic kidney disease. Cochrane Database Syst. Rev. 2011, 10, CD007751. [Google Scholar] [CrossRef]
- Dillon, J.J. Angiotensin-converting enzyme inhibitors and angiotensin receptor blockers for IgA nephropathy. In Seminars in Nephrology; WB Saunders: Philadelphia, PA, USA, 2004; pp. 218–224. [Google Scholar]
- Sawaf, H.; Thomas, G.; Taliercio, J.J.; Nakhoul, G.; Vachharajani, T.J.; Mehdi, A. Therapeutic advances in diabetic nephropathy. J. Clin. Med. 2022, 11, 378. [Google Scholar] [CrossRef]
- Heerspink, H.J.; Stefánsson, B.V.; Correa-Rotter, R.; Chertow, G.M.; Greene, T.; Hou, F.-F.; Mann, J.F.; McMurray, J.J.; Lindberg, M.; Rossing, P. Dapagliflozin in patients with chronic kidney disease. N. Engl. J. Med. 2020, 383, 1436–1446. [Google Scholar] [CrossRef]
- Group, E.-K.C. Empagliflozin in patients with chronic kidney disease. N. Engl. J. Med. 2023, 388, 117–127. [Google Scholar]
- Bakris, G.L.; Agarwal, R.; Anker, S.D.; Pitt, B.; Ruilope, L.M.; Rossing, P.; Kolkhof, P.; Nowack, C.; Schloemer, P.; Joseph, A. Effect of finerenone on chronic kidney disease outcomes in type 2 diabetes. N. Engl. J. Med. 2020, 383, 2219–2229. [Google Scholar] [CrossRef] [PubMed]
- Choi, H.S.; Han, K.-D.; Oh, T.R.; Suh, S.H.; Kim, M.; Kim, C.S.; Bae, E.H.; Ma, S.K.; Kim, S.W. Trends in the incidence and prevalence of end-stage renal disease with hemodialysis in entire Korean population: A nationwide population-based study. Medicine 2021, 100, e25293. [Google Scholar] [CrossRef] [PubMed]
- Chu, C.D.; McCulloch, C.E.; Banerjee, T.; Pavkov, M.E.; Burrows, N.R.; Gillespie, B.W.; Saran, R.; Shlipak, M.G.; Powe, N.R.; Tuot, D.S. CKD awareness among US adults by future risk of kidney failure. Am. J. Kidney Dis. 2020, 76, 174–183. [Google Scholar] [CrossRef] [PubMed]
- Whaley-Connell, A.; Nistala, R.; Chaudhary, K. The importance of early identification of chronic kidney disease. Mo. Med. 2011, 108, 25. [Google Scholar]
- Powell-Wiley, T.M.; Poirier, P.; Burke, L.E.; Després, J.-P.; Gordon-Larsen, P.; Lavie, C.J.; Lear, S.A.; Ndumele, C.E.; Neeland, I.J.; Sanders, P. Obesity and cardiovascular disease: A scientific statement from the American Heart Association. Circulation 2021, 143, e984–e1010. [Google Scholar] [CrossRef]
- Al-Goblan, A.S.; Al-Alfi, M.A.; Khan, M.Z. Mechanism linking diabetes mellitus and obesity. Diabetes Metab. Syndr. Obes. Targets Ther. 2014, 7, 587–591. [Google Scholar] [CrossRef]
- Klop, B.; Elte, J.W.F.; Castro Cabezas, M. Dyslipidemia in obesity: Mechanisms and potential targets. Nutrients 2013, 5, 1218–1240. [Google Scholar] [CrossRef]
- Hojs, R.; Ekart, R.; Bevc, S.; Hojs, N.V. Chronic kidney disease and obesity. Nephron 2023, 147, 660–664. [Google Scholar] [CrossRef]
- Fox, C.S.; Larson, M.G.; Leip, E.P.; Culleton, B.; Wilson, P.W.; Levy, D. Predictors of new-onset kidney disease in a community-based population. Jama 2004, 291, 844–850. [Google Scholar] [CrossRef]
- Beechy, L.; Galpern, J.; Petrone, A.; Das, S.K. Assessment tools in obesity—Psychological measures, diet, activity, and body composition. Physiol. Behav. 2012, 107, 154–171. [Google Scholar] [CrossRef] [PubMed]
- Magalhães, E.I.d.S.; Sant’Ana, L.F.d.R.; Priore, S.E.; Franceschini, S.d.C.C. Waist circumference, waist/height ratio, and neck circumference as parameters of central obesity assessment in children. Rev. Paul. De Pediatr. 2014, 32, 273–281. [Google Scholar]
- Shuster, A.; Patlas, M.; Pinthus, J.; Mourtzakis, M. The clinical importance of visceral adiposity: A critical review of methods for visceral adipose tissue analysis. Br. J. Radiol. 2012, 85, 1–10. [Google Scholar] [CrossRef] [PubMed]
- Jensen, M.D. Role of body fat distribution and the metabolic complications of obesity. J. Clin. Endocrinol. Metab. 2008, 93, s57–s63. [Google Scholar] [CrossRef] [PubMed]
- Frank, A.P.; de Souza Santos, R.; Palmer, B.F.; Clegg, D.J. Determinants of body fat distribution in humans may provide insight about obesity-related health risks. J. Lipid Res. 2019, 60, 1710–1719. [Google Scholar] [CrossRef] [PubMed]
- Hsu, C.-y.; McCulloch, C.E.; Iribarren, C.; Darbinian, J.; Go, A.S. Body mass index and risk for end-stage renal disease. Ann. Intern. Med. 2006, 144, 21–28. [Google Scholar] [CrossRef] [PubMed]
- Frankenfield, D.C.; Rowe, W.A.; Cooney, R.N.; Smith, J.S.; Becker, D. Limits of body mass index to detect obesity and predict body composition. Nutrition 2001, 17, 26–30. [Google Scholar] [CrossRef]
- Grundy, S.M.; Cleeman, J.I.; Daniels, S.R.; Donato, K.A.; Eckel, R.H.; Franklin, B.A.; Gordon, D.J.; Krauss, R.M.; Savage, P.J.; Smith Jr, S.C. Diagnosis and management of the metabolic syndrome: An American Heart Association/National Heart, Lung, and Blood Institute scientific statement. Circulation 2005, 112, 2735–2752. [Google Scholar] [CrossRef]
- Ross, R.; Neeland, I.J.; Yamashita, S.; Shai, I.; Seidell, J.; Magni, P.; Santos, R.D.; Arsenault, B.; Cuevas, A.; Hu, F.B. Waist circumference as a vital sign in clinical practice: A Consensus Statement from the IAS and ICCR Working Group on Visceral Obesity. Nat. Rev. Endocrinol. 2020, 16, 177–189. [Google Scholar] [CrossRef]
- Pinho, C.P.S.; Diniz, A.d.S.; Arruda, I.K.G.d.; Leite, A.P.D.L.; Petribu, M.d.M.V.; Rodrigues, I.G. Waist circumference measurement sites and their association with visceral and subcutaneous fat and cardiometabolic abnormalities. Arch. Endocrinol. Metab. 2018, 62, 416–423. [Google Scholar] [CrossRef]
- Pescatori, L.C.; Savarino, E.; Mauri, G.; Silvestri, E.; Cariati, M.; Sardanelli, F.; Sconfienza, L.M. Quantification of visceral adipose tissue by computed tomography and magnetic resonance imaging: Reproducibility and accuracy. Radiol. Bras. 2019, 52, 1–6. [Google Scholar] [CrossRef] [PubMed]
- Anothaisintawee, T.; Sansanayudh, N.; Thamakaison, S.; Lertrattananon, D.; Thakkinstian, A. Neck circumference as an anthropometric indicator of central obesity in patients with prediabetes: A cross-sectional study. BioMed Res. Int. 2019, 2019, 4808541. [Google Scholar] [CrossRef] [PubMed]
- Ben-Noun, L.; Sohar, E.; Laor, A. Neck circumference as a simple screening measure for identifying overweight and obese patients. Obes. Res. 2001, 9, 470–477. [Google Scholar] [CrossRef] [PubMed]
- Rosenquist, K.J.; Therkelsen, K.E.; Massaro, J.M.; Hoffmann, U.; Fox, C.S. Development and Reproducibility of a Computed Tomography–Based Measurement for Upper Body Subcutaneous Neck Fat. J. Am. Heart Assoc. 2014, 3, e000979. [Google Scholar] [CrossRef] [PubMed]
- Onat, A.; Hergenç, G.; Yüksel, H.; Can, G.; Ayhan, E.; Kaya, Z.; Dursunoğlu, D. Neck circumference as a measure of central obesity: Associations with metabolic syndrome and obstructive sleep apnea syndrome beyond waist circumference. Clin. Nutr. 2009, 28, 46–51. [Google Scholar] [CrossRef] [PubMed]
- Després, J.-P.; Lemieux, I.; Bergeron, J.; Pibarot, P.; Mathieu, P.; Larose, E.; Rodés-Cabau, J.; Bertrand, O.F.; Poirier, P. Abdominal obesity and the metabolic syndrome: Contribution to global cardiometabolic risk. Arterioscler. Thromb. Vasc. Biol. 2008, 28, 1039–1049. [Google Scholar] [CrossRef]
- Cao, C.; Hu, H.; Zheng, X.; Zhang, X.; Wang, Y.; He, Y. Association between central obesity and incident diabetes mellitus among Japanese: A retrospective cohort study using propensity score matching. Sci. Rep. 2022, 12, 13445. [Google Scholar] [CrossRef]
- Ataie-Jafari, A.; Namazi, N.; Djalalinia, S.; Chaghamirzayi, P.; Abdar, M.E.; Zadehe, S.S.; Asayesh, H.; Zarei, M.; Gorabi, A.M.; Mansourian, M. Neck circumference and its association with cardiometabolic risk factors: A systematic review and meta-analysis. Diabetol. Metab. Syndr. 2018, 10, 72. [Google Scholar] [CrossRef]
- Yoon, C.-Y.; Park, J.T.; Jhee, J.H.; Kee, Y.K.; Seo, C.; Lee, M.; Cha, M.-U.; Jung, S.-Y.; Park, S.; Yun, H.-R. Neck circumference predicts renal function decline in overweight women: A community-based prospective cohort study. Medicine 2016, 95, e4844. [Google Scholar] [CrossRef]
- Oh, K.; Kim, Y.; Kweon, S.; Kim, S.; Yun, S.; Park, S.; Lee, Y.-K.; Kim, Y.; Park, O.; Jeong, E.K. Korea National Health and Nutrition Examination Survey, 20th anniversary: Accomplishments and future directions. Epidemiol. Health 2021, 43, e2021025. [Google Scholar] [CrossRef]
- Kweon, S.; Kim, Y.; Jang, M.-j.; Kim, Y.; Kim, K.; Choi, S.; Chun, C.; Khang, Y.-H.; Oh, K. Data resource profile: The Korea national health and nutrition examination survey (KNHANES). Int. J. Epidemiol. 2014, 43, 69–77. [Google Scholar] [CrossRef]
- Lee, S.Y.; Park, H.S.; Kim, D.J.; Han, J.H.; Kim, S.M.; Cho, G.J.; Kim, D.Y.; Kwon, H.S.; Kim, S.R.; Lee, C.B. Appropriate waist circumference cutoff points for central obesity in Korean adults. Diabetes Res. Clin. Pract. 2007, 75, 72–80. [Google Scholar] [CrossRef] [PubMed]
- Couser, W.G.; Remuzzi, G.; Mendis, S.; Tonelli, M. The contribution of chronic kidney disease to the global burden of major noncommunicable diseases. Kidney Int. 2011, 80, 1258–1270. [Google Scholar] [CrossRef] [PubMed]
- Chu, C.D.; Xia, F.; Du, Y.; Singh, R.; Tuot, D.S.; Lamprea-Montealegre, J.A.; Gualtieri, R.; Liao, N.; Kong, S.X.; Williamson, T. Estimated prevalence and testing for albuminuria in US adults at risk for chronic kidney disease. JAMA Netw. Open 2023, 6, e2326230. [Google Scholar] [CrossRef] [PubMed]
- Fraser, S.D.; Parkes, J.; Culliford, D.; Santer, M.; Roderick, P.J. Timeliness in chronic kidney disease and albuminuria identification: A retrospective cohort study. BMC Fam. Pract. 2015, 16, 18. [Google Scholar] [CrossRef] [PubMed]
- de Boer, I.H.; Katz, R.; Fried, L.F.; Ix, J.H.; Luchsinger, J.; Sarnak, M.J.; Shlipak, M.G.; Siscovick, D.S.; Kestenbaum, B. Obesity and change in estimated GFR among older adults. Am. J. Kidney Dis. 2009, 54, 1043–1051. [Google Scholar] [CrossRef] [PubMed]
- Esmeijer, K.; Geleijnse, J.M.; Giltay, E.J.; Stijnen, T.; Dekker, F.W.; de Fijter, J.W.; Kromhout, D.; Hoogeveen, E.K. Body-fat indicators and kidney function decline in older post-myocardial infarction patients: The Alpha Omega Cohort Study. Eur. J. Prev. Cardiol. 2018, 25, 90–99. [Google Scholar] [CrossRef]
- Téllez, M.J.A.; Acosta, F.M.; Sanchez-Delgado, G.; Martinez-Tellez, B.; Muñoz-Hernández, V.; Martinez-Avila, W.D.; Henriksson, P.; Ruiz, J.R. Association of neck circumference with anthropometric indicators and body composition measured by DXA in young Spanish adults. Nutrients 2020, 12, 514. [Google Scholar] [CrossRef] [PubMed]
- Liu, Y.-F.; Chang, S.-T.; Lin, W.-S.; Hsu, J.-T.; Chung, C.-M.; Chang, J.-J.; Hung, K.-C.; Chen, K.-H.; Chang, C.-W.; Chen, F.-C. Neck circumference as a predictive indicator of CKD for high cardiovascular risk patients. BioMed Res. Int. 2015, 2015, 745410. [Google Scholar] [CrossRef]
- Xue, J.; Li, B.; Wang, J.; Yu, S.; Wang, A.; An, P.; Mu, Y. Association between neck circumference and the risk of decreased estimated glomerular filtration rate in the general population of China: A cross-sectional study. BioMed Res. Int. 2020, 2020, 3496328. [Google Scholar] [CrossRef]
- Taghizadeh, S.; Mahmoudinezhad, M.; Farazkhah, T.; Kavyani, M.; Rashidi, N.; Abbasalizad-Farhangi, M. Neck circumference as a predictor of metabolic disorders and renal diseases in hospitalized patients. Clin. Nutr. Open Sci. 2021, 36, 35–42. [Google Scholar] [CrossRef]
- Guo, Z.; Hensrud, D.D.; Johnson, C.M.; Jensen, M.D. Regional postprandial fatty acid metabolism in different obesity phenotypes. Diabetes 1999, 48, 1586–1592. [Google Scholar] [CrossRef] [PubMed]
- Boden, G. Role of fatty acids in the pathogenesis of insulin resistance and NIDDM. Diabetes 1997, 46, 3–10. [Google Scholar] [CrossRef] [PubMed]
- Zhang, J.; Zhao, Y.; Xu, C.; Hong, Y.; Lu, H.; Wu, J.; Chen, Y. Association between serum free fatty acid levels and nonalcoholic fatty liver disease: A cross-sectional study. Sci. Rep. 2014, 4, 5832. [Google Scholar] [CrossRef] [PubMed]
- Zhang, M.-H.; Cao, Y.-X.; Wu, L.-G.; Guo, N.; Hou, B.-J.; Sun, L.-J.; Guo, Y.-L.; Wu, N.-Q.; Dong, Q.; Li, J.-J. Association of plasma free fatty acids levels with the presence and severity of coronary and carotid atherosclerotic plaque in patients with type 2 diabetes mellitus. BMC Endocr. Disord. 2020, 20, 156. [Google Scholar] [CrossRef] [PubMed]
- Kamijo, A.; Kimura, K.; Sugaya, T.; Yamanouchi, M.; Hase, H.; Kaneko, T.; Hirata, Y.; Goto, A.; Fujita, T.; Omata, M. Urinary free fatty acids bound to albumin aggravate tubulointerstitial damage. Kidney Int. 2002, 62, 1628–1637. [Google Scholar] [CrossRef] [PubMed]
- Xu, S.; Nam, S.; Kim, J.; Das, R.; Choi, S.; Nguyen, T.; Quan, X.; Choi, S.; Chung, C.; Lee, E. Palmitate induces ER calcium depletion and apoptosis in mouse podocytes subsequent to mitochondrial oxidative stress. Cell Death Dis. 2015, 6, e1976. [Google Scholar] [CrossRef] [PubMed]
- Sun, Y.; Ge, X.; Li, X.; He, J.; Wei, X.; Du, J.; Sun, J.; Li, X.; Xun, Z.; Liu, W. High-fat diet promotes renal injury by inducing oxidative stress and mitochondrial dysfunction. Cell Death Dis. 2020, 11, 914. [Google Scholar] [CrossRef]
- Park, S.; Lee, S.; Kim, Y.; Lee, Y.; Kang, M.W.; Han, K.; Lee, H.; Lee, J.P.; Joo, K.W.; Lim, C.S. Reduced risk for chronic kidney disease after recovery from metabolic syndrome: A nationwide population-based study. Kidney Res. Clin. Pract. 2020, 39, 180. [Google Scholar] [CrossRef]
- Schrauben, S.J.; Jepson, C.; Hsu, J.Y.; Wilson, F.P.; Zhang, X.; Lash, J.P.; Robinson, B.M.; Townsend, R.R.; Chen, J.; Fogelfeld, L. Insulin resistance and chronic kidney disease progression, cardiovascular events, and death: Findings from the chronic renal insufficiency cohort study. BMC Nephrol. 2019, 20, 60. [Google Scholar] [CrossRef]
- Johns, B.R.; Pao, A.C.; Kim, S.H. Metabolic syndrome, insulin resistance and kidney function in non-diabetic individuals. Nephrol. Dial. Transplant. 2012, 27, 1410–1415. [Google Scholar] [CrossRef] [PubMed]
- Cheng, H.-T.; Huang, J.-W.; Chiang, C.-K.; Yen, C.-J.; Hung, K.-Y.; Wu, K.-D. Metabolic syndrome and insulin resistance as risk factors for development of chronic kidney disease and rapid decline in renal function in elderly. J. Clin. Endocrinol. Metab. 2012, 97, 1268–1276. [Google Scholar] [CrossRef] [PubMed]
- Zhang, X.; Lerman, L.O. The metabolic syndrome and chronic kidney disease. Transl. Res. 2017, 183, 14–25. [Google Scholar] [CrossRef] [PubMed]
- Mohseni-Takalloo, S.; Mozaffari-Khosravi, H.; Mohseni, H.; Mirzaei, M.; Hosseinzadeh, M.; Mohseni-Takalloo Sr, S. Evaluating Neck Circumference as an Independent Predictor of Metabolic Syndrome and Its Components Among Adults: A Population-Based Study. Cureus 2023, 15, e40379. [Google Scholar] [CrossRef] [PubMed]
- Kim, K.-Y.; Moon, H.-R.; Yun, J.-M. Neck circumference as a predictor of metabolic syndrome in koreans: A cross-sectional study. Nutrients 2021, 13, 3029. [Google Scholar] [CrossRef]
- Barforoush, T.S.; Ghadimi, R.; Pahlevan, Z.; Ahmadi, N.; Delavar, M.A. The relationship between neck circumference and gestational diabetes mellitus in Iranian women. Clin. Diabetes Endocrinol. 2021, 7, 22. [Google Scholar] [CrossRef]
- Jian, C.; Xu, Y.; Ma, X.; Shen, Y.; Wang, Y.; Bao, Y. Correlations between neck circumference and serum thyroid hormones levels in postmenopausal women with euthyroid and subclinical hypothyroidism. Clin. Exp. Pharmacol. Physiol. 2021, 48, 471–477. [Google Scholar] [CrossRef]
- Park, J.I.; Baek, H.; Jung, H.H. Prevalence of chronic kidney disease in Korea: The Korean national health and nutritional examination survey 2011–2013. J. Korean Med. Sci. 2016, 31, 915–923. [Google Scholar] [CrossRef]


| Study Population (n = 10,219) | Quartile 1 (n = 2718) | Quartile 2 (n = 2473) | Quartile 3 (n = 2505) | Quartile 4 (n = 2523) | p-Value |
|---|---|---|---|---|---|
| Sex (%) | 0.684 | ||||
| Male | 1195 (44.0%) | 1112 (45.0%) | 1088 (43.4%) | 1128 (44.7%) | |
| Female | 1523 (56.0%) | 1361 (55.0%) | 1417 56.6%) | 1395 (55.3%) | |
| Age (years) | 59.98 ± 11.98 | 60.02 ± 11.75 | 59.90 ± 11.49 | 58.68 ± 11.19 | <0.001 |
| Blood analysis | |||||
| Hemoglobin (g/dL) | 13.58 ± 1.50 | 13.79 ± 1.54 | 13.85 ± 1.55 | 14.06 ± 1.54 | <0.001 |
| Glucose (mg/dL) | 99.65 ± 19.53 | 102.95 ± 22.59 | 105.93 ± 24.70 | 112.04 ± 28.18 | <0.001 |
| Total cholesterol (mg/dL) | 191.27 ± 38.12 | 192.11 ±39.91 | 193.04 ± 41.46 | 190.14 ± 41.88 | 0.07 |
| HDL cholesterol (mg/dL) | 55.43 ± 13.54 | 51.96 ± 12.60 | 50.47 ± 12.37 | 47.76 ± 10.97 | <0.001 |
| Triglyceride (mg/dL) | 112.40 ± 82.80 | 126.88 ± 107.19 | 142.51 ± 116.62 | 163.89 ± 119.36 | <0.001 |
| eGFR | 90.26 ± 18.65 | 88.24 ± 17.71 | 86.30 ± 20.09 | 86.82 ± 18.11 | <0.001 |
| Urine albumin-to-creatinine ratio (mg/g) | 0.23 ± 1.37 | 0.24 ± 1.35 | 0.31 ± 1.68 | 0.34 ± 1.62 | 0.03 |
| Body measurements | |||||
| Body mass index (kg/m2) | 21.32 ± 2.16 | 23.36 ± 2.05 | 24.81 ± 2.15 | 27.80 ± 3.07 | <0.001 |
| Waist circumference (cm) | 77.48 ± 7.56 | 83.42 ± 7.05 | 87.14 ± 6.95 | 94.73 ± 8.12 | <0.001 |
| Neck circumference (cm) | 32.60 ± 2.47 | 34.42 ± 2.59 | 35.63 ± 2.68 | 37.98 ± 3.09 | <0.001 |
| Health interview (%) | |||||
| Current smoker | 401 (14.8%) | 331 (13.4%) | 340 (13.6%) | 338 (13.4%) | 0.41 |
| Alcohol drinking | 1033 (38.0%) | 952 (38.5%) | 989 (39.5%) | 1013 (40.2%) | 0.39 |
| Regular exercise | 1035 (38.1%) | 971 (39.3%) | 1006 (40.2%) | 936 (37.1%) | 0.13 |
| Underlying diseases (%) | |||||
| Hypertension | 847 (31.2%) | 955 (38.6%) | 1116 (44.6%) | 1411 (55.9%) | <0.001 |
| Diabetes | 325 (12.0%) | 402 (16.3%) | 515 (20.6%) | 774 (30.7%) | <0.001 |
| Dyslipidemia | 1065 (39.2%) | 1188 (48.0%) | 1371 (54.7%) | 1654 (65.6%) | <0.001 |
| Metabolic syndrome | 303 (11.1%) | 592 (23.9%) | 953 (38.0%) | 1503 (59.6%) | <0.001 |
| GFR categories (%) | <0.001 | ||||
| G1 | 1325 (48.7%) | 1067 (43.1%) | 992 (39.6%) | 1020 (40.4%) | |
| G2 | 1283 (47.2%) | 1288 (52.1%) | 1367 (54.6%) | 1360 (53.9%) | |
| G3 | 102 (3.8%) | 113 (4.6%) | 137 (5.5%) | 135 (5.4%) | |
| G4 | 6 (0.2%) | 4 (0.2%) | 6 (0.2%) | 7 (0.3%) | |
| G5 | 2 (0.1%) | 1 (0.0%) | 3 (0.1%) | 1 (0.0%) |
| Neck Circumference | Crude Model | Adjusted Model * | ||||
|---|---|---|---|---|---|---|
| Model 1 a | Model 2 b | |||||
| OR (95% CI) | p-Value | OR (95% CI) | p-Value | OR (95% CI) | p-Value | |
| Quartiles of neck circumference | ||||||
| Quartile 1 | 1 (reference) | 1 (reference) | 1 (reference) | |||
| Quartile 2 | 1.19 (0.91–1.55) | 0.20 | 1.23 (0.91–1.67) | 0.17 | 1.27 (0.94–1.71) | 0.12 |
| Quartile 3 | 1.47 (1.14–1.89) | 0.003 | 1.59 (1.16–2.18) | 0.004 | 1.68 (1.23–2.31) | 0.001 |
| Quartile 4 | 1.43 (1.10–1.84) | 0.006 | 1.70 (1.16–2.50) | 0.007 | 1.85 (1.26–2.71) | 0.002 |
| Continuous values of neck circumference | ||||||
| Neck circumference (cm) | 1.07 (1.05–1.10) | <0.001 | 1.11 (1.03–1.19) | 0.004 | 1.14 (1.06–1.22) | <0.001 |
| Subgroup | Crude Model | Adjusted Model * | p for Interaction | ||||
|---|---|---|---|---|---|---|---|
| Model 1 a | Model 2 b | ||||||
| OR (95% CI) | p-Value | OR (95% CI) | p-Value | OR (95% CI) | p-Value | ||
| Sex | 0.45 | ||||||
| Male (n = 4523) | 0.99 (0.94–1.04) | 0.78 | 1.11 (1.02–1.22) | 0.02 | 1.14 (1.04–1.25) | 0.01 | |
| Female (n = 5696) | 1.14 (1.07–1.22) | <0.001 | 1.12 (1.00–1.25) | 0.05 | 1.15 (1.02–1.28) | 0.014 | |
| Age | 0.57 | ||||||
| Above 65 years (n = 3640) | 1.09 (1.05–1.13) | <0.001 | 1.09 (1.00–1.17) | 0.04 | 1.11 (1.03–1.20) | 0.01 | |
| Under 65 years (n = 6579) | 1.16 (1.09–1.22) | <0.001 | 1.01 (0.87–1.17) | 0.93 | 1.04 (0.89–1.20) | 0.63 | |
| Metabolic syndrome | 0.05 | ||||||
| Yes (n = 3351) | 0.97 (0.94–1.01) | 0.20 | 1.12 (1.02–1.24) | 0.02 | 1.13 (1.02–1.25) | 0.02 | |
| No (n = 6868) | 1.11 (1.07–1.16) | <0.001 | 1.10 (1.00–1.22) | 0.06 | 1.13 (1.02–1.25) | 0.02 | |
Disclaimer/Publisher’s Note: The statements, opinions and data contained in all publications are solely those of the individual author(s) and contributor(s) and not of MDPI and/or the editor(s). MDPI and/or the editor(s) disclaim responsibility for any injury to people or property resulting from any ideas, methods, instructions or products referred to in the content. |
© 2023 by the authors. Licensee MDPI, Basel, Switzerland. This article is an open access article distributed under the terms and conditions of the Creative Commons Attribution (CC BY) license (https://creativecommons.org/licenses/by/4.0/).
Share and Cite
Yoon, Y.; Kim, Y.-m.; Lee, S.; Shin, B.-C.; Kim, H.-L.; Chung, J.-H.; Son, M. Association between Neck Circumference and Chronic Kidney Disease in Korean Adults in the 2019–2021 Korea National Health and Nutrition Examination Survey. Nutrients 2023, 15, 5039. https://doi.org/10.3390/nu15245039
Yoon Y, Kim Y-m, Lee S, Shin B-C, Kim H-L, Chung J-H, Son M. Association between Neck Circumference and Chronic Kidney Disease in Korean Adults in the 2019–2021 Korea National Health and Nutrition Examination Survey. Nutrients. 2023; 15(24):5039. https://doi.org/10.3390/nu15245039
Chicago/Turabian StyleYoon, Youngmin, Yoo-min Kim, Somin Lee, Byung-Chul Shin, Hyun-Lee Kim, Jong-Hoon Chung, and Minkook Son. 2023. "Association between Neck Circumference and Chronic Kidney Disease in Korean Adults in the 2019–2021 Korea National Health and Nutrition Examination Survey" Nutrients 15, no. 24: 5039. https://doi.org/10.3390/nu15245039
APA StyleYoon, Y., Kim, Y.-m., Lee, S., Shin, B.-C., Kim, H.-L., Chung, J.-H., & Son, M. (2023). Association between Neck Circumference and Chronic Kidney Disease in Korean Adults in the 2019–2021 Korea National Health and Nutrition Examination Survey. Nutrients, 15(24), 5039. https://doi.org/10.3390/nu15245039