Article

Comparative Analysis of Gut Microbiota from Rats Induced by Se Deficiency and T-2 Toxin

1
Department of Occupational and Environmental Health, School of Public Health, Xi’an Jiaotong University Health Science Center, Xi’an 710061, China
2
MED-X Institute, Center for Immunological and Metabolic Diseases, The First Affiliated Hospital of Xi’an Jiaotong University, Xi’an 710061, China
3
Key Laboratory of Trace Elements and Endemic Diseases, School of Public Health, Xi’an Jiaotong University Health Science Center, National Health and Family Planning Commission, Xi’an 710061, China
4
Clinical Research Center for Endemic Disease of Shaanxi Province, The Second Affiliated Hospital of Xi’an Jiaotong University, No.157 Xi Wu Road, Xi’an 710004, China
5
Key Laboratory for Disease Prevention and Control and Health Promotion of Shaanxi Province, Xi’an 710061, China
6
Foot and Ankle Surgery Department, Honghui Hospital of Xi’an Jiaotong University, Xi’an 710001, China
*
Authors to whom correspondence should be addressed.
These authors contributed equally to this work and should be considered co-first authors.
Nutrients 2023, 15(24), 5027; https://doi.org/10.3390/nu15245027
Submission received: 16 October 2023 / Revised: 23 November 2023 / Accepted: 30 November 2023 / Published: 7 December 2023
(This article belongs to the Special Issue Dietary Habit, Gut Microbiome and Human Health)

Abstract

:
The aim of this study was to analyze the differences in gut microbiota between selenium deficiency and T-2 toxin intervention rats. Knee joint and fecal samples of rats were collected. The pathological characteristics of knee cartilage were observed by safranin O/fast green staining. DNA was extracted from fecal samples for PCR amplification, and 16S rDNA sequencing was performed to compare the gut microbiota of rats. At the phylum level, Firmicutes (81.39% vs. 77.06%) and Bacteroidetes (11.11% vs. 14.85%) were dominant in the Se-deficient (SD) group and T-2 exposure (T-2) groups. At the genus level, the relative abundance of Ruminococcus_1 (12.62%) and Ruminococcaceae_UCG-005 (10.31%) in the SD group were higher. In the T-2 group, the relative abundance of Lactobacillus (11.71%) and Ruminococcaceae_UCG-005 (9.26%) were higher. At the species level, the high-quality bacteria in the SD group was Ruminococcus_1_unclassified, and Ruminococcaceae_UCG-005_unclassified in the T-2 group. Lactobacillus_sp__L_YJ and Lactobacillus_crispatus were the most significant biomarkers in the T-2 group. This study analyzed the different compositions of gut microbiota in rats induced by selenium deficiency and T-2 toxin, and revealed the changes in gut microbiota, so as to provide a certain basis for promoting the study of the pathogenesis of Kashin–Beck disease (KBD).

1. Introduction

Kashin–Beck disease (KBD) is a chronic, degenerative and malformed osteoarticular disease that mainly affects the epiphyseal plate cartilage and articular cartilage in children during the growth and development period [1]. Many etiological studies have shown that environmental selenium deficiency and T-2 toxin in grains could be important causes of KBD [2]. Previous studies found that the selenium content in food, drinking water and patients in KBD endemic areas was significantly lower than that in non-endemic areas [3,4]. In addition, the epidemiological survey showed that the distribution of KBD in China was an oblique band from northeast to southwest, which was highly coincident with the distribution of Se deficiency in China [5]. T-2 toxin is a tricothecene toxin produced by a variety of fusarium species [6]. In previous studies, it was suggested that T-2 toxin could cause inflammatory damage of chondrocytes and upregulate the expression of KBD susceptibility genes in chondrocytes [7,8]. The conclusions of the previous studies have proved that the imbalance of selenium nutrition caused by low selenium in the external environment and T-2 toxin poisoning in grain are likely to be important causes of the etiology and pathogenesis of KBD [9].
Gut microbiota is a microbial community inhabiting the human gut and distributed throughout the gastrointestinal tract, which is a dynamic ecosystem. The entire gut microbiota is composed of more than 1000 species of bacteria, as well as fungi, viruses, phages, parasites and archaea [10]. Under normal conditions, different types of gut microbiota in the human body exist stably in accordance with a certain proportion and quantity, which are both interdependent and restricted to each other. Firmicutes and Bacteroidetes are the most typical bacterial phyla in the healthy gut microbiota, followed by Actinobacteria, Proteobacteria and Fusobacteria [11,12]. At the genus level, the most typical bacterial genera are Bacteroides, Faecalibacterium and Bifidobacterium. The bacteria of each classification exist dynamically and stably [13]. When stimulated by the internal and external environment, the species, quantity, proportion, and metabolites of each bacterial group will change [14]. Gut microbiota plays an important role in the regulation of various diseases, including diabetes, osteoarthritis, hypertension, chronic obstructive pulmonary disease (COPD), and obesity [15,16,17,18,19,20,21]. The influence of gut microbiota on the above diseases is achieved through the comprehensive effect of genetic and environmental factors [22]. Relevant studies have confirmed that gut microbiota can participate in host physiological activities through its metabolites, and can migrate to subchondral bone marrow and deep chondrocytes through systemic circulation to cause cellular inflammation, thereby inducing changes in cartilage tissue and causing osteochondral diseases [23]. It has also been shown that the cartilage–gut–microbiome axis plays a role in chondrocyte differentiation, apoptosis, and injury mechanism by regulating the levels of metabolites [24]. The concept of the cartilage–gut–microbiome axis provides new ideas for the etiology and treatment of bone and cartilage diseases, such as KBD and osteoarthritis. Previously, we found a comprehensive landscape of the gut microbiota in KBD patients, and compared the gut microbiota of osteoarthritis (OA) and KBD patients, which provided strong evidence for the correlation between gut microbiota and KBD.
As the key suspected causes of KBD, mycotoxin contamination in grain and environmental Se deficiency can affect the human body through the dietary channel [1,25,26]. Studies have shown that mycotoxins in grain are absorbed into the human body mainly in the form of glucose covalent conjugates of mycotoxins, and can reach the human intestine in intact form for hydrolysis and release, causing abnormal changes in gut microbiota [27]. In addition, selenium can increase the diversity of gut microbiota in mice and participate in the composition of gut microbiota, and it also can be enriched by the gut microbiota [28,29]. These results suggest that the changes in gut microbiota in KBD patients may be closely related to the above two environmental risk factors of KBD.
In this study, to further explore whether the gut microbiota of KBD patients is altered due to Se deficiency and T-2 toxin and its relationship with cartilage damage, we established the environment risk factors rat models of KBD induced by Se deficiency and T-2 toxin with an 8-week and 4-week intervention, respectively, and the characteristics and differences of gut microbiota after intervention in rats were analyzed and compared. This study will provide an important scientific basis for clarifying that T-2 toxin and/or Se deficiency may cause chondrocytes damage and metabolic disorders in KBD through the cartilage–gut–microbiome axis.

2. Materials and Methods

2.1. Model Construction and Sample Collection

A total of 24 weaned Sprague Dawley rats (3-week-old, 30–50 g) were provided by the Experimental Animal Center of Xi’an Jiaotong University. The study protocol was approved by the Animal Ethics Committee of Xi’an Jiaotong University (No. 2018-206). The rats were reared in specific pathogen free (SPF) environment. The 24 rats were randomly divided into three groups: the normal control group (NC) was fed with control diet (selenium content: 0.18 ppm), the Se-deficient group (SD) was fed with Se-deficient diet (selenium content: 0.02 ppm), the T-2 exposure group (T-2) which fed with control diet were given T-2 toxin (200 ng/g·BW/day) by gavage [30], while the NC group and SD groups were given the same volume of 0.9% normal saline by gavage. All feeds of rats were purchased from Nantong Talofi Feed Company, Nantong, Jiangsu province, China. For intragastric administration: after the rats were fixed, the needle used for intragastric administration was inserted from the corner of the mouth, pushed gently against the roof of the mouth, and there was a feeling of hollow after entering the esophagus. Then, the needle was slowly inserted along the posterior wall of the pharynx into the esophagus, and the solution could be injected only when there was no air countercurrent in the syringe. To prevent the rats from failing to adapt to the T-2 toxin, in the T-2 group, the gavage treatment was performed at the age of 8 weeks and ended at 12 weeks, lasting a total of 4 weeks. Since the construction of the Se-deficient rat models need to last longer, the intervention of Se-deficient diet began at the age of 4 weeks and ended at 12 weeks, lasting a total of 8 weeks. The rats were fed in the mesh floor cages with 2 cages per group and 4 rats per cage, and all animals had free access to distilled water at all time. The weight of the rats was measured and recorded at a fixed time each week. During the experiment, we did not find that the food intake of rats was affected by the intervention regimen. The rats treated by Se-deficient diet had poor appetite and increased drinking water, and the rats treated by T-2 toxin were sluggish, less active, and more serious hair removal. By analyzing the weight records, it was found that the growth of rats in each group was in line with the normal development rate, and there was no statistical difference in each node. At the age of 12 weeks, fresh feces of the rats were collected with sterilized tweezers, and about 1 g (3–5 pellets) of feces were collected from each rat, of which 1–2 pellets were used for analysis and the rest for backup, all stored in the sterile EP tubes at −80 °C for follow-up experiments. At 24 h after the last gavage, the rats were anesthetized by intraperitoneal injection of 10% chloral hydrate (0.5 mL/100 g·BW). The rats were sacrificed by blood sampling from the abdominal aorta. After the rats were killed, we detected the serum selenium content of rats by hydride generation atomic fluorescence spectrometry (HG-AFS), and the results showed that the serum selenium content of rats in the SD group was significantly lower than that in the NC group, indicating that the Se-deficient model was successfully constructed. Relevant research results have been published [31]. During the dissection of the rats, the fur and muscle were stripped with scalpel, the knee joints on both sides of the rats were removed with surgical scissors. After carefully separating the connective tissue, the knee joints of rats were placed in the 50 mL centrifuge tubes with 4% paraformaldehyde fixing solution and stored at room temperature away from light for later use.

2.2. T-2 Toxin Solution Preparation

An amount of 5 mg T-2 toxin crystals (CAS: 21259-20-1, purchased from Beijing Bairingwei Technology Co., LTD, Beijing, China) were collected in a bottle, then 2 mL absolute ethanol was added, shaken and blended using a vortex mixer, and the liquid was sucked into a 250 mL beaker. The procedure was repeated three times to ensure the complete dissolution of T-2 toxin crystals on the bottom and wall of the bottle. The 0.9% saline was used to dilute the solution in the beaker, and the T-2 toxin solution with a concentration of 20 μg/mL was obtained. The solution was divided into small aliquots and frozen at −20 °C for subsequent experiment. Before each use, the solution was dissolved at room temperature and sonicated to homogenize the solute.

2.3. Safranin O/Fast Green Staining

The fixed knee joints samples of rats were decalcified with 10% (w/v) ethylenediaminete traacetic acid (EDTA) for 4 weeks. The decalcified samples were cut to appropriate size with a surgical blade, naturally dried and then subjected to ethanol gradient dehydration, xylene transparency, and paraffin embedding. The paraffin blocks were cut into serial sections with a thickness of 4–7 µm, mounted on slides, baked at 60 °C and stored at room temperature. Sections of the knee joint were deparaffinized with xylene, hydrated with gradient ethanol, and washed with tap water. The sections were stained with hematoxylin dye for 5 min, washed with tap water to remove excess dye, and rapidly differentiated in 1% hydrochloric acid solution for several seconds. The step of fast green staining took 10 min, and the excess dye was washed off with water. Then, the slices were placed in safranin O staining solution for 45 s, washed with water and slightly soaked in differentiation solution. Finally, the sections were rapidly dehydrated in absolute ethanol, transparent through xylene, and then sealed with neutral gum for use. The stained cartilage sections were observed and the images were collected by automatic digital slicing scanner (Pannoramic desk, purchased from 3Dhistech, Budapest, Hungary).

2.4. DNA Extraction of Gut Microbiota

Fecal samples were collected from rats at 12 weeks of age, and the total DNA of the gut microbiota in the fecal samples was extracted according to the instructions of the E.Z.N.A.®Stool DNA Kit (D4015-02, Omega, Inc., Norcross, GA, USA). It has been demonstrated that the reagent, which was designed to extract DNA from trace amounts of sample, is efficient for preparing the DNA of most bacteria. Unused swabs processed through DNA extraction were utilized as sample blanks, and the absence of any DNA amplicons was confirmed in sample blanks. The quality of DNA extraction was detected by agarose gel electrophoresis, and DNA was quantified using a UV spectrophotometer. According to a modified version of the manufacturer’s (Omega) instructions, the total DNA was eluted in 50 L of elution buffer and kept at −80 °C until it was measured in a PCR by LC-BIO TECHNOLOGIES (HANGZHOU) CO., LTD., Hang Zhou, Zhejiang Province, China.

2.5. 16S rDNA Gene Sequencing

The V3–V4 variable region of 16S rDNA gene was selected as the target region for PCR amplification. The upstream primer was 341F (5’-CCTACGGGNGGCWGCAG-3’) and the downstream primer was 805R (5’-GACTACHVGGGTATCTAATCC-3’). The 5′ ends of each primer were marked with a unique barcode for each sample, and the universal primers were sequenced. PCR amplification was performed after a total volume of 25 μL of the reaction mixture including 25 ng of template DNA, 12.5 μL PCR Premix, 2.5 μL of each primer, and PCR-grade water which used to adjust the volume was prepared. PCR reaction conditions were as follows: first, predenaturation at 98 °C for 30 s; and then there were 32 cycles of denaturation at 98 °C for 10 s, annealing at 54 °C for 30 s, and extension at 72 °C for 45 s. The final extension lasted for 10 min at 72 ° C. In order to exclude the possibility of false-positive PCR results as a negative control, ultrapure water was utilized instead of sample solution throughout the DNA extraction procedure. The products of PCR were purified using AMPure XT Beads (Beckman Coulter Genomics, Danvers, MA, USA) and quantified with Qubit (Invitrogen, Carlsbad, CA, USA). The amplicon pool was used for the sequencing process, and an Agilent 2100 Bioanalyzer (Agilent, Santa Clara, CA, USA) and the Illumina Library Quantification kit (Kapa Biosciences, Woburn, MA, USA), respectively, were used to measure the size and quantity of the amplicon libraries. On NovaSeq PE250 platform, the libraries were sequenced.
Samples were sequenced using the Illumina NovaSeq platform in accordance with the manufacturer’s specifications. Paired-end sequences were assigned based on the unique barcode of each sample, and the barcode and primer sequence were both truncated. Paired-end reads were merged using FLASH. To produce high-quality clean labels, the raw reads were quality filtered using fqtrim (v0.94) under specific filtering parameters. In addition, the chimeric sequences were filtered by Vsearch software (v2.3.4). After data deduplication, feature tables and feature sequences were obtained. The distances were determined for PCoA and LEfSe using the Bray–Curtis method. We used QIIME2 and R (v3.5.2) to calculate the Alpha diversity and Beta diversity and draw the pictures, respectively, reduced the number of sequences in some samples to a minimum by randomly extracting the same number of sequences, and classified bacteria using the relative abundance. The relative abundance of each sample was used to normalize the feature abundance according to SILVA classifier. Blast was used for sequence alignment, the SILVA and NT-16S databases were used for annotation of each representative sequence, and R (v3.5.2) was used for drawing pictures. LEfSe analysis was performed as the following steps: firstly, all characteristic species was detected using Kruskal–Wallis rank sum test, and species with significant differences were obtained by measuring species abundance differences among different groups. Secondly, the Wilcoxon rank sum test was used to detect all subspecies of the significantly different species obtained in the previous step to determine whether they converged to the same taxonomic level. Finally, linear discriminant analysis (LDA) was used to obtain the final differential species.

2.6. Statistical Analysis

We used SPSS 18.0 software for statistical analysis of the measured data and normality tests for continuous variables. If the data met the normal distribution, Student’s t-test and one-way analysis of variance (ANOVA) were used to evaluate the difference between the two groups, and the LSD-t test was further used for comparison between the two groups. Otherwise, the data were reanalyzed after transformation, or the rank-sum test was used for comparison analysis between groups. Spearman correlation analysis was used to explore the correlation between variables. p-value < 0.05 was considered statistically significant. Statistical plots were drawn using GraphPad Prism 8.0.

3. Results

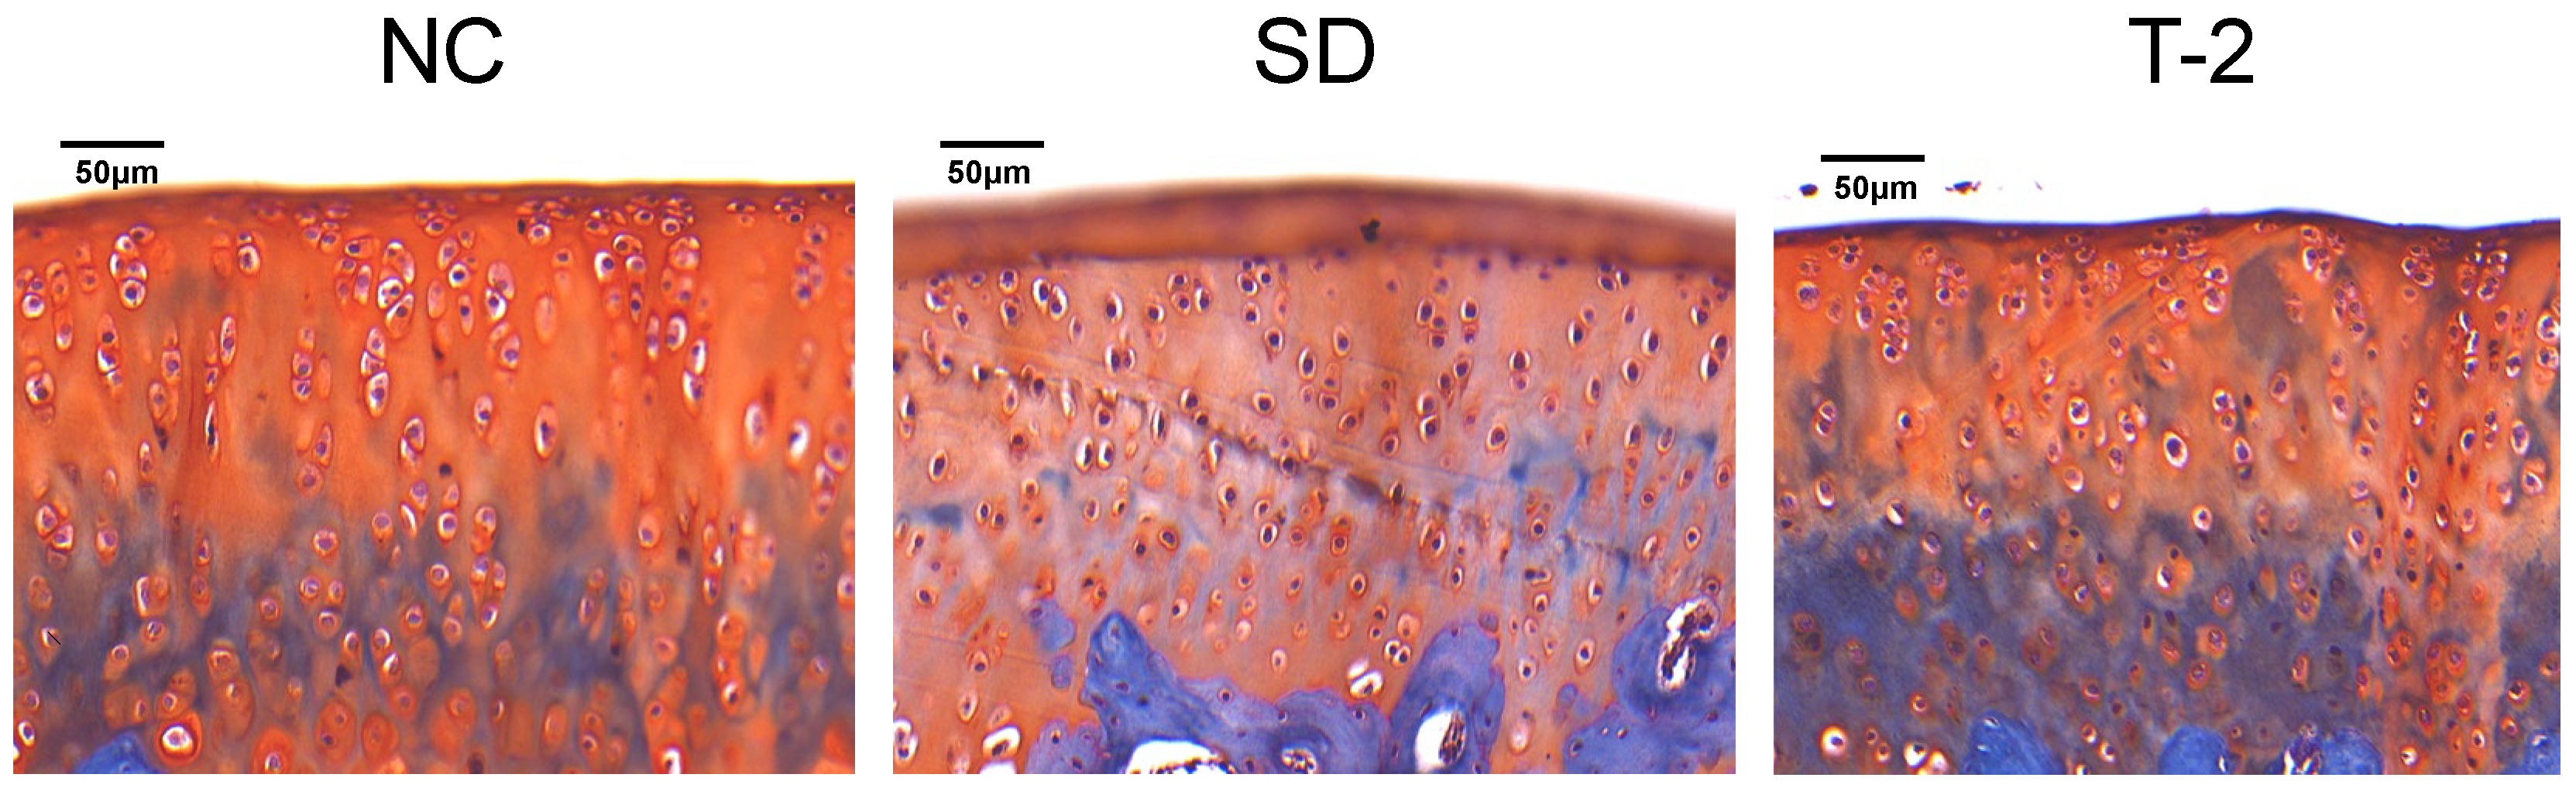
3.1. Pathological Changes in the Knee Joint of the Rats

In the NC group, the cartilage matrix was uniformly red, and the subchondral bone was blue-green, and the cartilage tissue was in sharp contrast with the bone tissue. The articular cartilage was smooth, and the chondrocytes were evenly distributed and arranged neatly. Compared with the NC group, the cartilage zone was thinner, the surface of cartilage appeared fissure, and the red part was significantly reduced in the SD and T-2 group. In addition, articular cartilage showed obvious wear and matrix loss (Figure 1).

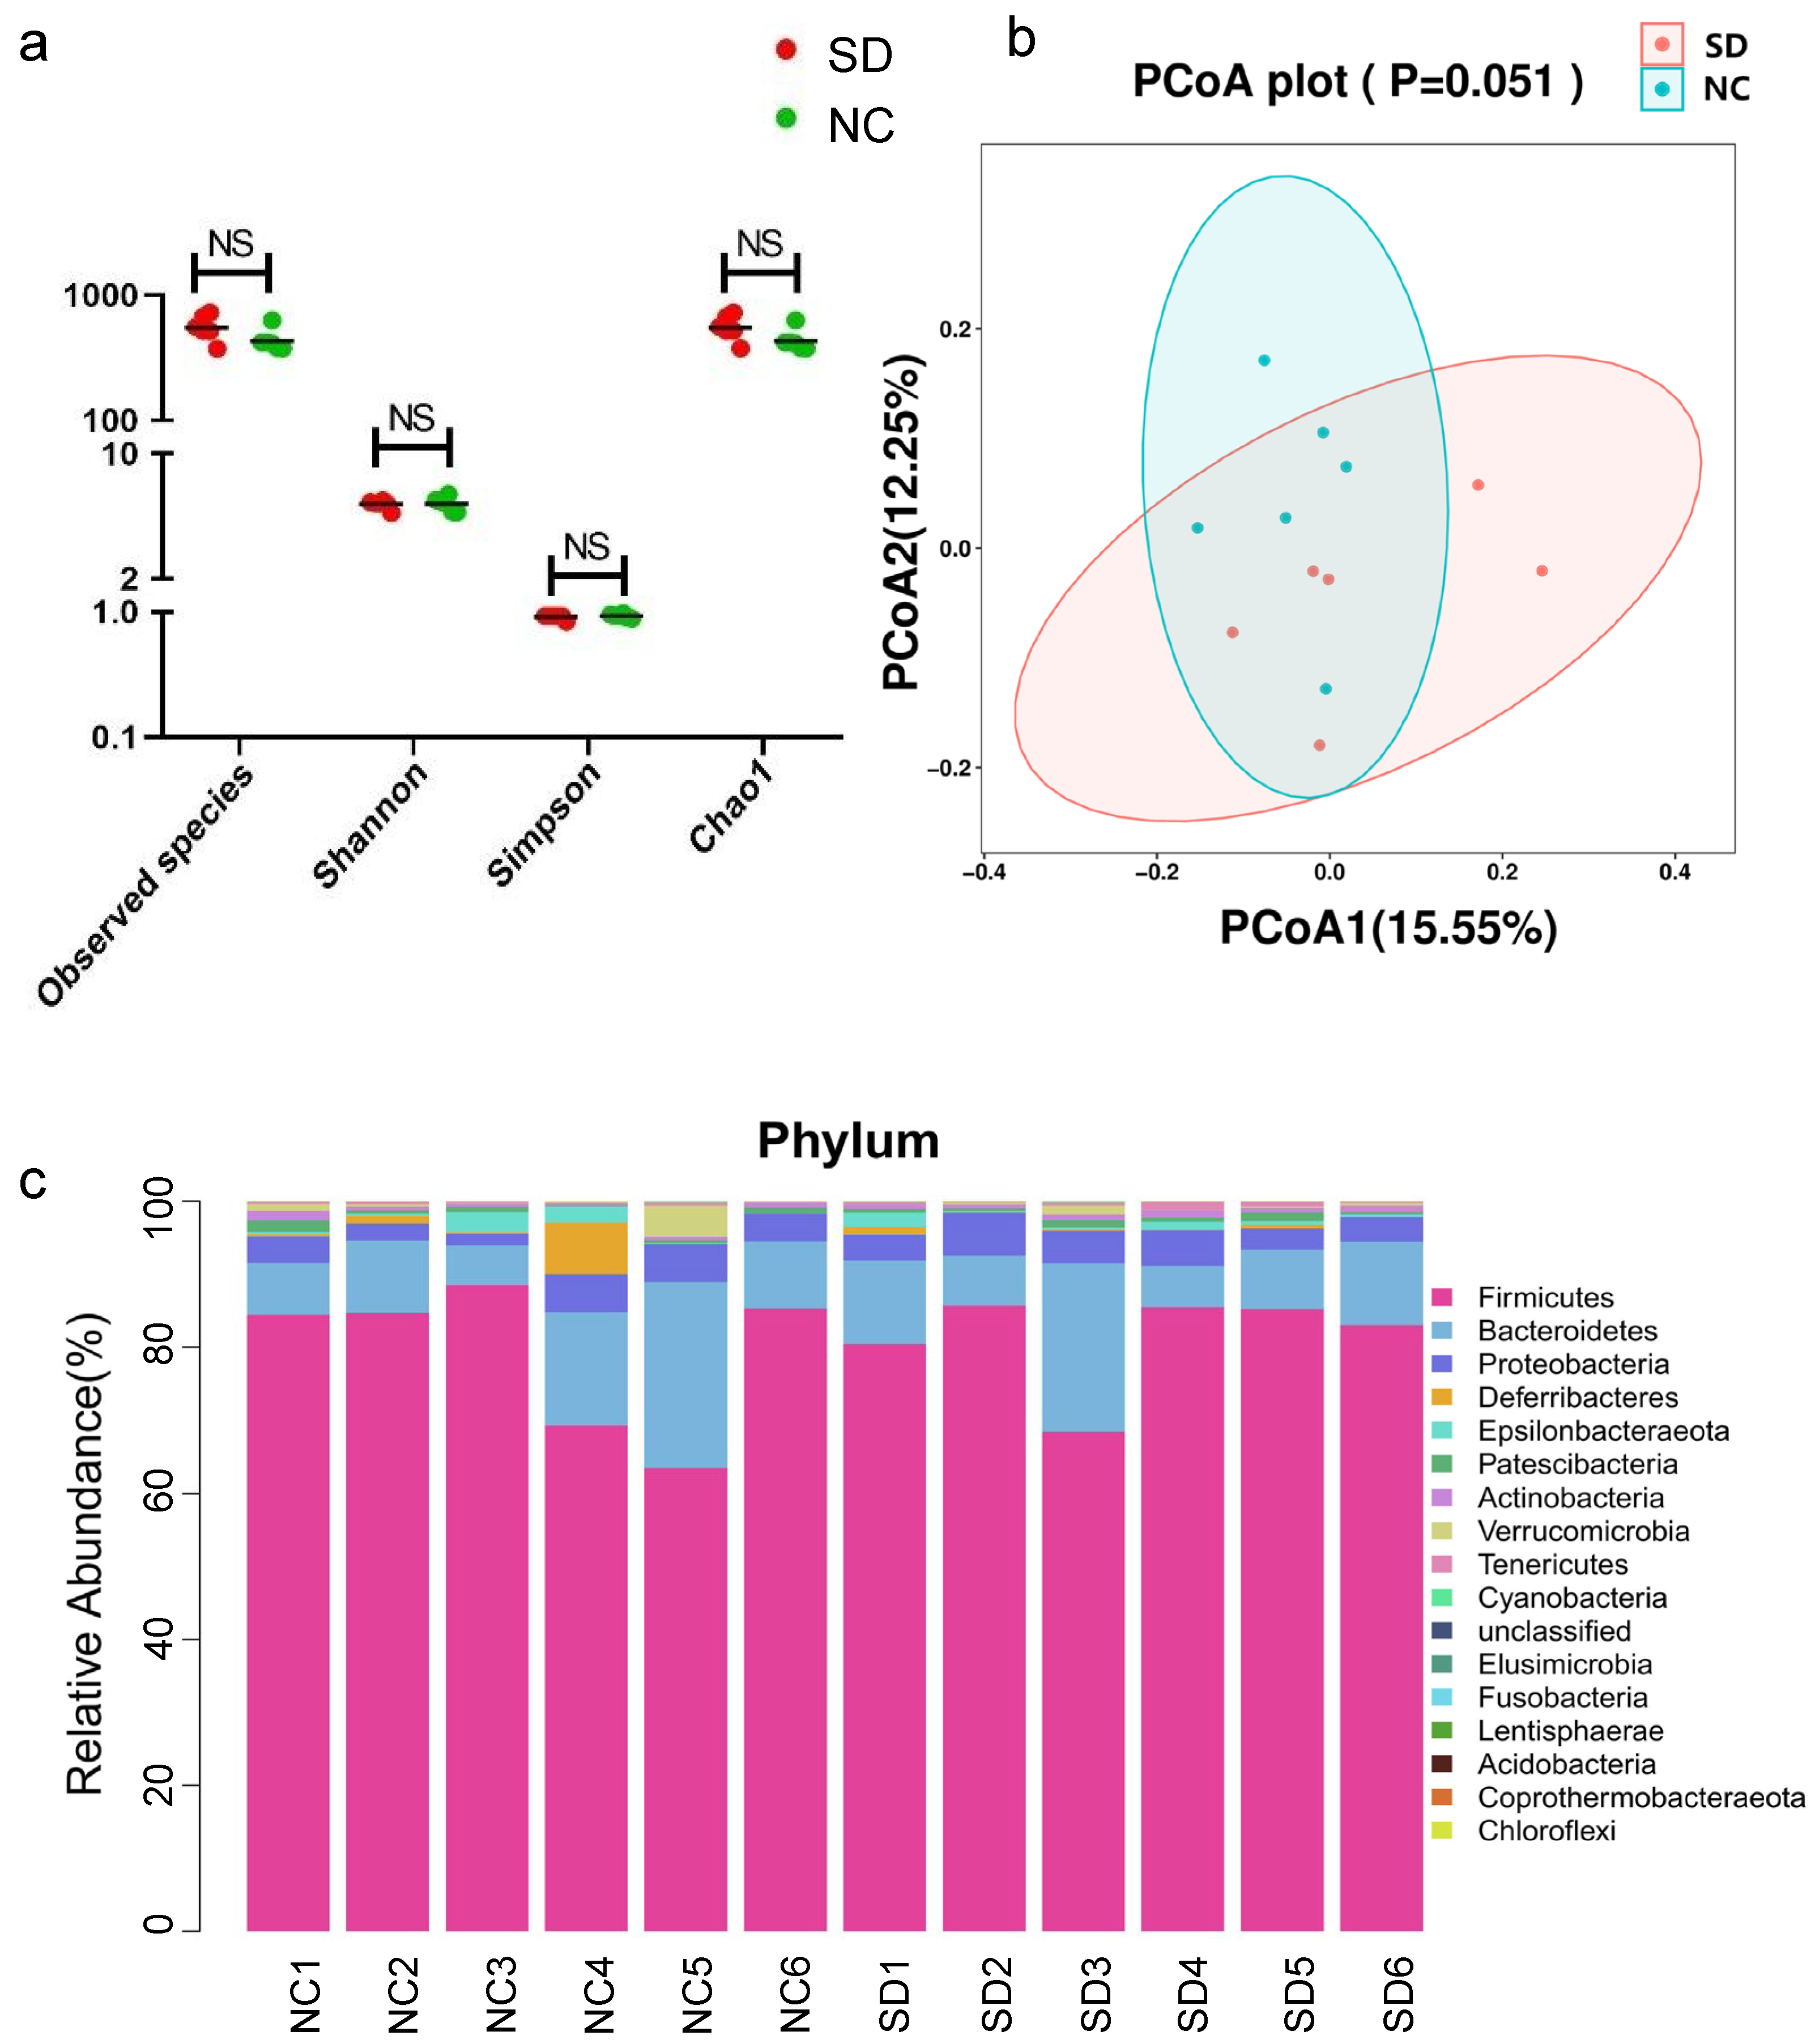
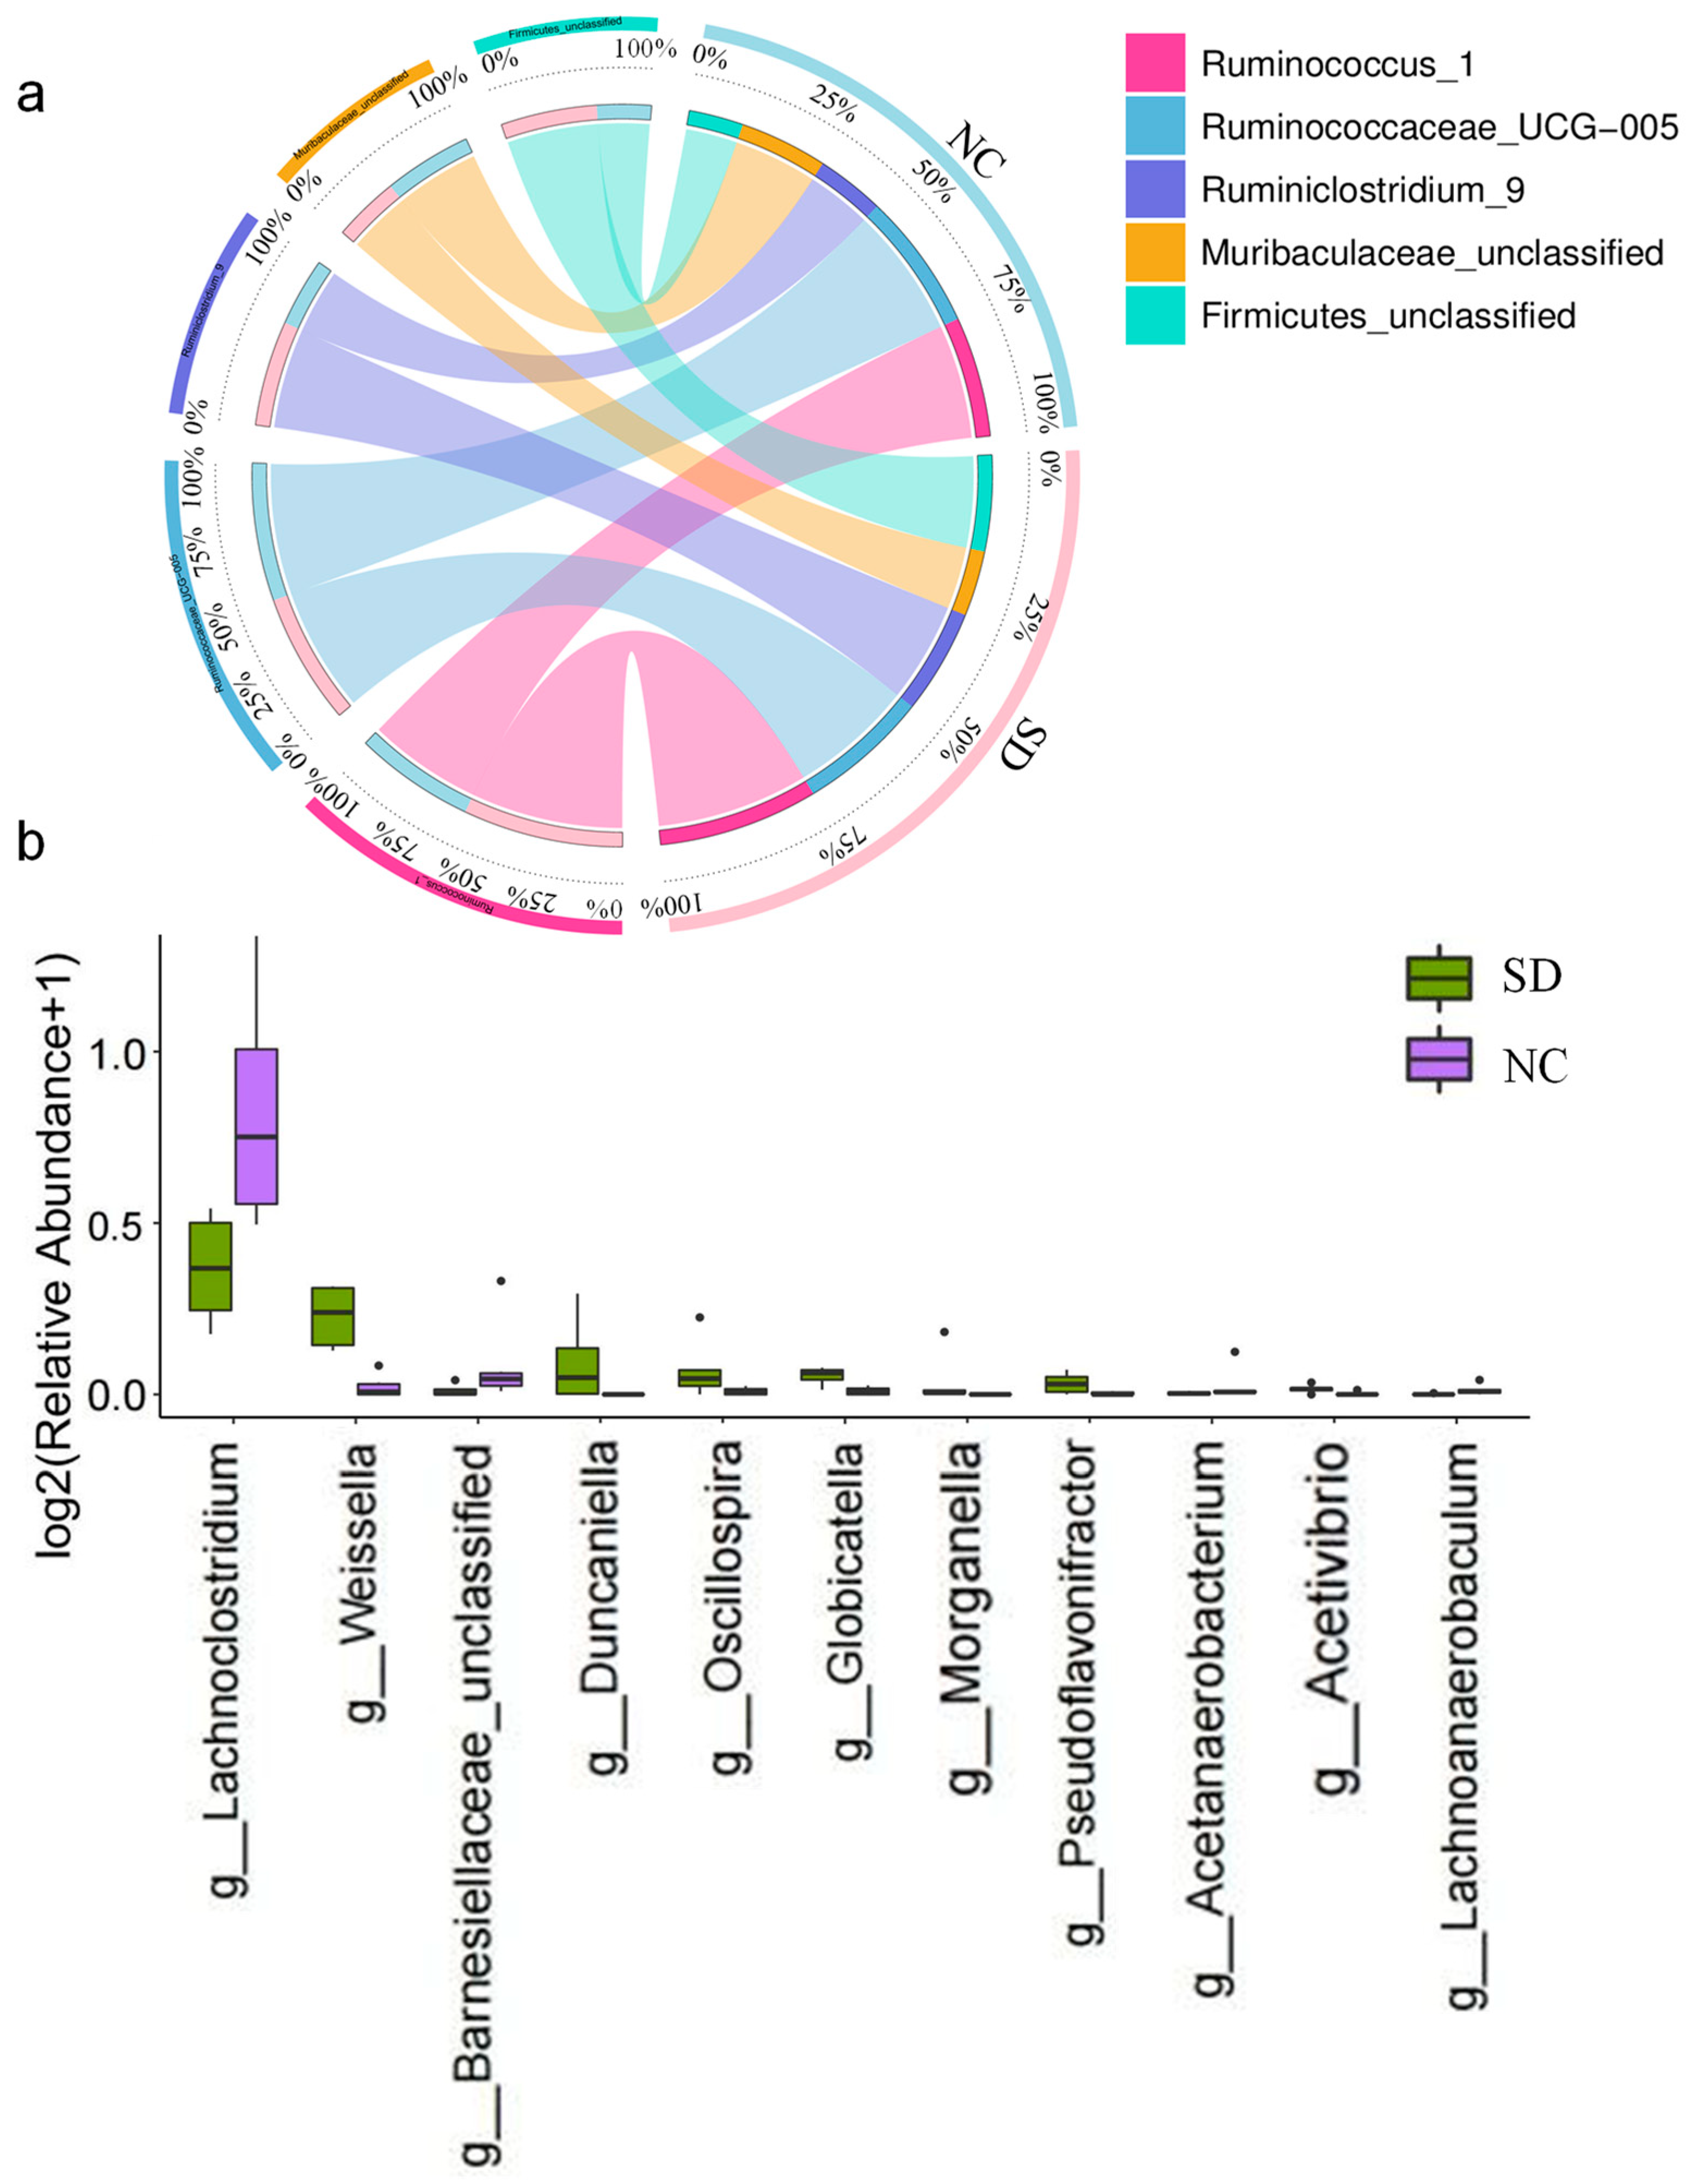
3.2. Analysis of Gut Microbiota in Rats Exposed to Se Deficiency vs. Negative Control Rats

A total of 914,275 high-quality reads were obtained from 16S rDNA sequencing, with a median of 77,072.5 reads per sample (71,749 to 79,342). There were 8621 features, including 4029 in the SD group and 4592 in the NC group. The alpha diversity and beta diversity were compared between the SD and NC groups to evaluate the characteristics of gut microbiome in rats intervened by Se deficiency. The alpha diversity was used to assess species richness and evenness of microorganisms in individual sample. In this study, observed species and Chao 1 indices were used to reflect richness, while Shannon and Simpson indices could comprehensively reflect richness and evenness in samples. The results showed that there was no significant difference in Shannon, observed species, Simpson and Chao 1 indices between the SD group and the NC group, indicating that the richness and evenness of microbial communities in the two groups did not change significantly (Figure 2a). The beta diversity was used to measure the magnitude of similarity in microbial community composition between different samples. Principal co-ordinates analysis (PCoA) was used to observe the similarities and differences between groups, and to visualize the similarity or difference of the data. In this study, the PCoA results of both weighted (Figure S1a) and unweighted UniFrac (Figure 2b) showed that there was no significant difference in beta diversity between the SD group and the NC group (p > 0.05), indicating that there was no significant difference in the composition and distribution of microbial communities between the two groups.
Microbial taxon division was performed to evaluate the relative proportions of dominant taxa at the genus level between the SD and NC groups. Firmicutes was the dominant phylum in the SD and NC groups, accounting for 81.39% and 79.29%, respectively. The proportion of Bacteroidetes in the SD group (11.11%) was lower than that in the NC group (12.12%). On the contrary, the proportion of Proteobacteria in SD group (4.17%) was higher than that in the NC group (3.61%) (Figure 2c). At the phylum level, Firmicutes was the dominant microbiome in the SD group. At the genus level, in the SD group, the relative abundance of Ruminococcus_1 was increased and Ruminococcaceae_UCG-005 was decreased. At the species level, the dominant microbiome of the two groups were Ruminococcaceae_UCG-005_unclassified (Figure 3a).
Linear discriminant analysis effect size (LEfSe) could identify two or more biomarkers and identify the microbiome with significant differences in abundance between groups. The threshold of LEfSe analysis was set as LDA value > 3, p < 0.05. In the comparison between the SD group and the NC group, the significant difference species with LDA value > 3 was Lachnoclostridium in the NC group, which was a biomarker with statistical differences between the two groups. At the genus level, Lachnoclostridium, Weissella, Barnesiellaceae_unclassified and Duncaniella had significant differences in relative abundance (Figure 3b).
In addition, species with the top 30 relative abundance at the genus level were selected. The correlation between these dominant bacterial groups was calculated based on their abundance using the SparCC method, and p values were obtained. The relationship pairs with the absolute value of correlation coefficient > 0.4 were selected from the results, and the correlation network diagram was drawn. Among the top 30 species of relative abundance at the genus level, there was significant positive correlation between Ruminococcus_2 and Ruminococcus_1, followed by Ruminococcus_1 and Ruminococcaceae_UCG_014. There was the strongest negative correlation between Bacteroides and Ruminococcaceae_UCG_005 (Figure S1b). The COG database was used to annotate the gene function of the microbiota in samples, which can identify a variety of important functions, such as Na+/alanine symporter, Transposase (or an inactivated derivative) and maltose binding periplasmic protein periplasmic protein MalE (Figure S2).

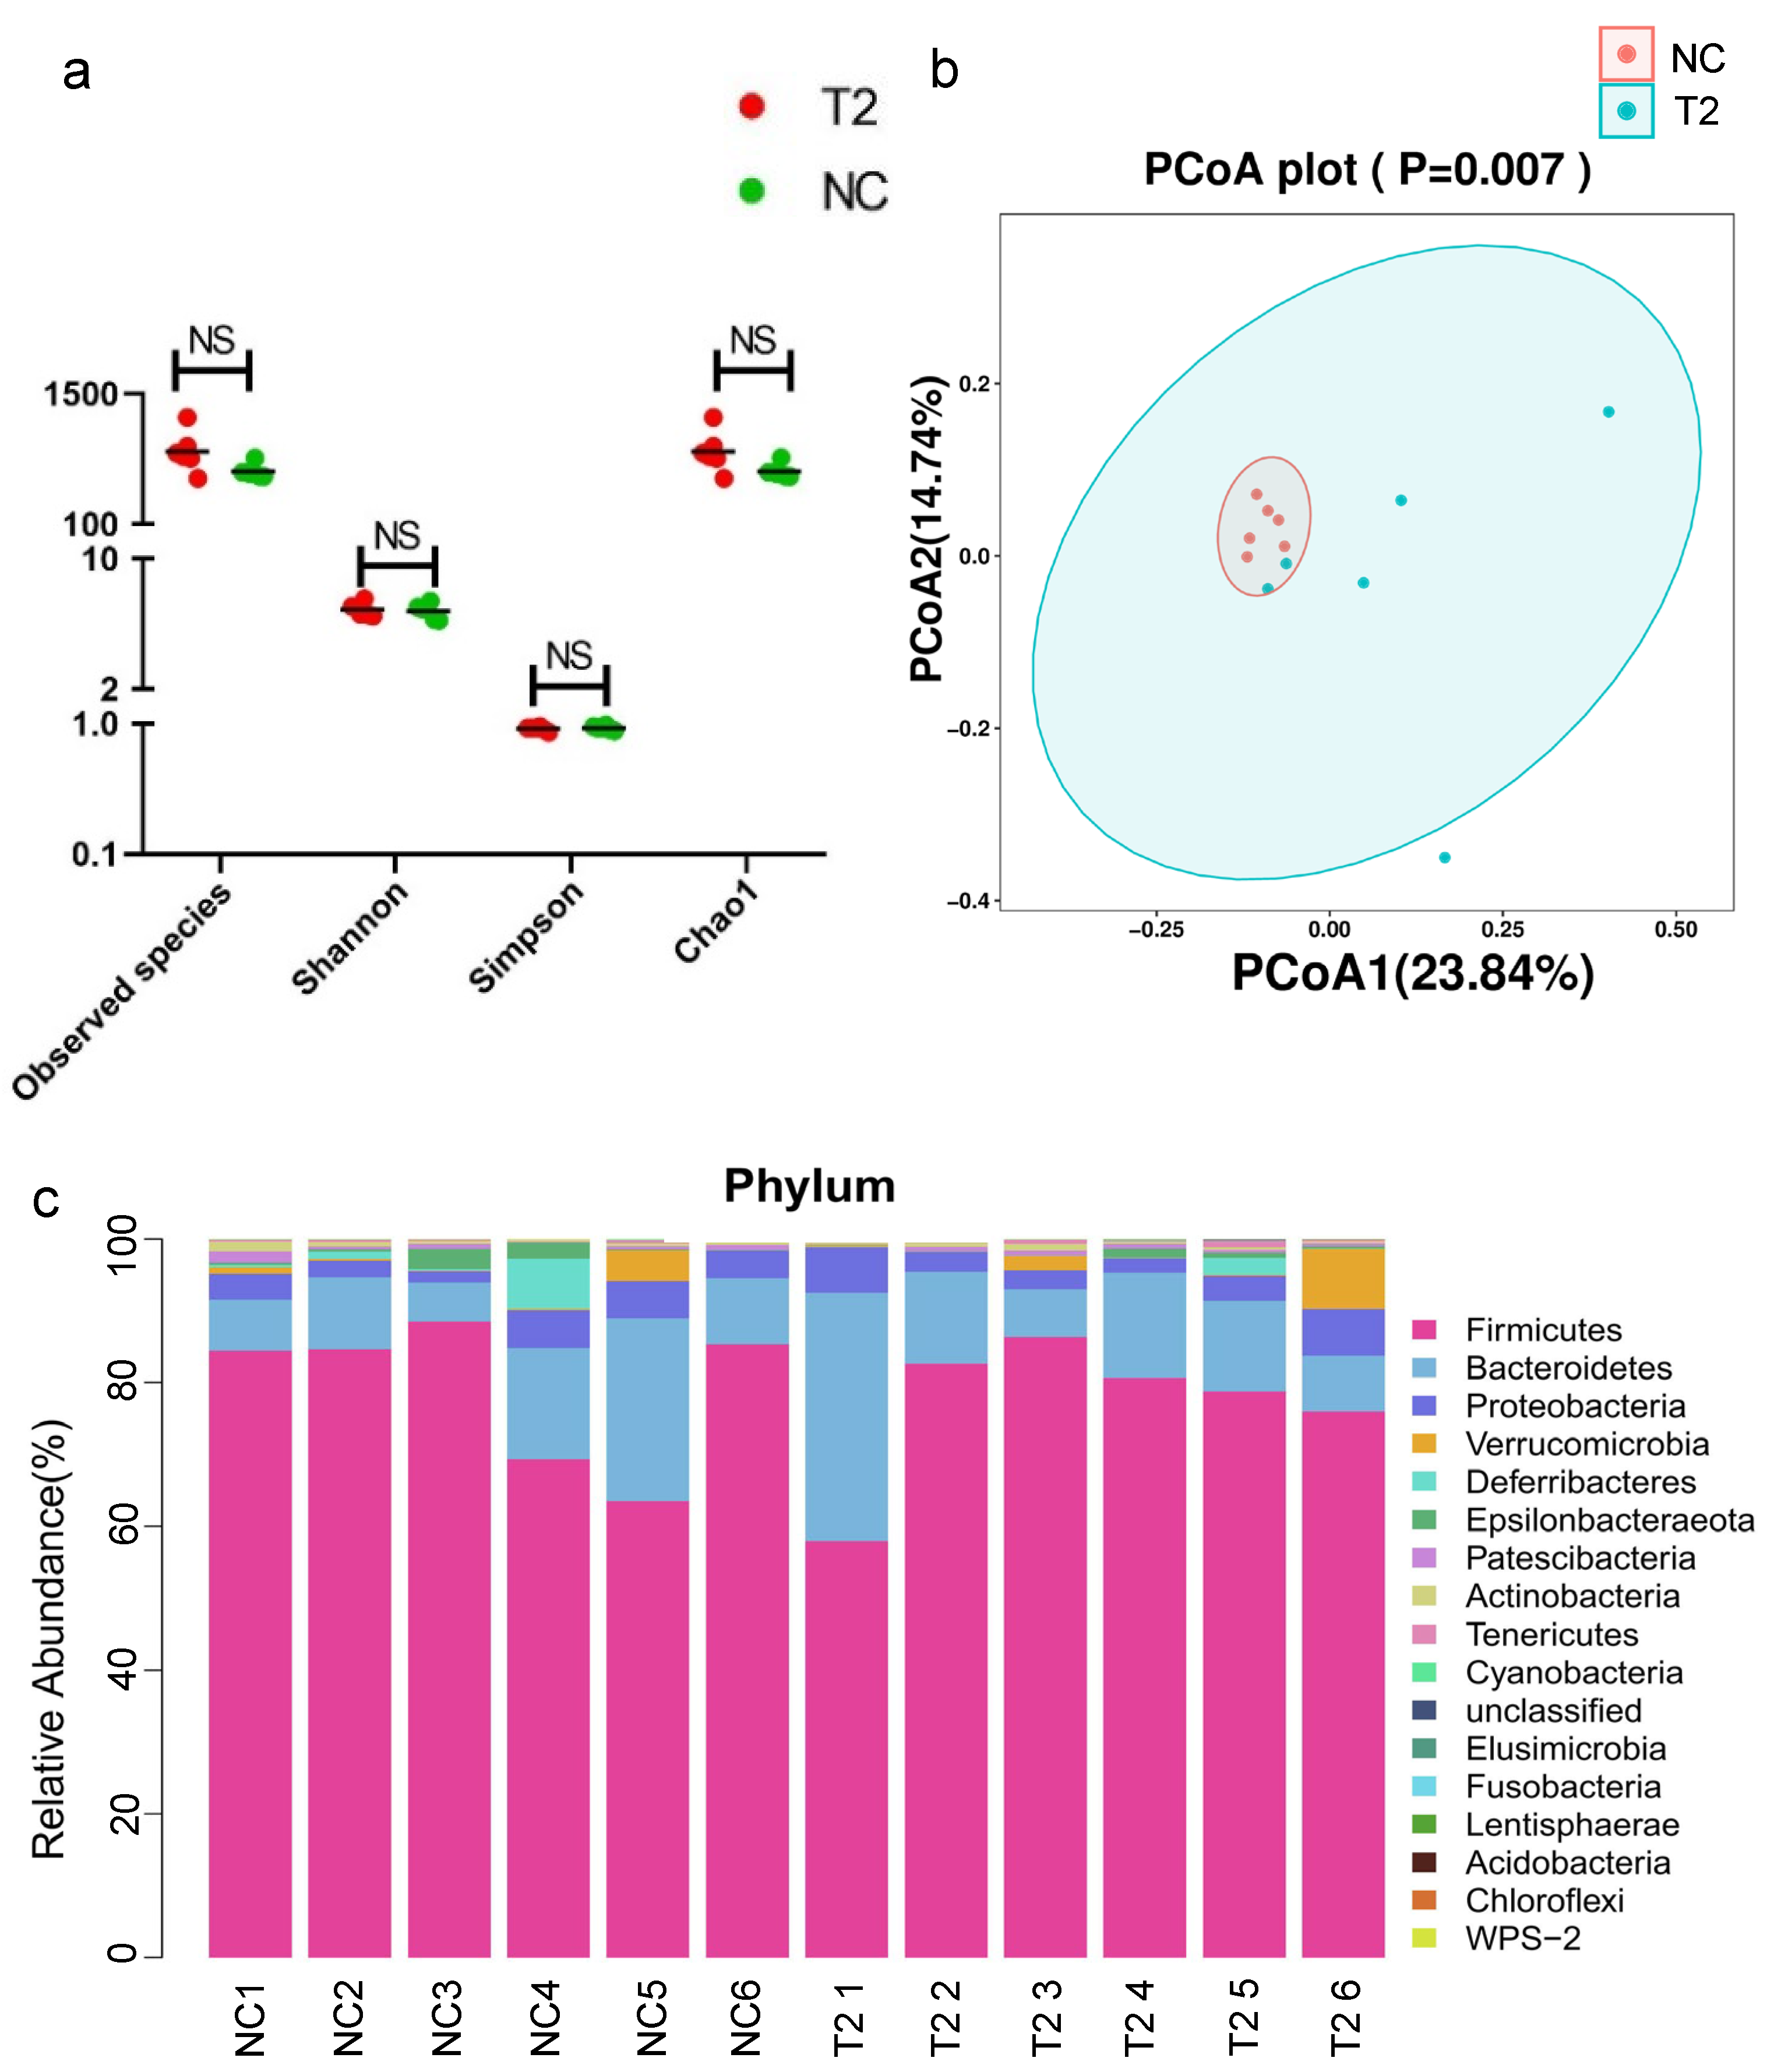
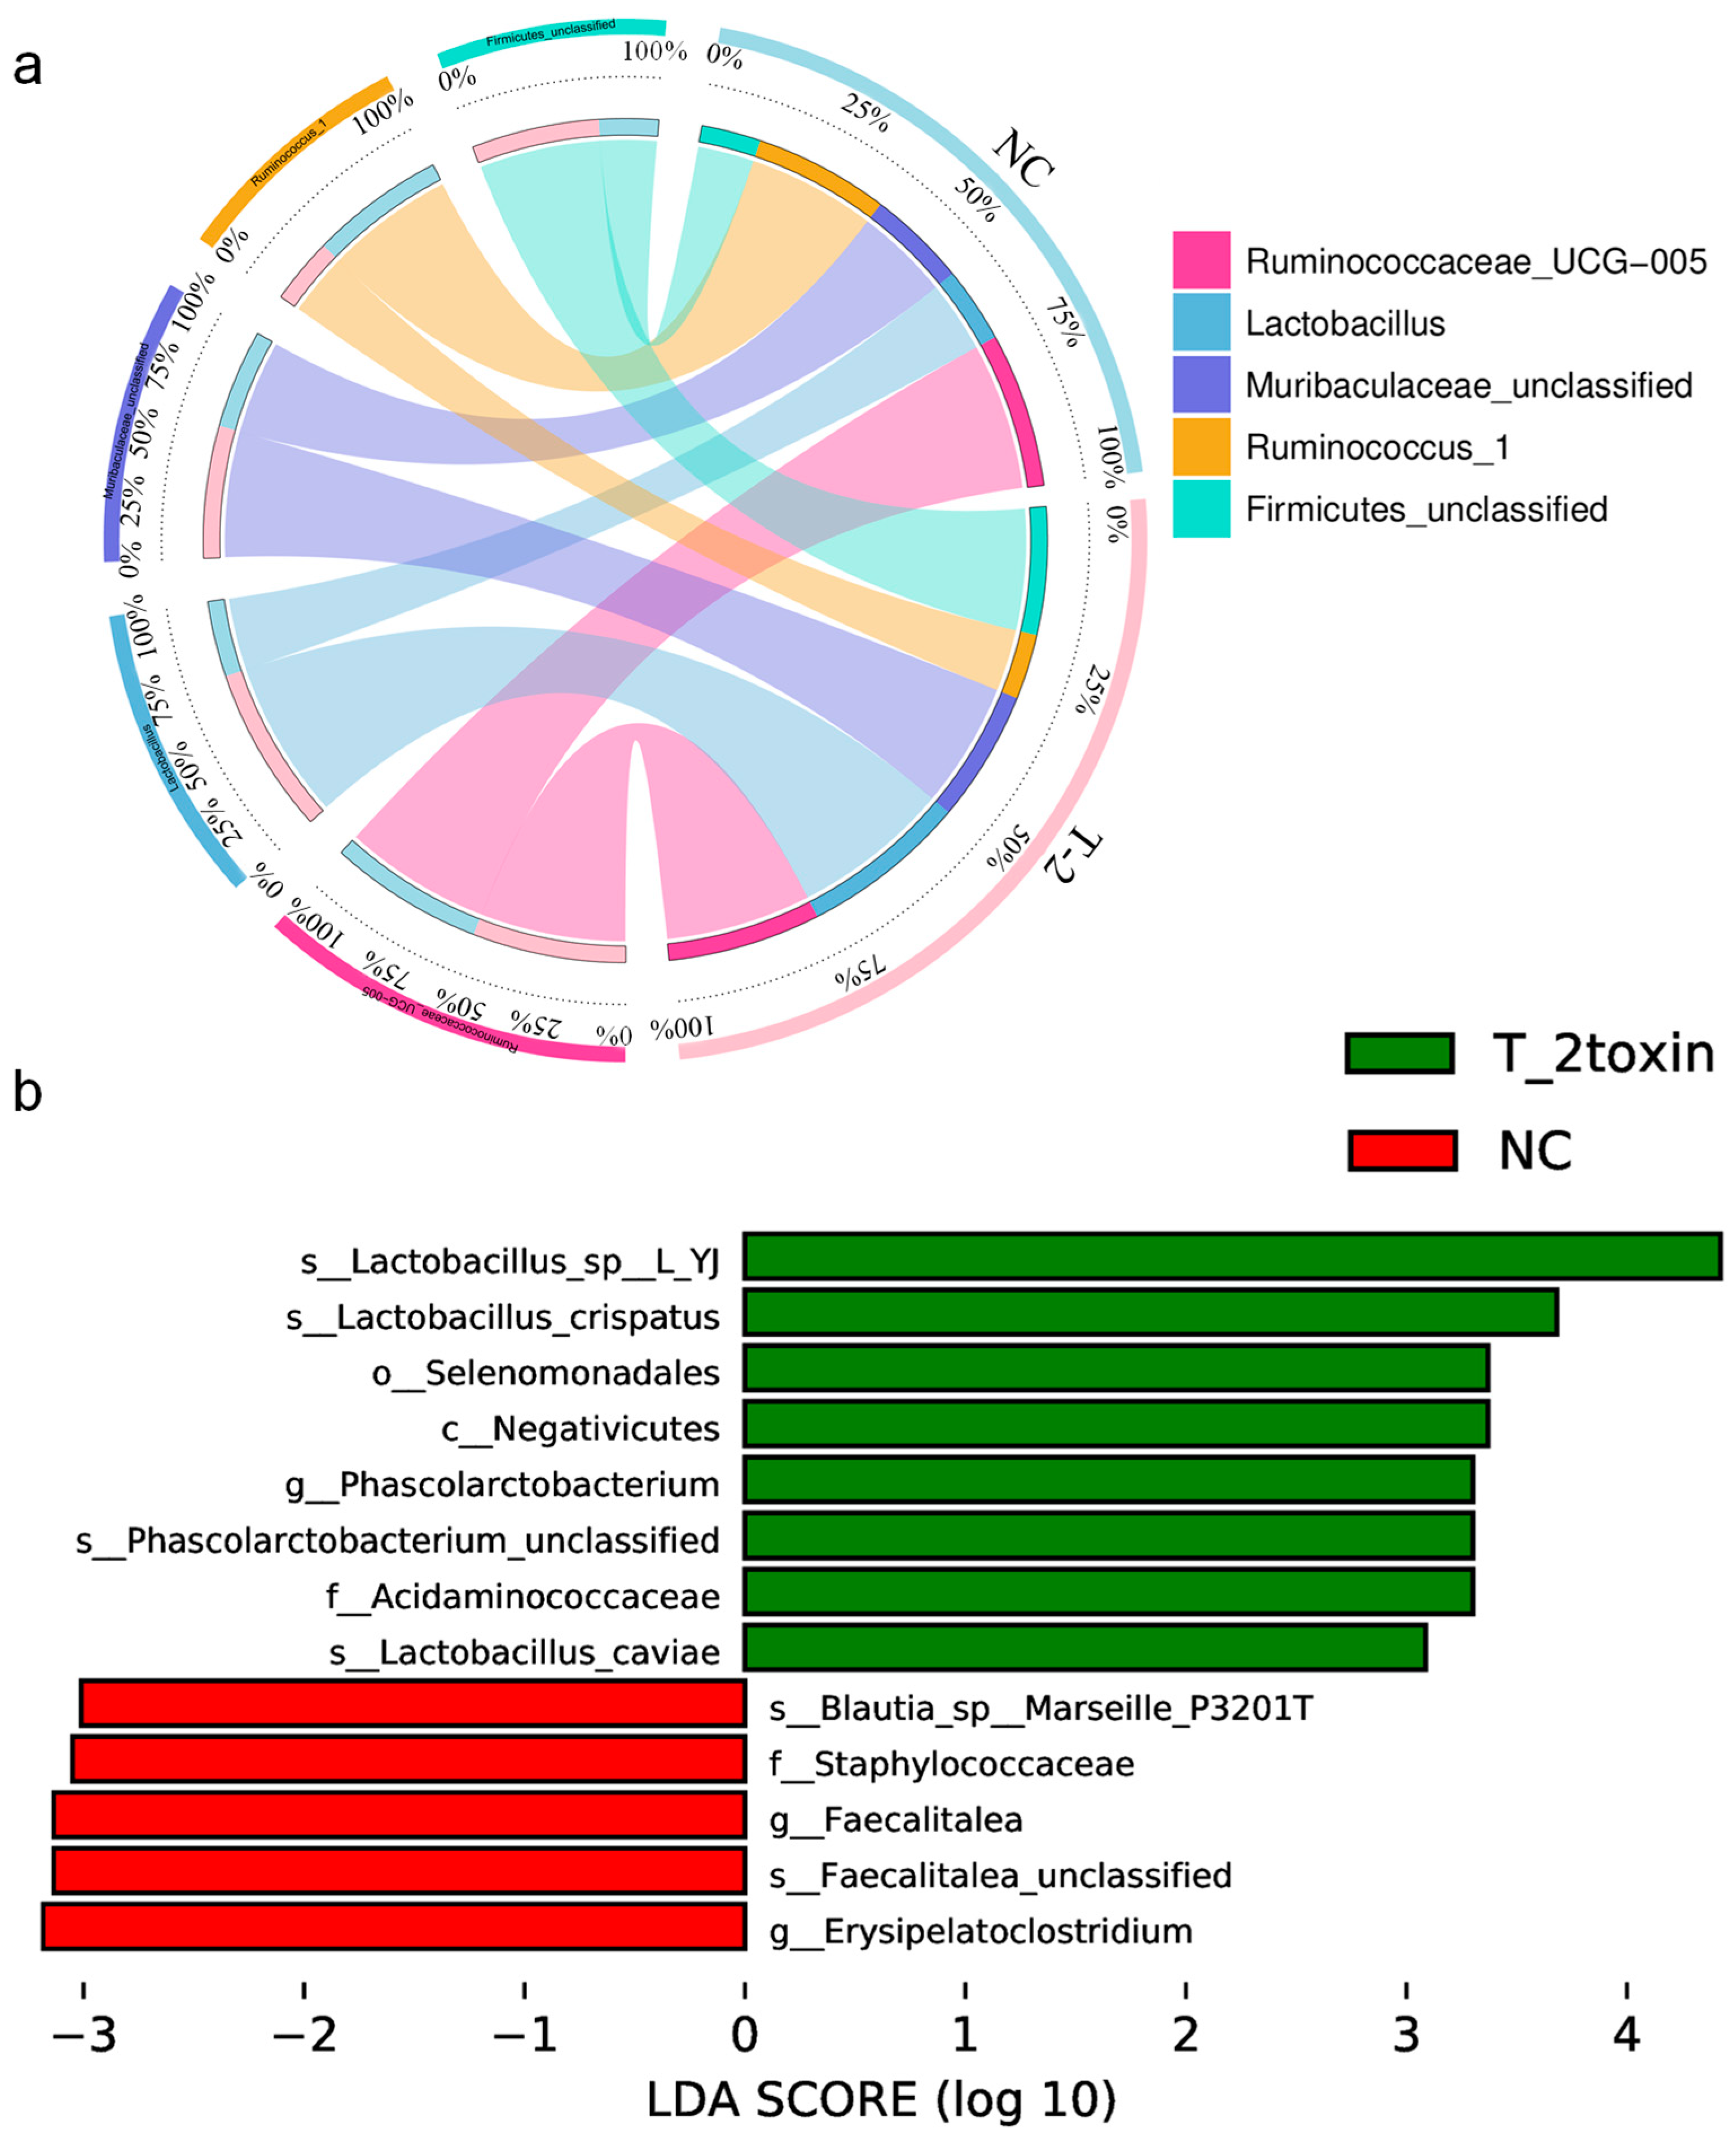
3.3. Analysis of Gut Microbiota in Rats Exposed to T-2 Toxin vs. Negative Control Rats

A total of 884,350 high-quality 16S rDNA reads were obtained by sequencing, with a median of 74,370.5 reads per sample (ranging from 67,143 to 77,629). There were 9271 features, including 5272 in the T-2 group and 3999 in the NC group. The alpha diversity and the beta diversity were compared between the T-2 group and the NC group to evaluate the characteristics of gut microbiota in rats intervened by T-2 toxin. The results showed that there was no significant difference in Shannon, observed species, Simpson and Chao 1 indices between the T-2 group and the NC group, indicating that the richness and evenness of microbial community in the two groups did not change significantly (Figure 4a). In this study, the PCoA results of unweighted UniFrac showed that the beta diversity of the T-2 group and the NC group was significantly different (p < 0.05) (Figure 4b), while the PCoA results of weighted UniFrac were opposite (p > 0.05) (Figure S3a), suggesting that there were differences in the species of the microbiota between the two groups, but there may be no significant difference in species abundance.
To evaluate the relative proportions of dominant taxa at the genus level between the T-2 group and the NC group, microbial taxa were divided. Firmicutes was the dominant phylum in the T-2 group and the NC group, accounting for 77.06% and 79.30%, respectively. The proportions of Bacteroidetes and Proteobacteria in the T-2 group were both higher than those in the NC group, which were 14.85% vs. 12.12% and 3.95% vs. 3.61%, respectively (Figure 4c). At the phylum level, Firmicutes was the dominant microbiome in the T-2 group. At the genus level, the relative abundance of Lactobacillus in T-2 group was the highest, while Ruminococcaceae_UCG-005 was the most dominant in the NC group. At the species level, the dominant bacteria of the two groups were Ruminococcaceae_UCG-005_unclassified (Figure 5a).
In the results with LDA value > 3, the significant difference species in the T-2 group were Lactobacillus_sp_L_YJ and Lactobacillus_crispatus. However, the NC group was characterized by Erysipelatoclostridium and Faecalitalea (Figure 5b). At the genus level, the species with significant differences in relative abundance were mainly Phascolarctobacterium, Erysipelatoclostridium, Faecalitalea and Veillonella (Figure S3b). Among the top 30 species in relative abundance at the genus level, Lactobacillus was positively correlated with Christensenellaceae_R_7_group and Muribaculaceae_unclassified. There was a negative correlation between Bacteroides and Ruminococcaceae_UCG_005 (Figure S3c).
Several important functions were identified using the COG database, such as ATPase components of ABC transporters with duplicated ATPase domains and carbamoylphosphate synthase large subunit and guanylate kinase (Figure S4).

3.4. Analysis of Gut Microbiota in Rats Exposed to Se Deficiency vs. T-2 Toxin

At the phylum level, Firmicutes, Bacteroidetes, Proteobacteria, Actinobacteria and Verrucomicrobia were the main phyla of gut microbiome in the SD and T-2 groups. Firmicutes had the highest relative abundance in the SD and T-2 groups, with SD group (81.39%) being higher than T-2 group (77.06%). The proportion of Bacteroidetes in SD group (11.11%) was lower than that in T-2 group (14.85%). On the contrary, the level of Proteobacteria was higher in SD group (4.17%) than in T-2 group (3.95%). In addition, Actinobacteria was the fourth most common bacteria in the SD group (0.70%), while it was lower in the T-2 group (0.50%). The level of Verrucomicrobia in the T-2 group was 1.81%, while it was only 0.36% in SD group (Table 1).
At the genus level, Ruminococcus, Lactobacillus, Firmicutes_unclassified and Muribaculaceae_unclassified were the main genus in the SD group and T-2 group. In the SD group, Ruminococcus was the most dominant bacteria, accounting for 12.62% of Ruminococcus_1, 10.31% of Ruminococcaceae_UCG-005, and 8.26% of Ruminiclostridium_9, respectively. In the T-2 group, Lactobacillus was the most abundant genus, accounting for 11.71%. The second was Ruminococcaceae_UCG-005 (10.75%). The third most abundant genus was Muribaculaceae_unclassified (9.26%). Similarly, the proportion of Firmicutes_unclassified was the fourth in the SD group and the T-2 group, which was 7.55% and 8.95%, respectively, showing a higher level in the T-2 group (Table 1).
In addition, at the genus level, a total of 11 species with significant differences in relative abundance in the SD group were identified: Weissella, Morganella, Lachnoanaerobaculum, Barnesiellaceae_unclassified, Globicatella, Acetivibrio, Duncaniella, Lachnoclostridium, Acetanaerobacterium, Oscillospira and Pseudoflavonifractor. In the T-2 group, a total of 15 species with significant differences in relative abundance were identified: Acetanaerobacterium, Hydrogenoanaerobacterium, Rikenella, Weissella, Veillonella, Phocea, Pseudoflavonifractor, Aerococcus, DTU014_unclassified, Ruminococcaceae_UCG-011, Eubacterium_xylanophilum_group, Acetovibrio, Phascolarctobacterium, Erysipelatoclostridium, and Faecalitalea. Among them, Weissella, Acetivibrio and Pseudoflavonifractor were significantly increased in SD and T-2 groups, while Acetanaerobacterium was significantly decreased in both groups (Table 2A).
In the SD group, species with increased levels included Morganella, Globicatella, Duncaniella and Oscillospira; in the T-2 group, the levels of Veillonella, Ruminococcaceae_UCG-011, Eubacterium_xylanophilum_group and Phascolarctobacterium increased (Table 2B); in the SD group, the levels of Lachnoanaerobaculum, Barnesiellaceae_unclassified and Lachnoclostridium were decreased; in the T-2 group, the levels of Hydroanaerobacterium, Rikenella, Phocea, Aerococcus, DTU014_unclassified, Erysipelatoclostridium and Faecalitalea were decreased (Table 2C).

4. Discussion

Gut microbiota, composed of thousands of microbiota, strives to maintain the existence and function of intestinal mucosal barrier, participate in nutrient absorption and digestion, substance transport and metabolism, regulate human immunity, growth and development [32]. Studies on the changes in gut microbiota in osteochondral diseases have suggested that the gut microbiota of patients with osteochondral diseases is diverse, and there is a certain correlation between the pathogenesis of such diseases and gut microbiota [33]. Based on our previous study on the gut microbiota profile of KBD patients and the results of comparing the gut microbiota of OA and KBD patients, we constructed rat models of Se deficiency and T-2 toxin exposure, respectively, and conducted 16SrDNA sequencing to analyze gut microbiota, aiming to investigate whether gut microbiota affects the occurrence and development of KBD, hoping to provide inspiration for the prevention and treatment of KBD.
In our previous study, the KBD patient was found to be characterized by elevated levels of Fusobacteria and Bacteroidetes. Consistent with the 16S rDNA analysis at the genus level, most of the differentially abundant species in KBD subjects belonged to Prevotella according to metagenomic sequencing. This indicates a change in the composition of the gut microbiota in patients with KBD. In the results of this study, Firmicutes were increased in the SD group compared with the NC group, while the level of Bacteroidetes were decreased. In contrast, the changes in the T-2 group showed a decrease in Firmicutes and an increase in Bacteroidetes. The changes in Proteobacteria were consistent in the SD and T-2 groups, which were higher than those in the NC group. In addition, the beta diversity of the T-2 group was significantly different from that of the NC group (p < 0.05), suggesting that the species of the T-2 group was different from that of the NC group. We can speculate that both Se deficiency and T-2 toxin exposure can dysregulate the composition of the gut microbiota in KBD, and the effects they play are different.
As an important group of bacteria in the gut, Bacteroidetes are involved in a variety of metabolic activities and can decompose and utilize polysaccharides to help digest carbohydrates [34]. Among them, Bacteroides and Prevotella have attracted more attention from researchers. Bacteroides is involved in the degradation of polysaccharides and dietary fiber [35]. Studies have found that Bacteroides can stimulate the immune system, enhance the phagocytosis of macrophages, regulate the metabolism of the body, and induce the proliferation of probiotics to promote the health of the body [36]. Bacteroides fragilis has beneficial immunomodulatory effects on the body [37]. Prevotella can use polysaccharides to produce metabolites such as acetic acid and succinic acid [38]. Succinic acid can help maintain the body’s immunity and improve the health of the host [39]. Studies on the function of selenium point out that an adequate level of selenium is important for the initiation of immunity [40]. Se deficiency and inhibition of selenoproteins expression are associated with elevated levels of inflammatory cytokines in the gastrointestinal tract. Under Se deficiency conditions, innate and adaptive immune responses are impaired [41]. In addition, a study of T-2 toxin pointed out that T-2 toxin disrupts the gut microbiota by changing the relative abundance of species, genus, and phylum levels, and this change may be a direct effect of the toxin and its antibacterial properties, a toxic consequence of T-2 toxin on cells, or the release of antibacterial substances [42]. In this study, the level of Bacteroidetes in the SD group was decreased, indicating that the low selenium nutritional status caused the decrease in Bacteroides abundance, which led to the suppression of immune level, and then caused cartilage damage. However, the level of Bacteroidetes was increased in the T-2 group, which may be caused by the toxic characteristics of T-2 toxin.
Firmicutes is the largest bacterial group in the gut, most of which are Gram-positive bacteria [43]. Lactobacillus is the most well-known probiotic, which is colonized in the human digestive tract and widely used in the food industry, medicine and health fields. It can participate in the metabolism of a variety of amino acids, help maintain the balance of gut microbiota, improve host immunity, and maintain the health of women’s vagina [44]. Studies have shown that Lactobacillus can ameliorate or limit inflammatory bone damage and joint dysfunction in patients with OA by reducing the expression of proinflammatory cytokines and cartilage damage [45]. Based on its anti-inflammatory effect, Lactobacillus has also been used as a probiotic treatment for OA for a long time [46]. In this study, compared with the NC group, the abundance of Lactobacillus in the T-2 group was significantly increased, and it was positively correlated with other bacteria such as Christensenellaceae_R_7_group and Muribaculaceae_unclassified. We speculated that the rise of Lactobacillus may be due to the lack of direct competition. These results indicated that T-2 toxin could not only unbalanced the gut microbiota of rats, but also regulate the quantity and function of other gut microbiota by affecting the level of Lactobacillus.
Ruminococcus is one of the earliest discovered gastric bacteria. It can degrade cellulose in the digestive tract and ferment glucose and xylose. Therefore, Ruminococcus can effectively break down the cell wall of plants in the digestive tract, which helps to stabilize the intestinal barrier and improve the body’s immunity [47]. Ruminococcus can induce anti-inflammatory or pro-inflammatory responses in the host, reflecting the characteristics of strain-specific immune regulation [48]. In this study, the relative abundance of Ruminococcus_1 and Ruminococcaceae_UGG-005 in the SD group is higher at the genus level, and the dominant bacteria in the SD group all belong to Ruminococcus, indicating that exposure of Se deficiency causes the imbalance of gut microbiota in rats, and the number and proportion of Ruminococcus changed significantly.
The characteristic pathological changes in KBD are necrosis of deep chondrocytes in growth plate cartilage and articular cartilage. Previous studies have shown that Se supplementation has a protective effect on growth plate cartilage, alleviates the necrosis of chondrocytes in growth plate. T-2 toxins can induce oxidative stress and reduce collagen type II and chondroitin sulfate in chondrocytes; therefore, Se deficiency and T-2 toxin were considered as most important risk factor for causing and development of KBD [49]. The human gut microbiome is strongly influenced by what they have taken in, such as Se deficiency and T-2 toxin, for example, Se deficiency affects the composition and colonization of the microbiome, which may interfere with the diversity of the microbiome [50,51]. And dietary selenium supplementation in mice can optimize the composition of gut microbiome and reduce the dysfunction of gut microbiome caused by low selenium [52]. In addition, the intestinal tract plays an important role in the metabolism and absorption of T-2 toxin, leading to intestinal mucosal damage, inflammation and oxidative stress, such as necrotizing enteritis and colibacillosis in animals. Fusarium toxins, such as T-2 toxin, was stable in gastrointestinal digestive fluid and cannot be absorbed by intestinal epithelial cells. When they come into contact with the gut microbiota, they can be efficiently hydrolyzed, allowing the metabolites to be easily absorbed from the gut [27]. According to our previous study on KBD patients, we found considerable variability in the gut microbiota, such as an increase in Bacteroides and a decrease in Firmicutes, which were similar to those in this study. At present, the mechanism of Se deficiency and fusarium toxin causing KBD has not been fully clarified. Based on the results of this study and the above discussion, we speculated that Se deficiency and T-2 toxin would affect the composition of human gut microbiota and its metabolites through dietary intake and intestinal absorption, resulting in the dysregulation of gut microbiota, and then induced joint cartilage damage through the cartilage–gut–microbiome axis, thereby triggering KBD. We believe that Se deficiency and T-2 toxin cause gut microbial dysregulation, which leads to joint damage, is one of the mechanisms triggering KBD. However, the specific mechanism is still unclear and needs further study.

5. Conclusions

In conclusion, this study comparatively analyzed the different compositions of gut microbiota in rats induced by Se deficiency and T-2 toxin, and identified and revealed the changes in the phylum, genus and species levels of gut microbiota. The results not only comprehensively reflect the situation of gut microbiota in rats with Se deficiency and T-2 toxin exposure, but also provide some clues for the role of the “cartilage–gut–microbiome” axis in the occurrence and development of KBD, and provide a scientific basis for promoting the study of the etiology and pathogenesis of KBD.

Supplementary Materials

The following supporting information can be downloaded at: https://www.mdpi.com/article/10.3390/nu15245027/s1, Figure S1: (a) the weighted PCoA results of the gut microbiota for the SD and NC groups; (b) Species correlation network in the SD group; Figure S2: COG database function annotation results between the SD and NC groups; Figure S3: (a) the weighted PCoA results of the gut microbiota for the T-2 and NC groups; (b) Analysis of Species significant differences at the genus level; (c) Species correlation network in the T-2 group; Figure S4: COG database function annotation results between the T-2 and NC groups.

Author Contributions

Conceptualization, X.W., Y.N., X.G. and H.Z.; methodology, Y.G.; software, C.W.; validation, Y.Z., S.L. and C.W.; formal analysis, Y.Y. and X.L.; investigation, Y.G.; resources, Y.L. and F.C.; data curation, F.Z. and S.C.; writing—original draft preparation, Y.W. and Y.G.; writing—review and editing, Y.W.; visualization, Y.W. and Y.G.; supervision, X.W. and Y.N.; project administration, X.W. and Y.N.; funding acquisition, X.W. All authors have read and agreed to the published version of the manuscript.

Funding

This research was funded by the National Natural Science Foundation of China (82273752, 82373700 and 81620108026), the Natural Science Basic Research Plan in Shaanxi Province of China (2023-JC-YB-704), the NHC Key Laboratory of Etiology and Epidemiology (23618504), the China Postdoctoral Foundation (2022M712526, 2021M692543), and the Shaanxi Postdoctoral Foundation (2018BSHYDZZ47 and 2018BSHEDZZ96).

Institutional Review Board Statement

The animal study protocol was approved by the Animal Ethics Committee of Xi’an Jiaotong University (Approval No. 2022685) on 1 March 2022.

Data Availability Statement

All data generated or used during this study are available from the corresponding author and first author upon reasonable request.

Acknowledgments

Thanks to Zengtie Zhang for his help in the experimental process.

Conflicts of Interest

The authors declare no conflict of interest.

References

  1. Wang, K.; Yu, J.; Liu, H.; Liu, Y.; Liu, N.; Cao, Y.; Zhang, X.; Sun, D. Endemic Kashin-Beck disease: A food-sourced osteoarthropathy. Semin. Arthritis Rheum. 2020, 50, 366–372. [Google Scholar] [CrossRef]
  2. Shi, T.; Fu, X.; Wang, F.; Zhang, X.; Cai, Y.; Wu, X.; Sun, L. The WNT/β-catenin signalling pathway induces chondrocyte apoptosis in the cartilage injury caused by T-2 toxin in rats. Toxicon 2021, 204, 14–20. [Google Scholar] [CrossRef] [PubMed]
  3. Fu, G.; Chen, X.; Qi, M.; Du, X.; Xia, Z.; Liu, Q.; Sun, N.; Shi, C.; Zhang, R. Status and potential diagnostic roles of essential trace elements in Kashin- Beck disease patients. J. Trace Elem. Med. Biol. 2022, 69, 126880. [Google Scholar] [CrossRef] [PubMed]
  4. Zhang, S.; Li, B.; Luo, K. Differences of selenium and other trace elements abundances between the Kaschin-Beck disease area and nearby non-Kaschin-Beck disease area, Shaanxi Province, China. Food Chem. 2022, 373, 131481. [Google Scholar] [CrossRef] [PubMed]
  5. Wang, J.; Wang, X.; Li, H.; Yang, L.; Li, Y.; Kong, C. Spatial distribution and determinants of health loss from Kashin-Beck disease in Bin County, Shaanxi Province, China. BMC Public Health 2021, 21, 387. [Google Scholar] [CrossRef] [PubMed]
  6. Janik, E.; Niemcewicz, M.; Podogrocki, M.; Ceremuga, M.; Stela, M.; Bijak, M. T-2 Toxin-The Most Toxic Trichothecene Mycotoxin: Metabolism, Toxicity, and Decontamination Strategies. Molecules 2021, 26, 6868. [Google Scholar] [CrossRef] [PubMed]
  7. Liu, J.; Wang, L.; Guo, X.; Pang, Q.; Wu, S.; Wu, C.; Xu, P.; Bai, Y. The role of mitochondria in T-2 toxin-induced human chondrocytes apoptosis. PLoS ONE 2014, 9, e108394. [Google Scholar] [CrossRef]
  8. Shi, Y.; Shao, X.; Sun, M.; Ma, J.; Li, B.; Zou, N.; Li, F. MiR-140 is involved in T-2 toxin-induced matrix degradation of articular cartilage. Toxicon 2023, 222, 106987. [Google Scholar] [CrossRef] [PubMed]
  9. Guo, Y.; Li, H.; Yang, L.; Li, Y.; Wei, B.; Wang, W.; Gong, H.; Guo, M.; Nima, C.; Zhao, S.; et al. Trace Element Levels in Scalp Hair of School Children in Shigatse, Tibet, an Endemic Area for Kaschin-Beck Disease (KBD). Biol. Trace Elem. Res. 2017, 180, 15–22. [Google Scholar] [CrossRef]
  10. Sommer, F.; Bäckhed, F. The gut microbiota--masters of host development and physiology. Nat. Rev. Microbiol. 2013, 11, 227–238. [Google Scholar] [CrossRef]
  11. Arumugam, M.; Raes, J.; Pelletier, E.; Le Paslier, D.; Yamada, T.; Mende, D.R.; Fernandes, G.R.; Tap, J.; Bruls, T.; Batto, J.M.; et al. Enterotypes of the human gut microbiome. Nature 2011, 473, 174–180. [Google Scholar] [CrossRef] [PubMed]
  12. Li, Y.; Qin, C.; Dong, L.; Zhang, X.; Wu, Z.; Liu, L.; Yang, J.; Liu, L. Whole grain benefit: Synergistic effect of oat phenolic compounds and β-glucan on hyperlipidemia via gut microbiota in high-fat-diet mice. Food Funct. 2022, 13, 12686–12696. [Google Scholar] [CrossRef] [PubMed]
  13. Osuna-Prieto, F.J.; Xu, H.; Ortiz-Alvarez, L.; Di, X.; Kohler, I.; Jurado-Fasoli, L.; Rubio-Lopez, J.; Plaza-Díaz, J.; Vilchez-Vargas, R.; Link, A.; et al. The relative abundance of fecal bacterial species belonging to the Firmicutes and Bacteroidetes phyla is related to plasma levels of bile acids in young adults. Metabolomics 2023, 19, 54. [Google Scholar] [CrossRef] [PubMed]
  14. Dong, L.; Qin, C.; Li, Y.; Wu, Z.; Liu, L. Oat phenolic compounds regulate metabolic syndrome in high fat diet-fed mice via gut microbiota. Food Biosci. 2022, 50, 101946. [Google Scholar] [CrossRef]
  15. Qin, J.; Li, R.; Raes, J.; Arumugam, M.; Burgdorf, K.S.; Manichanh, C.; Nielsen, T.; Pons, N.; Levenez, F.; Yamada, T.; et al. A human gut microbial gene catalogue established by metagenomic sequencing. Nature 2010, 464, 59–65. [Google Scholar] [CrossRef]
  16. Liang, Y.; Zhan, J.; Liu, D.; Luo, M.; Han, J.; Liu, X.; Liu, C.; Cheng, Z.; Zhou, Z.; Wang, P. Organophosphorus pesticide chlorpyrifos intake promotes obesity and insulin resistance through impacting gut and gut microbiota. Microbiome 2019, 7, 19. [Google Scholar] [CrossRef]
  17. Liu, B.N.; Liu, X.T.; Liang, Z.H.; Wang, J.H. Gut microbiota in obesity. World J. Gastroenterol. 2021, 27, 3837–3850. [Google Scholar] [CrossRef]
  18. Iatcu, C.O.; Steen, A.; Covasa, M. Gut Microbiota and Complications of Type-2 Diabetes. Nutrients 2021, 14, 166. [Google Scholar] [CrossRef]
  19. Verhaar, B.J.H.; Prodan, A.; Nieuwdorp, M.; Muller, M. Gut Microbiota in Hypertension and Atherosclerosis: A Review. Nutrients 2020, 12, 2982. [Google Scholar] [CrossRef]
  20. Lai, H.C.; Lin, T.L.; Chen, T.W.; Kuo, Y.L.; Chang, C.J.; Wu, T.R.; Shu, C.C.; Tsai, Y.H.; Swift, S.; Lu, C.C. Gut microbiota modulates COPD pathogenesis: Role of anti-inflammatory Parabacteroides goldsteinii lipopolysaccharide. Gut 2022, 71, 309–321. [Google Scholar] [CrossRef]
  21. Ramires, L.C.; Santos, G.S.; Ramires, R.P.; da Fonseca, L.F.; Jeyaraman, M.; Muthu, S.; Lana, A.V.; Azzini, G.; Smith, C.S.; Lana, J.F. The Association between Gut Microbiota and Osteoarthritis: Does the Disease Begin in the Gut? Int. J. Mol. Sci. 2022, 23, 1494. [Google Scholar] [CrossRef] [PubMed]
  22. Gomaa, E.Z. Human gut microbiota/microbiome in health and diseases: A review. Antonie Van Leeuwenhoek 2020, 113, 2019–2040. [Google Scholar] [CrossRef] [PubMed]
  23. Jeffries, M.A.; Donica, M.; Baker, L.W.; Stevenson, M.E.; Annan, A.C.; Beth Humphrey, M.; James, J.A.; Sawalha, A.H. Genome-Wide DNA Methylation Study Identifies Significant Epigenomic Changes in Osteoarthritic Subchondral Bone and Similarity to Overlying Cartilage. Arthritis Rheumatol. 2016, 68, 1403–1414. [Google Scholar] [CrossRef] [PubMed]
  24. Berthelot, J.M.; Sellam, J.; Maugars, Y.; Berenbaum, F. Cartilage-gut-microbiome axis: A new paradigm for novel therapeutic opportunities in osteoarthritis. RMD Open 2019, 5, e001037. [Google Scholar] [CrossRef] [PubMed]
  25. Zou, K.; Liu, G.; Wu, T.; Du, L. Selenium for preventing Kashin-Beck osteoarthropathy in children: A meta-analysis. Osteoarthr. Cartil. 2009, 17, 144–151. [Google Scholar] [CrossRef]
  26. Peng, A.; Wang, W.H.; Wang, C.X.; Wang, Z.J.; Rui, H.F.; Wang, W.Z.; Yang, Z.W. The role of humic substances in drinking water in Kashin-Beck disease in China. Environ. Health Perspect. 1999, 107, 293–296. [Google Scholar] [CrossRef] [PubMed]
  27. Gratz, S.W.; Dinesh, R.; Yoshinari, T.; Holtrop, G.; Richardson, A.J.; Duncan, G.; MacDonald, S.; Lloyd, A.; Tarbin, J. Masked trichothecene and zearalenone mycotoxins withstand digestion and absorption in the upper GI tract but are efficiently hydrolyzed by human gut microbiota in vitro. Mol. Nutr. Food Res. 2017, 61, 1600680. [Google Scholar] [CrossRef]
  28. Kasaikina, M.V.; Kravtsova, M.A.; Lee, B.C.; Seravalli, J.; Peterson, D.A.; Walter, J.; Legge, R.; Benson, A.K.; Hatfield, D.L.; Gladyshev, V.N. Dietary selenium affects host selenoproteome expression by influencing the gut microbiota. FASEB J. 2011, 25, 2492–2499. [Google Scholar] [CrossRef] [PubMed]
  29. Knezevic, J.; Starchl, C.; Tmava Berisha, A.; Amrein, K. Thyroid-Gut-Axis: How Does the Microbiota Influence Thyroid Function? Nutrients 2020, 12, 1769. [Google Scholar] [CrossRef]
  30. Yang, H.J.; Zhang, Y.; Wang, Z.L.; Xue, S.H.; Li, S.Y.; Zhou, X.R.; Zhang, M.; Fang, Q.; Wang, W.J.; Chen, C.; et al. Increased Chondrocyte Apoptosis in Kashin-Beck Disease and Rats Induced by T-2 Toxin and Selenium Deficiency. Biomed. Environ. Sci. 2017, 30, 351–362. [Google Scholar] [CrossRef]
  31. Wu, Y.; Gong, Y.; Liu, Y.; Chen, F.; Chen, S.; Zhang, F.; Wang, C.; Li, S.; Hu, M.; Huang, R.; et al. Comparative Analysis of Differentially Expressed Genes in Chondrocytes from Rats Exposed to Low Selenium and T-2 Toxin. Biol. Trace Elem. Res. 2023. [Google Scholar] [CrossRef] [PubMed]
  32. Adak, A.; Khan, M.R. An insight into gut microbiota and its functionalities. Cell. Mol. Life Sci. 2019, 76, 473–493. [Google Scholar] [CrossRef]
  33. Liu, Y.; Ding, W.; Wang, H.L.; Dai, L.L.; Zong, W.H.; Wang, Y.Z.; Bi, J.; Han, W.; Dong, G.J. Gut microbiota and obesity-associated osteoarthritis. Osteoarthr. Cartil. 2019, 27, 1257–1265. [Google Scholar] [CrossRef] [PubMed]
  34. Gibiino, G.; Lopetuso, L.R.; Scaldaferri, F.; Rizzatti, G.; Binda, C.; Gasbarrini, A. Exploring Bacteroidetes: Metabolic key points and immunological tricks of our gut commensals. Dig. Liver Dis. 2018, 50, 635–639. [Google Scholar] [CrossRef] [PubMed]
  35. Martens, E.C.; Chiang, H.C.; Gordon, J.I. Mucosal glycan foraging enhances fitness and transmission of a saccharolytic human gut bacterial symbiont. Cell Host Microbe 2008, 4, 447–457. [Google Scholar] [CrossRef] [PubMed]
  36. Wang, C.; Zhao, J.; Zhang, H.; Lee, Y.K.; Zhai, Q.; Chen, W. Roles of intestinal bacteroides in human health and diseases. Crit. Rev. Food Sci. Nutr. 2021, 61, 3518–3536. [Google Scholar] [CrossRef] [PubMed]
  37. Sun, F.; Zhang, Q.; Zhao, J.; Zhang, H.; Zhai, Q.; Chen, W. A potential species of next-generation probiotics? The dark and light sides of Bacteroides fragilis in health. Food Res. Int. 2019, 126, 108590. [Google Scholar] [CrossRef]
  38. Fehlner-Peach, H.; Magnabosco, C.; Raghavan, V.; Scher, J.U.; Tett, A.; Cox, L.M.; Gottsegen, C.; Watters, A.; Wiltshire-Gordon, J.D.; Segata, N.; et al. Distinct Polysaccharide Utilization Profiles of Human Intestinal Prevotella copri Isolates. Cell Host Microbe 2019, 26, 680–690.e685. [Google Scholar] [CrossRef]
  39. Mills, E.; O’Neill, L.A. Succinate: A metabolic signal in inflammation. Trends Cell Biol. 2014, 24, 313–320. [Google Scholar] [CrossRef]
  40. Huang, Z.; Rose, A.H.; Hoffmann, P.R. The role of selenium in inflammation and immunity: From molecular mechanisms to therapeutic opportunities. Antioxid. Redox Signal. 2012, 16, 705–743. [Google Scholar] [CrossRef]
  41. Avery, J.C.; Hoffmann, P.R. Selenium, Selenoproteins, and Immunity. Nutrients 2018, 10, 1203. [Google Scholar] [CrossRef] [PubMed]
  42. Zhang, J.; Liu, X.; Su, Y.; Li, T. An update on T2-toxins: Metabolism, immunotoxicity mechanism and human assessment exposure of intestinal microbiota. Heliyon 2022, 8, e10012. [Google Scholar] [CrossRef] [PubMed]
  43. Ahlawat, S.; Asha; Sharma, K.K. Gut-organ axis: A microbial outreach and networking. Lett. Appl. Microbiol. 2021, 72, 636–668. [Google Scholar] [CrossRef] [PubMed]
  44. Chee, W.J.Y.; Chew, S.Y.; Than, L.T.L. Vaginal microbiota and the potential of Lactobacillus derivatives in maintaining vaginal health. Microb. Cell Fact. 2020, 19, 203. [Google Scholar] [CrossRef]
  45. Lee, S.H.; Kwon, J.Y.; Jhun, J.; Jung, K.; Park, S.H.; Yang, C.W.; Cho, Y.; Kim, S.J.; Cho, M.L. Lactobacillus acidophilus ameliorates pain and cartilage degradation in experimental osteoarthritis. Immunol. Lett. 2018, 203, 6–14. [Google Scholar] [CrossRef] [PubMed]
  46. Lei, M.; Guo, C.; Wang, D.; Zhang, C.; Hua, L. The effect of probiotic Lactobacillus casei Shirota on knee osteoarthritis: A randomised double-blind, placebo-controlled clinical trial. Benef. Microbes 2017, 8, 697–703. [Google Scholar] [CrossRef]
  47. Mizrahi, I.; Wallace, R.J.; Moraïs, S. The rumen microbiome: Balancing food security and environmental impacts. Nat. Rev. Microbiol. 2021, 19, 553–566. [Google Scholar] [CrossRef]
  48. Crost, E.H.; Coletto, E.; Bell, A.; Juge, N. Ruminococcus gnavus: Friend or foe for human health. FEMS Microbiol. Rev. 2023, 47, fuad014. [Google Scholar] [CrossRef]
  49. Zhou, X.; Yang, H.; Guan, F.; Xue, S.; Song, D.; Chen, J.; Wang, Z. T-2 Toxin Alters the Levels of Collagen II and Its Regulatory Enzymes MMPs/TIMP-1 in a Low-Selenium Rat Model of Kashin-Beck Disease. Biol. Trace Elem. Res. 2016, 169, 237–246. [Google Scholar] [CrossRef]
  50. Wu, G.D.; Chen, J.; Hoffmann, C.; Bittinger, K.; Chen, Y.Y.; Keilbaugh, S.A.; Bewtra, M.; Knights, D.; Walters, W.A.; Knight, R.; et al. Linking long-term dietary patterns with gut microbial enterotypes. Science 2011, 334, 105–108. [Google Scholar] [CrossRef]
  51. Ferreira, R.L.U.; Sena-Evangelista, K.C.M.; de Azevedo, E.P.; Pinheiro, F.I.; Cobucci, R.N.; Pedrosa, L.F.C. Selenium in Human Health and Gut Microflora: Bioavailability of Selenocompounds and Relationship With Diseases. Front. Nutr. 2021, 8, 685317. [Google Scholar] [CrossRef] [PubMed]
  52. Qiao, L.; Zhang, X.; Pi, S.; Chang, J.; Dou, X.; Yan, S.; Song, X.; Chen, Y.; Zeng, X.; Zhu, L.; et al. Dietary supplementation with biogenic selenium nanoparticles alleviate oxidative stress-induced intestinal barrier dysfunction. NPJ Sci. Food 2022, 6, 30. [Google Scholar] [CrossRef] [PubMed]
Figure 1. The articular cartilage of the rat knee joint stained with safranin fast green. NC, normal control group; SD, Se-deficient group; T-2, T-2 toxin exposure group.
Nutrients 15 05027 g001
Figure 2. (a) Species diversity differences between the SD and NC groups were estimated by the observed species, Shannon, Simpson, and Chao1 indices. SD, the Se deficiency group; NC, the negative control group; (b) principal coordinate analysis (PCoA) of the gut microbiota based on the unweighted (ANOSIM, p = 0.051) UniFrac distance matrices for the SD and NC groups; (c) bar chart of species abundance at the phylum level in the SD group and NC group; n = 6 for the SD group and n = 6 for the NC group.
Nutrients 15 05027 g002
Figure 3. (a) Circos plot of species abundance at the genus level in the SD group and the NC group; SD, the Se deficiency group; NC, the negative control group; (b) Analysis of Species significant differences at the genus level in the SD group and the NC group. The black dot on each column indicates that one of the samples in the group has a higher abundance value than the other samples.
Nutrients 15 05027 g003
Figure 4. (a) Species diversity differences between the T-2 and NC groups were estimated by the observed species, Shannon, Simpson, and Chao1 indices. T-2, the T-2 toxin exposure group; NC, the negative control group; (b) principal coordinate analysis (PCoA) of the gut microbiota based on the unweighted (ANOSIM, p = 0.007) UniFrac distance matrices for the T-2 and NC groups; (c) bar chart of species abundance at the phylum level in the T-2 group and NC group; n = 6 for the T-2 group and n = 6 for the NC group.
Nutrients 15 05027 g004
Figure 5. (a) Circos plot of species abundance at the genus level in the T-2 group and the NC group; T-2, the T-2 toxin exposure group; NC, the negative control group; (b) significantly different species with LDA > 3 in the linear discriminant analysis effect size (LEfSe); the threshold of LEfSe analysis was set as LDA > 3, p < 0.05.
Nutrients 15 05027 g005
Table 1. The relative abundance of species in the SD and T-2 groups at the phylum and genus level.
SDT-2
Phylum
Firmicutes81.39%77.06%
Bacteroidetes11.11%14.85%
Proteobacteria4.17%3.95%
Actinobacteria0.70%0.50%
Verrucomicrobia0.36%1.81%
Genus
Ruminococcus_112.62%4.58%
Ruminococcaceae_UCG-00510.31%10.75%
Ruminiclostridium_98.26%4.74%
Lactobacillus2.82%11.71%
Muribaculaceae_unclassified5.16%9.26%
Firmicutes_unclassified7.55%8.95%
Phylum means the relative abundance of species in the SD and T-2 groups at the phylum level. Genus means the relative abundance of species in the SD and T-2 groups at the genus level.
Table 2. Comparison of the differences in the microbiota between SD group and T-2 group at the genus level.
SDT-2
(A) *
WeissellaUp (3.45)up (3.06)
Acetivibrioup (2.89)up (5.30)
Pseudoflavonifractorup (3.49)up (4.61)
Acetanaerobacteriumdown (−2.93)down (−Inf)
(B) **
Morganella (Inf)Veillonella (2.03)
Globicatella (2.46)Ruminococcaceae_UCG-011 (Inf)
Duncaniella (Inf)Eubacterium_xylanophilum_group (1.98)
Oscillospira (3.05)Phascolarctobacterium (0.49)
(C) ***
Lachnoanaerobaculum (−4.49)Hydrogenoanaerobacterium (-Inf)
Barnesiellaceae_unclassified (−3.11)Rikenella (−3.98)
Lachnoclostridium (−1.44)Phocea (−5.03)
Aerococcus (−4.86)
DTU014_unclassified (−3.49)
Erysipelatoclostridium (−1.69)
Faecalitalea (−3.30)
* Means the same significantly different species and abundance value (Log2FC). ** Means the significantly different species and abundance value (Log2FC) with increased levels. *** Means the significantly different species and abundance value (Log2FC) with decreased levels.
Disclaimer/Publisher’s Note: The statements, opinions and data contained in all publications are solely those of the individual author(s) and contributor(s) and not of MDPI and/or the editor(s). MDPI and/or the editor(s) disclaim responsibility for any injury to people or property resulting from any ideas, methods, instructions or products referred to in the content.

