
Association between the Suita Score and Body Composition in Japanese Adults: A Large Cross-Sectional Study

 , ,
, , 
Abstract
:1. Introduction
2. Patients and Methods
2.1. Patients and Body Composition Analysis
2.2. The Suita Score
2.3. Our Study
2.4. Statistics
3. Results
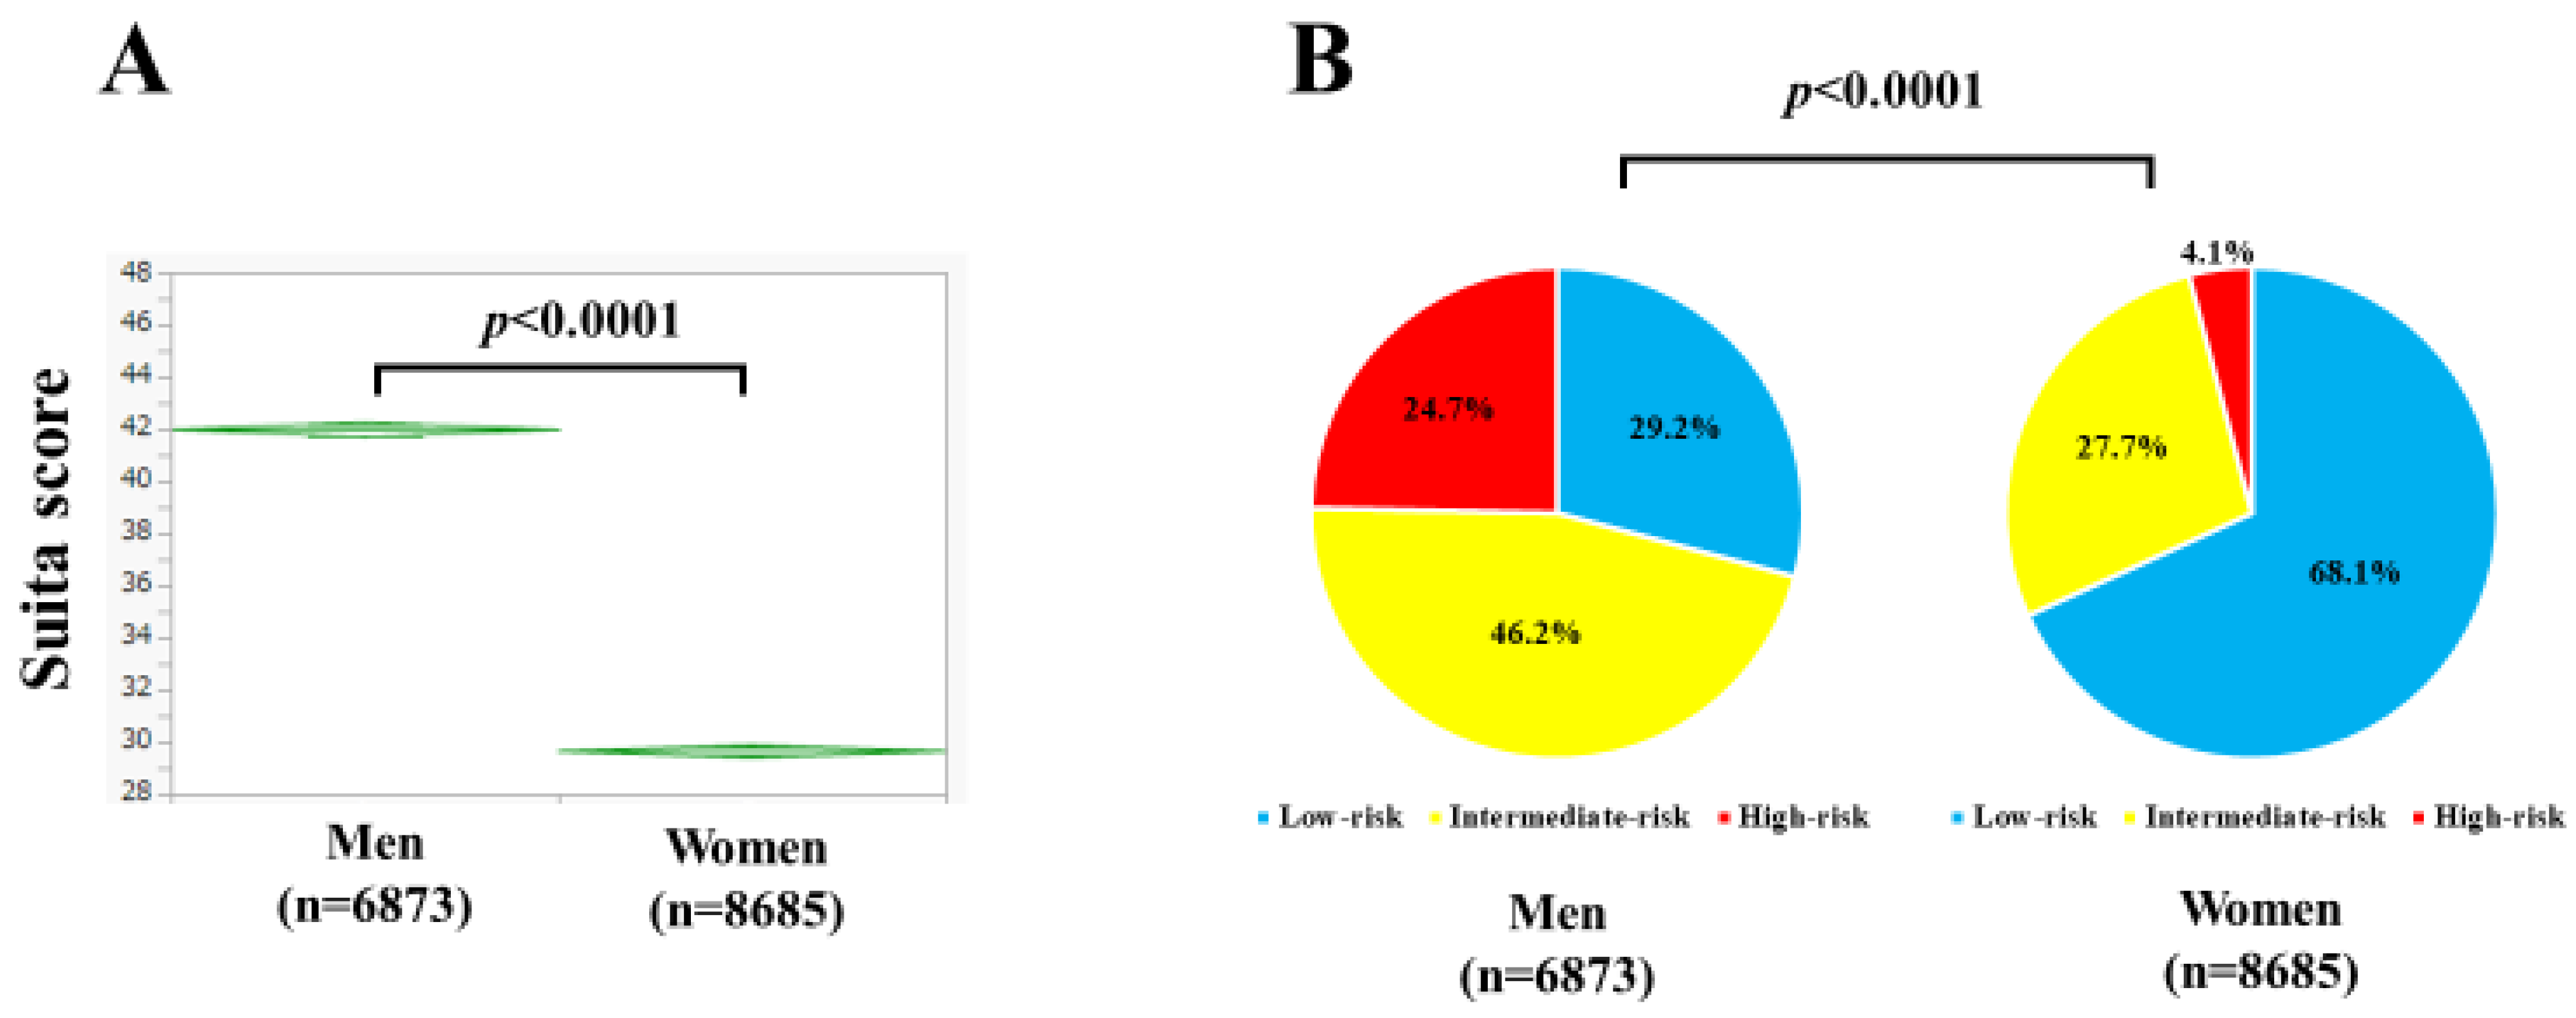
3.1. Baseline Characteristics
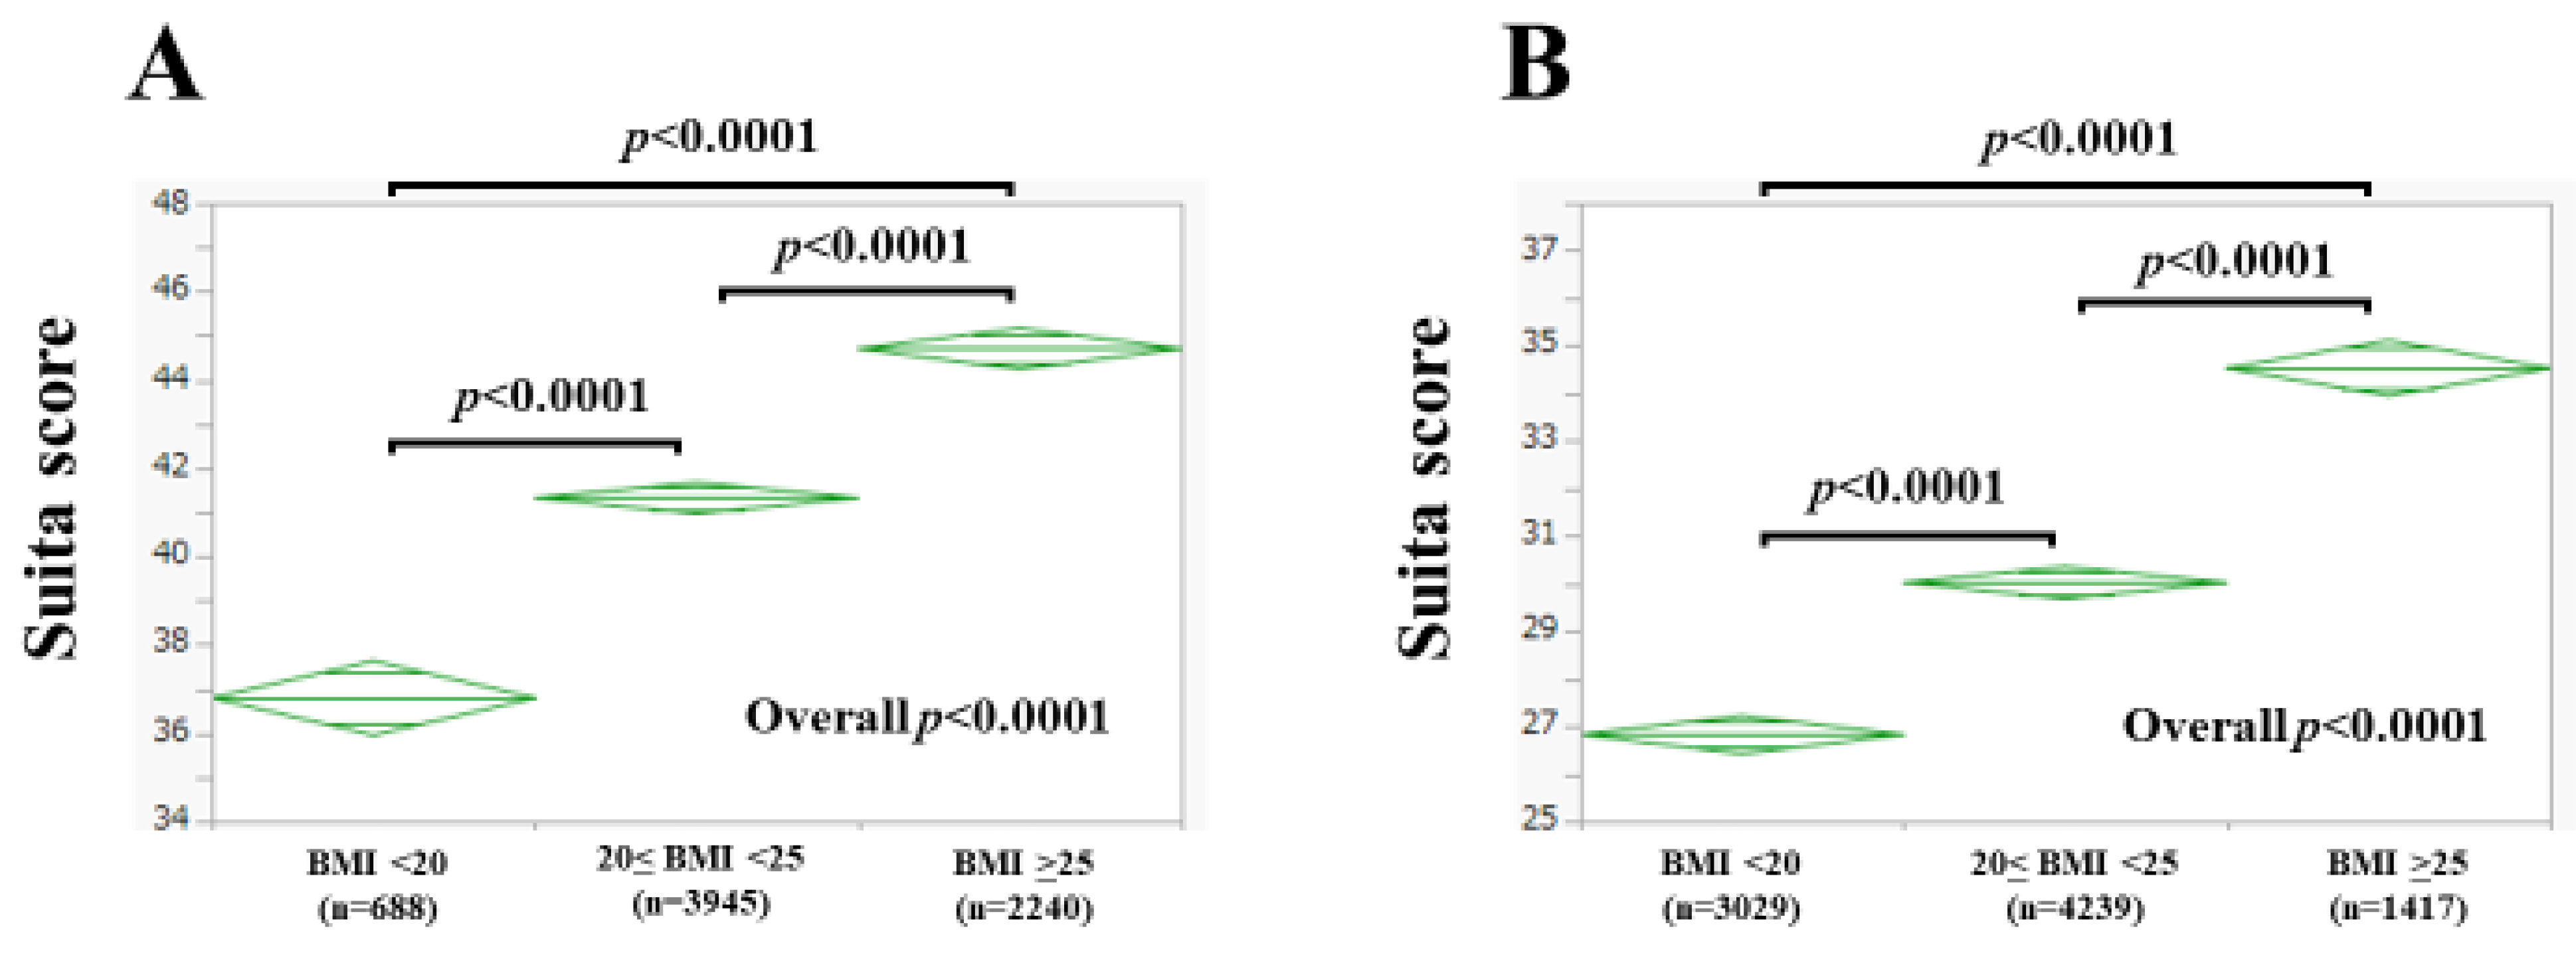
3.2. The Suita Score According to BMI
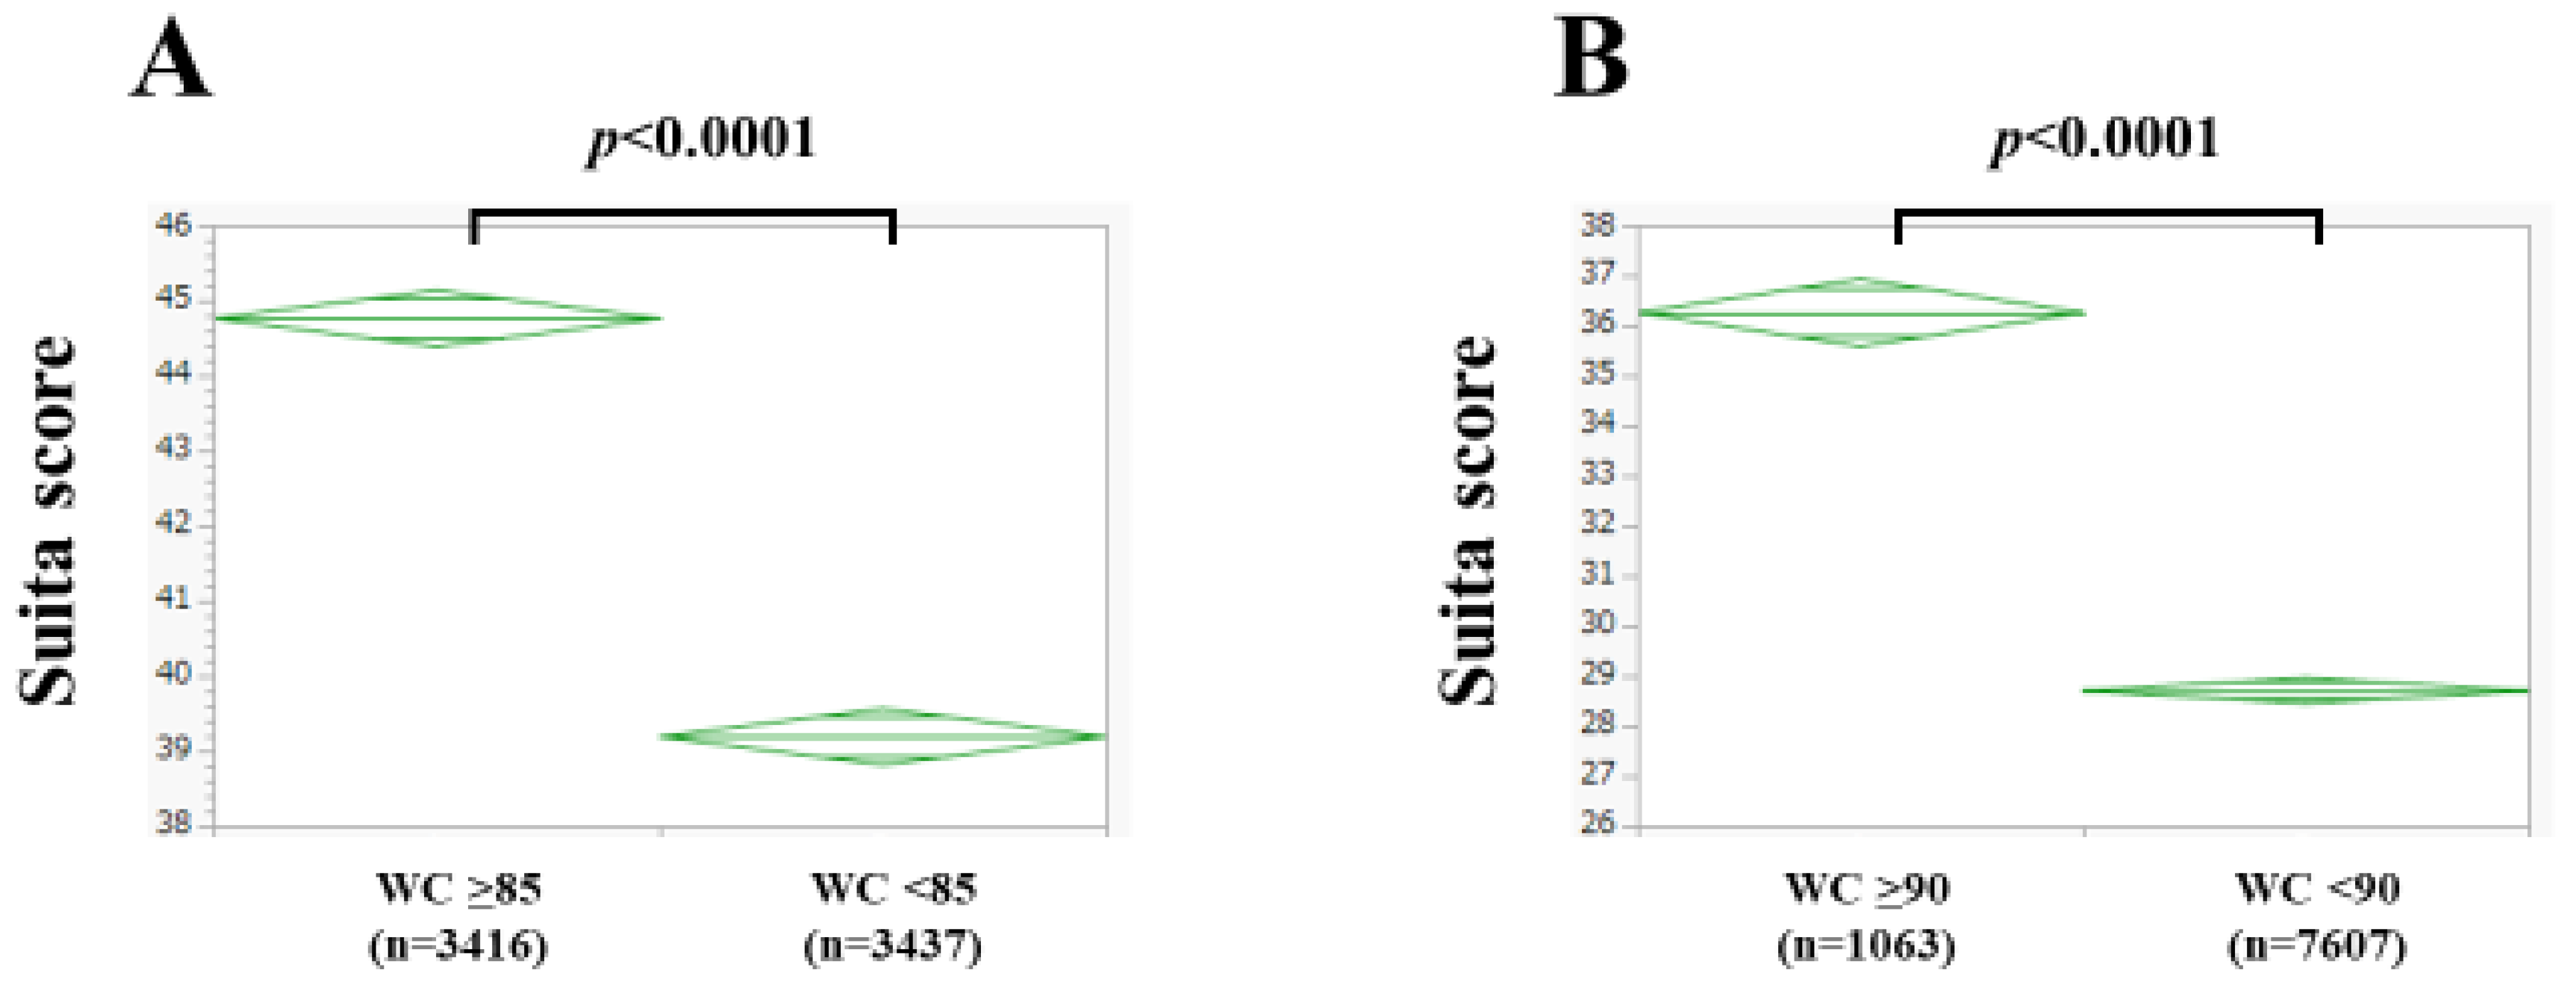
3.3. The Suita Score According to Waist Circumference
3.4. Body Composition as Assessed by the BIA and Risk Classification of the Suita Score
3.5. Multivariate Analyses of Six Body Composition–Related Covariates Linked to the Suita Score
4. Discussion
5. Conclusions
Author Contributions
Funding
Institutional Review Board Statement
Informed Consent Statement
Data Availability Statement
Acknowledgments
Conflicts of Interest
Abbreviations
References
- Nishimura, K.; Okamura, T.; Watanabe, M.; Nakai, M.; Takegami, M.; Higashiyama, A.; Kokubo, Y.; Okayama, A.; Miyamoto, Y. Predicting coronary heart disease using risk factor categories for a Japanese urban population, and comparison with the Framingham risk score: The Suita study. J. Atheroscler. Thromb. 2014, 21, 784–798, Erratum in J. Atheroscler. Thromb. 2016, 23, 1138–1139. [Google Scholar] [CrossRef] [PubMed]
- Chuang, A.M.; Nguyen, M.T.; Kung, W.M.; Lehman, S.; Chew, D.P. High-sensitivity troponin in chronic kidney disease: Considerations in myocardial infarction and beyond. Rev. Cardiovasc. Med. 2020, 21, 191–203. [Google Scholar] [PubMed]
- Lai, A.C.; Bienstock, S.W.; Sharma, R.; Skorecki, K.; Beerkens, F.; Samtani, R.; Coyle, A.; Kim, T.; Baber, U.; Camaj, A.; et al. A Personalized Approach to Chronic Kidney Disease and Cardiovascular Disease: JACC Review Topic of the Week. J. Am. Coll. Cardiol. 2021, 77, 1470–1479. [Google Scholar] [CrossRef]
- Gaziano, L.; Sun, L.; Arnold, M.; Bell, S.; Cho, K.; Kaptoge, S.K.; Song, R.J.; Burgess, S.; Posner, D.C.; Mosconi, K.; et al. Mild-to-Moderate Kidney Dysfunction and Cardiovascular Disease: Observational and Mendelian Randomization Analyses. Circulation 2022, 146, 1507–1517. [Google Scholar] [CrossRef]
- Miyamoto, Y.; Itaya, T.; Terasawa, Y.; Kohriyama, T. Association between the Suita Score and Stroke Recurrence in Patients with First-ever Ischemic Stroke: A Prospective Cohort Study. Intern. Med. 2022, 61, 773–780. [Google Scholar] [CrossRef]
- Bredella, M.A. Sex Differences in Body Composition. Adv. Exp. Med. Biol. 2017, 1043, 9–27. [Google Scholar] [PubMed]
- Lemos, T.; Gallagher, D. Current body composition measurement techniques. Curr. Opin Endocrinol. Diabetes Obes. 2017, 24, 310–314. [Google Scholar] [CrossRef]
- Konishi, M.; Akiyama, E.; Matsuzawa, Y.; Sato, R.; Kikuchi, S.; Nakahashi, H.; Maejima, N.; Iwahashi, N.; Kosuge, M.; Ebina, T.; et al. Prognostic impact of muscle and fat mass in patients with heart failure. J. Cachexia Sarcopenia Muscle 2021, 12, 568–576. [Google Scholar] [CrossRef]
- Sanchez, A.; Kissel, S.; Coletta, A.; Scott, J.; Furberg, H. Impact of body size and body composition on bladder cancer outcomes: Risk stratification and opportunity for novel interventions. Urol Oncol. 2020, 38, 713–718. [Google Scholar] [CrossRef]
- Yu, B.; Sun, Y.; Du, X.; Zhang, H.; Chen, C.; Tan, X.; Yang, Z.; Lu, Y.; Wang, N. Age-specific and sex-specific associations of visceral adipose tissue mass and fat-to-muscle mass ratio with risk of mortality. J. Cachexia Sarcopenia Muscle 2023, 14, 406–417. [Google Scholar] [CrossRef]
- Eun, Y.; Lee, S.N.; Song, S.W.; Kim, H.N.; Kim, S.H.; Lee, Y.A.; Kang, S.G.; Rho, J.S.; Yoo, K.D. Fat-to-muscle Ratio: A New Indicator for Coronary Artery Disease in Healthy Adults. Int. J. Med. Sci. 2021, 18, 3738–3743. [Google Scholar] [CrossRef] [PubMed]
- Elia, M. Body composition by whole-body bioelectrical impedance and prediction of clinically relevant outcomes: Overvalued or underused? Eur. J. Clin. Nutr. 2013, 67 (Suppl. 1), S60–S70. [Google Scholar] [CrossRef] [PubMed]
- Delgado, C.; Chiang, J.M.; Kittiskulnam, P.; Sheshadri, A.; Grimes, B.; Segal, M.; Kaysen, G.A.; Johansen, K.L. Longitudinal Assessment of Body Composition and Its Association With Survival Among Participants of the ACTIVE/ADIPOSE Study. J. Ren. Nutr. 2022, 32, 396–404. [Google Scholar] [CrossRef] [PubMed]
- Cruz-Jentoft, A.J.; Sayer, A.A. Sarcopenia. Lancet 2019, 393, 2636–2646. [Google Scholar] [CrossRef]
- Petermann-Rocha, F.; Balntzi, V.; Gray, S.R.; Lara, J.; Ho, F.K.; Pell, J.P.; Celis-Morales, C. Global prevalence of sarcopenia and severe sarcopenia: A systematic review and meta-analysis. J. Cachexia Sarcopenia Muscle 2022, 13, 86–99. [Google Scholar] [CrossRef]
- Batsis, J.A.; Villareal, D.T. Sarcopenic obesity in older adults: Aetiology, epidemiology and treatment strategies. Nat. Rev. Endocrinol. 2018, 14, 513–537. [Google Scholar] [CrossRef]
- Nishikawa, H.; Shiraki, M.; Hiramatsu, A.; Moriya, K.; Hino, K.; Nishiguchi, S. Japan Society of Hepatology guidelines for sarcopenia in liver disease (1st edition): Recommendation from the working group for creation of sarcopenia assessment criteria. Hepatol. Res. 2016, 46, 951–963. [Google Scholar] [CrossRef]
- Chen, K.C.; Jeng, Y.; Wu, W.T.; Wang, T.G.; Han, D.S.; Özçakar, L.; Chang, K.V. Sarcopenic Dysphagia: A Narrative Review from Diagnosis to Intervention. Nutrients 2021, 13, 4043. [Google Scholar] [CrossRef]
- Sato, S.; Miyazaki, S.; Tamaki, A.; Yoshimura, Y.; Arai, H.; Fujiwara, D.; Katsura, H.; Kawagoshi, A.; Kozu, R.; Maeda, K.; et al. Respiratory sarcopenia: A position paper by four professional organizations. Geriatr. Gerontol. Int. 2023, 23, 5–15. [Google Scholar] [CrossRef]
- Clynes, M.A.; Gregson, C.L.; Bruyère, O.; Cooper, C.; Dennison, E.M. Osteosarcopenia: Where osteoporosis and sarcopenia collide. Rheumatology 2021, 60, 529–537. [Google Scholar] [CrossRef]
- Available online: https://www.ncvc.go.jp/pr/release/006484/ (accessed on 10 October 2023).
- Yamagishi, K.; Iso, H. The criteria for metabolic syndrome and the national health screening and education system in Japan. Epidemiol. Health 2017, 39, e2017003. [Google Scholar] [CrossRef] [PubMed]
- Onishi, S.; Fukuda, A.; Matsui, M.; Ushiro, K.; Nishikawa, T.; Asai, A.; Kim, S.K.; Nishikawa, H. Nutrients. Body Composition Analysis in Patients with Metabolic Dysfunction-Associated Fatty Liver Disease. Nutrients 2023, 15, 3878. [Google Scholar] [CrossRef] [PubMed]
- Chumlea, W.C.; Schubert, C.M.; Sun, S.S.; Demerath, E.; Towne, B.; Siervogel, R.M. A review of body water status and the effects of age and body fatness in children and adults. J. Nutr. Health Aging 2007, 11, 111–118. [Google Scholar] [PubMed]
- Neeland, I.J.; Ross, R.; Després, J.P.; Matsuzawa, Y.; Yamashita, S.; Shai, I.; Seidell, J.; Magni, P.; Santos, R.D.; Arsenault, B.; et al. International Atherosclerosis Society; International Chair on Cardiometabolic Risk Working Group on Visceral Obesity. Visceral and ectopic fat, atherosclerosis, and cardiometabolic disease: A position statement. Lancet Diabetes Endocrinol. 2019, 7, 715–725. [Google Scholar] [CrossRef]
- Kim, J.E.; Kim, J.S.; Jo, M.J.; Cho, E.; Ahn, S.Y.; Kwon, Y.J.; Ko, G.J. The Roles and Associated Mechanisms of Adipokines in Development of Metabolic Syndrome. Molecules 2022, 27, 334. [Google Scholar] [CrossRef]
- Zhou, R.; Chen, H.W.; Lin, Y.; Li, F.R.; Zhong, Q.; Huang, Y.N.; Wu, X.B. Total and Regional Fat/Muscle Mass Ratio and Risks of Incident Cardiovascular Disease and Mortality. J. Am. Heart Assoc. 2023, 12, e030101. [Google Scholar] [CrossRef]
- Yu, P.C.; Hsu, C.C.; Lee, W.J.; Liang, C.K.; Chou, M.Y.; Lin, M.H.; Hsiao, F.Y.; Peng, L.N.; Chen, L.K. Muscle-to-fat ratio identifies functional impairments and cardiometabolic risk and predicts outcomes: Biomarkers of sarcopenic obesity. J. Cachexia Sarcopenia Muscle 2022, 13, 368–376. [Google Scholar] [CrossRef]
- Nishikawa, H.; Asai, A.; Fukunishi, S.; Nishiguchi, S.; Higuchi, K. Metabolic Syndrome and Sarcopenia. Nutrients 2021, 13, 3519. [Google Scholar] [CrossRef]
- Lim, H.; Son, K.; Lim, H. Association between Skeletal Muscle Mass-to-Visceral Fat Ratio and Dietary and Cardiometabolic Health Risk Factors among Korean Women with Obesity. Nutrients 2023, 15, 1574. [Google Scholar] [CrossRef]
- Loutradis, C.; Sarafidis, P.A.; Ferro, C.J.; Zoccali, C. Volume overload in hemodialysis: Diagnosis, cardiovascular consequences, and management. Nephrol. Dial. Transplant. 2021, 36, 2182–2193. [Google Scholar] [CrossRef]
- Romero-Corral, A.; Montori, V.M.; Somers, V.K.; Korinek, J.; Thomas, R.J.; Allison, T.G.; Mookadamm, F.; Lopez-Jimenez, F. Association of bodyweight with total mortality and with cardiovascular events in coronary artery disease: A systematic review of cohort studies. Lancet 2006, 368, 666–678. [Google Scholar] [CrossRef] [PubMed]


| Risk Factors | Category | Points |
|---|---|---|
| Age (years) | 35–44 | 30 |
| 45–54 | 38 | |
| 55–64 | 45 | |
| 65–69 | 51 | |
| 70 or older | 53 | |
| Gender | Men | 0 |
| Women | −7 | |
| Current smoker | Yes | 5 |
| No | 0 | |
| Diabetes | Yes | 6 |
| No | 0 | |
| Blood pressure | Optimal | −7 |
| Normal or high normal | 0 | |
| Hypertension (stage 1) | 4 | |
| Hypertension (stage 2 or higher) | 6 | |
| LDL (mg/dL) | less than 100 | 0 |
| 100–139 | 5 | |
| 140–159 | 7 | |
| 160–179 | 10 | |
| 180 or more | 11 | |
| HDL (mg/dL) | less than 40 | 0 |
| 40–59 | −5 | |
| 60 or more | −6 | |
| eGFR (mL/min/1.73 m2) | more than 60 | 0 |
| 30–60 | 3 | |
| less than 30 | 14 |
| Men (n = 6873) | Women (n = 8685) | p Value | |
|---|---|---|---|
| Age (years) | 54.8 ± 11.3 | 52.8 ± 10.0 | <0.0001 |
| Body mass index (kg/m2) | 23.9 ± 3.6 | 21.8 ± 3.7 | <0.0001 |
| Waist circumference (cm) | 85.8 ± 9.7 | 78.5 ± 9.9 | <0.0001 |
| Systolic blood pressure (mmHg) | 123.4 ± 16.8 | 116.4 ± 17.3 | <0.0001 |
| Diastolic blood pressure (mmHg) | 79.8 ± 12.3 | 72.6 ± 11.9 | <0.0001 |
| Diabetes mellitus, yes/no | 1282/5591 | 816/7869 | <0.0001 |
| Fasting blood sugar (mg/dL) | 96.7 ± 20.1 | 89.0 ± 12.9 | <0.0001 |
| White blood cell count (/μL) | 5622 ± 1520 | 5090 ± 1354 | <0.0001 |
| Hemoglobin (g/dL) | 14.9 ± 1.1 | 13.1 ± 1.1 | <0.0001 |
| Platelet count (×104/μL) | 24.4 ± 5.4 | 25.7 ± 6.2 | <0.0001 |
| Serum albumin (g/dL) | 4.37 ± 0.26 | 4.30 ± 0.24 | <0.0001 |
| AST (IU/L) | 24.3 ± 11.6 | 21.1 ± 8.1 | <0.0001 |
| ALT (IU/L) | 26.3 ± 18.4 | 17.6 ± 11.4 | <0.0001 |
| ALP (IU/L) | 69.0 ± 19.3 | 64.3 ± 19.9 | <0.0001 |
| GGT (IU/L) | 45.4 ± 51.3 | 23.8 ± 24.7 | <0.0001 |
| eGFR (mL/min/1.73 m2) | 70.2 ± 13.4 | 73.4 ± 13.2 | <0.0001 |
| Uric acid (mg/dL) | 6.2 ± 1.3 | 4.6 ± 1.0 | <0.0001 |
| HDL (mg/dL) | 62.9 ± 16.7 | 78.5 ± 18.2 | <0.0001 |
| LDL (mg/dL) | 121.6 ± 30.6 | 122.2 ± 30.4 | 0.1994 |
| Habitual smoking, yes/no | 1564/5309 | 551/8134 | <0.0001 |
| The Suita score | 42.0 ± 11.5 | 29.6 ± 11.5 | <0.0001 |
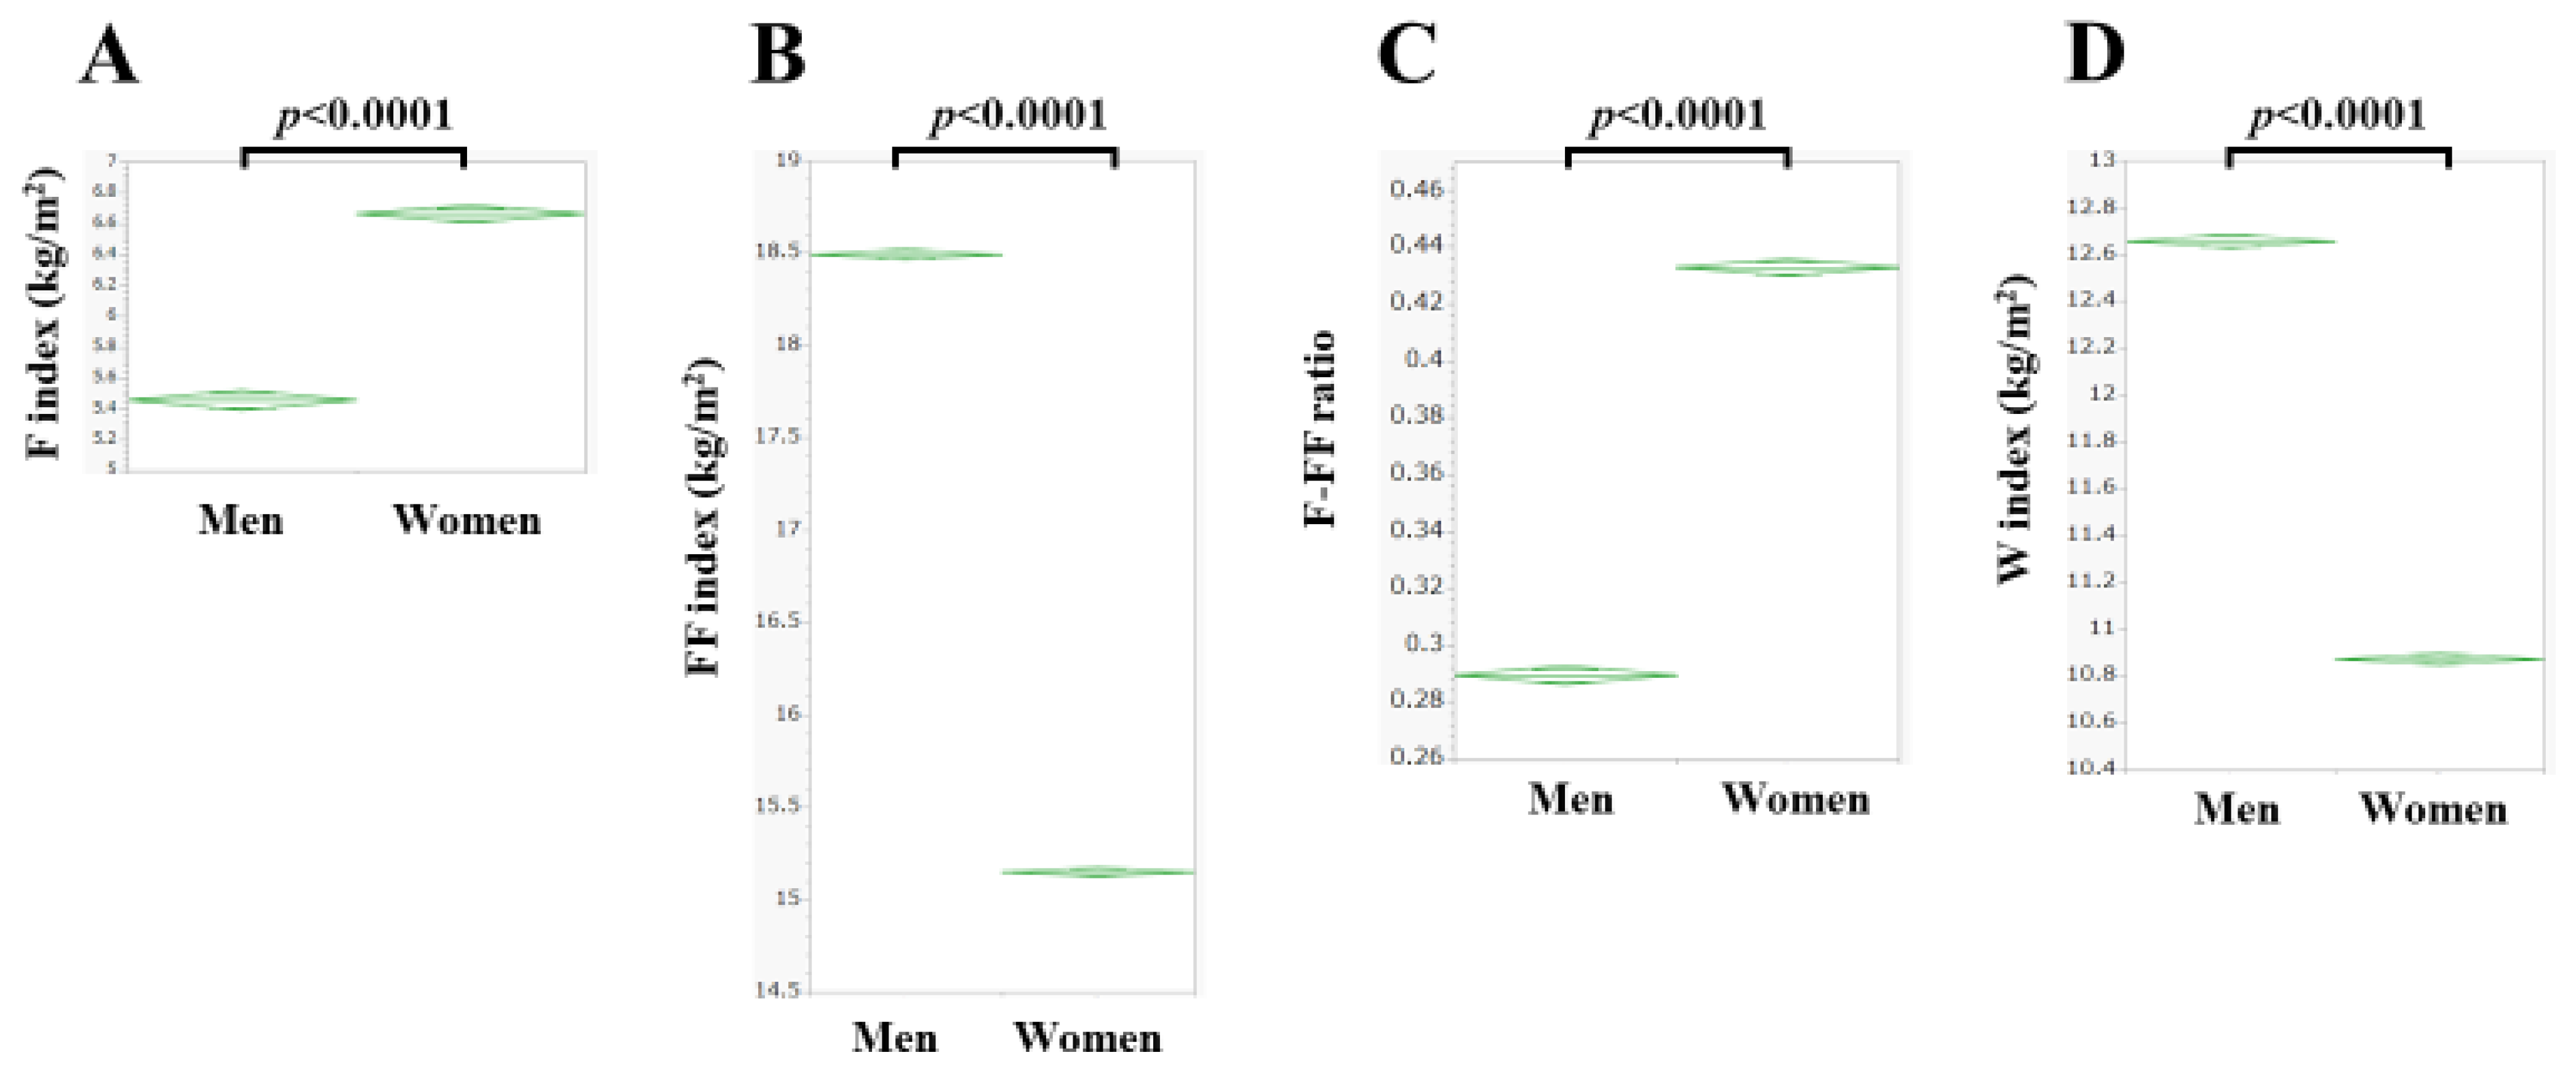
| Fat mass index (kg/m2) | 5.46 ± 2.35 | 6.66 ± 2.92 | <0.0001 |
| Fat-free mass index (kg/m2) | 18.49 ± 1.47 | 15.15 ± 0.98 | <0.0001 |
| F-FF ratio | 0.289 ± 0.104 | 0.433 ± 0.165 | <0.0001 |
| Water mass index (kg/m2) | 12.66 ± 1.34 | 10.87 ± 1.11 | <0.0001 |
| (A) | |||
|---|---|---|---|
| Men | Estimates | Standard Error | p Value |
| Body mass index | 0.0941 | 4.339 | 0.9827 |
| Waist circumference | 0.6478 | 0.0345 | <0.0001 |
| Fat mass index | −9.660 | 4.381 | 0.0275 |
| Fat-free mass index | −6.019 | 4.355 | 0.1670 |
| F-FF ratio | 204.573 | 11.852 | <0.0001 |
| Water index | 6.797 | 0.260 | <0.0001 |
| (B) | |||
| Women | Estimates | Standard Error | p Value |
| Body mass index | −4.312 | 3.797 | 0.2562 |
| Waist circumference | 0.8616 | 0.0267 | <0.0001 |
| Fat mass index | −0.9486 | 3.836 | 0.8047 |
| Fat-free mass index | −9.009 | 3.834 | 0.0188 |
| F-FF ratio | 43.844 | 9.076 | <0.0001 |
| Water index | 14.459 | 0.493 | <0.0001 |
Disclaimer/Publisher’s Note: The statements, opinions and data contained in all publications are solely those of the individual author(s) and contributor(s) and not of MDPI and/or the editor(s). MDPI and/or the editor(s) disclaim responsibility for any injury to people or property resulting from any ideas, methods, instructions or products referred to in the content. |
© 2023 by the authors. Licensee MDPI, Basel, Switzerland. This article is an open access article distributed under the terms and conditions of the Creative Commons Attribution (CC BY) license (https://creativecommons.org/licenses/by/4.0/).
Share and Cite
Onishi, S.; Fukuda, A.; Matsui, M.; Ushiro, K.; Nishikawa, T.; Asai, A.; Kim, S.K.; Nishikawa, H. Association between the Suita Score and Body Composition in Japanese Adults: A Large Cross-Sectional Study. Nutrients 2023, 15, 4816. https://doi.org/10.3390/nu15224816
Onishi S, Fukuda A, Matsui M, Ushiro K, Nishikawa T, Asai A, Kim SK, Nishikawa H. Association between the Suita Score and Body Composition in Japanese Adults: A Large Cross-Sectional Study. Nutrients. 2023; 15(22):4816. https://doi.org/10.3390/nu15224816
Chicago/Turabian StyleOnishi, Saori, Akira Fukuda, Masahiro Matsui, Kosuke Ushiro, Tomohiro Nishikawa, Akira Asai, Soo Ki Kim, and Hiroki Nishikawa. 2023. "Association between the Suita Score and Body Composition in Japanese Adults: A Large Cross-Sectional Study" Nutrients 15, no. 22: 4816. https://doi.org/10.3390/nu15224816
APA StyleOnishi, S., Fukuda, A., Matsui, M., Ushiro, K., Nishikawa, T., Asai, A., Kim, S. K., & Nishikawa, H. (2023). Association between the Suita Score and Body Composition in Japanese Adults: A Large Cross-Sectional Study. Nutrients, 15(22), 4816. https://doi.org/10.3390/nu15224816