
Review of Validated Methods to Evaluate Diet History in Diet Therapy and Counselling: An Overview and Analysis of Screeners Based on Food-Based Dietary Guidelines


Abstract
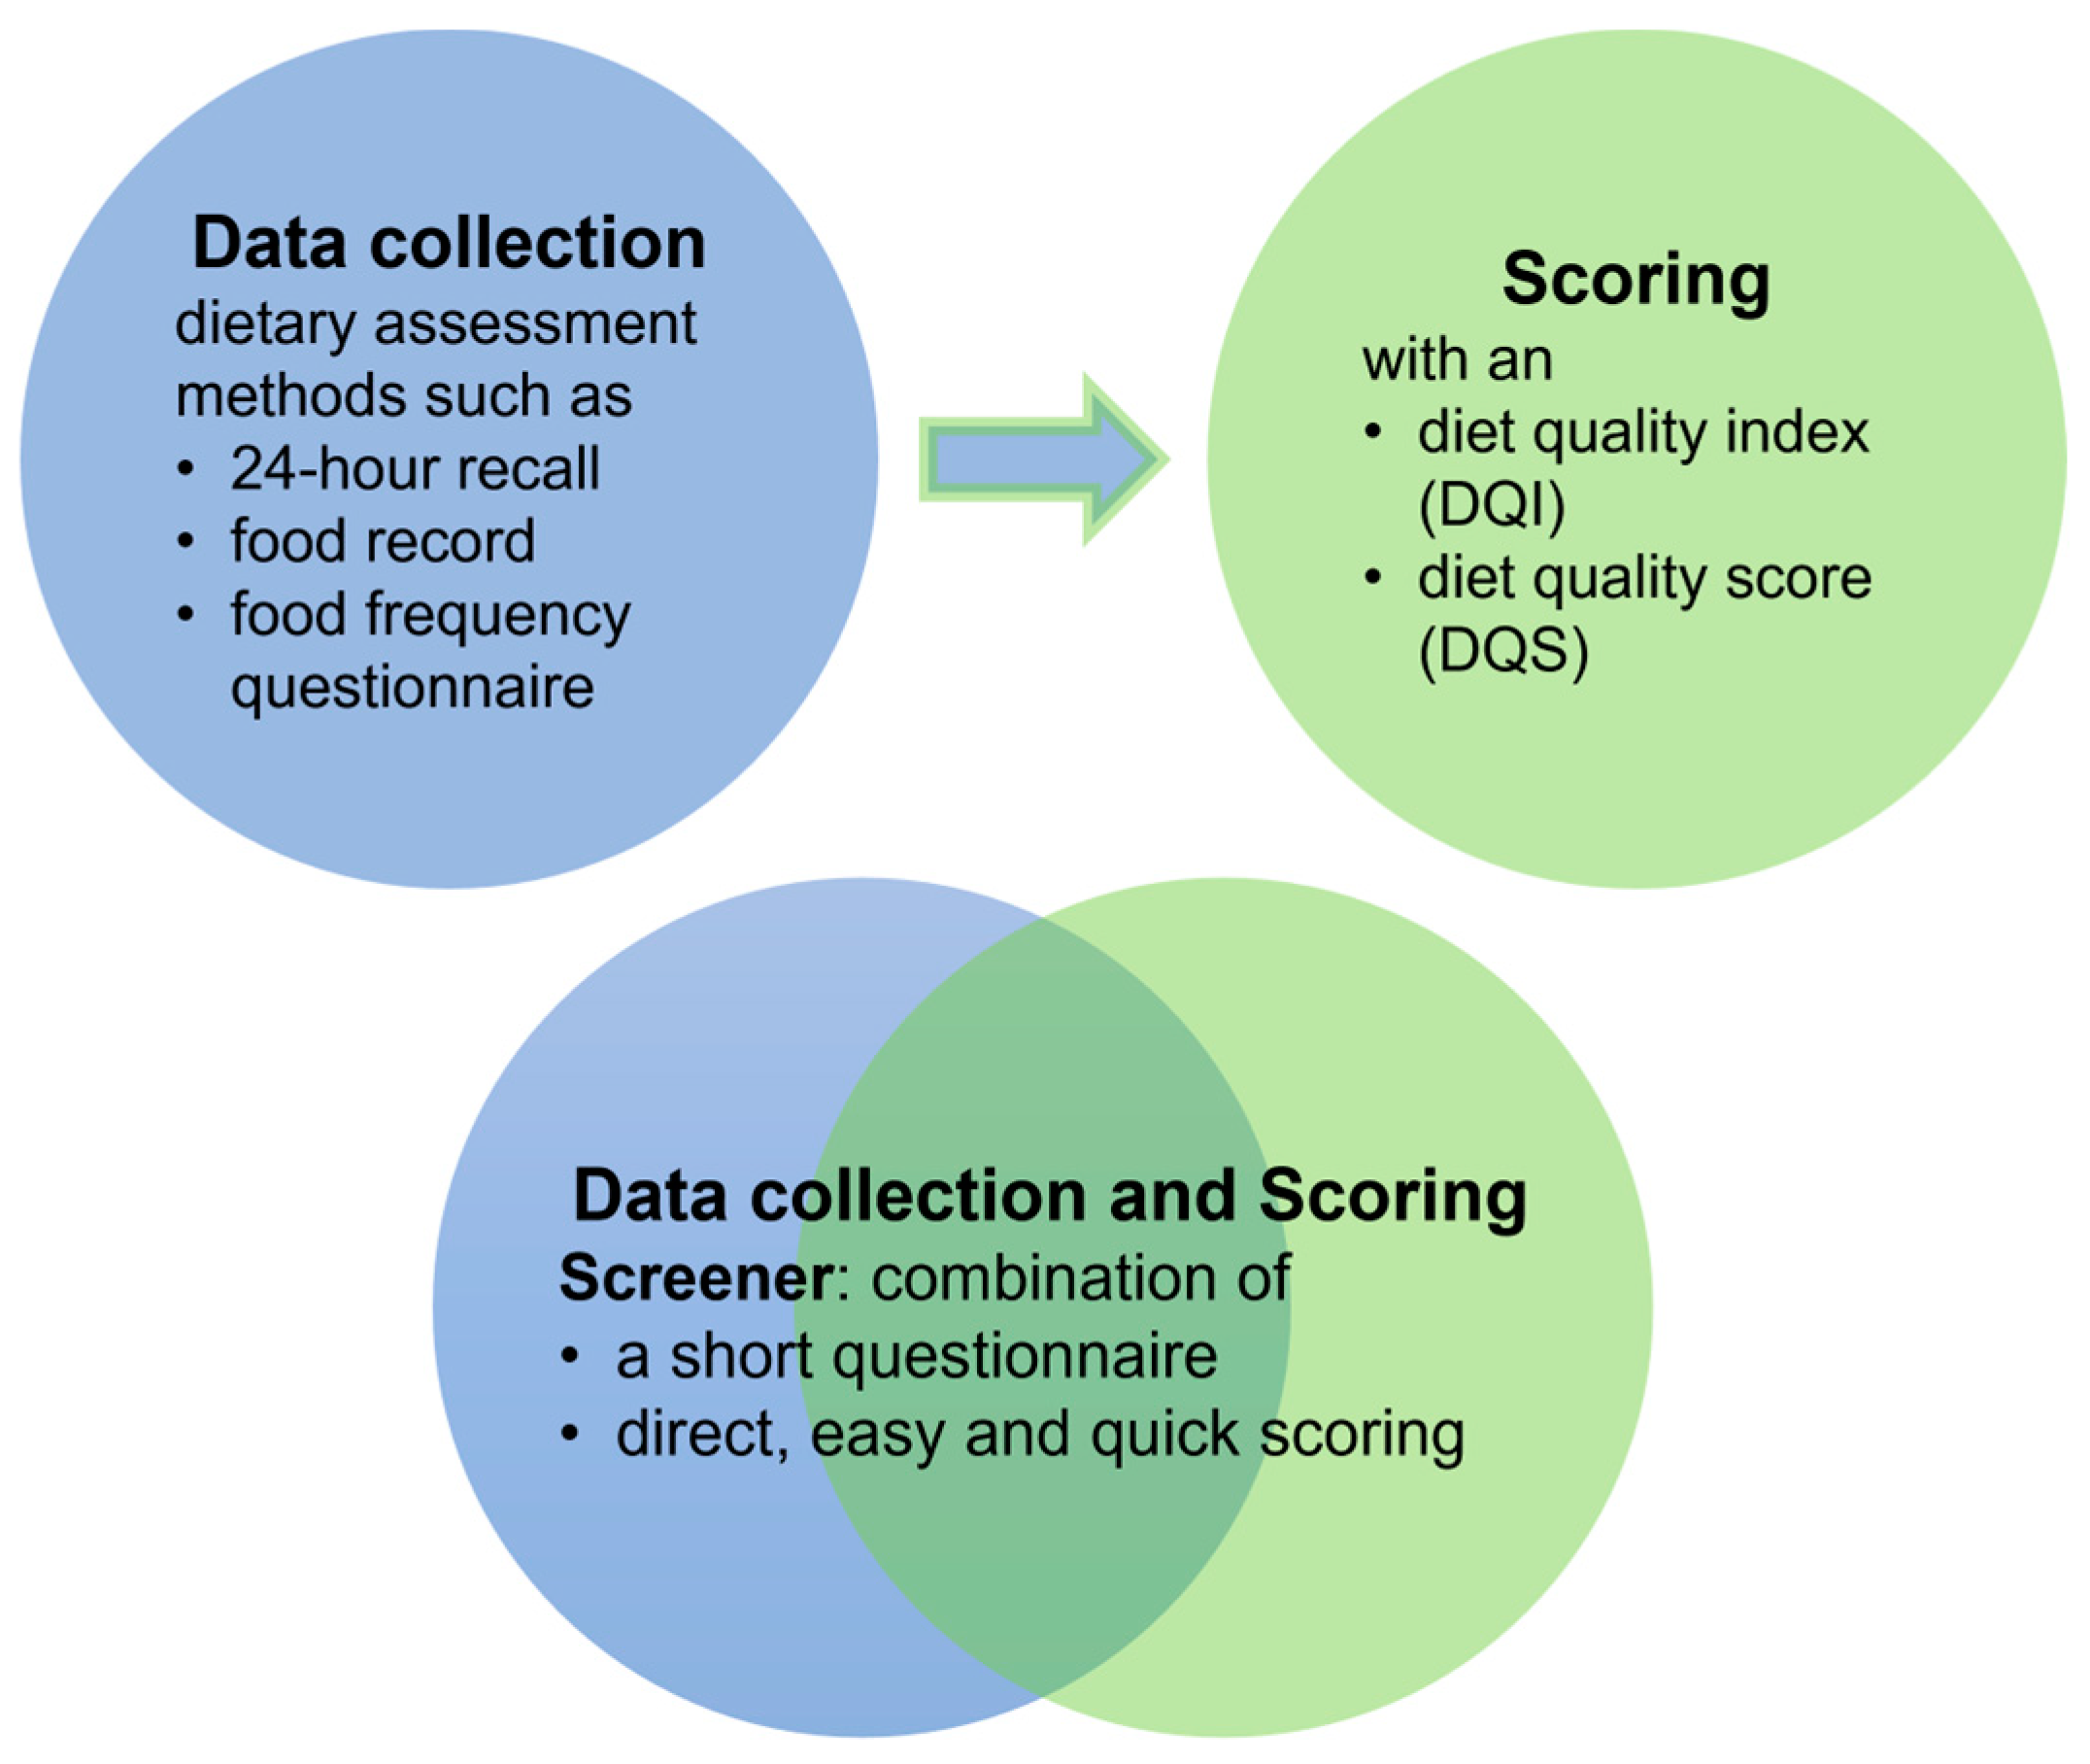
:1. Introduction
- Which screeners are available that assess diet quality based on national FBDGs? How are the screeners designed and which measurement properties are tested?
- What needs to be considered when developing a screener based on national FBDGs?
2. Materials and Methods
2.1. Literature Search and Selection Process
2.2. Data Analysis
3. Results
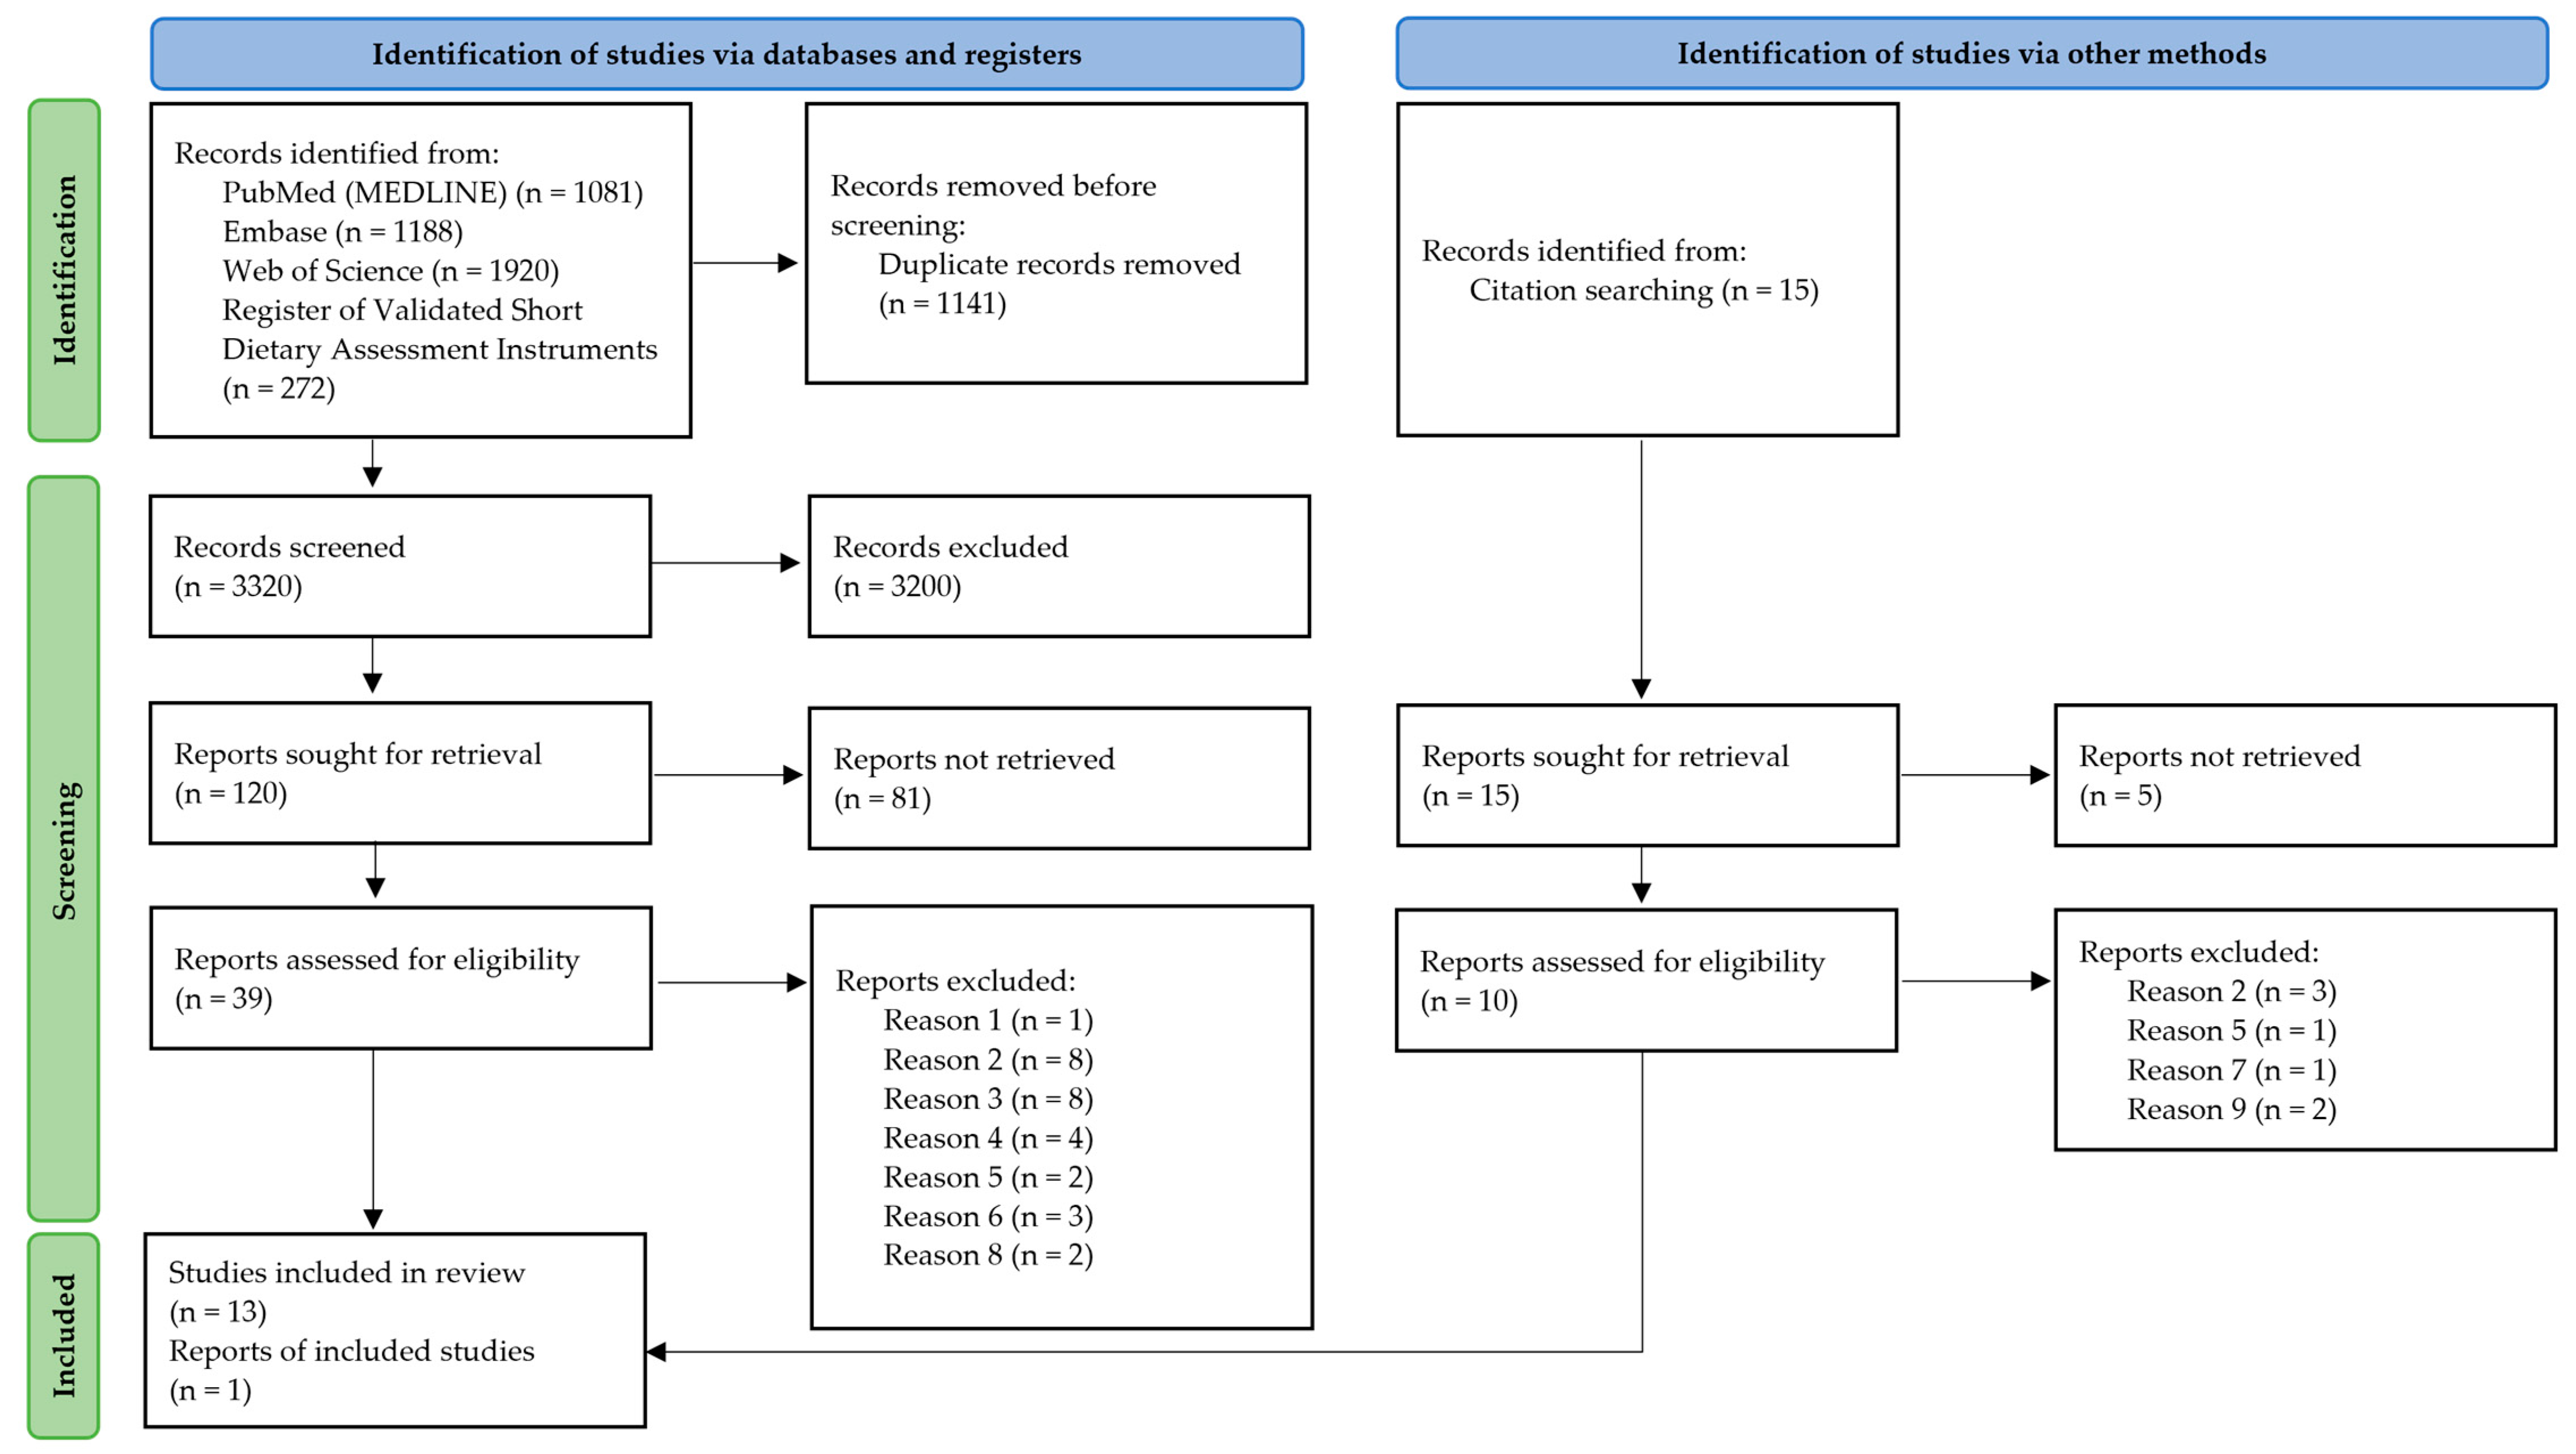
3.1. Study Selection
3.2. Characteristics of the Included Screeners
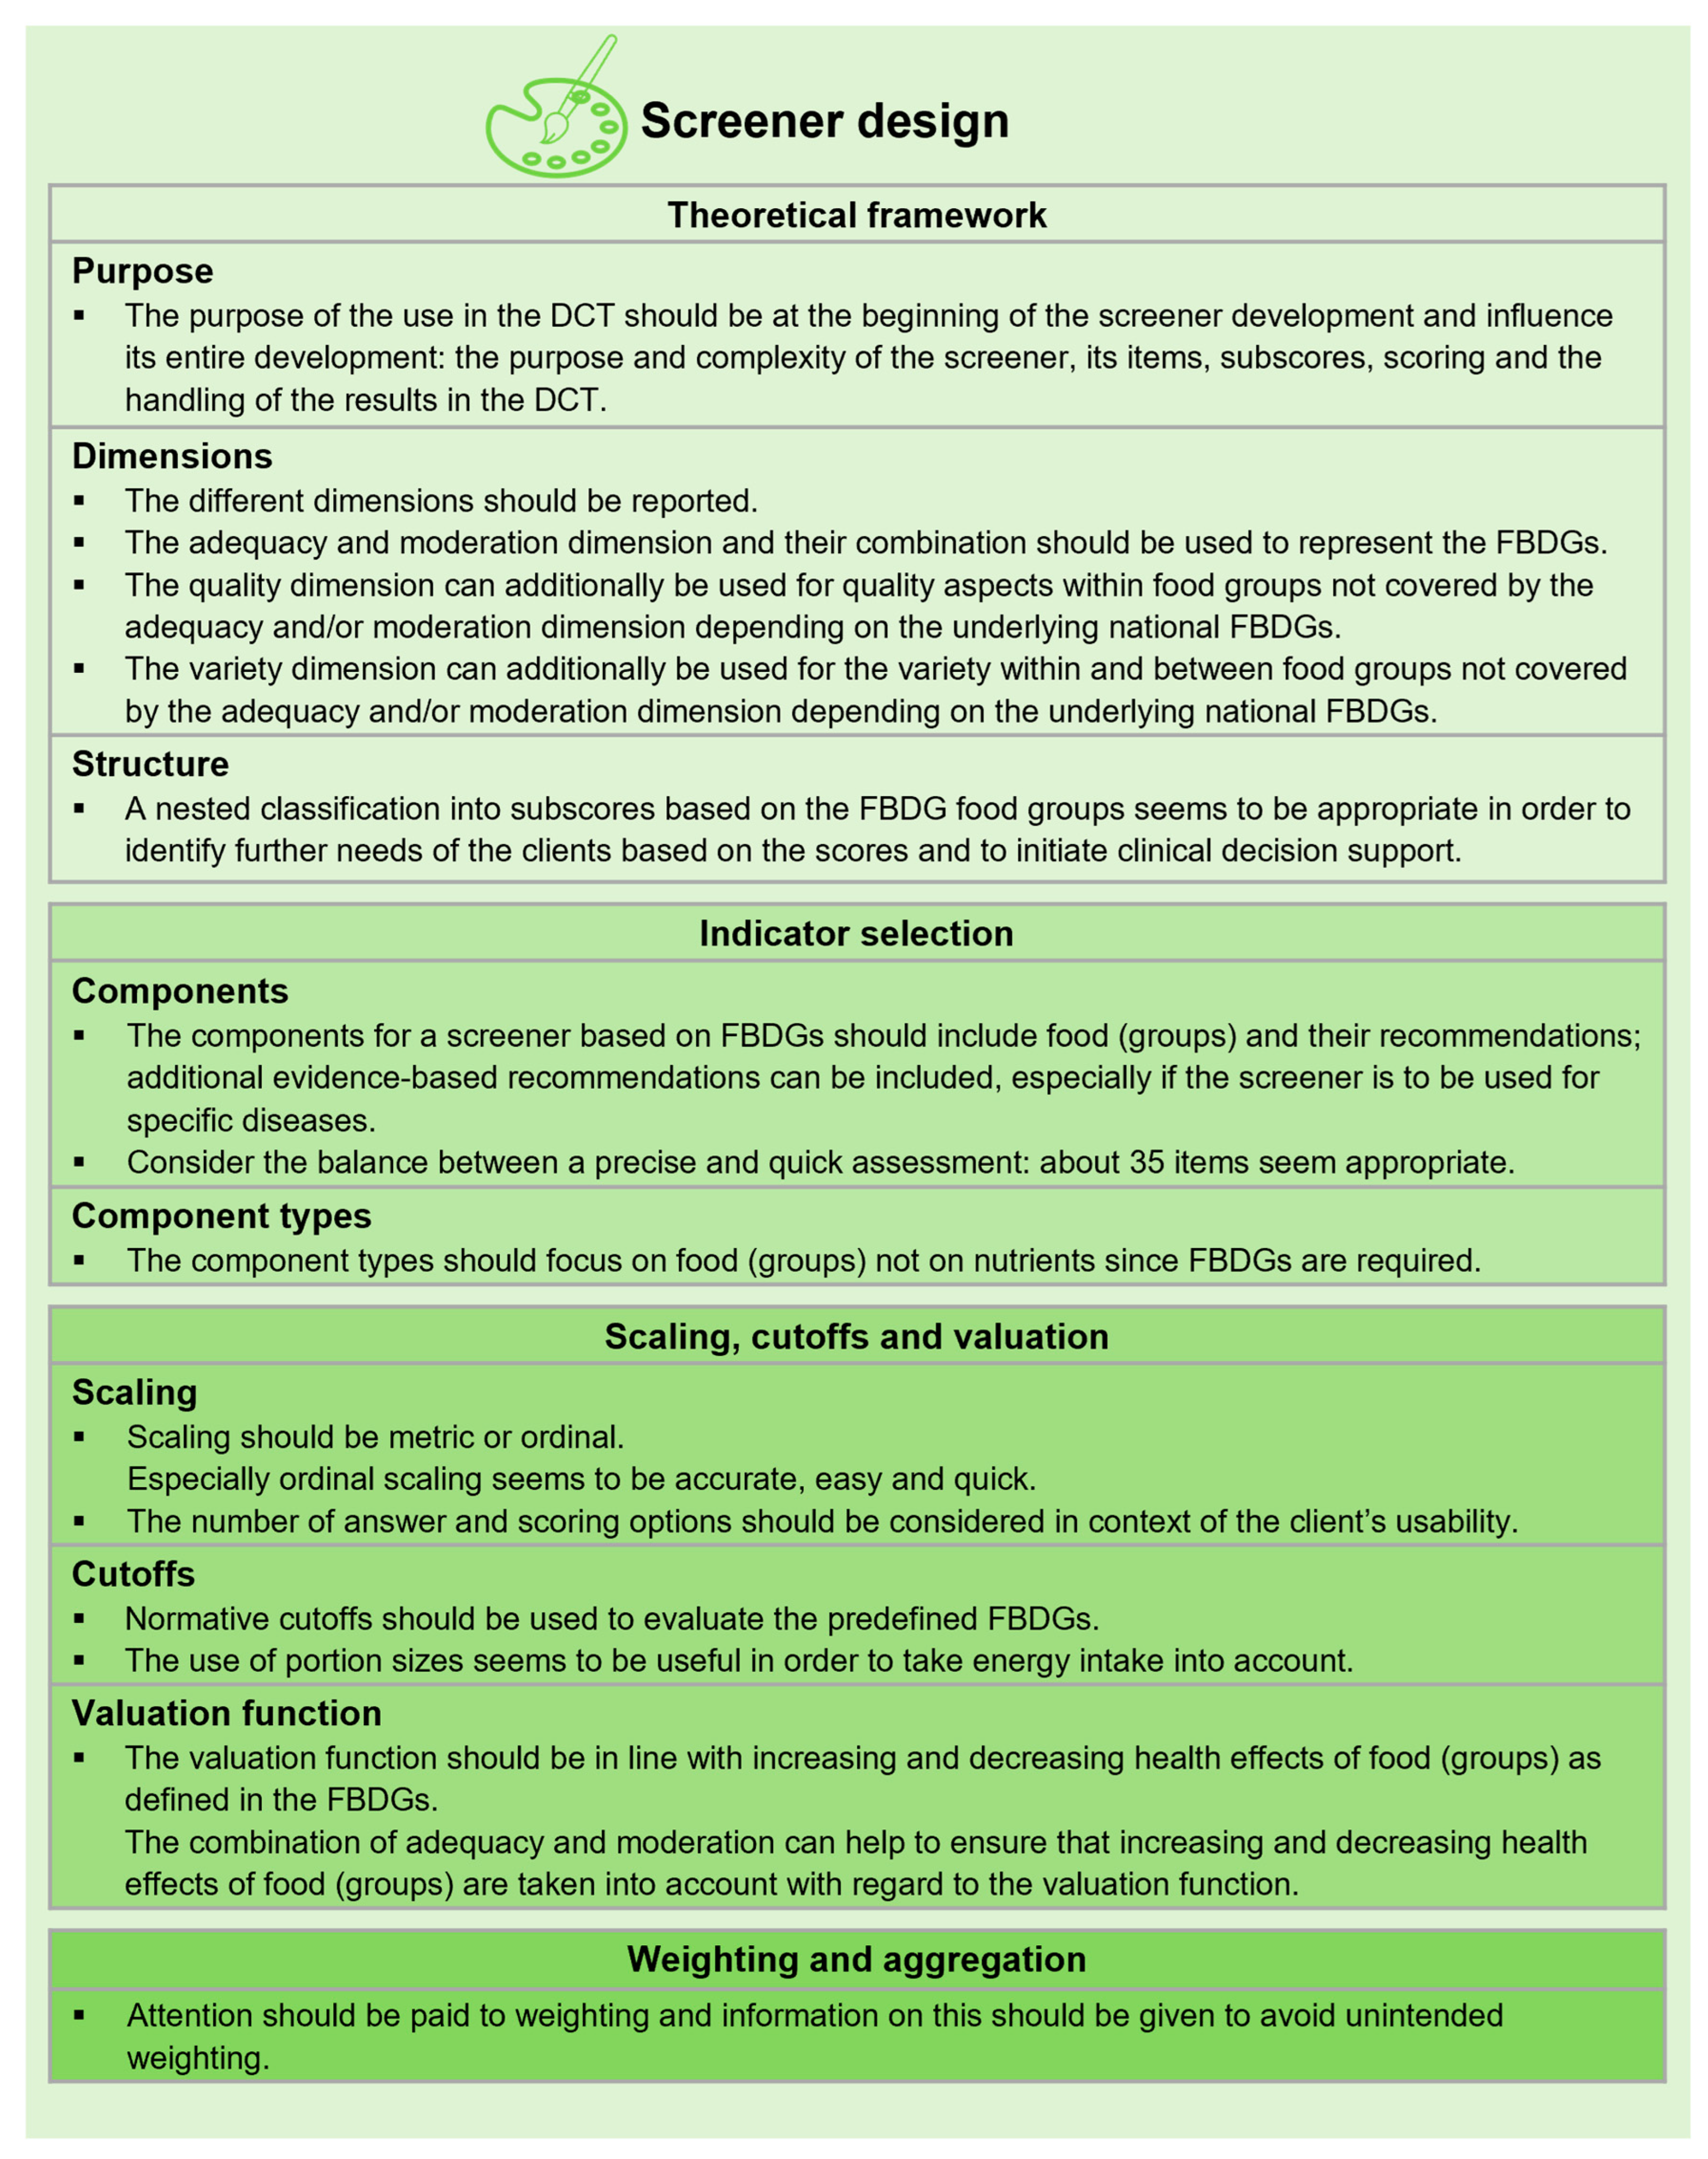
3.3. Screener Design
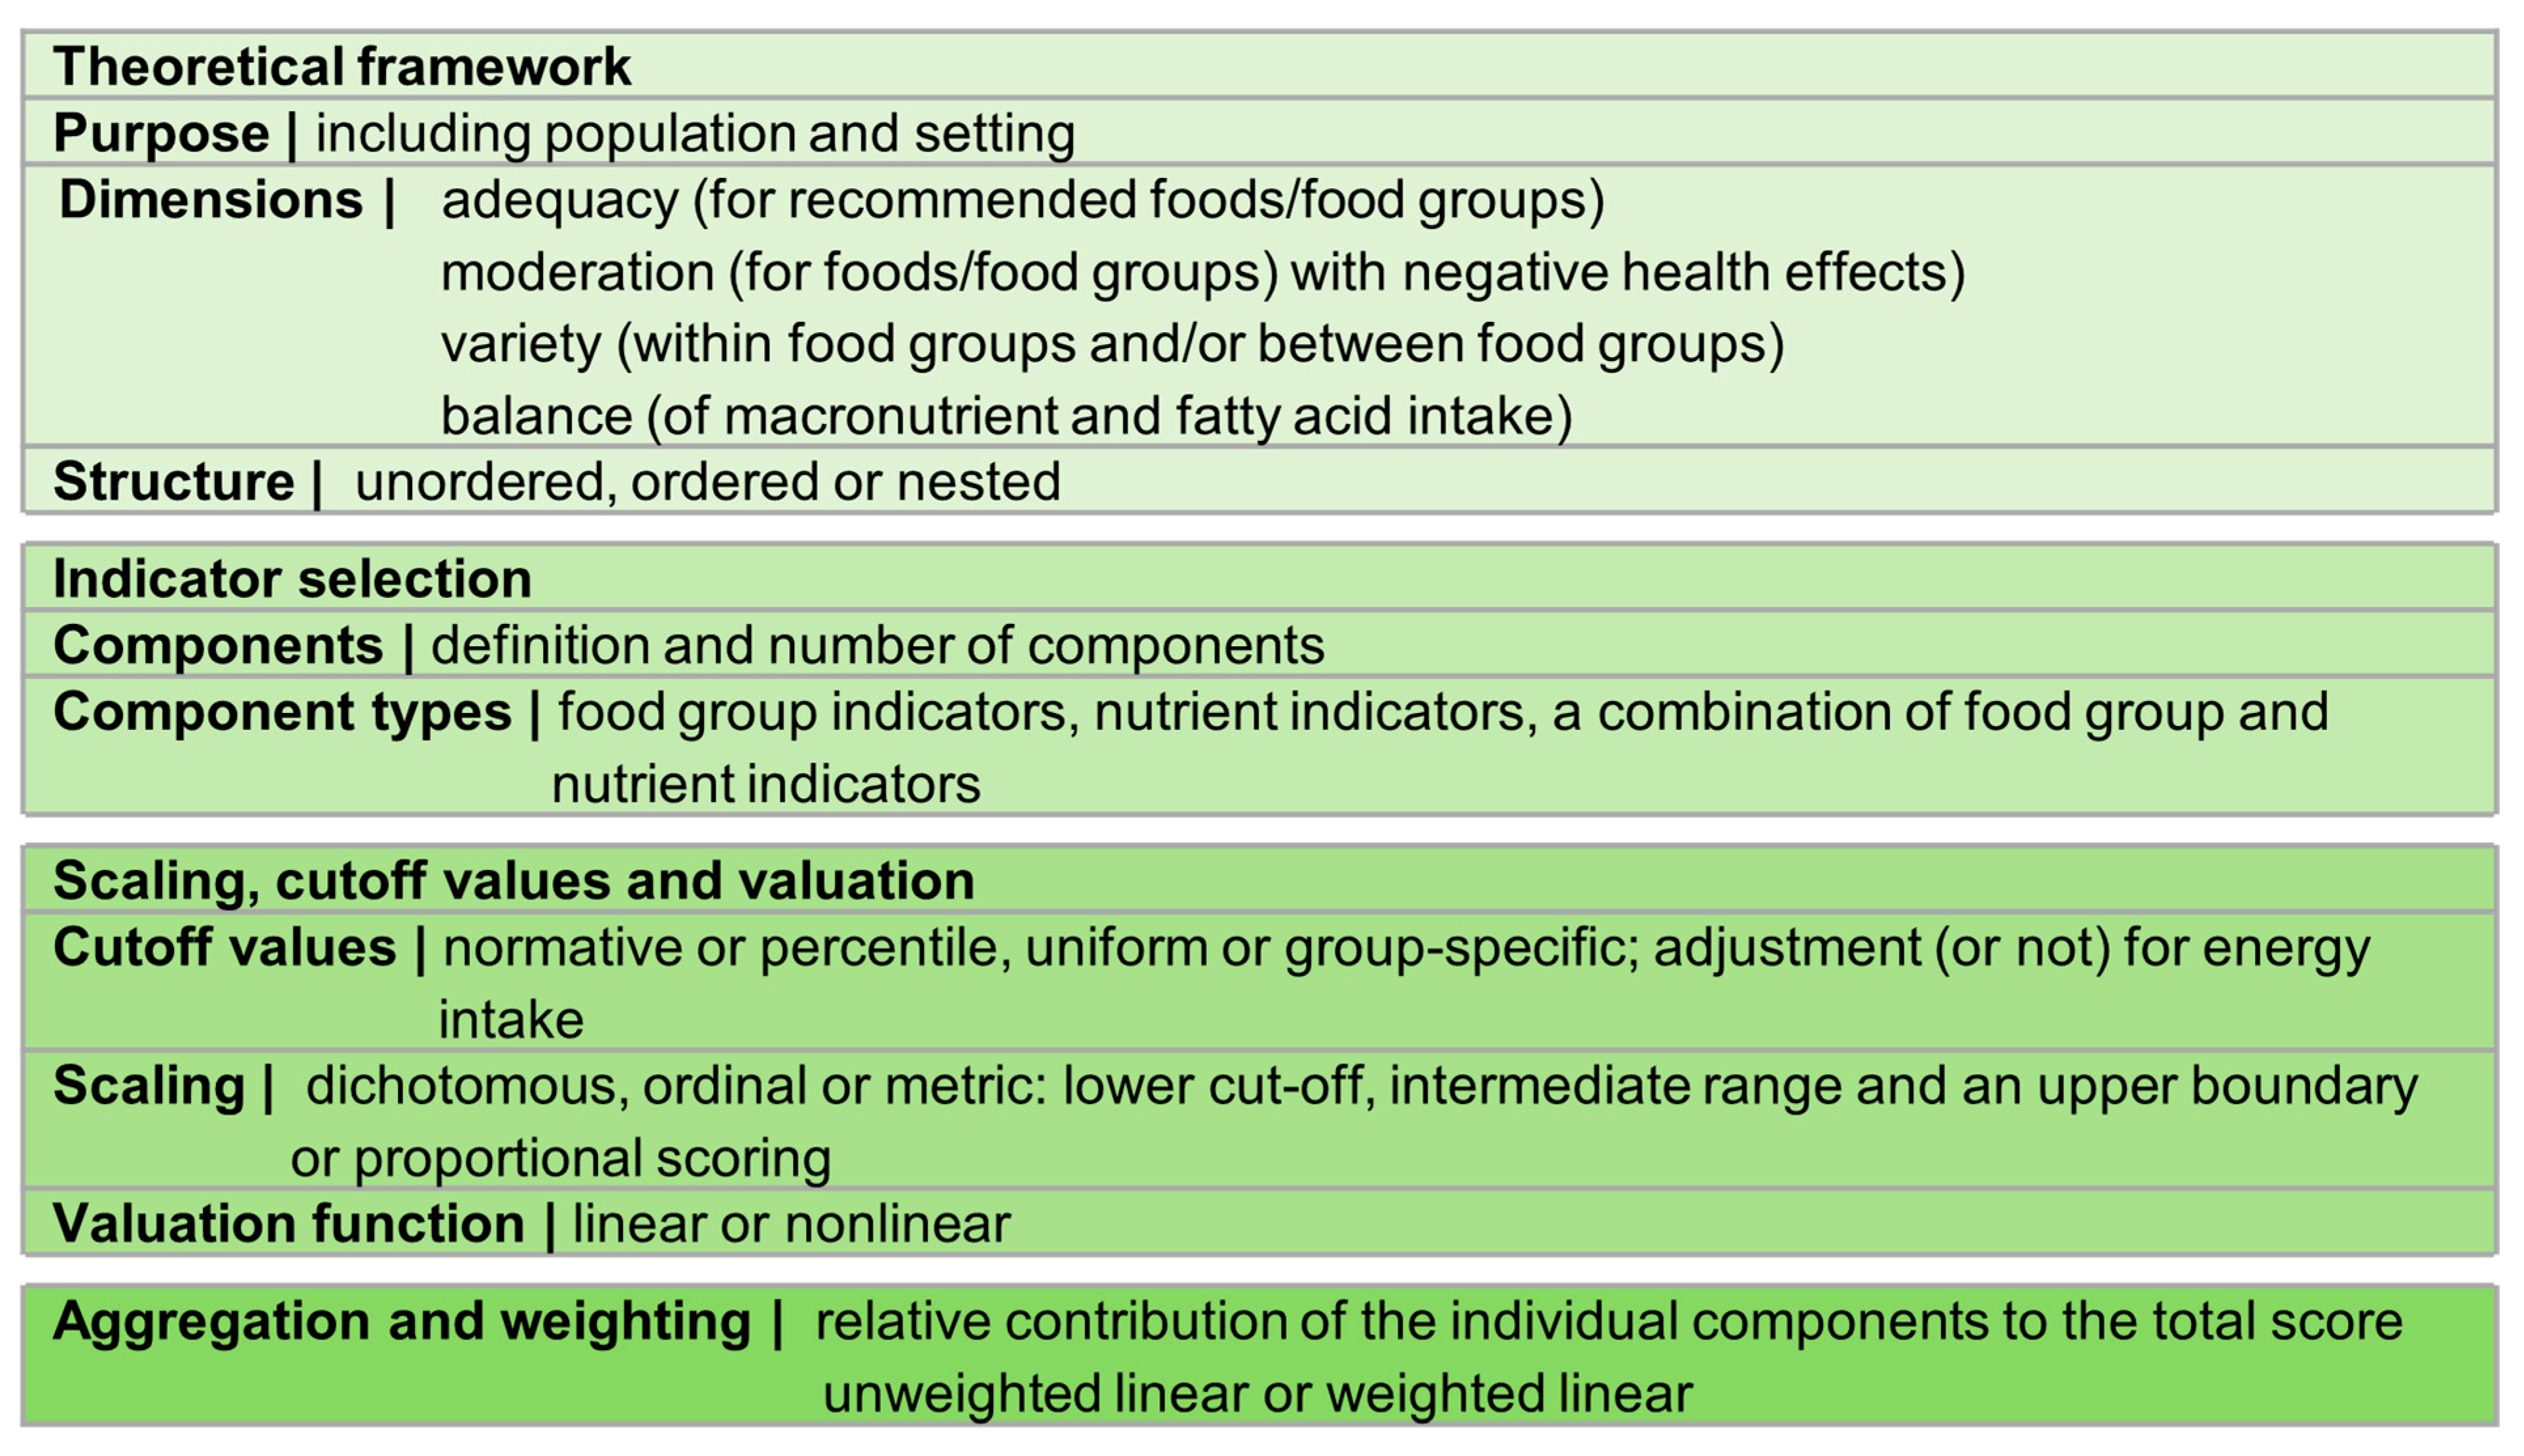
3.3.1. Theoretical Framework
3.3.2. Indicator Selection
3.3.3. Scaling, Cutoff Values and Valuation
3.3.4. Aggregation and Weighting
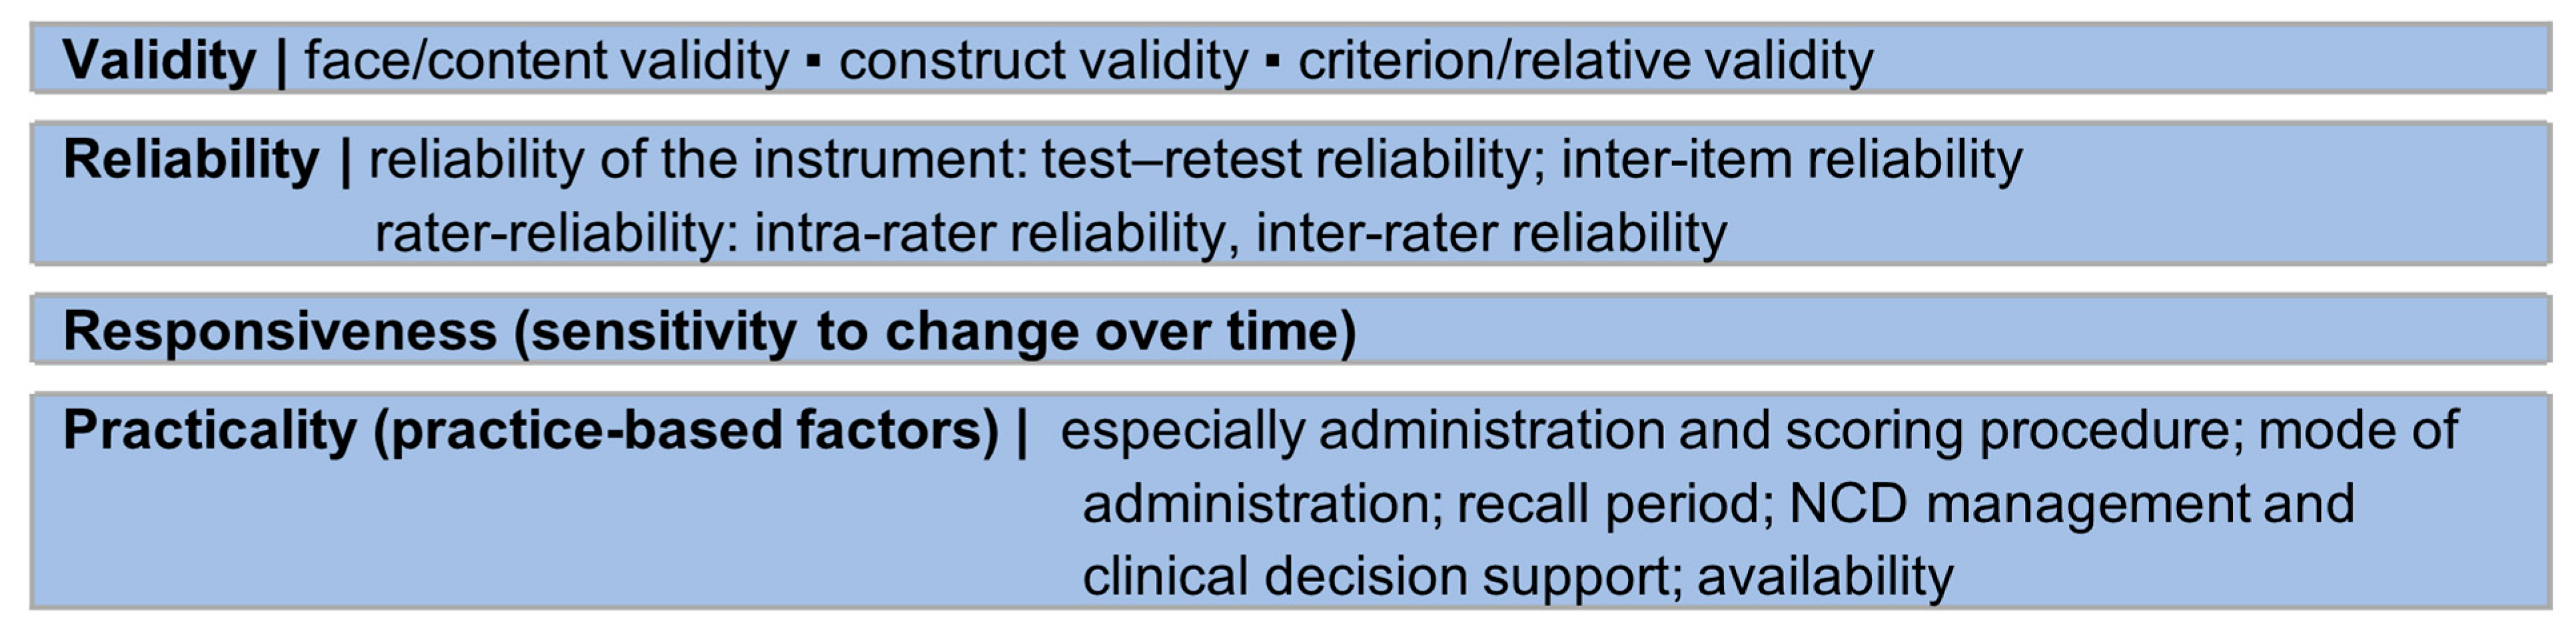
3.4. Measurement Properties
3.4.1. Validity and Reliability
3.4.2. Responsiveness
3.4.3. Practicality
4. Discussion
4.1. Screener Design
4.2. Measurement Properties
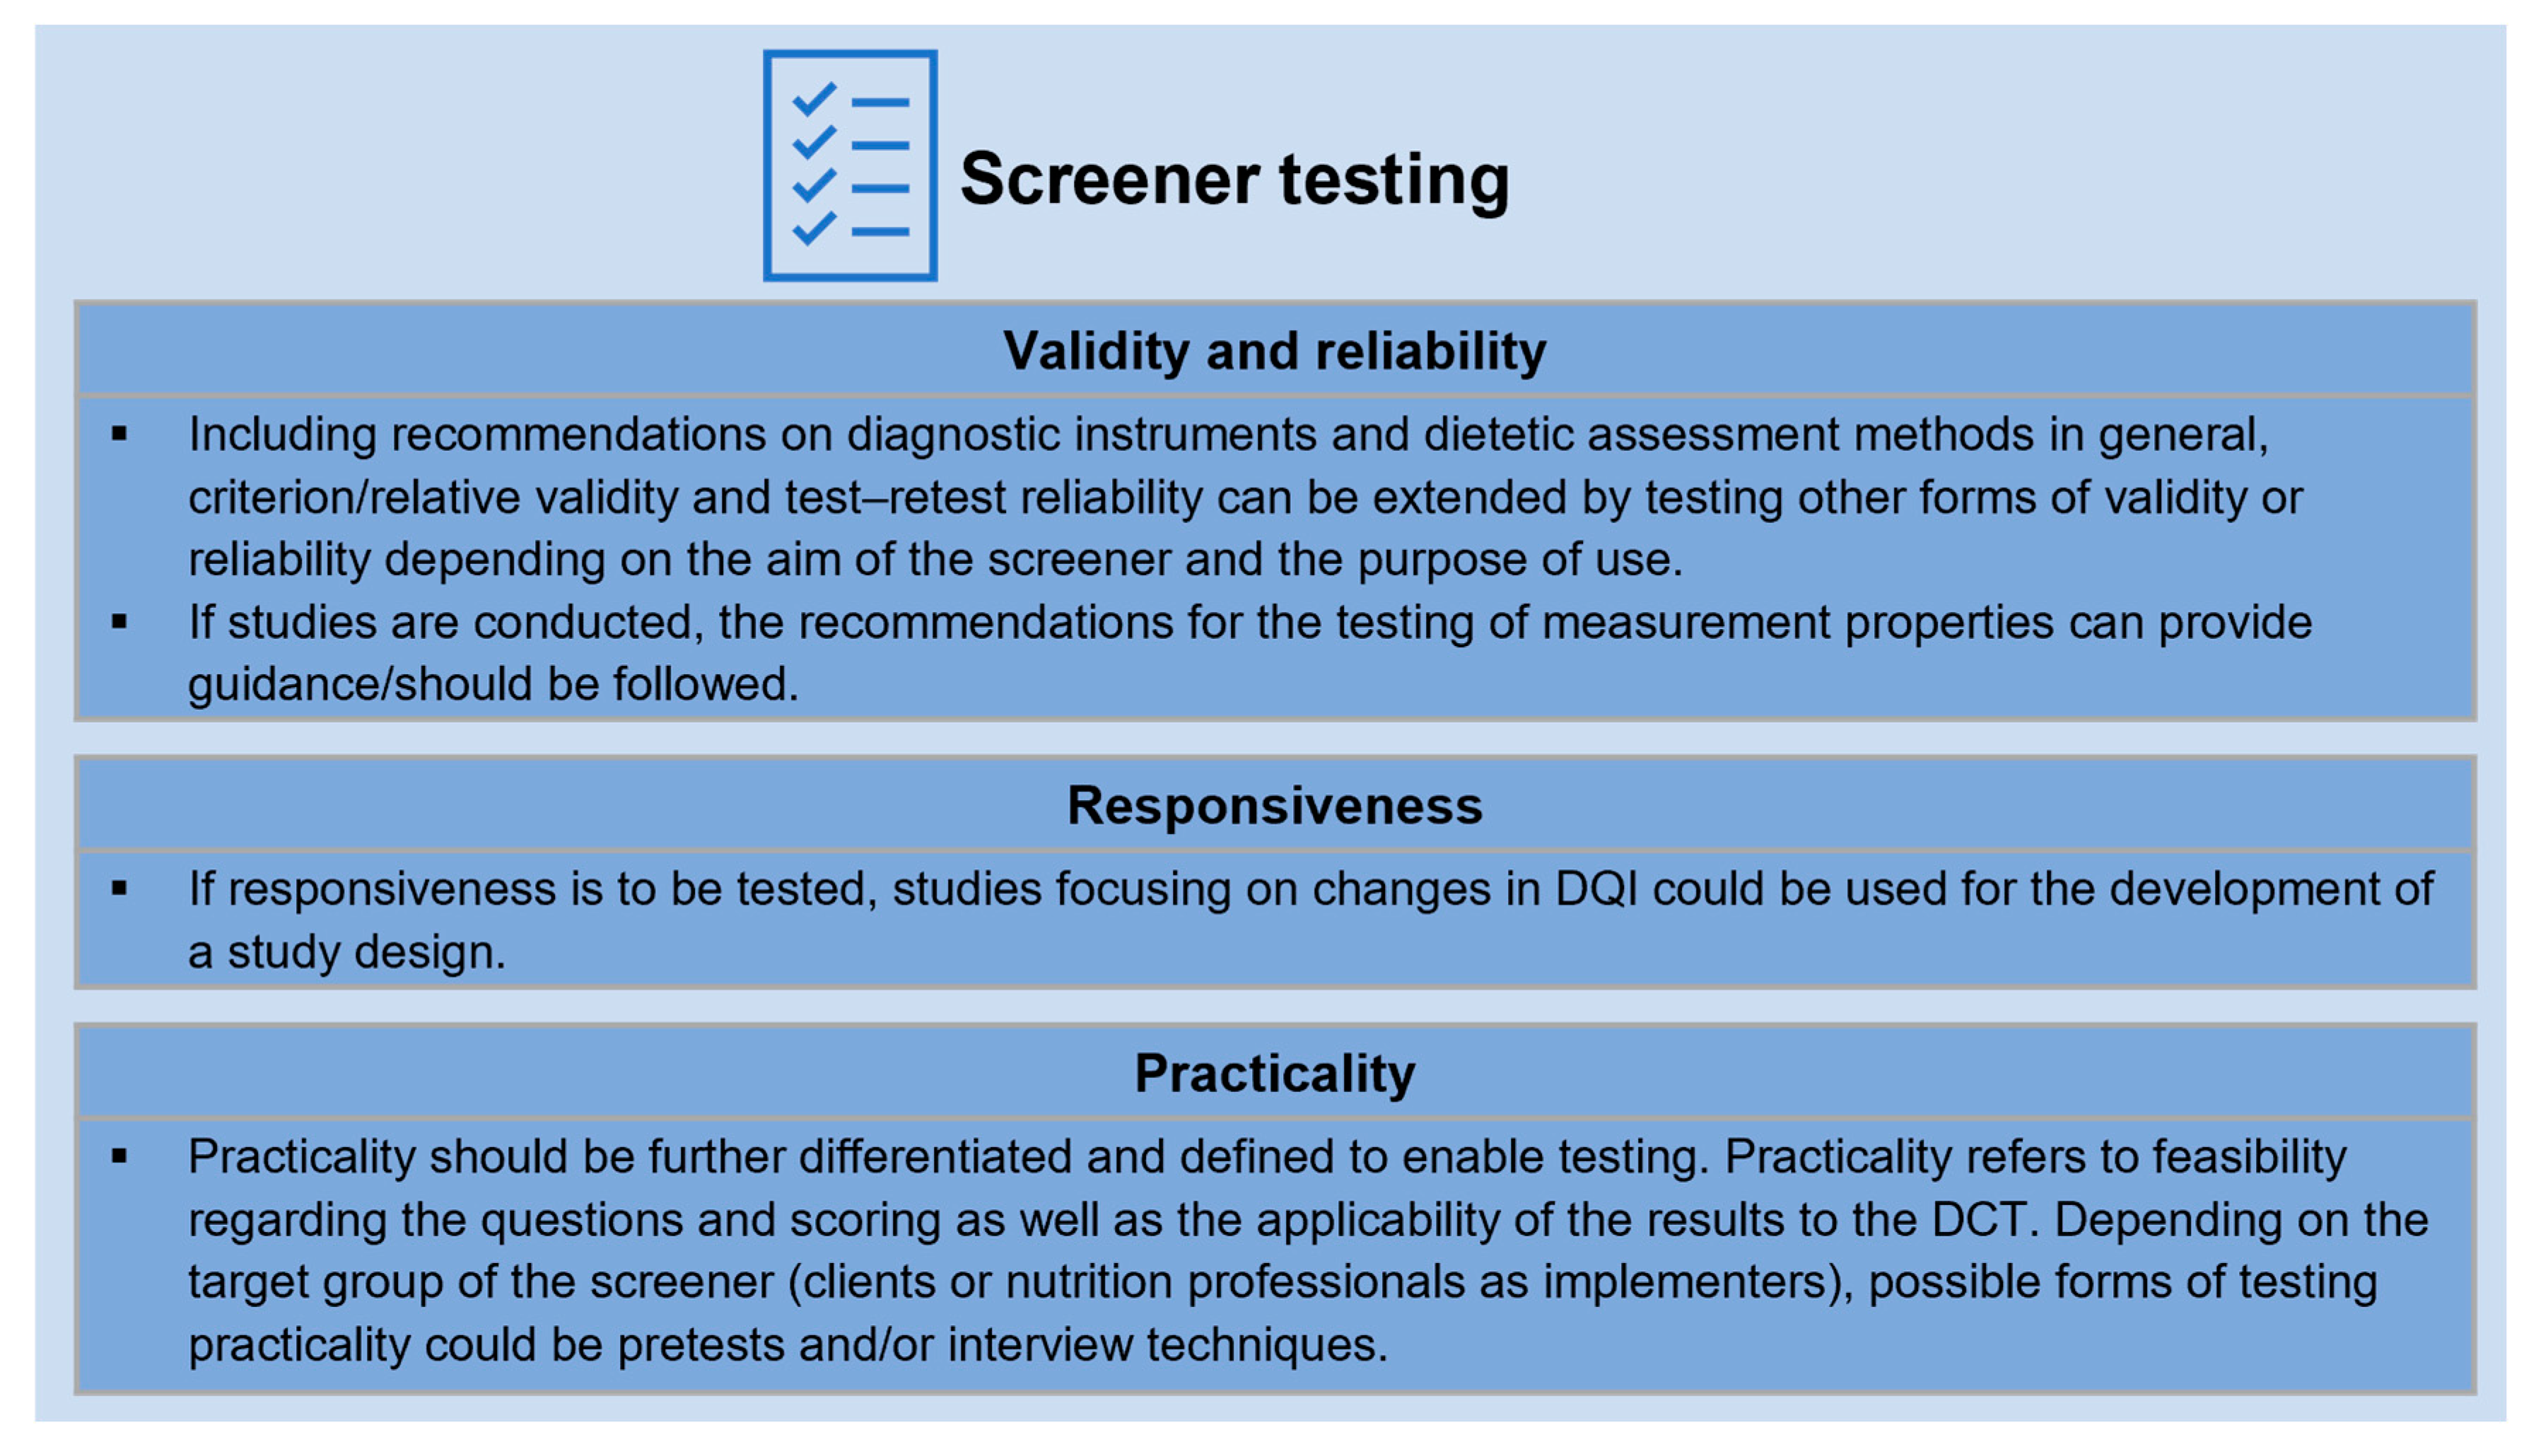
4.3. Recommendations for the Design and Testing of a Screener Based on National FBDGs for DCT
4.4. Limitations
5. Conclusions
Author Contributions
Funding
Data Availability Statement
Conflicts of Interest
References
- World Health Organization. World Health Statistics 2022: Monitoring Health for the SDGs, Sustainable Development Goals; World Health Organization (WHO): Geneva, Switzerland, 2022; ISBN 978-92-4-005114-0. [Google Scholar]
- Budreviciute, A.; Damiati, S.; Sabir, D.K.; Onder, K.; Schuller-Goetzburg, P.; Plakys, G.; Katileviciute, A.; Khoja, S.; Kodzius, R. Management and Prevention Strategies for Non-communicable Diseases (NCDs) and Their Risk Factors. Front. Public Health 2020, 8, 574111. [Google Scholar] [CrossRef] [PubMed]
- Holzapfel, C.; Dawczynski, C.; Henze, A.; Simon, M.-C. Personalized dietary recommendations for weight loss. Ernährungs Umsch. 2021, 68, 26–35. [Google Scholar]
- Barrow, M.; Bell, L.; Bell, C. Transforming personalized nutrition practice. Nutr. Rev. 2020, 78, 1046–1051. [Google Scholar] [CrossRef] [PubMed]
- European Federation of the Associations of Dietitians Professional Practice Committee. Vision Paper: The Implementation of an Nutrition Care Process (NCP) and Standardized Language (SL) among Dietitians in Europe. Vision 2020. Available online: http://www.efad.org/en-us/professional-practice/nutrition-care-process-and-standardised-language/ (accessed on 5 January 2022).
- Swan, W.I.; Vivanti, A.; Hakel-Smith, N.A.; Hotson, B.; Orrevall, Y.; Trostler, N.; Beck Howarter, K.; Papoutsakis, C. Nutrition Care Process and Model Update: Toward Realizing People-Centered Care and Outcomes Management. J. Acad. Nutr. Diet. 2017, 117, 2003–2014. [Google Scholar] [CrossRef] [PubMed]
- Kelleher, A.D.; Nutrition Assessment. Data gathering from the patient using communication and interviewing skills. In Essential Guide to the Nutrition Care Process; Reinhard, T., Width, M., Eds.; Academic Publishing: San Diego, CA, USA, 2019; pp. 109–139. [Google Scholar]
- Vanhauwaert, E.; Verbeyst, L.; Peters, S.; Matthys, C. Evidence-Based Practice Dietetics. Nutrinews 2019, 3, 1–8. [Google Scholar]
- Lövestam, E.; Boström, A.-M.; Orrevall, Y. Nutrition Care Process Implementation: Experiences in Various Dietetics Environments in Sweden. J. Acad. Nutr. Diet. 2017, 117, 1738–1748. [Google Scholar] [CrossRef]
- Peuker, M.; Lachmann, K.; Hoffmann, L.; Wiegand, T.; Siebert, H.; Kohlenberg-Müller, K. Implementing process-guided methods in nutrition counselling and dietetic therapy—What does current practice look like? Results of a descriptive pilot study. Ernährungs Umsch. 2022, 69, 176–183. [Google Scholar]
- Vadiveloo, M.; Lichtenstein, A.H.; Anderson, C.; Aspry, K.; Foraker, R.; Griggs, S.; Hayman, L.L.; Johnston, E.; Stone, N.J.; Thorndike, A.N. Rapid Diet Assessment Screening Tools for Cardiovascular Disease Risk Reduction Across Healthcare Settings: A Scientific Statement From the American Heart Association. Circ. Cardiovasc. Qual. Outcomes 2020, 13, e000094. [Google Scholar] [CrossRef]
- Improvement of Education and Competences in Dietetics. Definitions for IMPECD; IMPECD: Antwerpen, Belgium; Fulda, Germany; Groningen, The Netherlands; Neubrandenburg, Germany; St. Pölten, Austria, 2018. [Google Scholar]
- Improvement of Education and Competences in Dietetics. Components of Dietetic Assessment; IMPECD: Antwerpen, Belgium; Fulda, Germany; Groningen, The Netherlands; Neubrandenburg, Germany; St. Pölten, Austria, 2018. [Google Scholar]
- Alkerwi, A. Diet quality concept. Nutrition 2014, 30, 613–618. [Google Scholar] [CrossRef]
- Wirt, A.; Collins, C.E. Diet quality—What is it and does it matter? Public Health Nutr. 2009, 12, 2473–2492. [Google Scholar] [CrossRef]
- Waijers, P.M.C.M.; Feskens, E.J.M.; Ocké, M.C. A critical review of predefined diet quality scores. Br. J. Nutr. 2007, 97, 219–231. [Google Scholar] [CrossRef] [PubMed]
- Burggraf, C.; Teuber, R.; Brosig, S.; Meier, T. Review of a priori dietary quality indices in relation to their construction criteria. Nutr. Rev. 2018, 76, 747–764. [Google Scholar] [CrossRef] [PubMed]
- Kant, A.K. Indexes of Overall Diet Quality. J. Am. Diet. Assoc. 1996, 96, 785–791. [Google Scholar] [CrossRef]
- Kant, A.K. Dietary patterns and health outcomes. J. Am. Diet. Assoc. 2004, 104, 615–635. [Google Scholar] [CrossRef] [PubMed]
- Schulze, M.B.; Martínez-González, M.A.; Fung, T.T.; Lichtenstein, A.H.; Forouhi, N.G. Food based dietary patterns and chronic disease prevention. BMJ 2018, 361, k2396. [Google Scholar] [CrossRef]
- Cena, H.; Calder, P.C. Defining a Healthy Diet: Evidence for The Role of Contemporary Dietary Patterns in Health and Disease. Nutrients 2020, 12, 334. [Google Scholar] [CrossRef]
- Tapsell, L.C.; Neale, E.P.; Satija, A.; Hu, F.B. Foods, Nutrients, and Dietary Patterns: Interconnections and Implications for Dietary Guidelines. Adv. Nutr. 2016, 7, 445–454. [Google Scholar] [CrossRef]
- Food and Agriculture Organization. Food-Based Dietary Guidelines. Available online: https://www.fao.org/nutrition/education/food-based-dietary-guidelines (accessed on 6 January 2022).
- Herforth, A.; Arimond, M.; Álvarez-Sánchez, C.; Coates, J.; Christianson, K.; Muehlhoff, E. A Global Review of Food-Based Dietary Guidelines. Adv. Nutr. 2019, 10, 590–605. [Google Scholar] [CrossRef]
- Brauer, P.; Royall, D.; Rodrigues, A. Use of the Healthy Eating Index in Intervention Studies for Cardiometabolic Risk Conditions: A Systematic Review. Adv. Nutr. 2021, 12, 1317–1331. [Google Scholar] [CrossRef]
- Smethers, A.D.; Rolls, B.J. Dietary Management of Obesity: Cornerstones of Healthy Eating Patterns. Med. Clin. North Am. 2018, 102, 107–124. [Google Scholar] [CrossRef]
- McAuley, E.A.; MacLaughlin, H.L.; Hannan-Jones, M.T.; King, N.; Ross, L.J. Effectiveness of diet quality indices in measuring a change in diet quality over time: A systematic review and meta-analysis of randomized controlled trials. Nutr. Rev. 2022, 81, 361–383. [Google Scholar] [CrossRef] [PubMed]
- Trijsburg, L.; Talsma, E.F.; de Vries, J.H.M.; Kennedy, G.; Kuijsten, A.; Brouwer, I.D. Diet quality indices for research in low- and middle-income countries: A systematic review. Nutr. Rev. 2019, 77, 515–540. [Google Scholar] [CrossRef] [PubMed]
- United States Department of Agriculture. A Series of Systematic Reviews on the Relationship Between Dietary Patterns and Health Outcomes. Available online: https://nesr.usda.gov/sites/default/files/2019-06/DietaryPatternsReport-FullFinal2.pdf (accessed on 8 April 2022).
- Pérez Rodrigo, C.; Morán Fagúndez, L.J.; Riobó Serván, P.; Aranceta Bartrina, J. Screeners and brief assessment methods. Nutr. Hosp. 2015, 31 (Suppl. S3), 91–98. [Google Scholar] [CrossRef] [PubMed]
- Connor, S.; Irani, J. Practical Tools for Assessing Diet Quality in Clinical Settings. Curr. Cardiovasc. Risk Rep. 2021, 15, 16. [Google Scholar] [CrossRef]
- Chauhan, H.; Belski, R.; Bryant, E.; Cooke, M. Dietary Assessment Tools and Metabolic Syndrome: Is It Time to Change the Focus? Nutrients 2022, 14, 1557. [Google Scholar] [CrossRef] [PubMed]
- England, C.Y.; Andrews, R.C.; Jago, R.; Thompson, J.L. A systematic review of brief dietary questionnaires suitable for clinical use in the prevention and management of obesity, cardiovascular disease and type 2 diabetes. Eur. J. Clin. Nutr. 2015, 69, 977–1003. [Google Scholar] [CrossRef]
- Page, M.J.; McKenzie, J.E.; Bossuyt, P.M.; Boutron, I.; Hoffmann, T.C.; Mulrow, C.D.; Shamseer, L.; Tetzlaff, J.M.; Akl, E.A.; Brennan, S.E.; et al. The PRISMA 2020 statement: An updated guideline for reporting systematic reviews. BMJ 2021, 372, n71. [Google Scholar] [CrossRef]
- Moher, D.; Shamseer, L.; Clarke, M.; Ghersi, D.; Liberati, A.; Petticrew, M.; Shekelle, P.; Stewart, L.A. Preferred reporting items for systematic review and meta-analysis protocols (PRISMA-P) 2015 statement. Syst. Rev. 2015, 4, 1. [Google Scholar] [CrossRef]
- Mokkink, L.B.; de Vet, H.C.W.; Prinsen, C.A.C.; Patrick, D.L.; Alonso, J.; Bouter, L.M. COSMIN guideline for systematic reviews of Patient-Reported Outcome Measures: User manual. Qual. Life Res. 2018, 27, 1147–1157. [Google Scholar] [CrossRef]
- Prinsen, C.A.C.; Mokkink, L.B.; Bouter, L.M.; Alonso, J.; Patrick, D.L.; de Vet, H.C.W.; Terwee, C.B. COSMIN guideline for systematic reviews of patient-reported outcome measures. Qual. Life Res. 2018, 27, 1147–1157. [Google Scholar] [CrossRef]
- Ma, L.-L.; Wang, Y.-Y.; Yang, Z.-H.; Di, H.; Weng, H.; Zeng, X.-T. Methodological quality (risk of bias) assessment tools for primary and secondary medical studies: What are they and which is better? Mil. Med. Res. 2020, 7, 7. [Google Scholar] [CrossRef] [PubMed]
- National Intitutes of Health; National Cancer Institute. Register of Validated Short Dietary Assessment Instruments. Available online: https://epi.grants.cancer.gov/diet/shortreg/ (accessed on 22 August 2022).
- Mokkink, L.B.; Terwee, C.B.; de Vet, H.C.W.; Bouter, L.M.; Prinsen, C.A.C.; Patrick, D.L.; Alonso, J.; Knol, D.L.; Stratford, P.W. Search Filters. Available online: https://www.cosmin.nl/tools/pubmed-search-filters/ (accessed on 27 February 2023).
- Kirkpatrick, S.I.; Baranowski, T.; Subar, A.F.; Tooze, J.A.; Frongillo, E.A. Best Practices for Conducting and Interpreting Studies to Validate Self-Report Dietary Assessment Methods. J. Acad. Nutr. Diet. 2019, 119, 1801–1816. [Google Scholar] [CrossRef] [PubMed]
- Lee, L.; Feskens, E.J.M.; Meijboom, S.; van Hooft Huysduynen, E.J.C.; van’t Veer, P.; de Vries, J.H.M.; Geelen, A. Evaluation of a screener to assess diet quality in the Netherlands. Br. J. Nutr. 2016, 115, 517–526. [Google Scholar] [CrossRef] [PubMed]
- Rifas-Shiman, S.L.; Willett, W.C.; Lobb, R.; Kotch, J.; Dart, C.; Gillman, M.W. PrimeScreen, a brief dietary screening tool: Reproducibility and comparability with both a longer food frequency questionnaire and biomarkers. Public Health Nutr. 2001, 4, 249–254. [Google Scholar] [CrossRef]
- Johnston, E.A.; Petersen, K.S.; Beasley, J.M.; Krussig, T.; Mitchell, D.C.; van Horn, L.V.; Weiss, R.; Kris-Etherton, P.M. Relative validity and reliability of a diet risk score (DRS) for clinical practice. BMJ Nutr. Prev. Health 2020, 3, 263–269. [Google Scholar] [CrossRef]
- Gicevic, S.; Mou, Y.; Bromage, S.; Fung, T.T.; Willett, W. Development of a Diet Quality Screener for Global Use: Evaluation in a Sample of US Women. J. Acad. Nutr. Diet. 2021, 121, 854–871. [Google Scholar] [CrossRef]
- Ma, S.; Herforth, A.W.; Vogliano, C.; Zou, Z. Most Commonly-Consumed Food Items by Food Group, and by Province, in China: Implications for Diet Quality Monitoring. Nutrients 2022, 14, 1754. [Google Scholar] [CrossRef]
- Kanauchi, M.; Kanauchi, K. Proposal for an Empirical Japanese Diet Score and the Japanese Diet Pyramid. Nutrients 2019, 11, 2741. [Google Scholar] [CrossRef]
- Whitton, C.; Ho, J.C.Y.; Rebello, S.A.; van Dam, R.M. Relative validity and reproducibility of dietary quality scores from a short diet screener in a multi-ethnic Asian population. Public Health Nutr. 2018, 21, 2735–2743. [Google Scholar] [CrossRef]
- Lafrenière, J.; Harrison, S.; Laurin, D.; Brisson, C.; Talbot, D.; Couture, P.; Lemieux, S.; Lamarche, B. Development and validation of a Brief Diet Quality Assessment Tool in the French-speaking adults from Quebec. Int. J. Behav. Nutr. Phys. Act. 2019, 16, 61. [Google Scholar] [CrossRef]
- Kotecki, J.E.; Greene, M.A.; Khubchandani, J.; Kandiah, J. A Brief Dietary Screening and Counseling Tool for Health Educators. Am. J. Health Educ. 2021, 52, 111–116. [Google Scholar] [CrossRef]
- Lindström, J.; Aittola, K.; Pölönen, A.; Hemiö, K.; Ahonen, K.; Karhunen, L.; Männikkö, R.; Siljamäki-Ojansuu, U.; Tilles-Tirkkonen, T.; Virtanen, E.; et al. Formation and Validation of the Healthy Diet Index (HDI) for Evaluation of Diet Quality in Healthcare. Int. J. Environ. Res. Public Health 2021, 18, 2362. [Google Scholar] [CrossRef] [PubMed]
- Schröder, H.; Benitez Arciniega, A.; Soler, C.; Covas, M.-I.; Baena-Díez, J.M.; Marrugat, J. Validity of two short screeners for diet quality in time-limited settings. Public Health Nutr. 2012, 15, 618–626. [Google Scholar] [CrossRef] [PubMed]
- Robinson, S.M.; Jameson, K.A.; Bloom, I.; Ntani, G.; Crozier, S.R.; Syddall, H.; Dennison, E.M.; Cooper, C.; Sayer, A.A. Development of a short questionnaire to assess diet quality among older community-dwelling adults. J. Nutr. Health Aging 2017, 21, 247–253. [Google Scholar] [CrossRef] [PubMed]
- Al-Nimr, R.I.; Wright, K.C.S.; Aquila, C.L.; Petersen, C.L.; Gooding, T.L.; Batsis, J.A. Intensive nutrition counseling as part of a multi-component weight loss intervention improves diet quality and anthropometrics in older adults with obesity. Clin. Nutr. ESPEN 2020, 40, 293–299. [Google Scholar] [CrossRef]
- Gardea-Resendez, M.; Winham, S.J.; Romo-Nava, F.; Cuellar-Barboza, A.; Clark, M.M.; Andreazza, A.C.; Cabello-Arreola, A.; Veldic, M.; Bond, D.J.; Singh, B.; et al. Quantification of diet quality utilizing the rapid eating assessment for participants-shortened version in bipolar disorder: Implications for prospective depression and cardiometabolic studies. J. Affect. Disord. 2022, 310, 150–155. [Google Scholar] [CrossRef]
- Lam, R.; Riggs, J.; Sunseri, M.; Kwon, S.; Crowley, G.; Schwartz, T.; Zeig-Owens, R.; Halpren, A.; Liu, M.; Prezant, D.J.; et al. Nutritional assessment of the world trade center-health program fire department of New York cohort. Am. J. Respir. Crit. Care Med. 2019, 199. [Google Scholar] [CrossRef]
- Sundermann, E.E.; Katz, M.J.; Lipton, R.B.; Derby, C.A. A brief dietaryassessment predicts executive dysfunction in an elderly cohort: Results from the einstein aging study (EAS). Alzheimer’s Dement. 2015, 11, P731–P732. [Google Scholar] [CrossRef]
- Sundermann, E.E.; Katz, M.J.; Lipton, R.B.; Lichtenstein, A.H.; Derby, C.A. A Brief Dietary Assessment Predicts Executive Dysfunction in an Elderly Cohort: Results from the Einstein Aging Study. J. Am. Geriatr. Soc. 2016, 64, e131–e136. [Google Scholar] [CrossRef]
- Haslam, R.L.; Pezdirc, K.; Truby, H.; Attia, J.; Hutchesson, M.; Burrows, T.; Callister, R.; Hides, L.; Bonevski, B.; Da Kerr; et al. Investigating the Efficacy and Cost-Effectiveness of Technology-Delivered Personalized Feedback on Dietary Patterns in Young Australian Adults in the Advice, Ideas, and Motivation for My Eating (Aim4Me) Study: Protocol for a Randomized Controlled Trial. JMIR Res. Protoc. 2020, 9, e15999. [Google Scholar] [CrossRef]
- Lamers, C.R.; van Erp, L.W.; Slotegraaf, A.I.; Groenen, M.; de Roos, N.M.; Wahab, P.J.; Witteman, B. Web-based dietary assessment and advice helps inflammatory bowel disease patients to improve their diet quality. Br. J. Nutr. 2022, 129, 231–239. [Google Scholar] [CrossRef] [PubMed]
- Haslam, R.L.; Baldwin, J.N.; Pezdirc, K.; Truby, H.; Attia, J.; Hutchesson, M.J.; Burrows, T.; Callister, R.; Hides, L.; Bonevski, B.; et al. Efficacy of technology-based personalised feedback on diet quality in young Australian adults: Results for the advice, ideas and motivation for my eating (Aim4Me) randomised controlled trial. Public Health Nutr. 2023, 26, 1293–1305. [Google Scholar] [CrossRef] [PubMed]
- Renzella, J.; Fernando, S.; Kalupahana, B.; Townsend, N.; Rayner, M.; Wickramasinghe, K.; Katulanda, P.; Scarborough, P. Relative validity of a brief dietary survey to assess food intake and adherence to national dietary guidelines among Sri Lankan adults. BMC Nutr. 2020, 6, 68. [Google Scholar] [CrossRef]
- Gadowski, A.M.; McCaffrey, T.A.; Heritier, S.; Curtis, A.J.; Nanayakkara, N.; Zoungas, S.; Owen, A.J. Development, Relative Validity and Reproducibility of the Aus-SDS (Australian Short Dietary Screener) in Adults Aged 70 Years and Above. Nutrients 2020, 12, 1436. [Google Scholar] [CrossRef] [PubMed]
- Henriksen, H.B.; Carlsen, M.H.; Paur, I.; Berntsen, S.; Bøhn, S.K.; Skjetne, A.J.; Kværner, A.S.; Henriksen, C.; Andersen, L.F.; Smeland, S.; et al. Relative validity of a short food frequency questionnaire assessing adherence to the norwegian dietary guidelines among colorectal cancer patients. Food Nutr. Res. 2018, 62, 1306. [Google Scholar] [CrossRef]
- Lara-Breitinger, K.M.; Medina Inojosa, J.R.; Li, Z.; Kunzova, S.; Lerman, A.; Kopecky, S.L.; Lopez-Jimenez, F. Validation of a Brief Dietary Questionnaire for Use in Clinical Practice: Mini-EAT (Eating Assessment Tool). J. Am. Heart Assoc. 2023, 12, e025064. [Google Scholar] [CrossRef]
- Rafferty, A.P.; Anderson, J.V.; McGee, H.B.; Miller, C.E. A healthy diet indicator: Quantifying compliance with the dietary guidelines using the BRFSS. Prev. Med. 2002, 35, 9–15. [Google Scholar] [CrossRef]
- Thompson, F.E.; Midthune, D.; Kahle, L.; Dodd, K.W. Development and Evaluation of the National Cancer Institute’s Dietary Screener Questionnaire Scoring Algorithms. J. Nutr. 2017, 147, 1226–1233. [Google Scholar] [CrossRef]
- Colby, S.; Zhou, W.; Allison, C.; Mathews, A.E.; Olfert, M.D.; Morrell, J.S.; Byrd-Bredbenner, C.; Greene, G.; Brown, O.; Kattelmann, K.; et al. Development and Validation of the Short Healthy Eating Index Survey with a College Population to Assess Dietary Quality and Intake. Nutrients 2020, 12, 2611. [Google Scholar] [CrossRef]
- Toft, U.; Kristoffersen, L.H.; Lau, C.; Borch-Johnsen, K.; Jørgensen, T. The Dietary Quality Score: Validation and association with cardiovascular risk factors: The Inter99 study. Eur. J. Clin. Nutr. 2007, 61, 270–278. [Google Scholar] [CrossRef]
- de Rijk, M.G.; Slotegraaf, A.I.; Brouwer-Brolsma, E.M.; Perenboom, C.W.; Feskens, E.J.; de Vries, J.H. Development and evaluation of a diet quality screener to assess adherence to the Dutch food-based dietary guidelines. Br. J. Nutr. 2021, 128, 1615–1625. [Google Scholar] [CrossRef] [PubMed]
- Heusschen, L.; Berendsen, A.; Balvers, M.; Deden, L.N.; de Vries, J.; Hazebroek, E.J. Relative validity of a short screener to assess diet quality in patients with morbid obesity before and after bariatric surgery. Public Health Nutr. 2022, 25, 2731–2741. [Google Scholar] [CrossRef] [PubMed]
- Estaquio, C.; Kesse-Guyot, E.; Deschamps, V.; Bertrais, S.; Dauchet, L.; Galan, P.; Hercberg, S.; Castetbon, K. Adherence to the French Programme National Nutrition Santé Guideline Score is associated with better nutrient intake and nutritional status. J. Am. Diet. Assoc. 2009, 109, 1031–1041. [Google Scholar] [CrossRef] [PubMed]
- Jannasch, F.; Nickel, D.V.; Bergmann, M.M.; Schulze, M.B. A New Evidence-Based Diet Score to Capture Associations of Food Consumption and Chronic Disease Risk. Nutrients 2022, 14, 2359. [Google Scholar] [CrossRef]
- Compher, C.W.; Quinn, R.; Burke, F.; Piccinin, D.; Sartor, L.; Lewis, J.D.; Wu, G.D. Development of the Penn Healthy Diet screener with reference to adult dietary intake data from the National Health and Nutrition Examination Survey. Nutr. J. 2022, 21, 70. [Google Scholar] [CrossRef]
- Aberegg, E.S.; Collins, K.K.; Hinderliter, J.M.; Smalling, S.L.; Fung, T.T.; Gizlice, Z.; Johnston, L.F.; Ammerman, A.S.; Keyserling, T.C. Validity and Reliability of a Brief Dietary Assessment Questionnaire in a Cardiac Rehabilitation Program. J. Cardiopulm. Rehabil. Prev. 2020, 40, 280–283. [Google Scholar] [CrossRef]
- Johnston, C.S.; Bliss, C.; Knurick, J.R.; Scholtz, C. Rapid Eating Assessment for Participants shortened version scores are associated with Healthy Eating Index-2010 scores and other indices of diet quality in healthy adult omnivores and vegetarians. Nutr. J. 2018, 17, 89. [Google Scholar] [CrossRef]
- Gans, K.M.; Risica, P.M.; Wylie-Rosett, J.; Ross, E.M.; Strolla, L.O.; McMurray, J.; Eaton, C.B. Development and evaluation of the nutrition component of the Rapid Eating and Activity Assessment for Patients (REAP): A new tool for primary care providers. J. Nutr. Educ. Behav. 2006, 38, 286–292. [Google Scholar] [CrossRef]
- Segal-Isaacson, C.J.; Wylie-Rosett, J.; Gans, K.M. Validation of a short dietary assessment questionnaire: The Rapid Eating and Activity Assessment for Participants short version (REAP-S). Diabetes Educ. 2004, 30, 774–781. [Google Scholar] [CrossRef]
- Bivoltsis, A.; Trapp, G.S.A.; Knuiman, M.; Hooper, P.; Ambrosini, G.L. Can a Simple Dietary Index Derived from a Sub-Set of Questionnaire Items Assess Diet Quality in a Sample of Australian Adults? Nutrients 2018, 10, 486. [Google Scholar] [CrossRef] [PubMed]
- Hendrie, G.A.; Rebuli, M.A.; Golley, R.K. Reliability and relative validity of a diet index score for adults derived from a self-reported short food survey. Nutr. Diet. 2017, 74, 291–297. [Google Scholar] [CrossRef] [PubMed]
- Ashton, L.; Williams, R.; Wood, L.; Schumacher, T.; Burrows, T.; Rollo, M.; Pezdirc, K.; Callister, R.; Collins, C. Comparison of Australian Recommended Food Score (ARFS) and Plasma Carotenoid Concentrations: A Validation Study in Adults. Nutrients 2017, 9, 888. [Google Scholar] [CrossRef] [PubMed]
- Collins, C.E.; Burrows, T.L.; Rollo, M.E.; Boggess, M.M.; Watson, J.F.; Guest, M.; Duncanson, K.; Pezdirc, K.; Hutchesson, M.J. The comparative validity and reproducibility of a diet quality index for adults: The Australian Recommended Food Score. Nutrients 2015, 7, 785–798. [Google Scholar] [CrossRef] [PubMed]
- Persson, C.E.; Rothenberg, E.; Hansson, P.-O.; Welin, C.; Strandhagen, E. Cardiovascular risk factors in relation to dietary patterns in 50-year-old men and women: A feasibility study of a short FFQ. Public Health Nutr. 2019, 22, 645–653. [Google Scholar] [CrossRef]
- Masip, G.; Keski-Rahkonen, A.; Pietiläinen, K.H.; Kujala, U.M.; Rottensteiner, M.; Väisänen, K.; Kaprio, J.; Bogl, L.H. Development of a food-based diet quality score from a short FFQ and associations with obesity measures, eating styles and nutrient intakes in finnish twins. Nutrients 2019, 11, 2561. [Google Scholar] [CrossRef]
- Leppälä, J.; Lagström, H.; Kaljonen, A.; Laitinen, K. Construction and evaluation of a self-contained index for assessment of diet quality. Scand. J. Public Health 2010, 38, 794–802. [Google Scholar] [CrossRef]
- Kruseman, M.; Chatelan, A.; Farina, E.; Carrard, I.; Cela, J.; Guessous, I.; Marques-Vidal, P. Assessing Overall Diet Quality: Development and Evaluation of the Performance of a Short Self-Administrated Questionnaire SCASA. Nutrients 2021, 13, 677. [Google Scholar] [CrossRef]
- Food and Agriculture Organization; World Health Organization. World Declaration and Plan of Action for Nutrition; Food and Agriculture Organization: Rome, Italy; World Health Organization: Rome, Italy, 1992. [Google Scholar]
- World Health Organization. Preparation and Use of Food-Based Dietary Guidelines: Report of a Joint FAO/WHO Consultation; WHO Technical Report Series: Geneva, Switzerland, 1998. [Google Scholar]
- Zenun Franco, R.; Fallaize, R.; Weech, M.; Hwang, F.; Lovegrove, J.A. Effectiveness of Web-Based Personalized Nutrition Advice for Adults Using the eNutri Web App: Evidence From the EatWellUK Randomized Controlled Trial. J. Med. Internet Res. 2022, 24, e29088. [Google Scholar] [CrossRef]
- von Ruesten, A.; Illner, A.-K.; Buijsse, B.; Heidemann, C.; Boeing, H. Adherence to recommendations of the German food pyramid and risk of chronic diseases: Results from the EPIC-Potsdam study. Eur. J. Clin. Nutr. 2010, 64, 1251–1259. [Google Scholar] [CrossRef]
- von Rüsten, A. Die Bewertung der Lebensmittelaufnahme mittels eines Healthy Eating Index’ (HEI-EPIC). Ernährungs Umsch. 2009, 56, 450–456. [Google Scholar]
- Wittig, F.; Hoffmann, I. Ernährungsmuster von Bio-Käufern und Nicht-Bio-Käufern. In Auswertung der Daten der Nationalen Verzehrsstudie II (NVS II): Eine Integrierte Verhaltens- und Lebensstilbasierte Analyse des Bio-Konsums; Wittig, F., Eisinger-Watzl, M., Heuer, T., Claupein, E., Pfau, C., Hoffmann, I., Eds.; Max Rubner-Institut: Karlsruhe, Göttingen, 2010; pp. 51–67. [Google Scholar]
- Evidence Analysis Library Division, Center for Nutrition Policy and Promotion. A Series of Systematic Reviews on the Relationship Between Dietary Patterns and Health Outcomes; United States Department of Agriculture: Alexandria, Virginia, 2014. [Google Scholar]
- Gibson, R.S. Principles of Nutritional Assessment, 2nd ed.; Oxford University Press: New York, NY, USA, 2005; ISBN 0-19-517169-1. [Google Scholar]
- Oberritter, H.; Schäbethal, K.; von Rüsten, A.; Boeing, H. The DGE-Nutrition Circle—Presentation and Basis of the Food-Related Recommendations from the German Nutrition Society (DGE). Ernährungs Umsch. 2013, 60, 24–29. [Google Scholar]
- U. S. Department of Agriculture. What Is MyPlate? Available online: https://www.myplate.gov/eat-healthy/what-is-myplate (accessed on 11 April 2023).
- National Health and Medical Research Council. Australian Dietary Guidelines Summary; National Health and Medical Research Council: Canberra, Australia, 2013. [Google Scholar]
- Cade, J.; Thompson, R.; Burley, V.; Warm, D. Development, validation and utilisation of food-frequency questionnaires—A review. Public Health Nutr. 2002, 5, 567–587. [Google Scholar] [CrossRef] [PubMed]
- Bethmann, A.; Buschle, C.; Reiter, H. Kognitiv oder qualitativ? Pretest-Interviews in der Fragebogenentwicklung. In Qualitätssicherung Sozialwissenschaftlicher Erhebungsinstrumente; Menold, N., Wolbring, T., Eds.; Springer VS: Wiesbaden, Germany, 2019; pp. 159–193. ISBN 9783658245177. [Google Scholar]
- Terwee, C.B.; Jansma, E.P.; Riphagen, I.I.; de Vet, H.C.W. Development of a methodological PubMed search filter for finding studies on measurement properties of measurement instruments. Qual. Life Res. 2009, 18, 1115–1123. [Google Scholar] [CrossRef] [PubMed]


| Construct | Population | Type of Instrument(s) | Measurement Properties |
|---|---|---|---|
| Diet quality based on FBDGs | Non-pregnant and non-breastfeeding adults 18–65 years old | Screener | Validity, reliability, responsiveness, practicality |
| Type of Instrument | Construct | |||||||
|---|---|---|---|---|---|---|---|---|
| index OR indices OR indicator * OR score * OR assessment OR tool * OR nutrition assessment M; nutritional assessment E | AND | short OR brief OR rapid | AND | Diet * OR nutrition * OR food * | AND | quality OR guideline * | ||
| OR | Screener * | OR | diet, healthy M; healthy diet E | |||||
| Number | Reason | Reference Number |
|---|---|---|
| Reason 1 | Studies whose instruments have been replaced with a newer version | [42] |
| Reason 2 | Studies that do not define diet quality using FBDGs | [43,44,45,46,47,48,49,50,51,52,53] |
| Reason 3 | Screener application (not development) | [54,55,56,57,58,59,60,61] |
| Reason 4 | Questionnaire without directly related scoring | [62,63,64,65] |
| Reason 5 | Evaluation at a nutrient level, rather than food level | [66,67,68] |
| Reason 6 | Reviews, not individual screeners | [11,30,31] |
| Reason 7 | Focus on single food groups | [69] |
| Reason 8 | Questionnaire and/or scoring not available | [70,71] |
| Reason 9 | Scoring without questionnaire | [72,73] |
| Screener, Country, Reference | Referred Guidelines and Standards | Validity and Reliability | Practicality | |||||
|---|---|---|---|---|---|---|---|---|
| Study Type and Approach; If Available: (1) Measurement Properties; (2) Reference Methods; (3) Time between Data Collections; (4) Study Design | Participants | Administration and Scoring Procedure | Mode of Administration (Time Required; Mode) | Recall Period | NCD Management, Clinical Decision Support | Availability | ||
| PHDS, USA, [74] | 2015–2020 Dietary Guidelines for Americans (HEI-2015); Alternative Mediterranean Diet; Dietary Approaches to Stop Hypertension Diet; 2020 AHA Diet Goals | Assessment of screener item comprehension prior to testing | n = 4 expert clinical dietitians, n = 7 student participants, n = 10 patients | Easy, no software needed | 4 min; self-completable | 1 day | n.s. | Completely available |
| Content validity: CVI | CVI: n = 11 expert dietitians; after screener revision: n = 7 experts | |||||||
| Screener scoring algorithm: Comparison of simulated screener responses from adult NHANES 24 h recall data with HEI-2015 components computed from the recalls | NHANES (WWEIA) component: participants n.s. | |||||||
| PYP, USA, [75] | 2015–2020 Dietary Guidelines for Americans; AHA Recommended Dietary Pattern | (1) Content validity (data n.p.) | A team of dietitians specialised in cardiovascular dietetics, experts in nutrition research | Easy, no software needed | 15–20 min; self-completable (readability was checked) | n.s. | Rehabilitation of cardiovascular diseases; interim guidance for interpreting the score | Completely available |
| (1) Relative validity; test–retest reliability; (2) semiquantitative Harvard/Willett FFQ (HWFFQ), AHEI, DASH score; (3) 1 week; (4) crossover design | IC: all English-speaking patients referred to cardiac rehabilitation; validity testing: n = 108, 66 ± 12 y, BMI of 30 ± 6.7 kg/m2, 68% male, 70% primary indication for CR including a recent ischaemia-related cardiac event; test–retest reliability testing: n = 94 | |||||||
| REAP-S, USA, [83] | 2000 US Dietary Guidelines for Americans; Healthy People 2010 objectives; REAP | (1) Assessment of the relationship between REAP-S and HEI (concurrent criterion validity); (2) 1 × 24 h recall, HEI-2010; health outcomes; (4) secondary analysis, data from a cross-sectional study | n = 81 healthy vegetarian and omnivorous adults, n = 27 omnivore, n = 26 vegetarian, n = 28 vegan, age 30.9 (±8.5) y, 70% female, BMI of 22.8 (±2.8) kg/m2 | Easy, no software needed | n.s.; self-completable (readability was checked) | 1 week | n.s. | Completely available |
| REAP, USA, [84] | 2000 US Dietary Guidelines for Americans; Healthy People 2010 objectives | Feasibility study: quantitative survey using scale questions | n = 61 medical students, practicing physicians | Easy, no software needed | ca. 10 min; self-completable (readability was considered) | 1 week | ‘Physician Key’ to aid physicians in diet assessment and counselling | Completely available |
| (1) Relative validity; (2) 3-d FR, HEI; (4) crossover design | n = 41 s-year medical students | |||||||
| Cognitive assessment testing: interviews | n = 31 staff, students (varying socioeconomic background), age of 32 (20–61) y, 62% female, 50% people of colour, 96% > college education, 76% income < USD 59,000 | |||||||
| Validity and reliability (modified REAP based on the first three studies): (1) relative validity, test–retest reliability; (2) FFQ (by Fred Hutchinson Cancer Research) | IC: CS, >18 y, able to speak and read English; n = 94, 57% women, mean age of 43.2 (SD: 12.5) y, 94% non-Hispanic white, 57% high school graduates, median income range of USD 51,000–60,000. | |||||||
| REAP-S, USA, [85] | 2000 US Dietary Guidelines for Americans; Healthy People 2010 objectives | (1) Relative validity; (2) Block 1998 FFQ; (4) crossover design | n = 110 medical students, mean age of 24.2 (SD: 3.8) y, mean BMI of 23.4 (SD: 5.0) kg/m2, 53% male, 65% white | Easy, no software needed | n.s.; self-completable (readability was considered) | 1 week | Management of prediabetes | Completely available |
| RDGI, AUS, [86] | Australian Dietary Guidelines; existing scores | Comparison of three indices: RDGI, S-RDGI1 and S-RDGI2 (containing different numbers of items); secondary analysis, data from quasi-experimental, longitudinal study (evaluating the impact of “Liveable Neighbourhoods Community Design Guidelines” on participant health and behaviour); associations between participant characteristics and RDGI scores | n = 555, age of 47.9 (SD: 11.9) y, 61.8% female, 37.3% with BMI 18.5–29.9 kg/m2, 35.9% with BMI 25–29.9 kg/m2, 33.7% with secondary education or less, 38.8% trade/apprentice/certificate, 56.8% income > AUD 90,000 | Easy, no software needed | n.s.; self-completable | n.s. | n.s. | Completely available |
| SFS, AUS, [80] | 2013 Australian Dietary Guidelines; existing scores | (1) Relative validity; test–retest reliability; (2) 3 × 24 h recalls (one weekend, two weekdays; 3-pass method); (3) 2 weeks; (4) crossover design | IC: CS, 19–50 years, living in Australia, adequate written and spoken English knowledge, internet access, no conditions affecting dietary intake and no plans to initiate dietary changes within the next month; n = 61, age of 34.1 (24–44) y, 72% female, >50% resided in higher socioeconomic areas | Easy, no software needed | n.s.; n.s. | n.s. | n.s. | Available with missing information |
| ARFS, AUS, [82] | Australian Dietary Guidelines; AES FFQ | Relative validity; test–retest reliability; (2) AES-FFQ; (3) 5 months; (4) secondary analysis, data from a crossover design | n = 96 (baseline); n = 67 (follow up); 48 females, BMI of 23.5 (22–26) kg/m2, 77% certificate/degree/postgrad; 31 males, BMI of 25.7 (24–28) kg/m2, 75% certificate/degree/postgrad | Easy, no software needed | 10 min; self-completable | 6 months (basic FFQ) | n.s. | Completely available |
| ARFS, AUS, [81] | Australian Dietary Guidelines; AES FFQ | (1) Relative validity; (2) biomarker: plasma carotenoid concentrations; (4) secondary analysis, data from a crossover design | IC: subset of participants from a previous weight loss RCT, overweight/obese, age of 18–30 y; n = 99, age of 44.6 (SD: 9.9) y, 94.5% female, BMI of 31.8 (SD: 3.8) kg/m2 | Easy, no software needed | 10 min; self-completable | 6 months (basic FFQ) | n.s. | Completely available |
| 15-Item FFQ, SWE, [83] | Nutrition Recommendations 2012; national indicators | (1) Criterion validity; (2) health outcomes: cardiovascular risk factors; (4) crossover design | IC: random sample of every fifth man and woman born in 1963 and living in the city of Gothenburg; n = 521, 51% women, BMI: 26.2 (SD: 4.42) kg/m2, 49.7% with university/college education | Easy, no software needed | n.s.; n.s. | Habitual consumption | Management of cardiovascular diseases; overall score ranking | Completely available |
| FBDQS, FIN, [84] | Nordic Nutrition Recommendations 2012; Finnish Nutrition Recommendations 2014; IDQ | (1) Relative validity; (2) 3-d FR (completed 4 years before testing the screener); (4) crossover design | Sample derived from wave five of the population-based FinnTwin16 (FT16) cohort study; main FT16 sample n = 3592, 56% females, n = 1878 with tertiary education, participants with lower DQ: BMI of 25.4 (25.2–25.7) kg/m2, participants with higher DQ: 24.2 (24.0–24.4) kg/m2, subsample with food diaries: n = 249 | Easy, no software needed | n.s.; n.s. | 12 months | Overall score ranking | Available with missing information |
| IDQ, FIN, [85] | Nordic Nutrition Recommendations 2004; current scientific evidence | Pilot testing | n = 14 healthy adults | Easy, no software needed | n.s.; self-completable | n.s. | Overall score ranking | Completely available |
| (1) Relative validity; (2) 7-d FR; (4) crossover design | IC: healthy Finnish adults, age of 20–64 y; n = 103, mean age of 32 y, 83% women, 48% students, 77% BMI < 25 kg/m2, 46% following special diet | |||||||
| SCASA, CHE, [86] | Swiss Dietary Guidelines 2011; existing scores | Content and face validity using interviews | n = 4 experts, n = 15 lay volunteers (heterogeneous regarding age, gender, socioeconomic status, BMI; without nutritional knowledge) | Easy, no software needed | n.s.; self-completable | n.s. | n.s. | Completely available upon request |
| Internal consistency by pretesting SCASA | n = 30 lay volunteers (second-year bachelor’s students at the Geneva School of Health Sciences) | |||||||
| Construct validity by evaluating the ability of SCASA to discriminate balanced from imbalanced meal plans | n = 6 weekly meal plans created by dietitians | |||||||
| (1) Inter-method reliability; (2) 5–7-d FR; (4) crossover design | n = 105 lay volunteers, age of 30 (SD: 13.7) y, 73% women | |||||||
Disclaimer/Publisher’s Note: The statements, opinions and data contained in all publications are solely those of the individual author(s) and contributor(s) and not of MDPI and/or the editor(s). MDPI and/or the editor(s) disclaim responsibility for any injury to people or property resulting from any ideas, methods, instructions or products referred to in the content. |
© 2023 by the authors. Licensee MDPI, Basel, Switzerland. This article is an open access article distributed under the terms and conditions of the Creative Commons Attribution (CC BY) license (https://creativecommons.org/licenses/by/4.0/).
Share and Cite
Hoffmann, L.; Egert, S.; Allgaier, J.; Kohlenberg-Müller, K. Review of Validated Methods to Evaluate Diet History in Diet Therapy and Counselling: An Overview and Analysis of Screeners Based on Food-Based Dietary Guidelines. Nutrients 2023, 15, 4654. https://doi.org/10.3390/nu15214654
Hoffmann L, Egert S, Allgaier J, Kohlenberg-Müller K. Review of Validated Methods to Evaluate Diet History in Diet Therapy and Counselling: An Overview and Analysis of Screeners Based on Food-Based Dietary Guidelines. Nutrients. 2023; 15(21):4654. https://doi.org/10.3390/nu15214654
Chicago/Turabian StyleHoffmann, Laura, Sarah Egert, Joachim Allgaier, and Kathrin Kohlenberg-Müller. 2023. "Review of Validated Methods to Evaluate Diet History in Diet Therapy and Counselling: An Overview and Analysis of Screeners Based on Food-Based Dietary Guidelines" Nutrients 15, no. 21: 4654. https://doi.org/10.3390/nu15214654
APA StyleHoffmann, L., Egert, S., Allgaier, J., & Kohlenberg-Müller, K. (2023). Review of Validated Methods to Evaluate Diet History in Diet Therapy and Counselling: An Overview and Analysis of Screeners Based on Food-Based Dietary Guidelines. Nutrients, 15(21), 4654. https://doi.org/10.3390/nu15214654