Diosgenin Targets CaMKK2 to Alleviate Type II Diabetic Nephropathy through Improving Autophagy, Mitophagy and Mitochondrial Dynamics

Abstract
1. Introduction
2. Materials and Methods
2.1. Materials and Antibodies
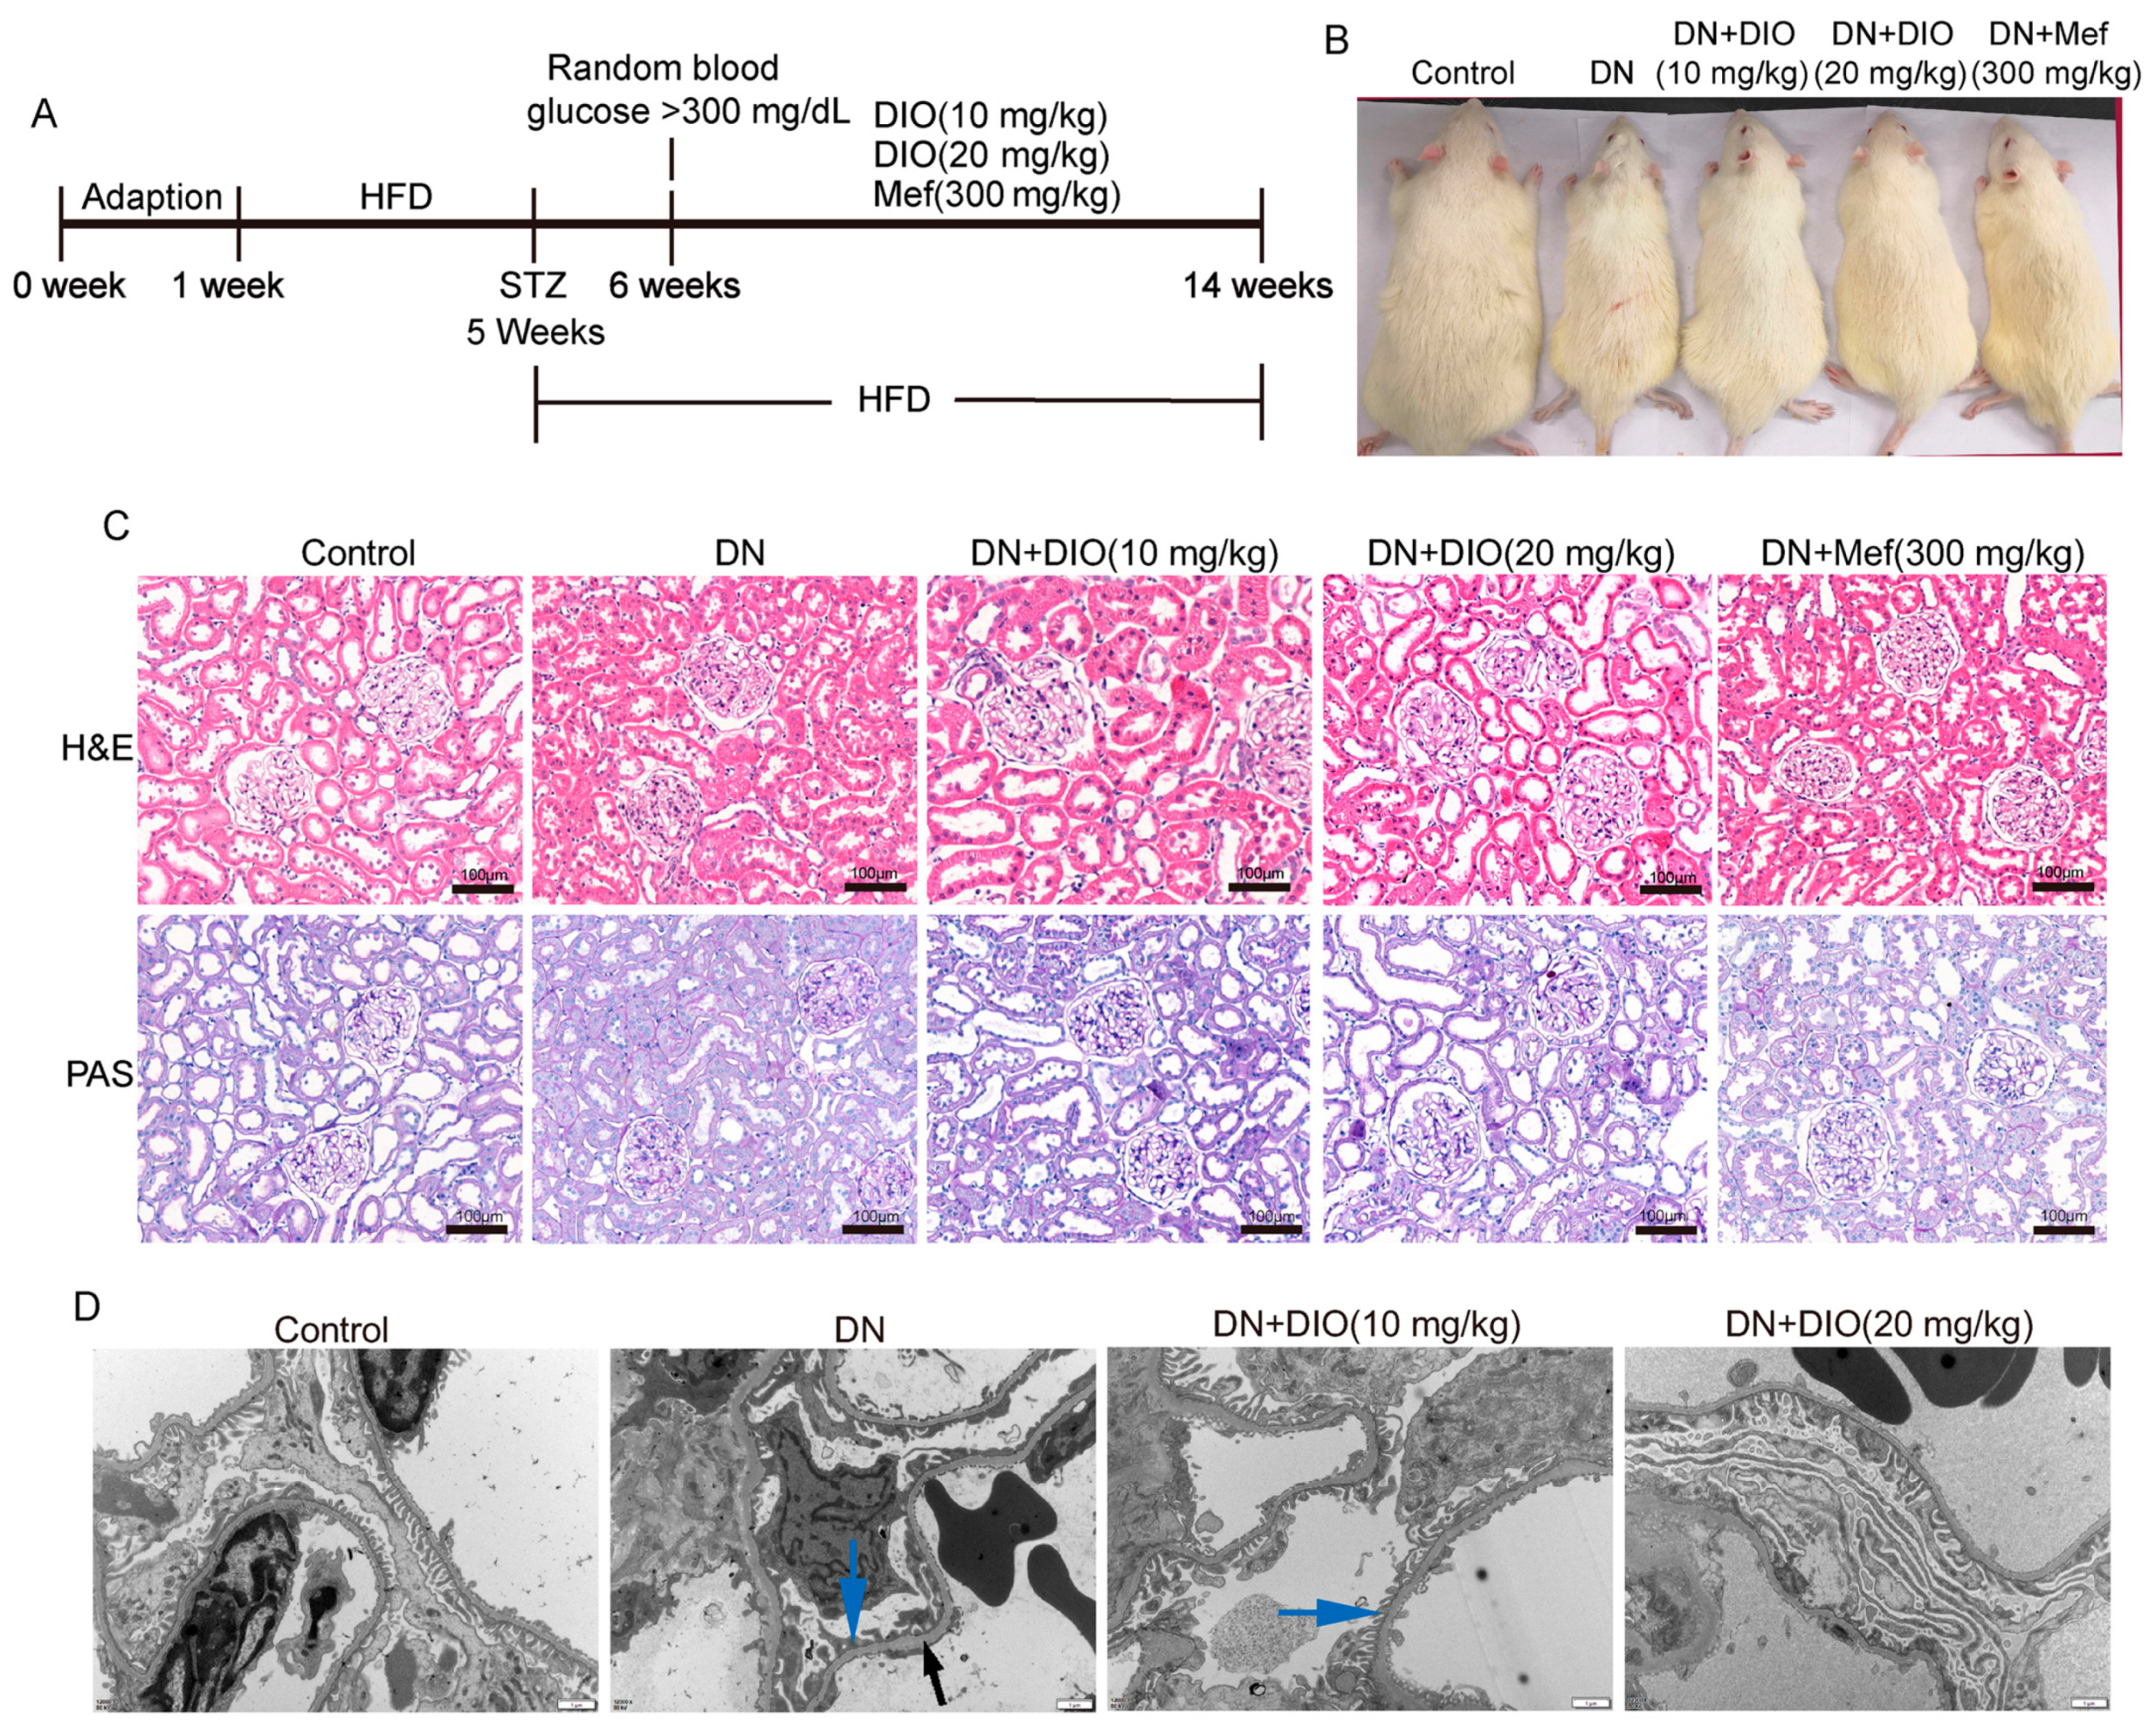
2.2. Animals and Treatments
2.3. Measurement of Biochemical Index
2.4. Histological Analysis
2.5. Transmission Electron Microscope (TEM) Analysis
2.6. Cell Culture and Treatments
2.7. Measurement of Cell Viability
2.8. Measurement of Cell Apoptosis
2.9. Molecular Docking
2.10. siRNA Sequence and Transfection
2.11. MitoTracker Red Staining
2.12. Immunofluorescence Assay
2.13. Immunohistochemistry Assay
2.14. Western Blot Assay
2.15. Statistical Analysis
3. Results
3.1. DIO Relieved Diabetic Nephropathy in Rats
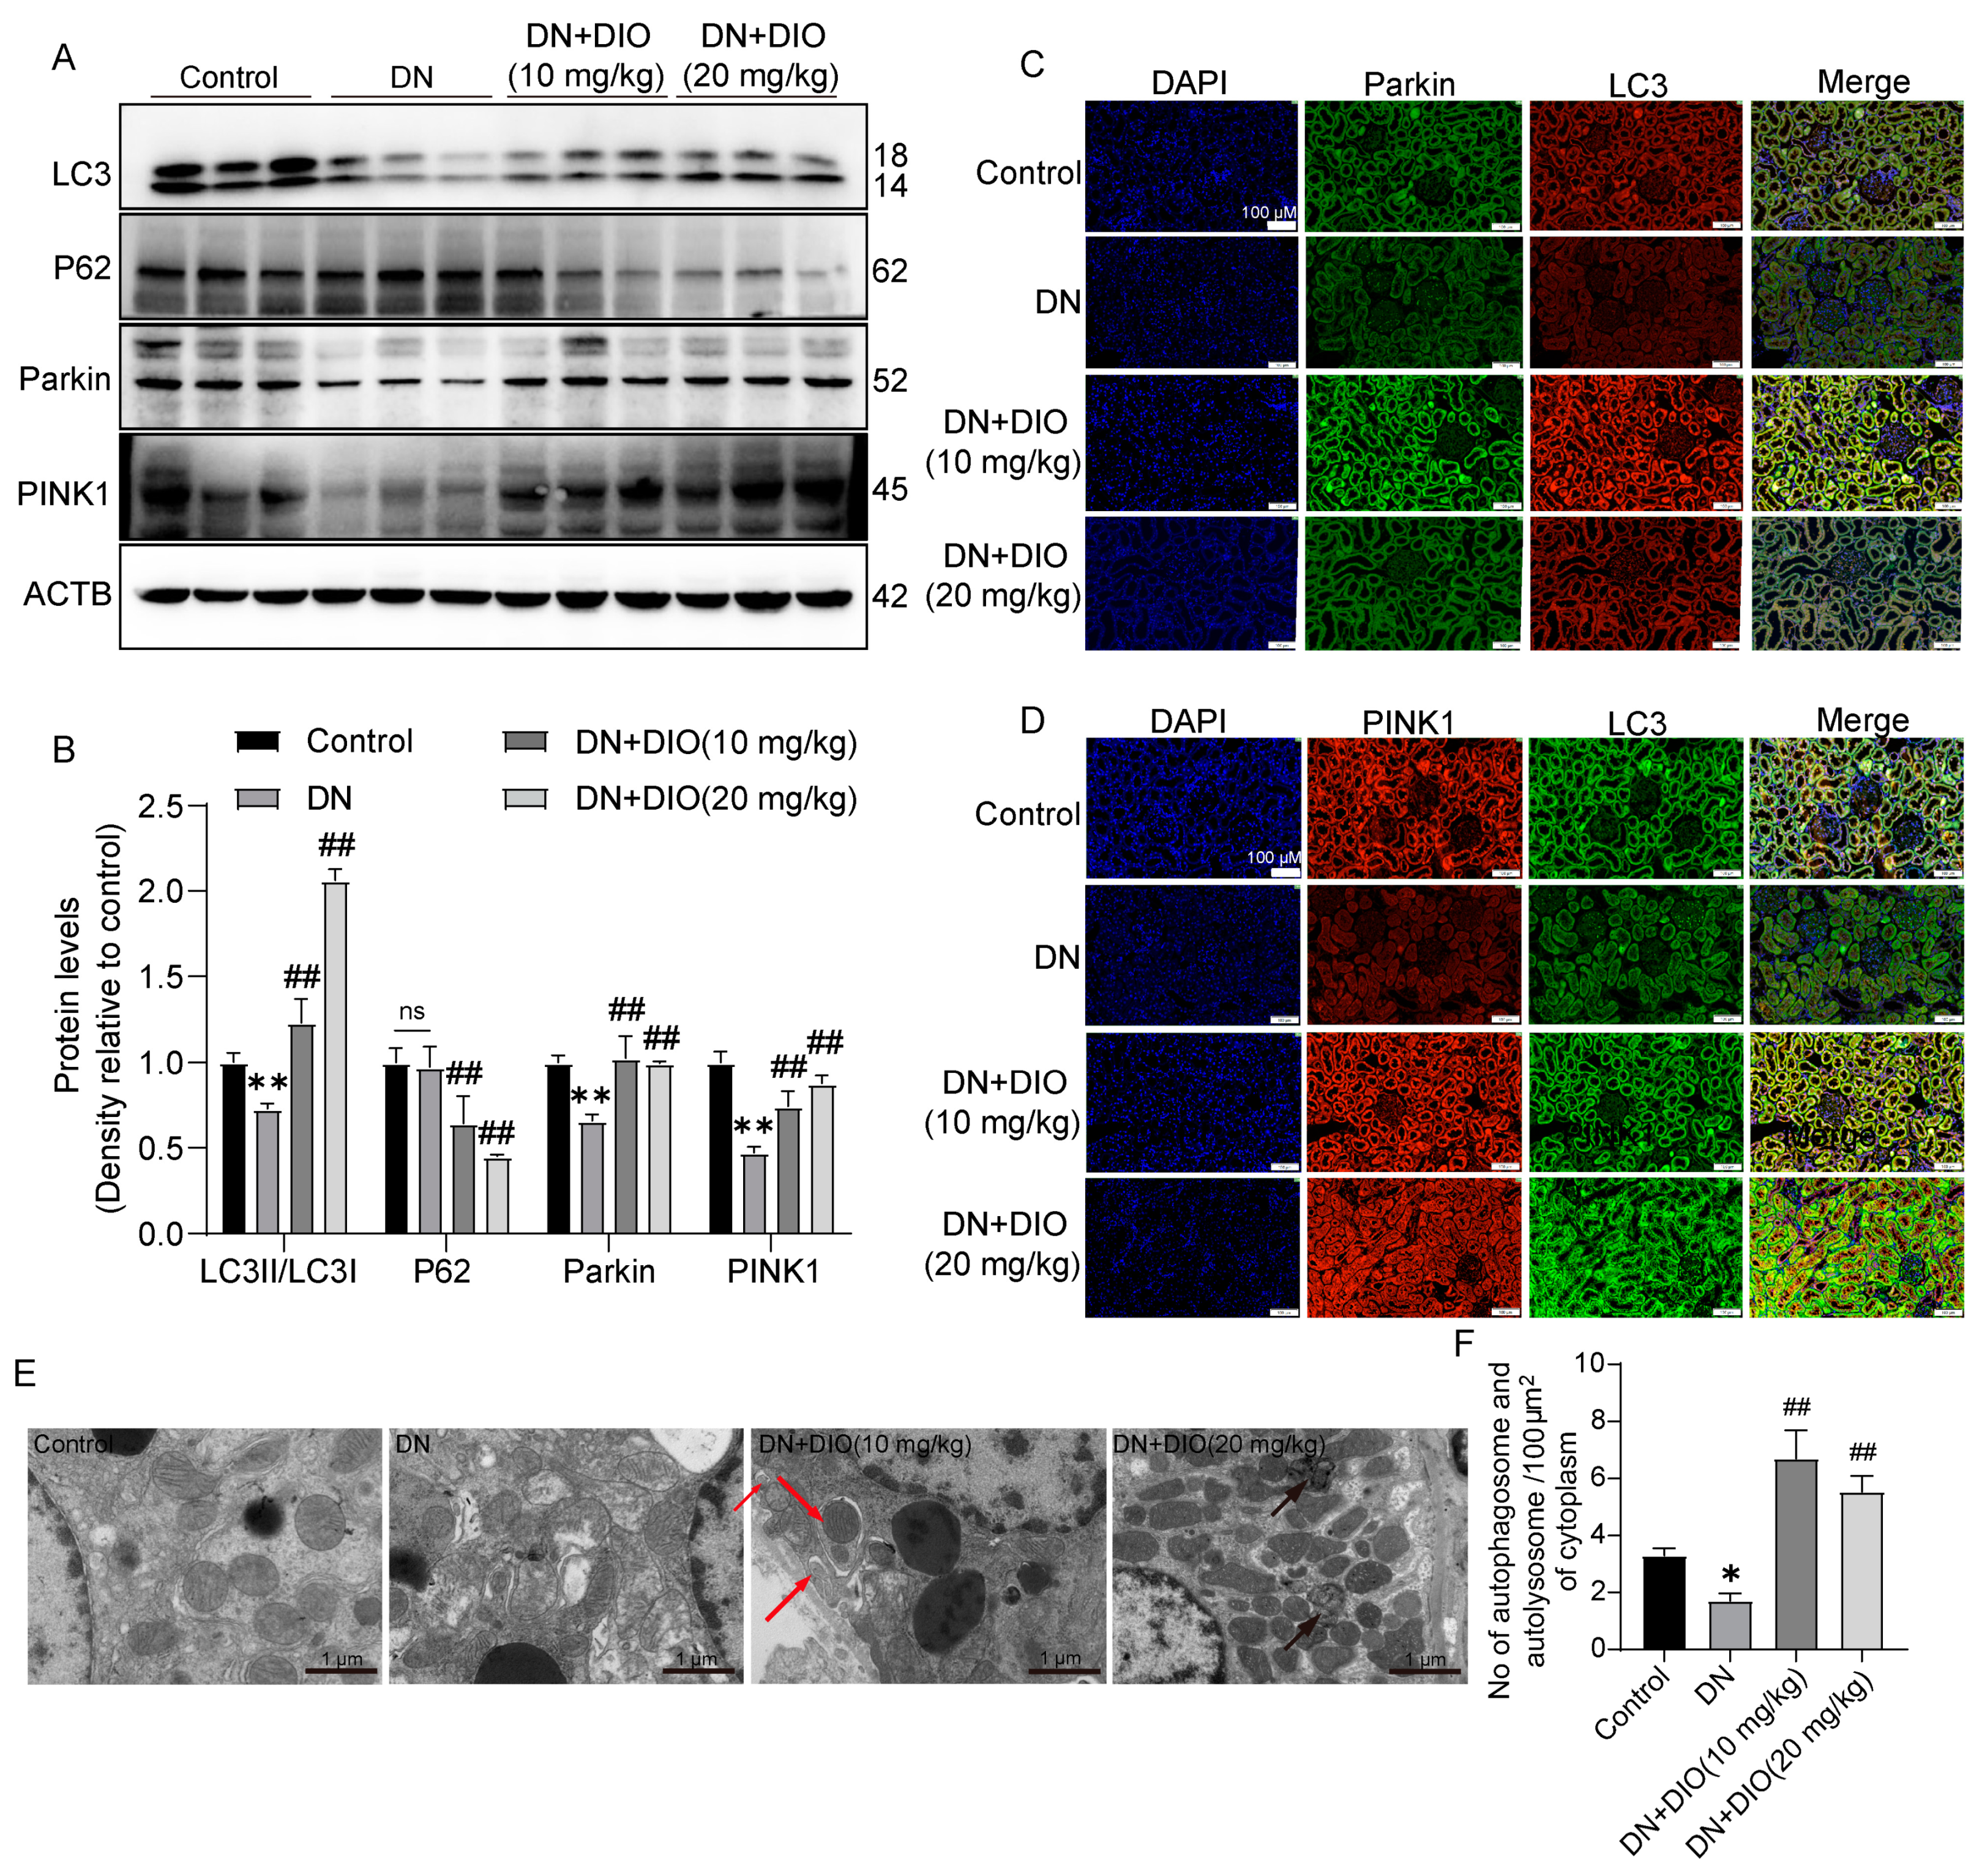
3.2. DIO Improved Autophagy and Mitophagy in DN Rats
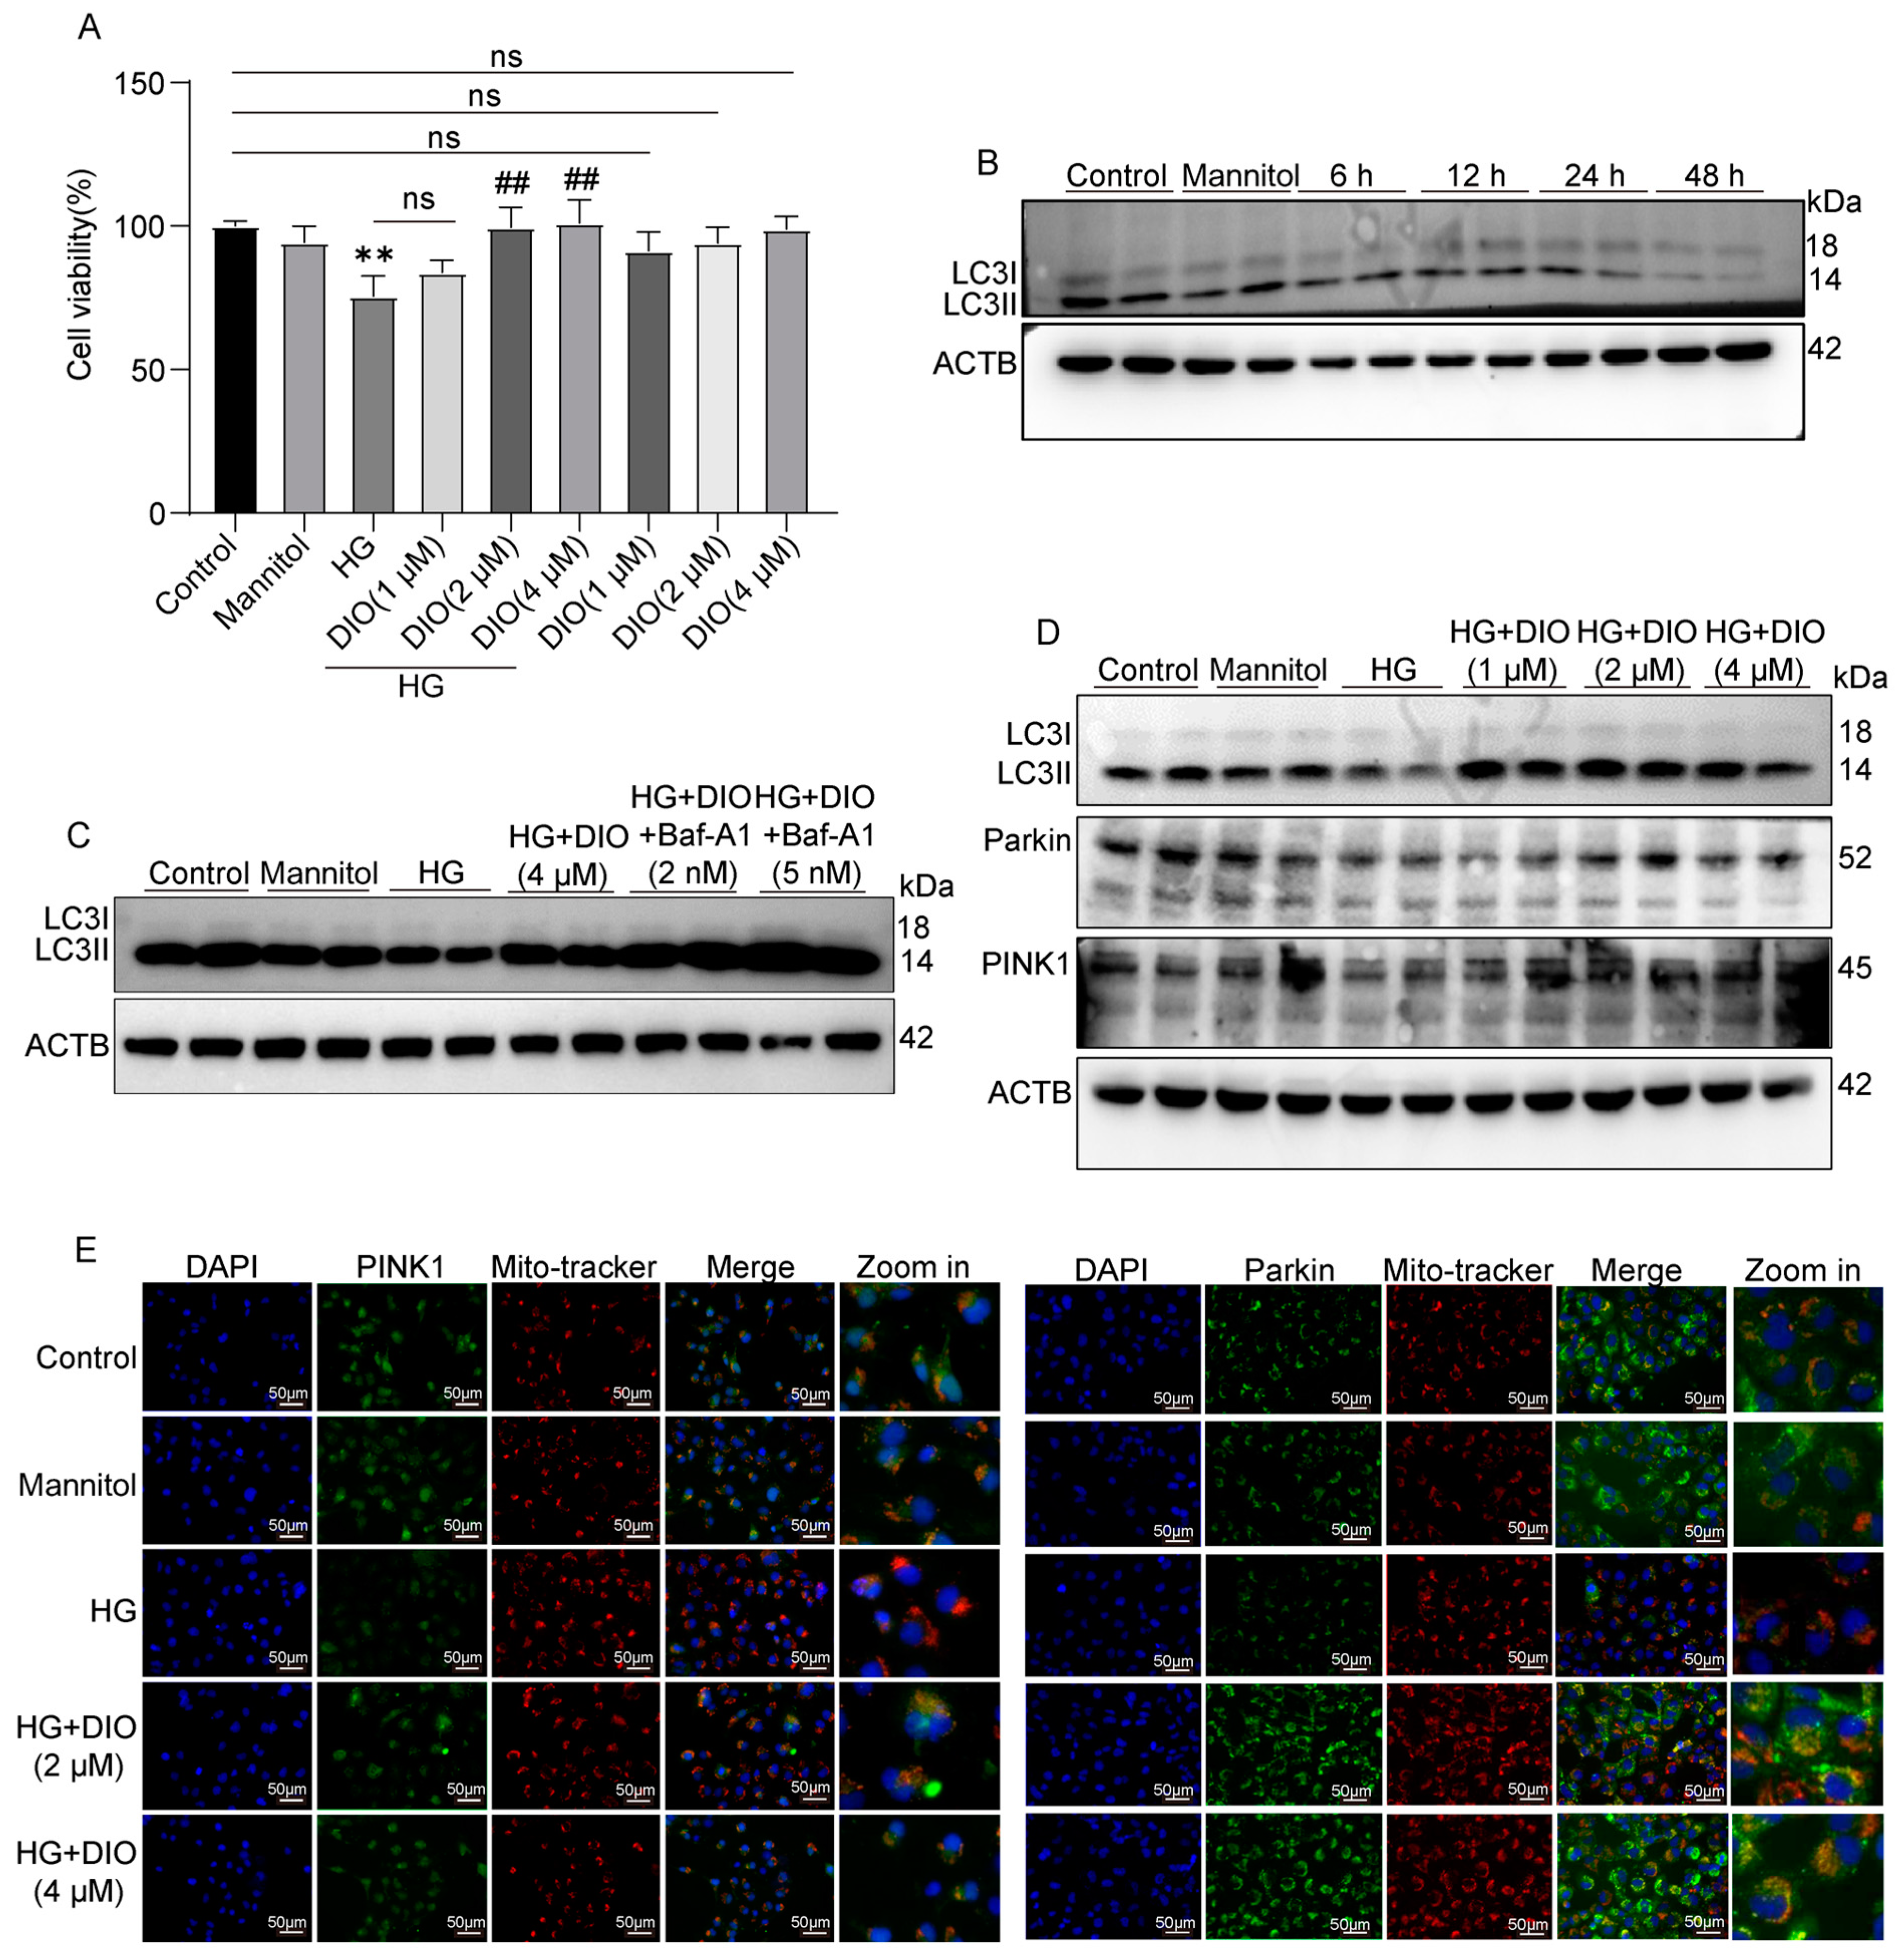
3.3. DIO Increased Autophagy and Mitophagy in HK-2 Cells Treated with HG
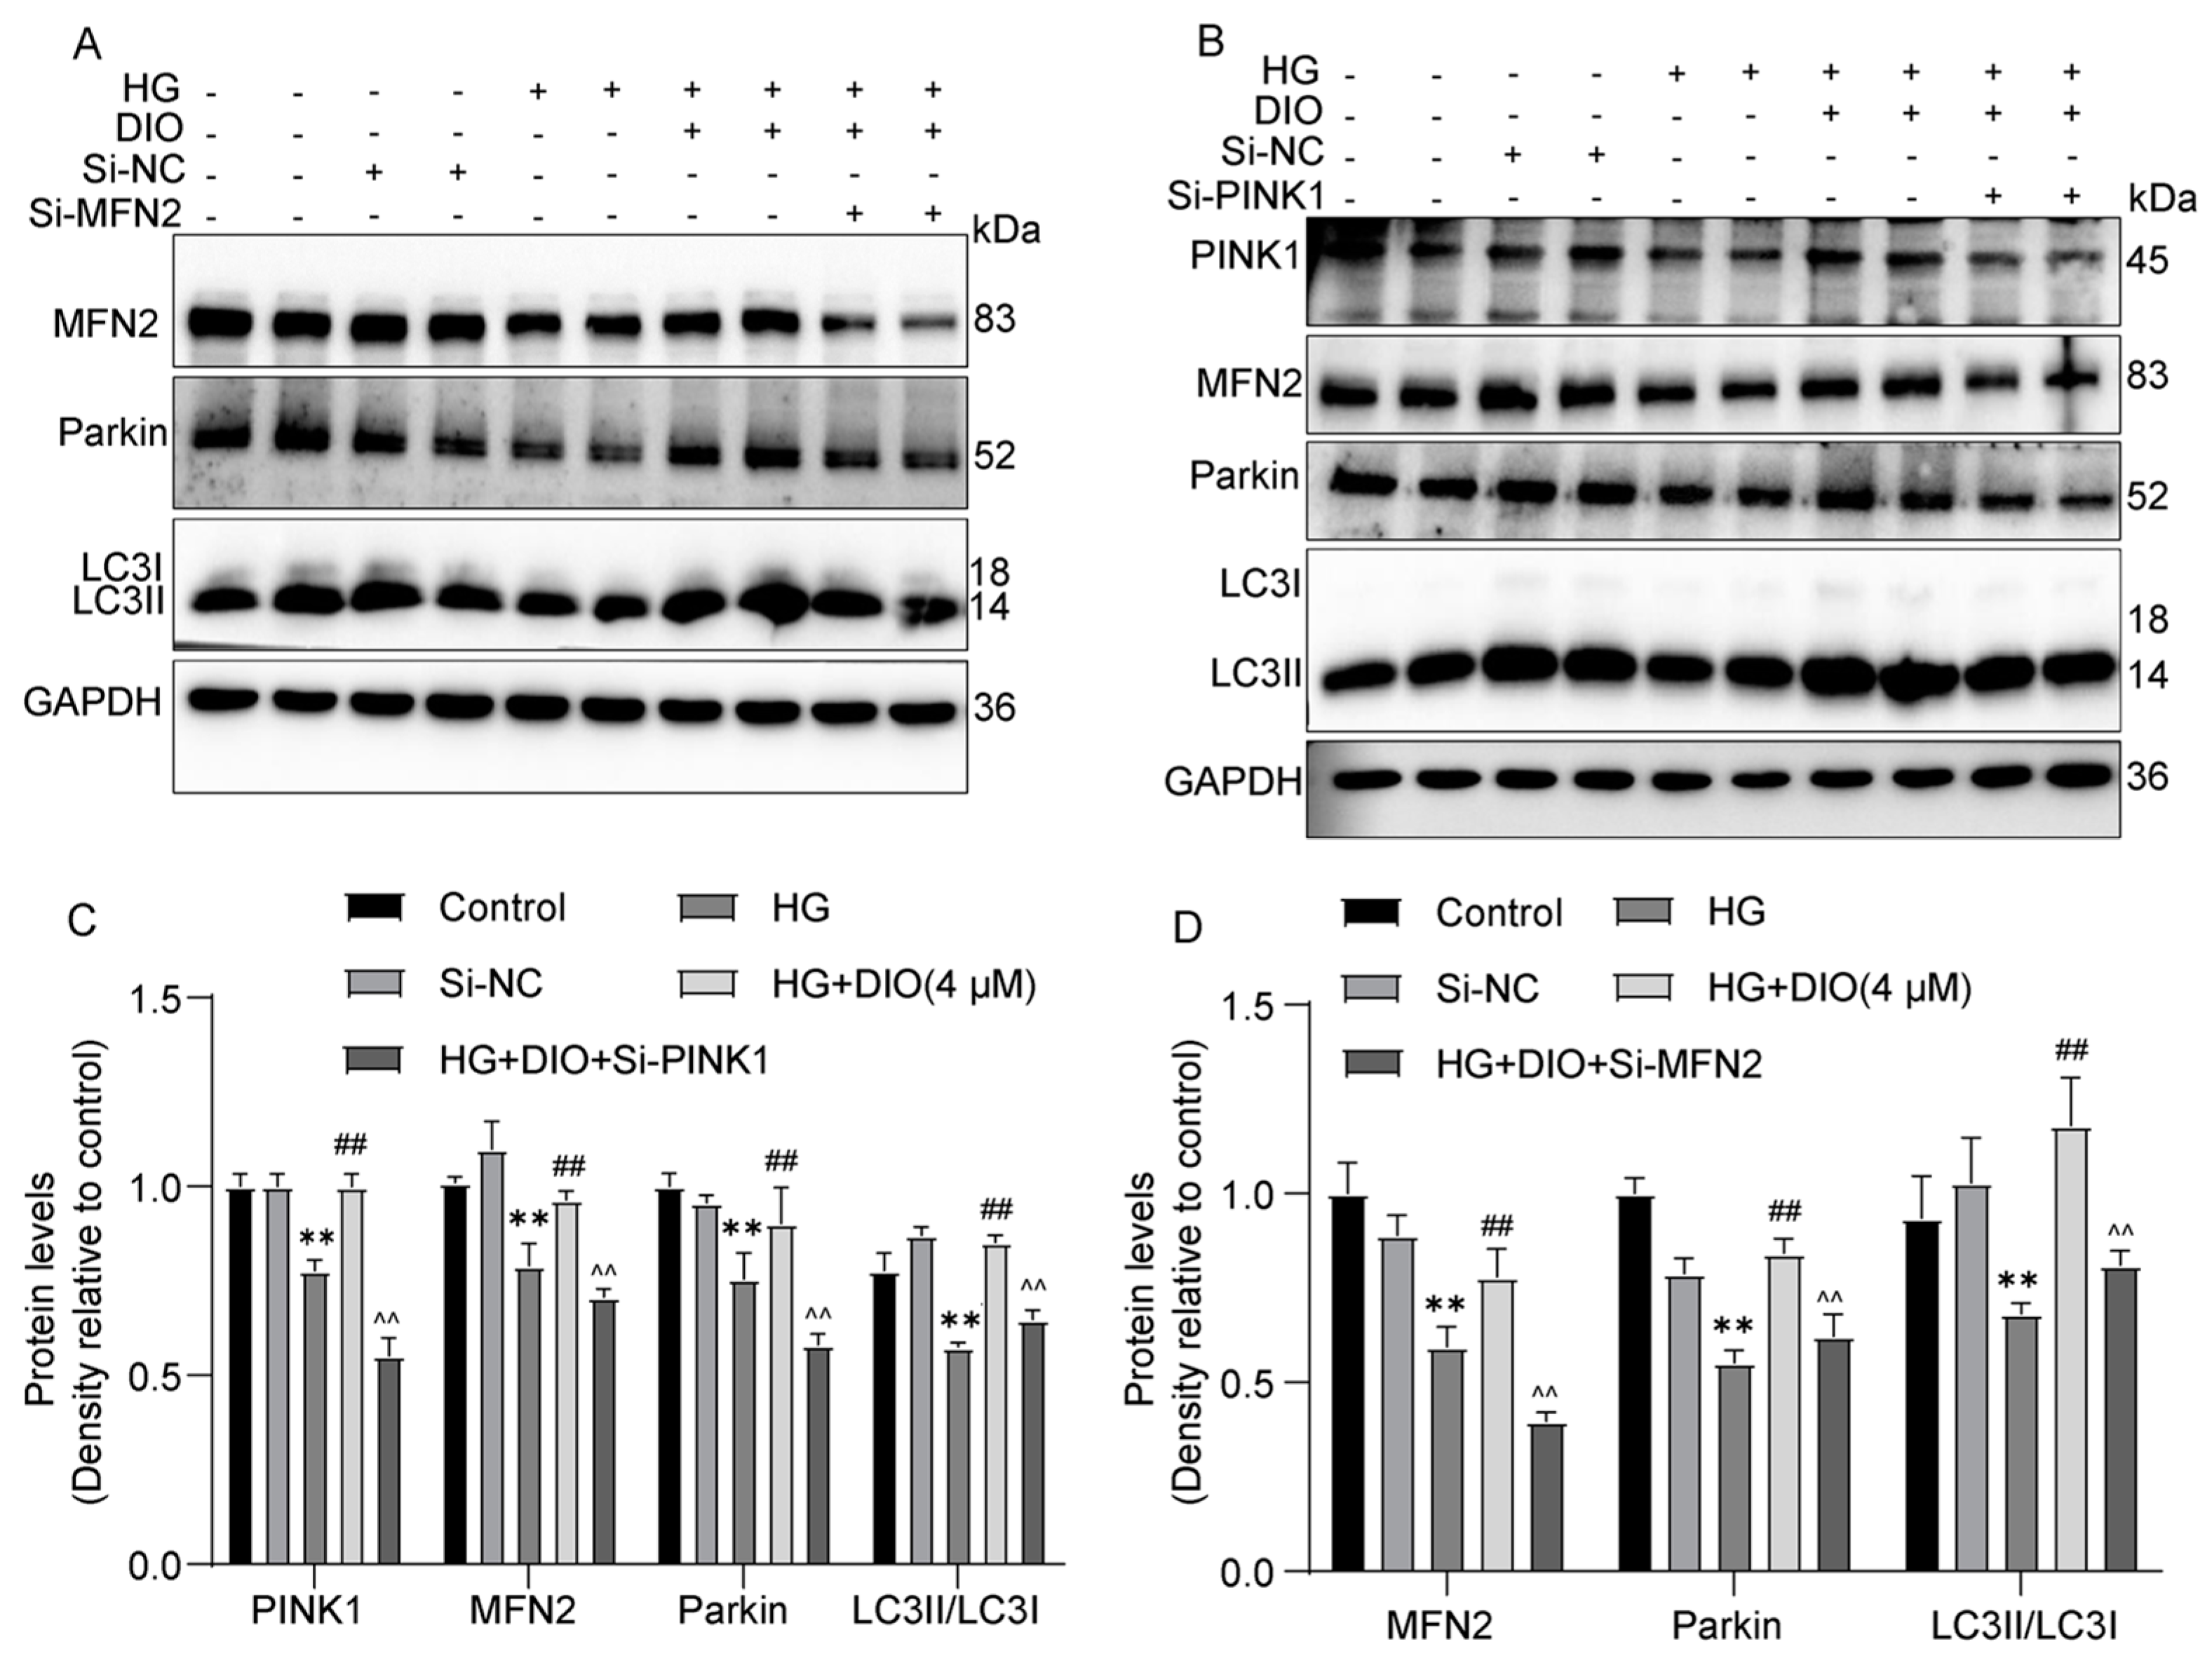
3.4. DIO Enhanced Mitophagy through the PINK1-MFN2-Parkin Pathway
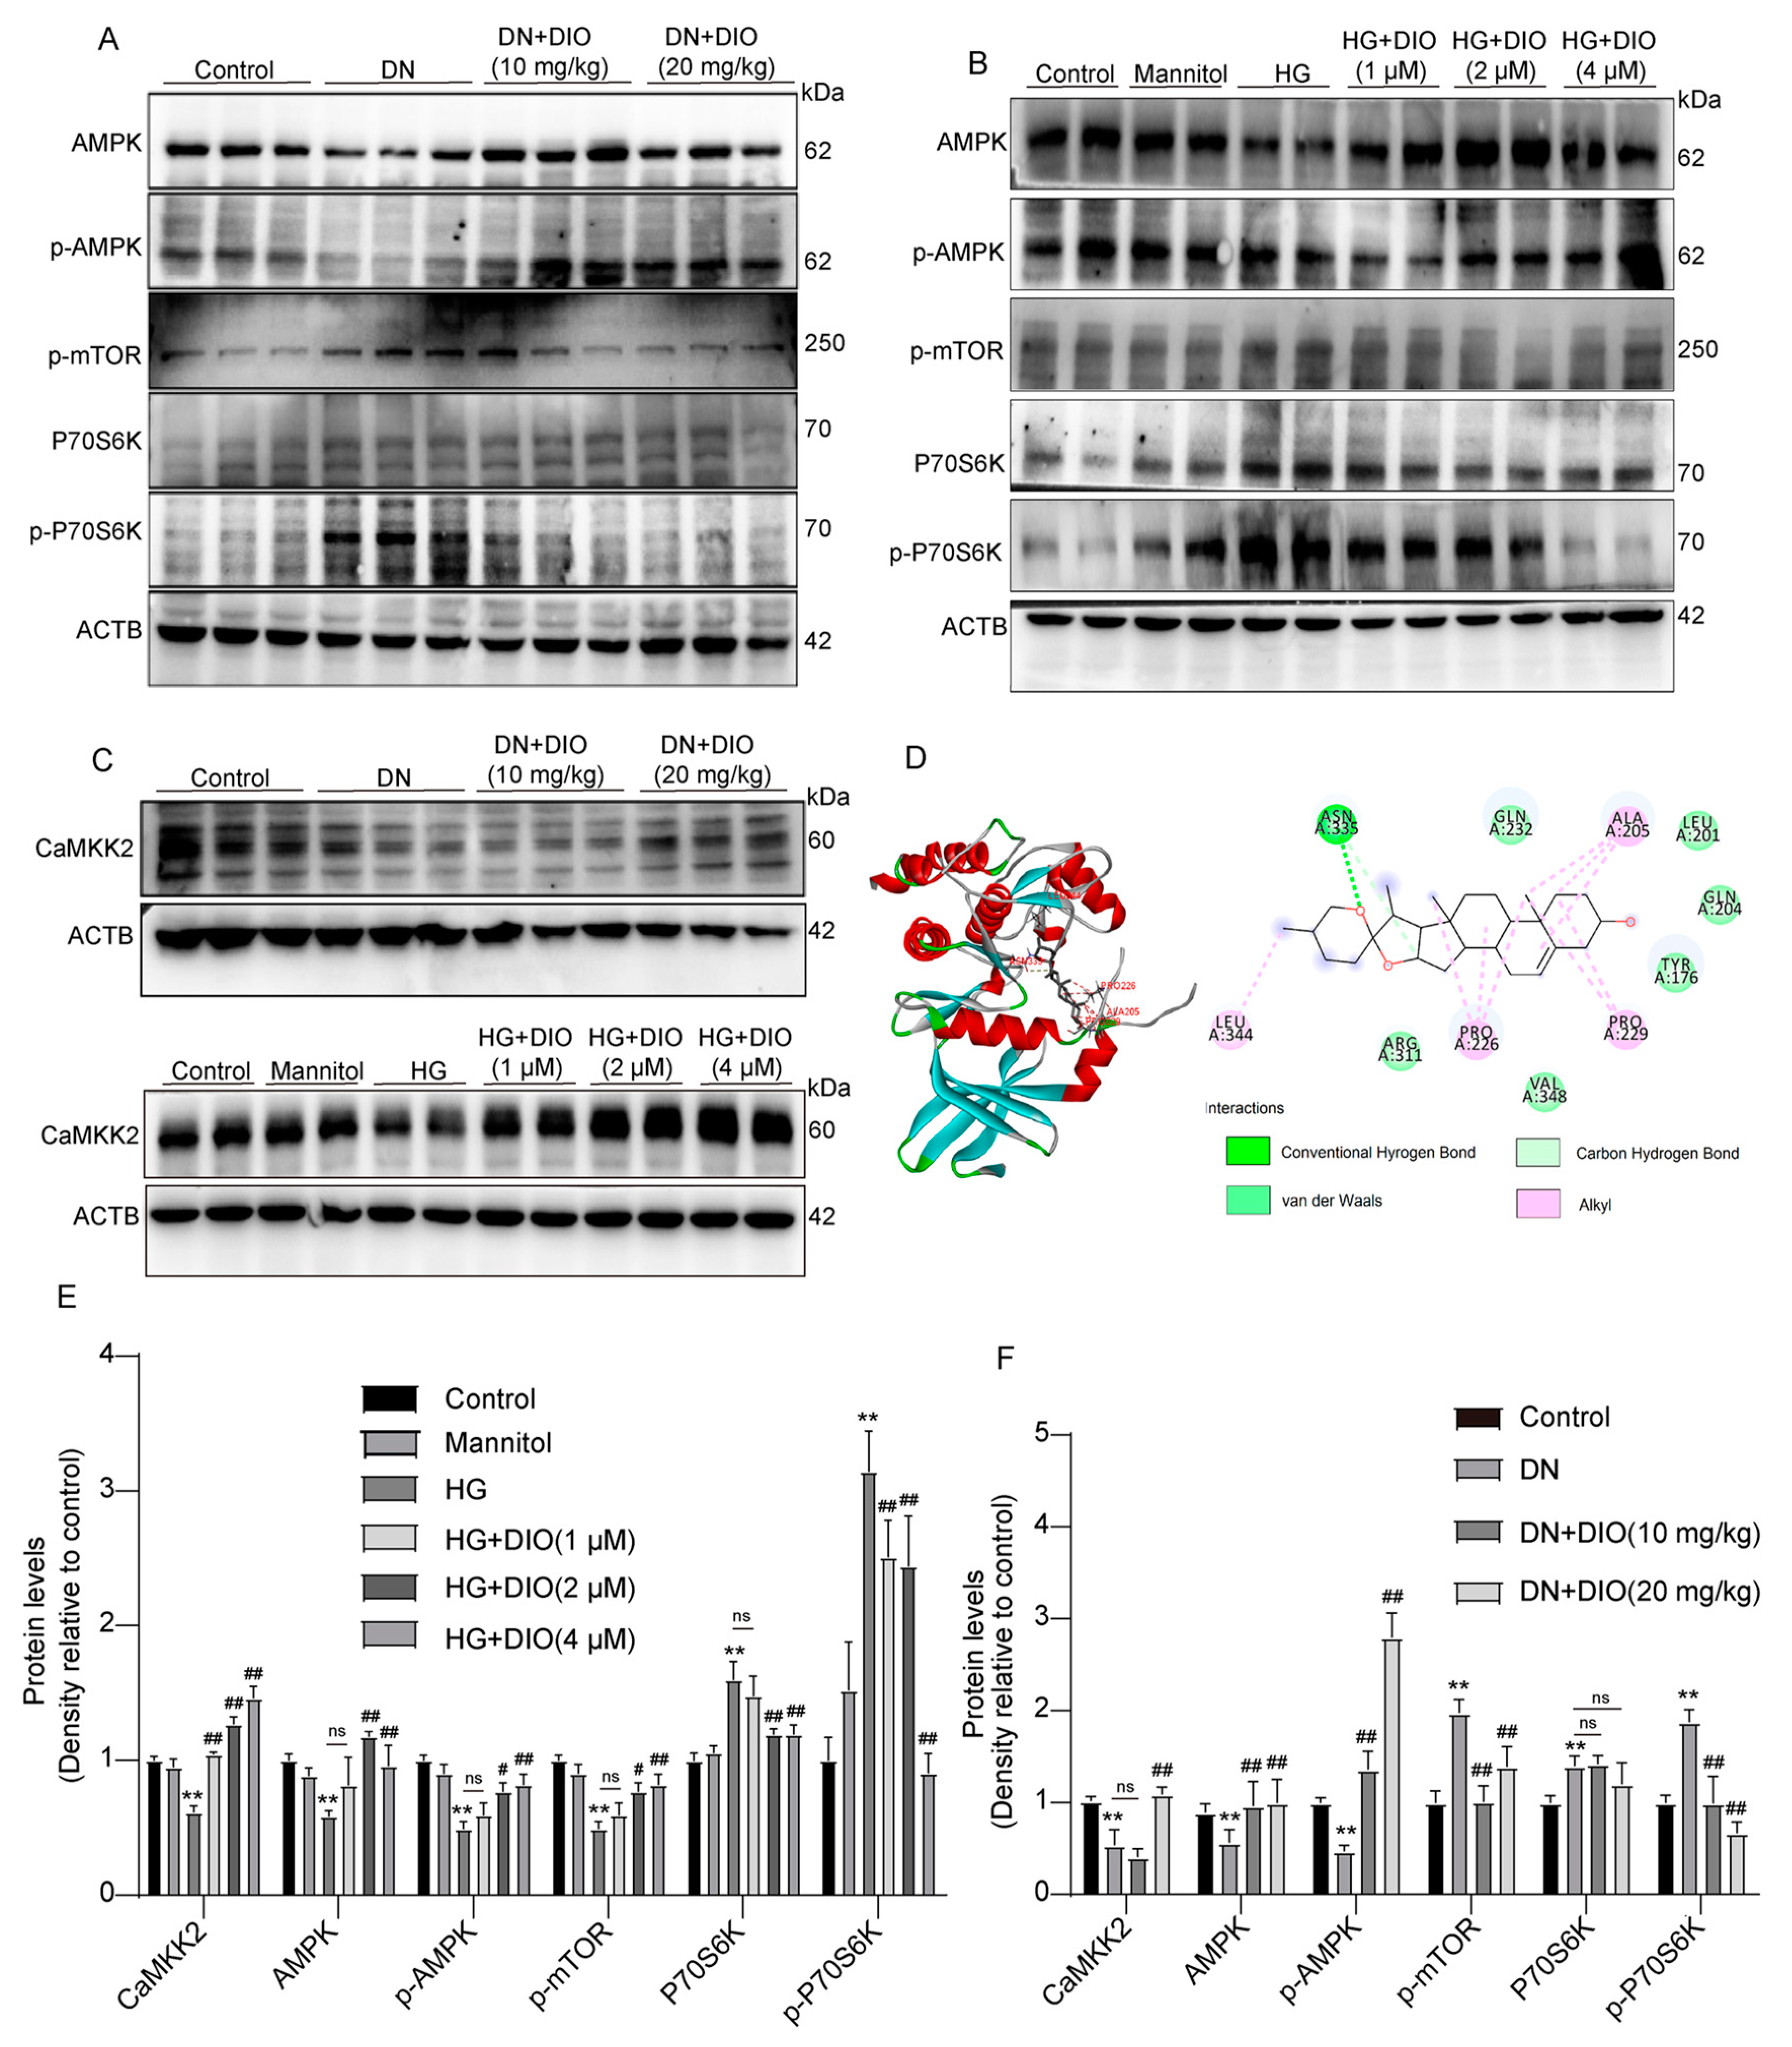
3.5. DIO Activated Autophagy via the AMPK-mTOR Pathway and Enhanced CaMKK2 Expression
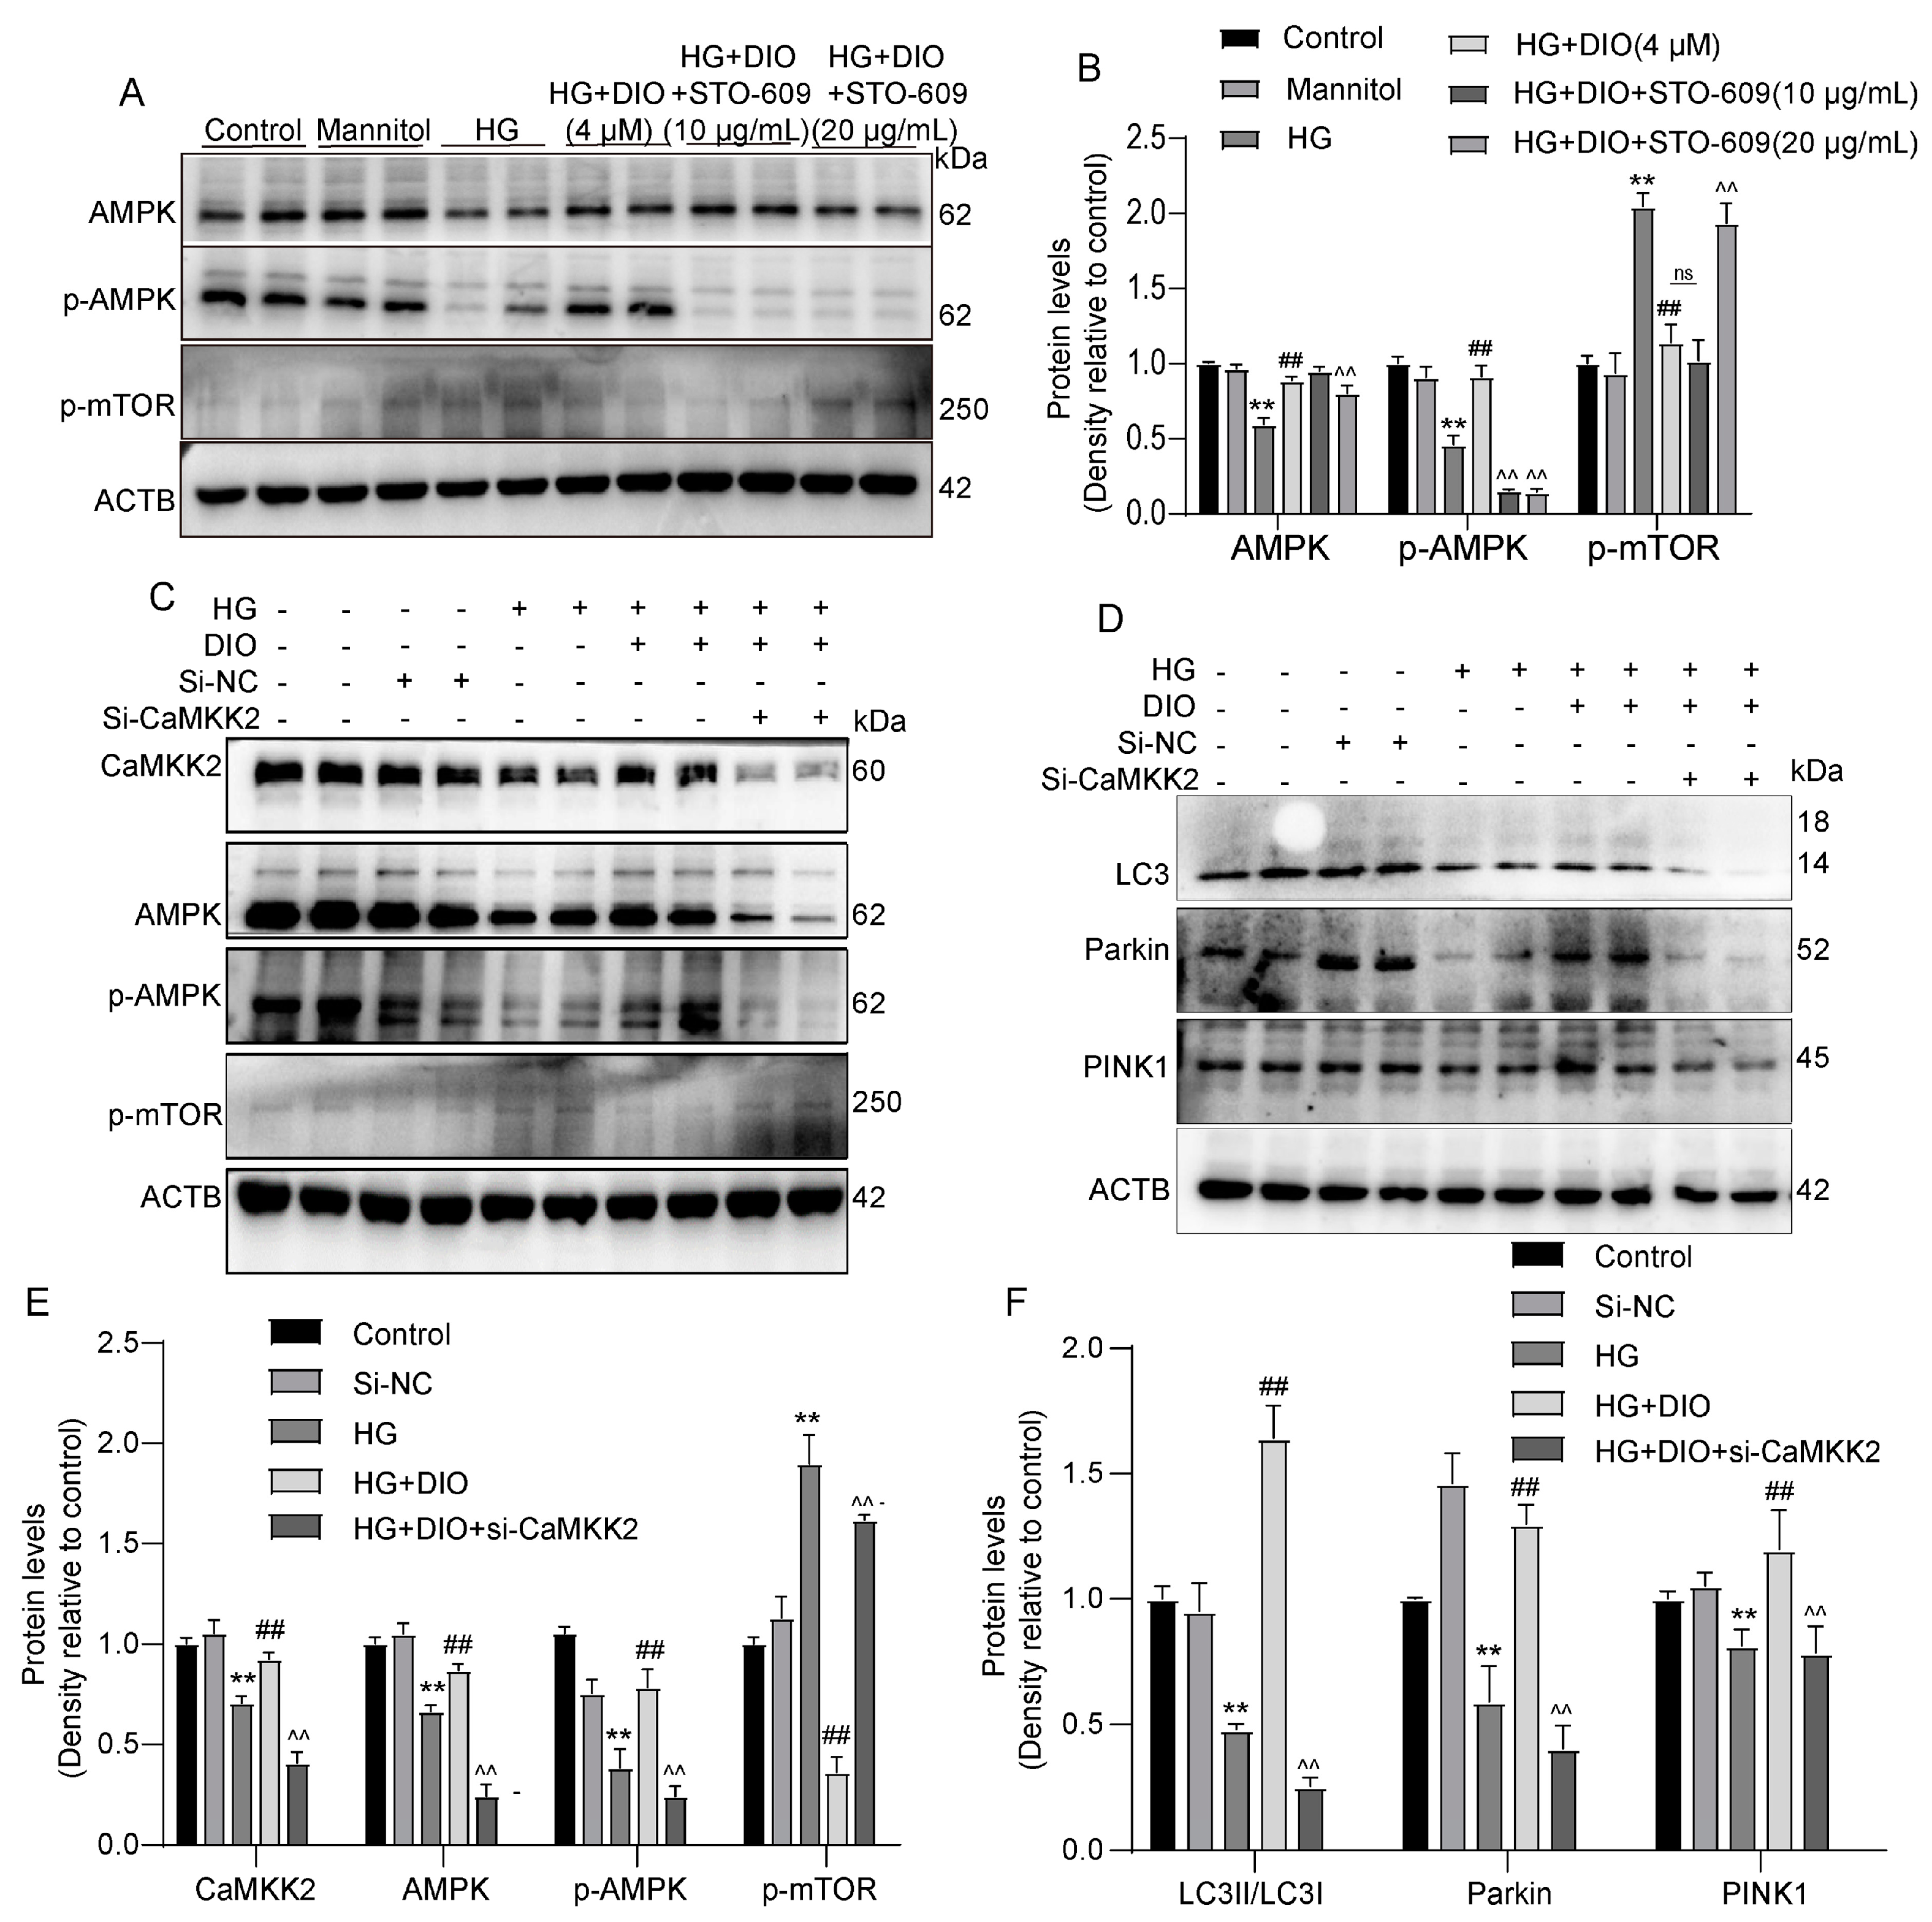
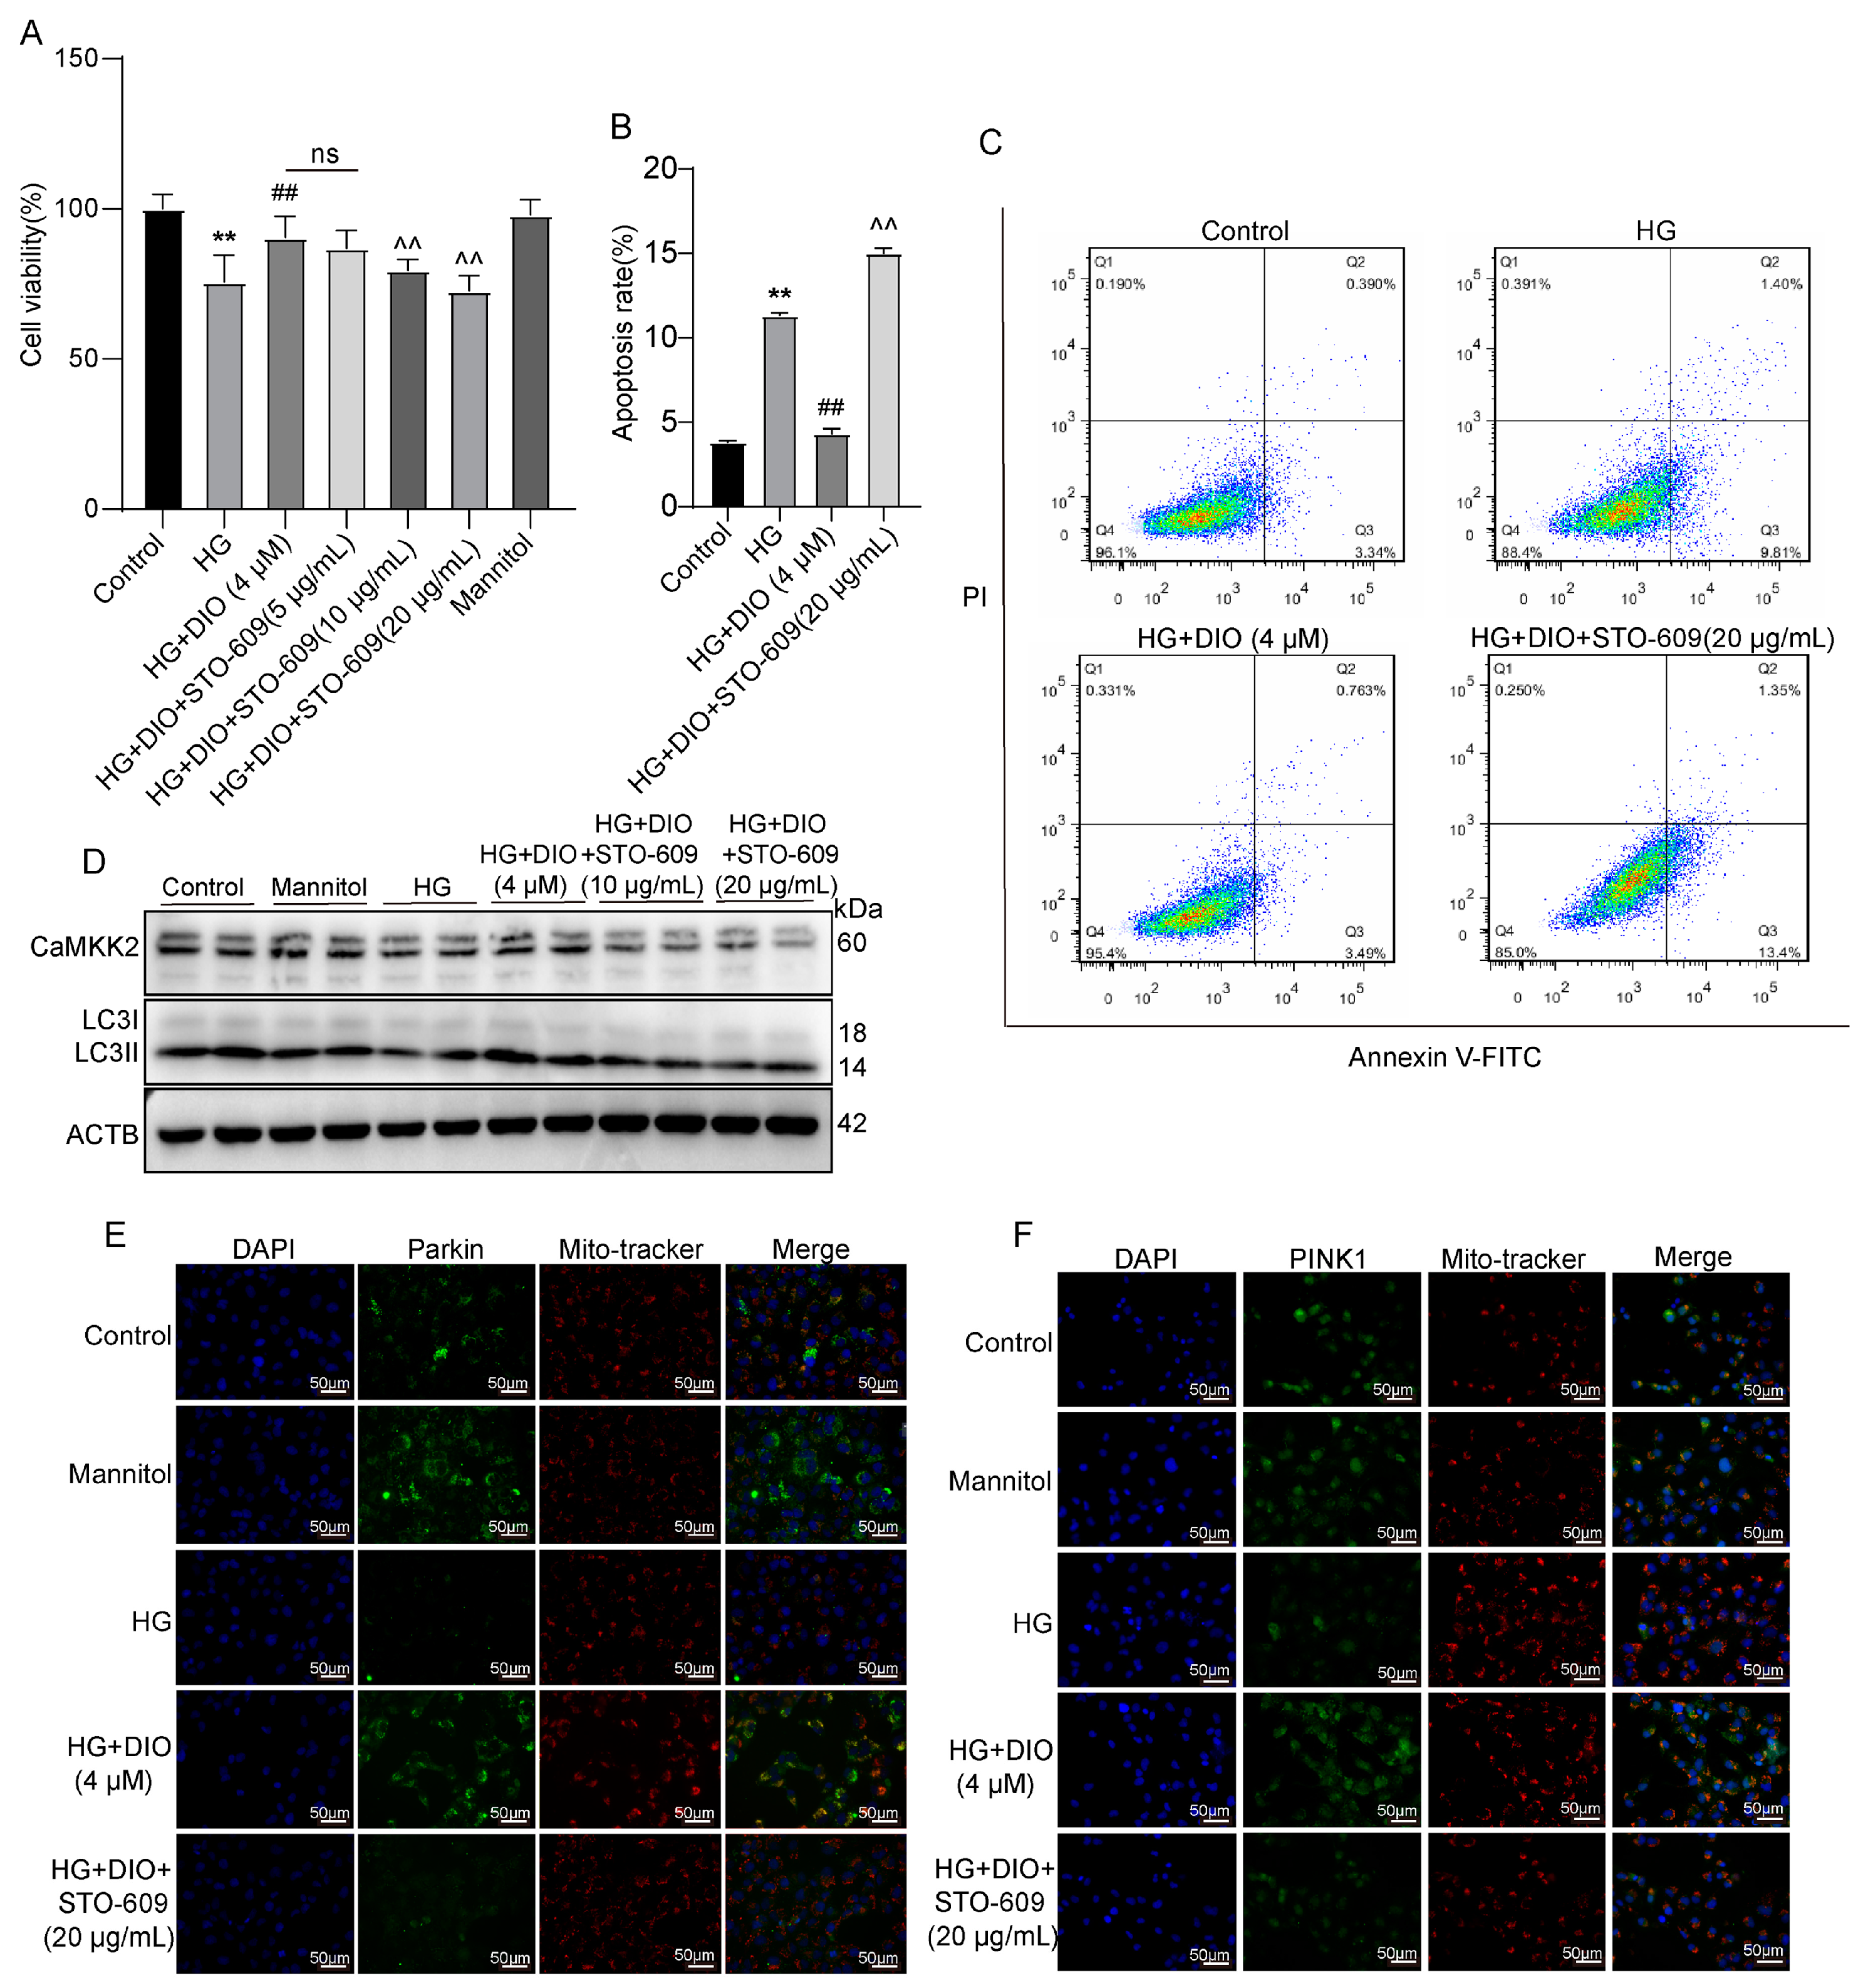
3.6. DIO Induced Autophagy and Mitophagy in a CaMKK2-Dependent Manner
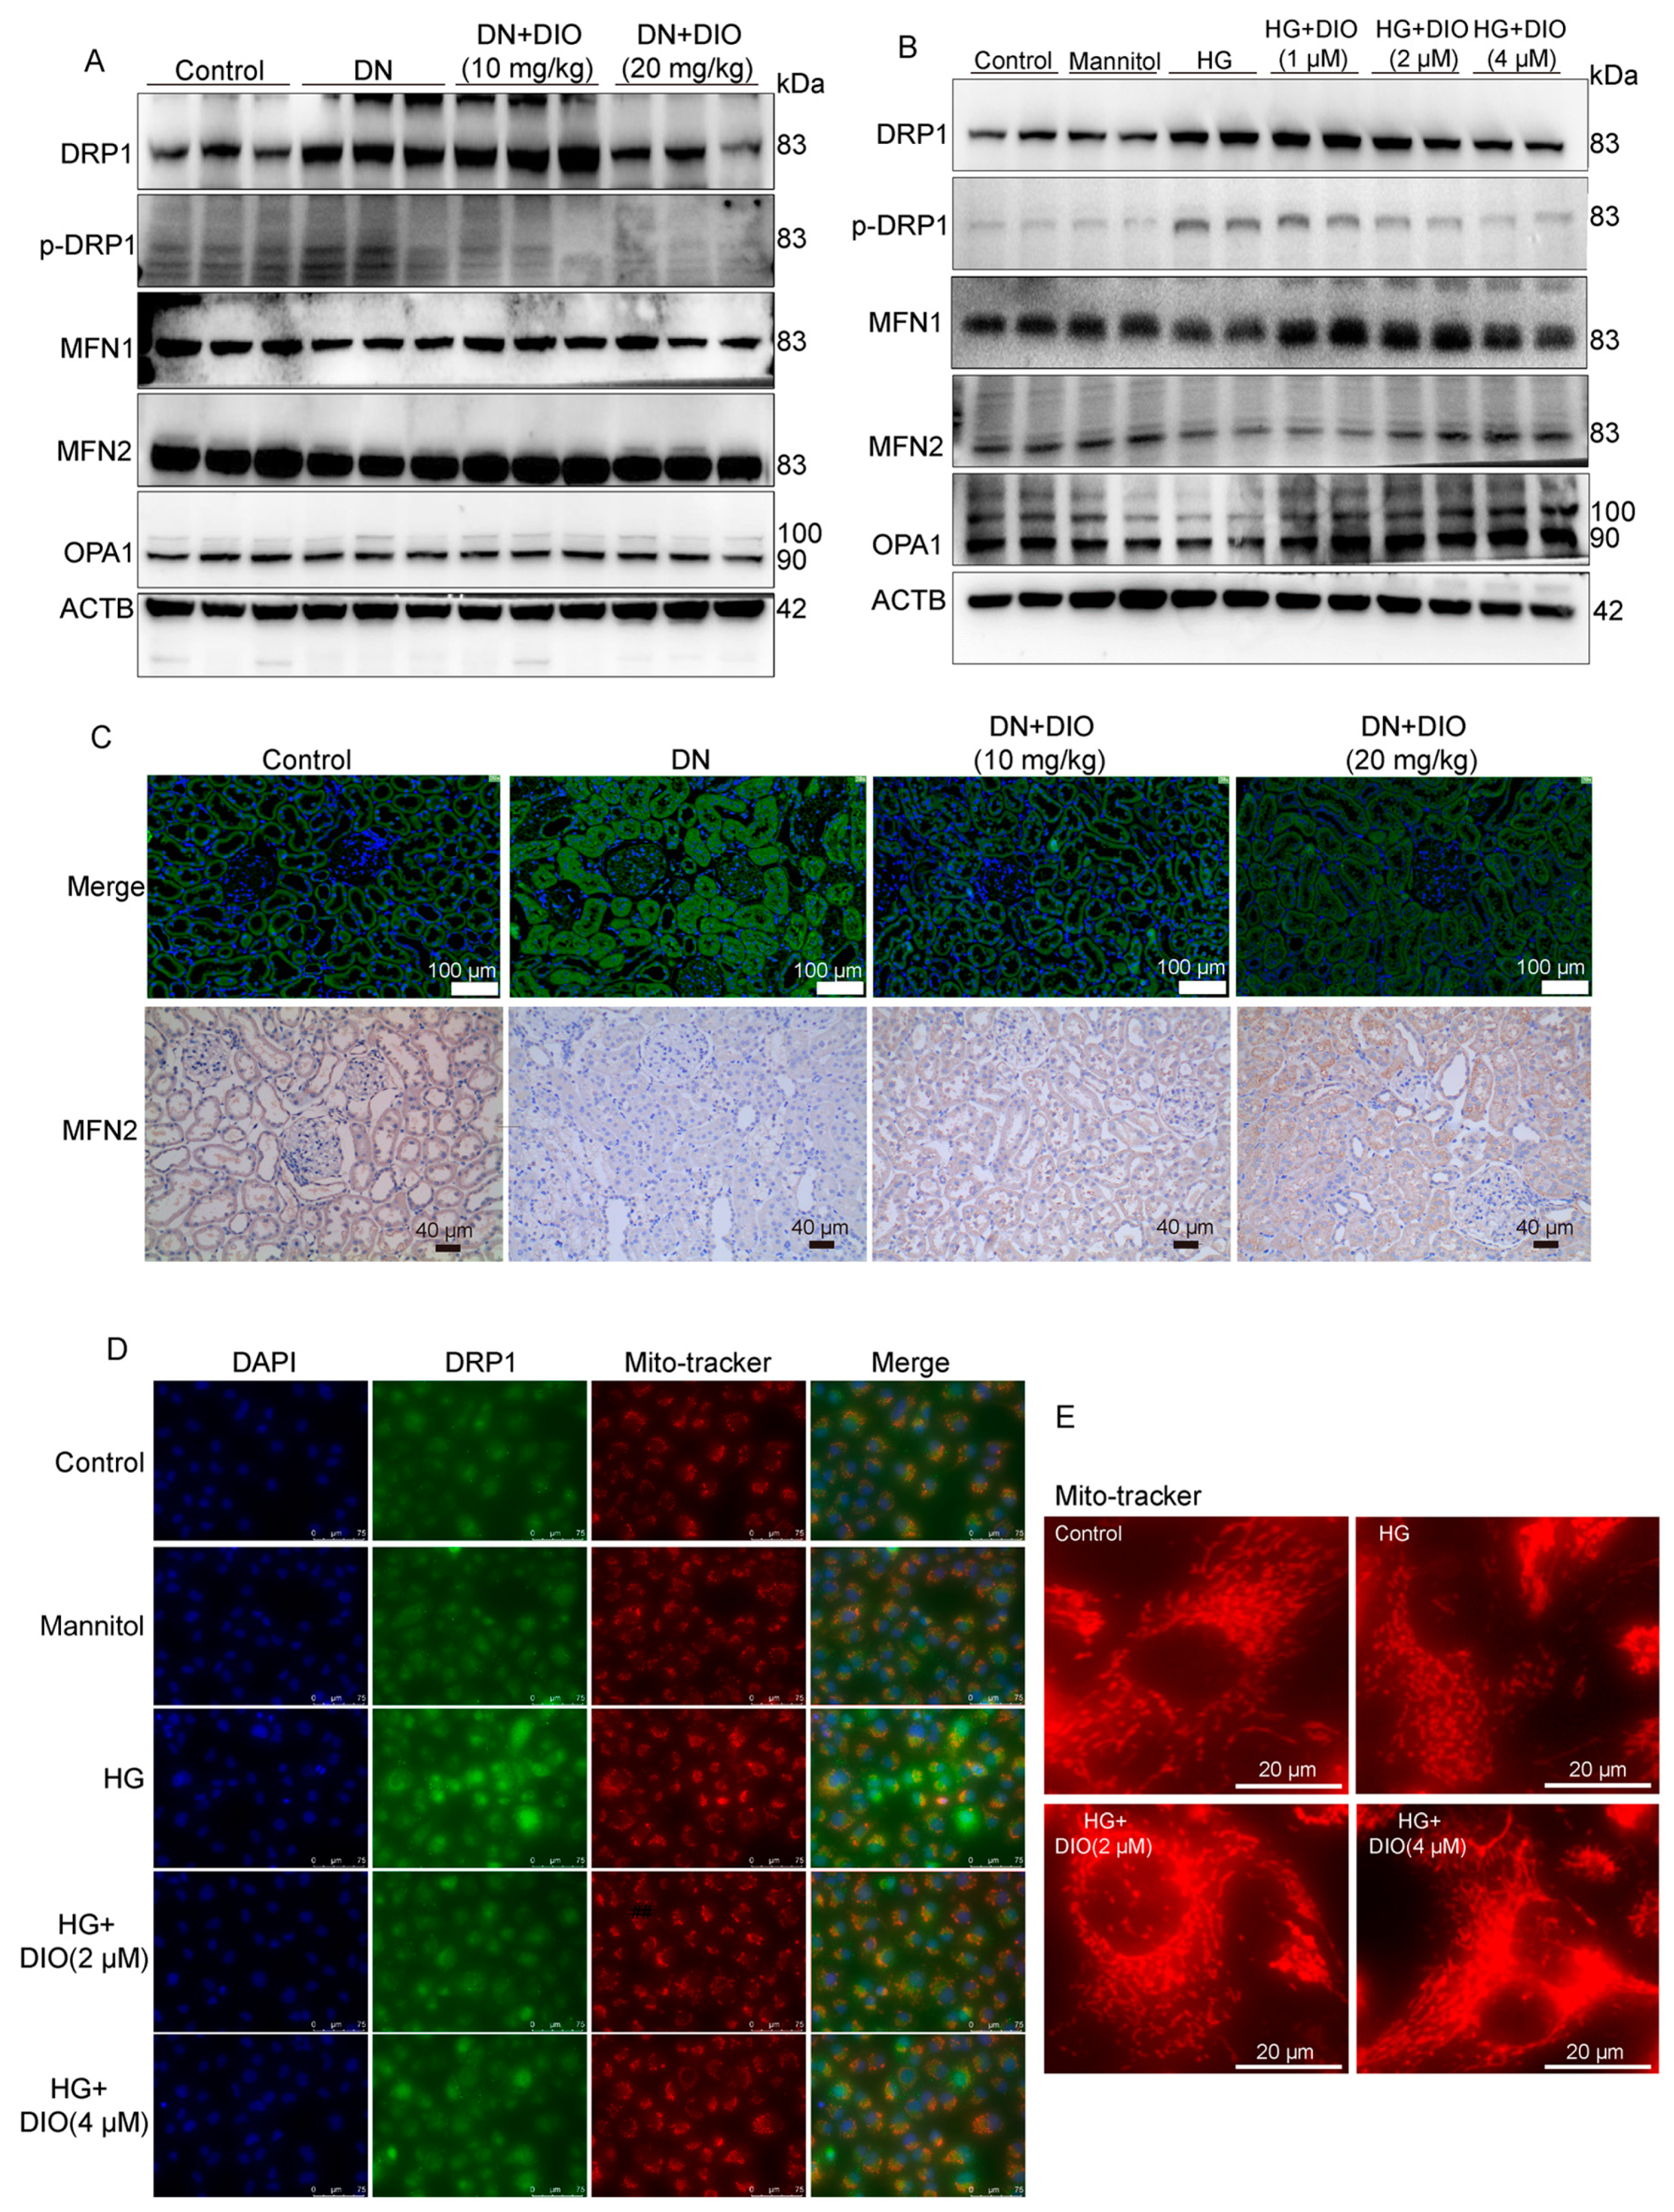
3.7. DIO Ameliorated Mitochondrial Dynamics In Vivo and In Vitro
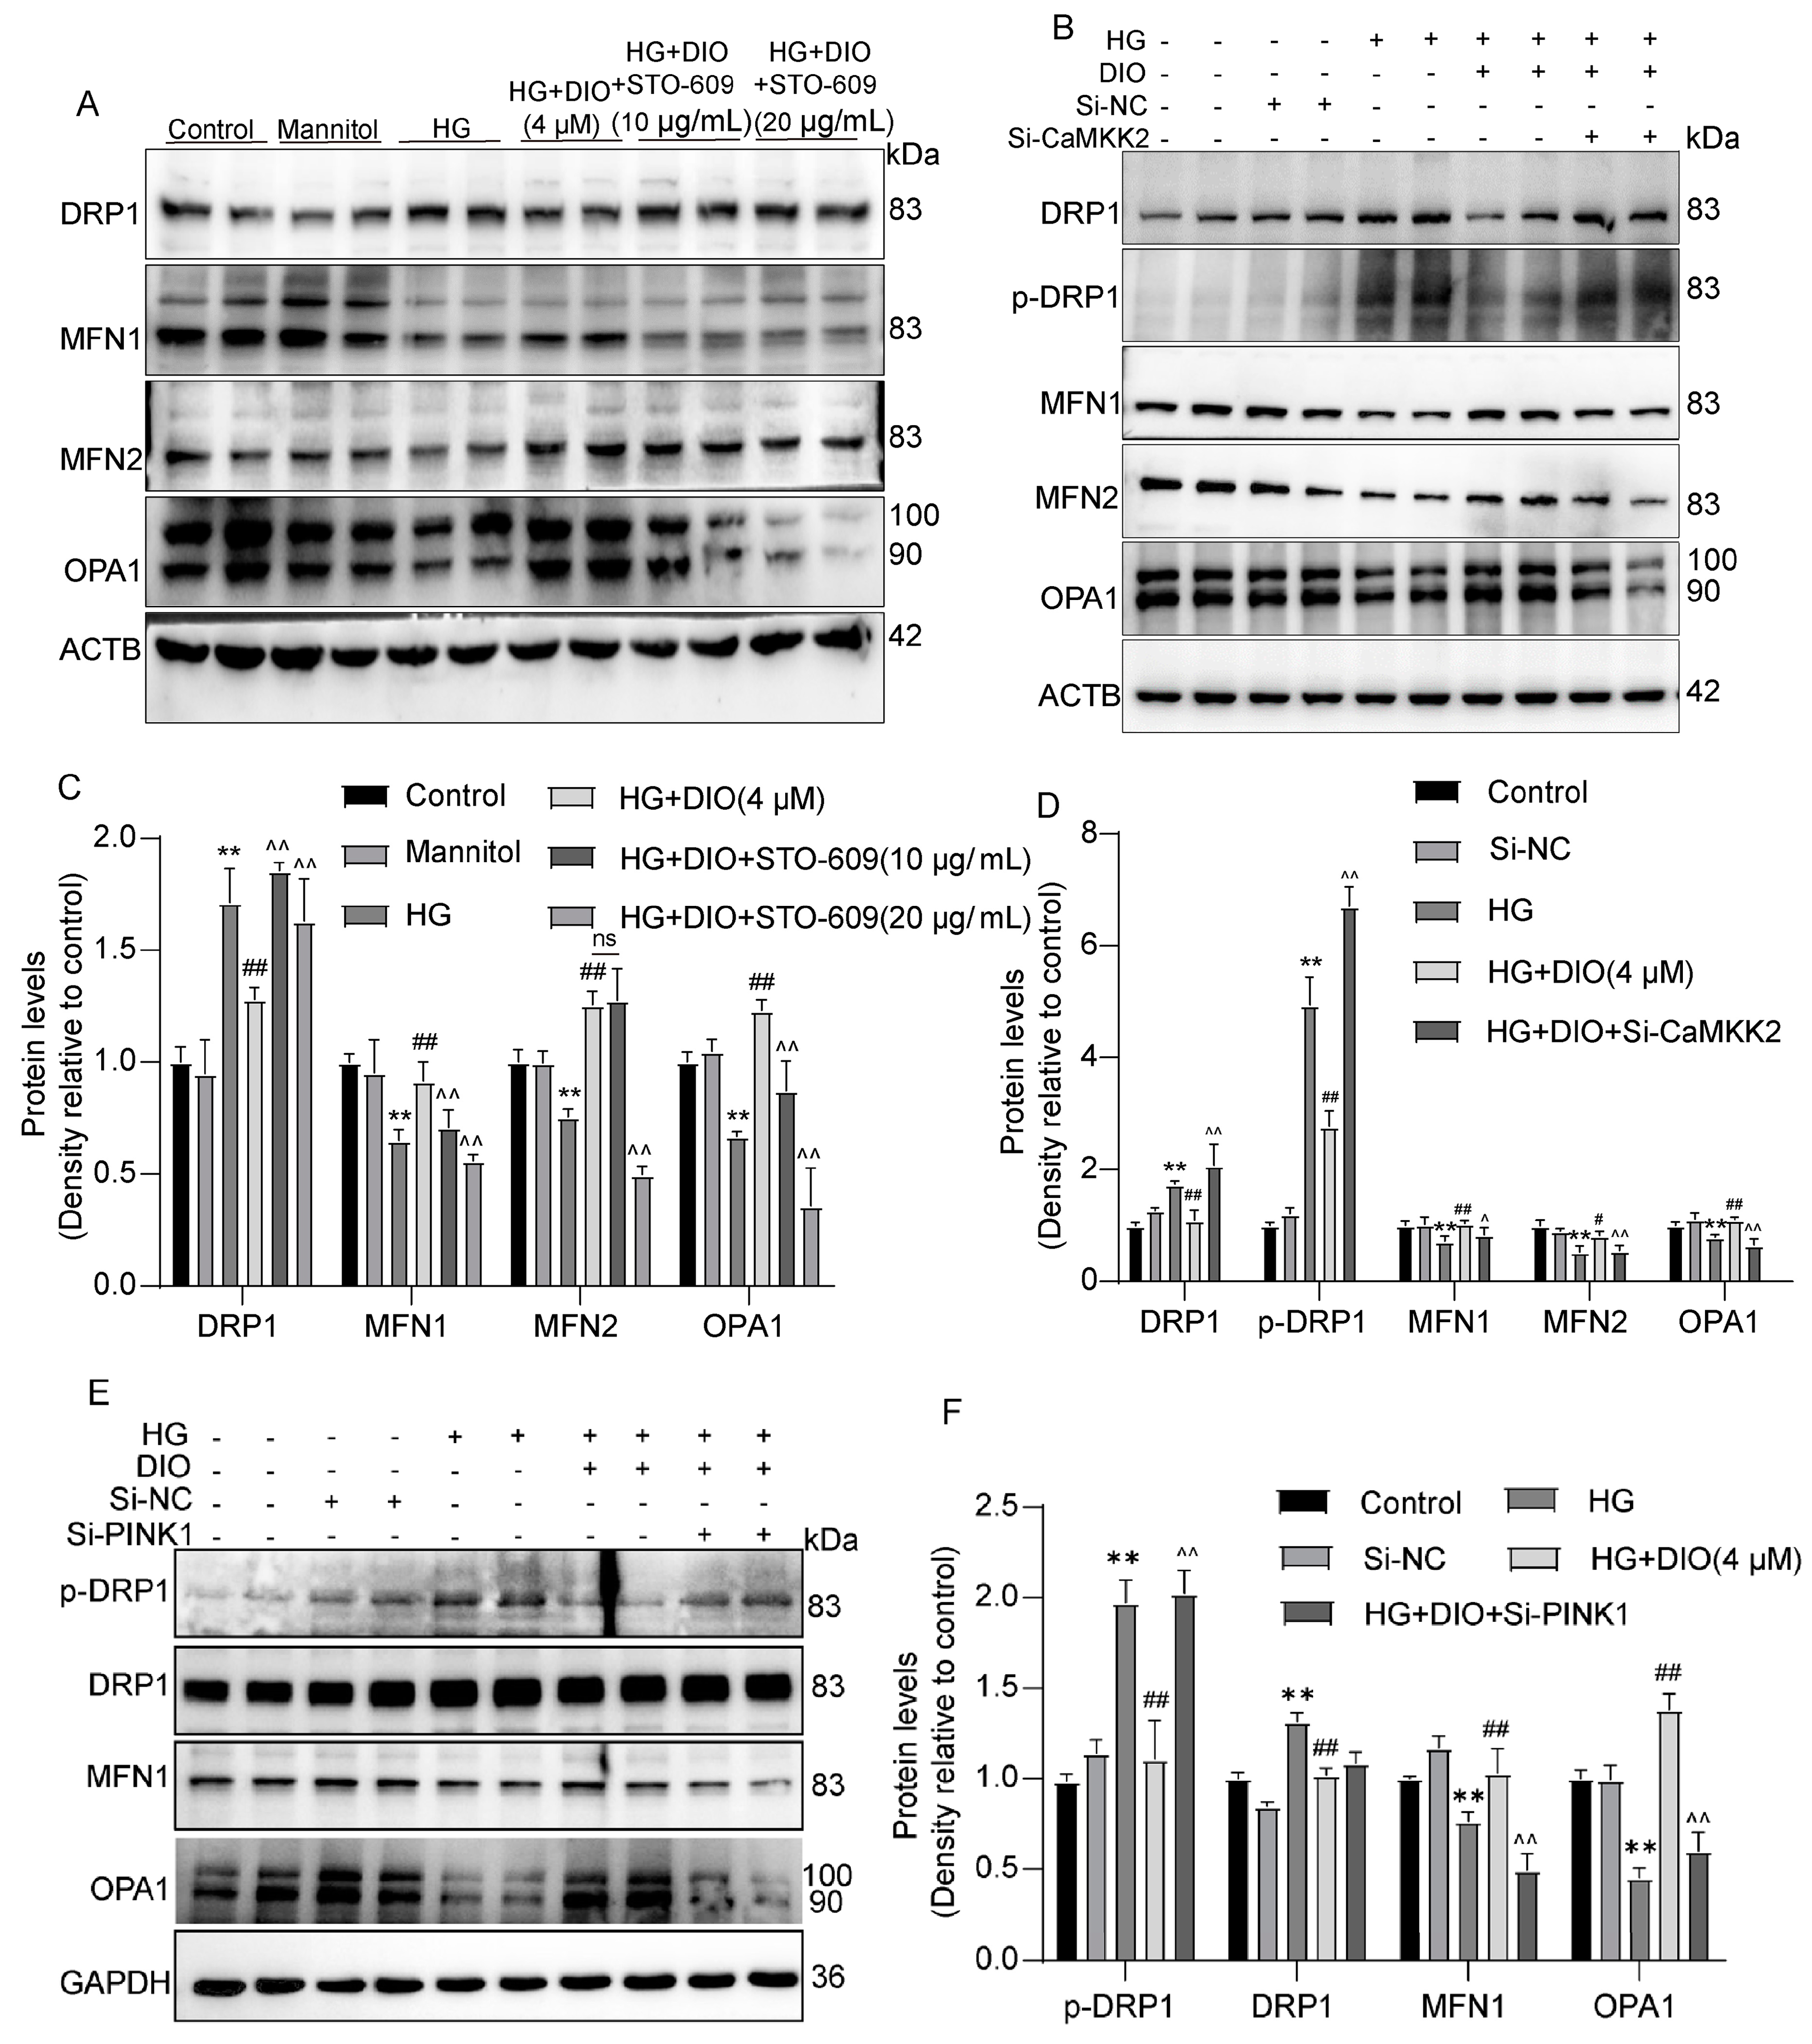
3.8. Mitochondrial Dynamics Are Partially Regulated by CaMKK2 and PINK1
4. Discussion
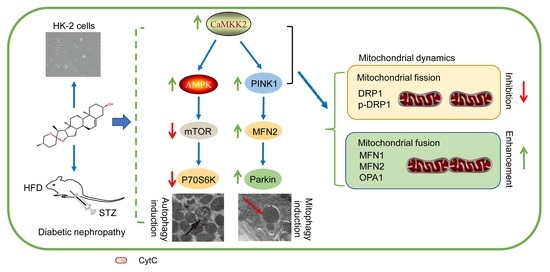
5. Conclusions
Supplementary Materials
Author Contributions
Funding
Institutional Review Board Statement
Informed Consent Statement
Data Availability Statement
Conflicts of Interest
References
- Harding, J.L.; Pavkov, M.E.; Magliano, D.J.; Shaw, J.E.; Gregg, E.W. Global trends in diabetes complications: A review of current evidence. Diabetologia 2019, 62, 3–16. [Google Scholar] [CrossRef] [PubMed]
- Reutens, A.T. Epidemiology of diabetic kidney disease. Med. Clin. N. Am. 2013, 97, 1–18. [Google Scholar] [CrossRef] [PubMed]
- Ghimire, M.; Vaidya, S.; Upadhyay, H.P. Prevalence of newly diagnosed end-stage renal disease patients in a Tertiary hospital of central nepal, Chitwan: A descriptive cross-sectional study. J. Nepal Med. Assoc. 2021, 59, 61–64. [Google Scholar] [CrossRef] [PubMed]
- Yang, D.; Livingston, M.J.; Liu, Z.; Dong, G.; Zhang, M.; Chen, J.K.; Dong, Z. Autophagy in diabetic kidney disease: Regulation, pathological role and therapeutic potential. Cell. Mol. Life Sci. 2018, 75, 669–688. [Google Scholar] [CrossRef] [PubMed]
- Koch, E.A.T.; Nakhoul, R.; Nakhoul, F.; Nakhoul, N. Autophagy in diabetic nephropathy: A review. Int. Urol. Nephrol. 2020, 52, 1705–1712. [Google Scholar] [CrossRef] [PubMed]
- Klionsky, D.J.; Emr, S.D. Cell biology—Autophagy as a regulated pathway of cellular degradation. Science 2000, 290, 1717–1721. [Google Scholar] [CrossRef]
- Han, Y.P.; Liu, L.J.; Yan, J.L.; Chen, M.Y.; Meng, X.F.; Zhou, X.R.; Qian, L.B. Autophagy and its therapeutic potential in diabetic nephropathy. Front. Endocrinol. 2023, 14, 628978. [Google Scholar] [CrossRef]
- Xue, H.; Ji, Y.S.; Wei, S.N.; Yu, Y.; Yan, X.; Liu, S.P.; Zhang, M.; Yao, F.; Lan, X.X.; Chen, L. HGSD attenuates neuronal apoptosis through enhancing neuronal autophagy in the brain of diabetic mice: The role of AMP-activated protein kinase. Life Sci. 2016, 153, 23–34. [Google Scholar] [CrossRef]
- Chauhan, A.S.; Zhuang, L.; Gan, B.Y. Spatial control of AMPK signaling at subcellular compartments. Crit. Rev. Biochem. Mol. Biol. 2020, 55, 17–32. [Google Scholar] [CrossRef]
- Li, A.; Yi, B.; Han, H.; Yang, S.; Hu, Z.; Zheng, L.; Wang, J.; Liao, Q.; Zhang, H. Vitamin D-VDR (vitamin D receptor) regulates defective autophagy in renal tubular epithelial cell in streptozotocin-induced diabetic mice via the AMPK pathway. Autophagy 2022, 18, 877–890. [Google Scholar] [CrossRef]
- Lin, C.C.; Blessing, A.M.; Pulliam, T.L.; Shi, Y.; Wilkenfeld, S.R.; Han, J.J.; Murray, M.M.; Pham, A.H.; Duong, K.; Brun, S.N.; et al. Inhibition of CAMKK2 impairs autophagy and castration-resistant prostate cancer via suppression of AMPK-ULK1 signaling. Oncogene 2021, 40, 1690–1705. [Google Scholar] [CrossRef] [PubMed]
- McBride, H.M.; Neuspiel, M.; Wasiak, S. Mitochondria: More than just a powerhouse. Curr. Biol. 2006, 16, R551–R560. [Google Scholar] [CrossRef] [PubMed]
- Youle, R.J.; van der Bliek, A.M. Mitochondrial fission, fusion, and stress. Science 2012, 337, 1062–1065. [Google Scholar] [CrossRef]
- Kleele, T.; Rey, T.; Winter, J.; Zaganelli, S.; Mahecic, D.; Lambert, H.P.; Ruberto, F.P.; Nemir, M.; Wai, T.; Pedrazzini, T.; et al. Distinct fission signatures predict mitochondrial degradation or biogenesis. Nature 2021, 593, 435–439. [Google Scholar] [CrossRef]
- Tolkovsky, A. Mitophagy. Biochim. Biophys. Acta-Mol. Cell Res. 2009, 1793, 1508–1515. [Google Scholar] [CrossRef] [PubMed]
- Chen, Y.; Dorn, G.W. PINK1-phosphorylated mitofusin 2 is a Parkin receptor for culling damaged mitochondria. Science 2013, 340, 471–475. [Google Scholar] [CrossRef]
- Meyer, J.N.; Leuthner, T.C.; Luz, A.L. Mitochondrial fusion, fission, and mitochondrial toxicity. Toxicology 2017, 391, 42–53. [Google Scholar] [CrossRef]
- Kim, K.; Lee, E.Y. Excessively enlarged mitochondria in the kidneys of diabetic nephropathy. Antioxidants 2021, 10, 741. [Google Scholar] [CrossRef]
- Zhan, M.; Usman, I.M.; Sun, L.; Kanwar, Y.S. Disruption of renal tubular mitochondrial quality control by Myo-inositol oxygenase in diabetic kidney disease. J. Am. Soc. Nephrol. 2015, 26, 1304–1321. [Google Scholar] [CrossRef]
- Ayanga, B.A.; Badal, S.S.; Wang, Y.; Galvan, D.L.; Chang, B.H.; Schumacker, P.T.; Danesh, F.R. Dynamin-related protein 1 deficiency improves mitochondrial fitness and protects against progression of diabetic nephropathy. J. Am. Soc. Nephrol. 2016, 27, 2733–2747. [Google Scholar] [CrossRef]
- Sheng, J.; Li, H.; Dai, Q.; Lu, C.; Xu, M.; Zhang, J.; Feng, J. NR4A1 promotes diabetic nephropathy by activating MFF-mediated mitochondrial fission and suppressing parkin-mediated mitophagy. Cell. Physiol. Biochem. 2018, 48, 1675–1693. [Google Scholar] [CrossRef] [PubMed]
- Zhong, Y.J.; Liu, J.Y.; Sun, D.J.; Guo, T.M.; Yao, Y.P.; Xia, X.D.; Shi, C.; Peng, X.L. Dioscin relieves diabetic nephropathy via suppressing oxidative stress and apoptosis, and improving mitochondrial quality and quantity control. Food Funct. 2022, 13, 3660–3673. [Google Scholar] [CrossRef] [PubMed]
- Zhong, Y.J.; Jin, C.N.; Han, J.H.; Zhu, J.C.; Liu, Q.; Sun, D.J.; Xia, X.D.; Zhang, Y.; Peng, X.L. Diosgenin protects against kidney injury and mitochondrial apoptosis induced by 3-MCPD through the regulation of ER stress, Ca2+ homeostasis, and Bcl2 expression. Mol. Nutr. Food Res. 2021, 65, 2001202. [Google Scholar] [CrossRef]
- Mizushima, N.; Murphy, L.O. Autophagy assays for biological discovery and therapeutic development. Trends Biochem. Sci. 2020, 45, 1080–1093. [Google Scholar] [CrossRef] [PubMed]
- Drel, V.R.; Sybirna, N. Protective effects of polyphenolics in red wine on diabetes associated oxidative/nitrative stress in streptozotocin-diabetic rats. Cell Biol. Int. 2010, 34, 1147–1153. [Google Scholar] [CrossRef] [PubMed]
- Wang, F.; Li, R.; Zhao, L.; Ma, S.; Qin, G. Resveratrol ameliorates renal damage by inhibiting oxidative stress-mediated apoptosis of podocytes in diabetic nephropathy. Eur. J. Pharmacol. 2020, 885, 173387. [Google Scholar] [CrossRef]
- Song, Y.; Liu, W.; Tang, K.; Zang, J.; Li, D.; Gao, H. Mangiferin alleviates renal interstitial fibrosis in streptozotocin-induced diabetic mice through regulating the PTEN/PI3K/Akt signaling pathway. J. Diabetes Res. 2020, 2020, 9481720. [Google Scholar] [CrossRef]
- Li, P.; Bukhari, S.N.A.; Khan, T.; Chitti, R.; Bevoor, D.B.; Hiremath, A.R.; SreeHarsha, N.; Singh, Y.; Gubbiyappa, K.S. Apigenin-loaded solid lipid nanoparticle attenuates diabetic nephropathy induced by streptozotocin nicotinamide through Nrf2/HO-1/NF-kB signalling pathway. Int. J. Nanomed. 2020, 15, 9115–9124. [Google Scholar] [CrossRef]
- Guo, H.; Wang, Y.; Zhang, X.; Zang, Y.; Zhang, Y.; Wang, L.; Wang, H.; Wang, Y.; Cao, A.; Peng, W. Astragaloside IV protects against podocyte injury via SERCA2-dependent ER stress reduction and AMPKalpha-regulated autophagy induction in streptozotocin-induced diabetic nephropathy. Sci. Rep. 2017, 7, 6852. [Google Scholar] [CrossRef]
- Jiang, X.S.; Xiang, X.Y.; Chen, X.M.; He, J.L.; Liu, T.; Gan, H.; Du, X.G. Inhibition of soluble epoxide hydrolase attenuates renal tubular mitochondrial dysfunction and ER stress by restoring autophagic flux in diabetic nephropathy. Cell Death Dis. 2020, 11, 385. [Google Scholar] [CrossRef]
- Trefts, E.; Shaw, R.J. AMPK: Restoring metabolic homeostasis over space and time. Mol. Cell 2021, 81, 3677–3690. [Google Scholar] [CrossRef] [PubMed]
- Saikia, R.; Joseph, J. AMPK: A key regulator of energy stress and calcium-induced autophagy. J. Mol. Med. 2021, 99, 1539–1551. [Google Scholar] [CrossRef] [PubMed]
- Hoyer-Hansen, M.; Bastholm, L.; Szyniarowski, P.; Campanella, M.; Szabadkai, G.; Farkas, T.; Bianchi, K.; Fehrenbacher, N.; Elling, F.; Rizzuto, R.; et al. Control of macroautophagy by calcium, calmodulin-dependent kinase kinase-beta, and Bcl-2. Mol. Cell 2007, 25, 193–205. [Google Scholar] [CrossRef]
- Pickles, S.; Vigie, P.; Youle, R.J. Mitophagy and quality control mechanisms in mitochondrial maintenance. Curr. Biol. 2018, 28, R170–R185. [Google Scholar] [CrossRef] [PubMed]
- Sekine, S.; Youle, R.J. PINK1 import regulation: A fine system to convey mitochondrial stress to the cytosol. BMC Biol. 2018, 16, 2. [Google Scholar] [CrossRef]
- Harper, J.W.; Ordureau, A.; Heo, J.M. Building and decoding ubiquitin chains for mitophagy. Nat. Rev. Mol. Cell Biol. 2018, 19, 93–108. [Google Scholar] [CrossRef]
- Ordureau, A.; Sarraf, S.A.; Duda, D.M.; Heo, J.M.; Jedrychowski, M.P.; Sviderskiy, V.O.; Olszewski, J.L.; Koerber, J.T.; Xie, T.; Beausoleil, S.A.; et al. Quantitative proteomics reveal a feedforward mechanism for mitochondrial Parkin translocation and ubiquitin chain synthesis. Mol. Cell 2014, 56, 360–375. [Google Scholar] [CrossRef]
- Yao, L.; Liang, X.H.; Qiao, Y.J.; Chen, B.H.; Wang, P.; Liu, Z.S. Mitochondrial dysfunction in diabetic tubulopathy. Metab.-Clin. Exp. 2022, 131, 155195. [Google Scholar] [CrossRef] [PubMed]
- Ban, T.; Kohno, H.; Ishihara, T.; Ishihara, N. Relationship between OPA1 and cardiolipin in mitochondrial inner-membrane fusion. Biochim. Biophys. Acta (BBA)-Bioenerg. 2018, 1859, 951–957. [Google Scholar] [CrossRef]
- Lee, W.C.; Chiu, C.H.; Chen, J.B.; Chen, C.H.; Chang, H.W. Mitochondrial fission increases apoptosis and decreases autophagy in renal proximal tubular epithelial cells treated with high glucose. DNA Cell Biol. 2016, 35, 657–665. [Google Scholar] [CrossRef]
- Kim, K.; Cha, S.J.; Choi, H.J.; Kang, J.S.; Lee, E.Y. Dysfunction of mitochondrial dynamics in drosophila model of diabetic nephropathy. Life 2021, 11, 67. [Google Scholar] [CrossRef] [PubMed]
- Vezza, T.; Diaz-Pozo, P.; Canet, F.; de Maranon, A.M.; Abad-Jimenez, Z.; Garcia-Gargallo, C.; Roldan, I.; Sola, E.; Banuls, C.; Lopez-Domenech, S.; et al. The role of mitochondrial dynamic dysfunction in age-associated type 2 diabetes. World J. Mens. Health 2022, 40, 399–411. [Google Scholar] [CrossRef] [PubMed]
- Bhatia, D.; Chung, K.P.; Nakahira, K.; Patino, E.; Rice, M.C.; Torres, L.K.; Muthukumar, T.; Choi, A.M.K.; Akchurin, O.M.; Choi, M.E. Mitophagy-dependent macrophage reprogramming protects against kidney fibrosis. JCI Insight 2019, 4, e132826. [Google Scholar] [CrossRef] [PubMed]
- Xiong, W.J.; Ma, Z.; An, D.Q.; Liu, Z.; Cai, W.Q.; Bai, Y.J.; Zhan, Q.; Lai, W.Y.; Zeng, Q.C.; Ren, H.; et al. Mitofusin 2 participates in mitophagy and mitochondrial fusion against angiotensin II-induced cardiomyocyte injury. Front. Physiol. 2019, 10, 411. [Google Scholar] [CrossRef] [PubMed]
- Liang, C.; Sun, M.L.; Zhong, J.; Miao, C.H.; Han, X.D. The role of PINK1-mediated mitochondrial pathway in propofol-induced developmental neurotoxicity. Neurochem. Res. 2021, 46, 2226–2237. [Google Scholar] [CrossRef] [PubMed]


| Control | DN | DN + DIO (10 mg/kg) | DN + DIO (20 mg/kg) | DN + Mef (300 mg/kg) | |
|---|---|---|---|---|---|
| Fasting blood glucose (mg/dL) | 80.1 ± 6.7 | 490.1 ± 25.3 ** | 344.3 ± 79.8 ## | 368.6 ± 90.24 ## | 346.1 ± 74.5 ## |
| Kidney/body weight (g/100 g) | 0.57 ± 0.02 | 0.89 ± 0.08 ** | 0.83 ± 0.12 | 0.83 ± 0.05 | 0.86 ± 0.08 |
| Urea nitrogen (mg/dL) | 26.3 ± 5.6 | 53.3 ± 8.2 ** | 37 ± 6.4 ## | 40.4 ± 7.1 ## | 29.9 ± 17.4 ## |
| Creatinine (µmol/L) | 41.6 ± 5.9 | 81.9 ± 8.22 ** | 59.5 ± 9.7 ## | 56.9 ± 6.8 ## | 42.5 ± 7.9 ## |
Disclaimer/Publisher’s Note: The statements, opinions and data contained in all publications are solely those of the individual author(s) and contributor(s) and not of MDPI and/or the editor(s). MDPI and/or the editor(s) disclaim responsibility for any injury to people or property resulting from any ideas, methods, instructions or products referred to in the content. |
© 2023 by the authors. Licensee MDPI, Basel, Switzerland. This article is an open access article distributed under the terms and conditions of the Creative Commons Attribution (CC BY) license (https://creativecommons.org/licenses/by/4.0/).
Share and Cite
Zhong, Y.; Jin, R.; Luo, R.; Liu, J.; Ren, L.; Zhang, Y.; Shan, Z.; Peng, X. Diosgenin Targets CaMKK2 to Alleviate Type II Diabetic Nephropathy through Improving Autophagy, Mitophagy and Mitochondrial Dynamics. Nutrients 2023, 15, 3554. https://doi.org/10.3390/nu15163554
Zhong Y, Jin R, Luo R, Liu J, Ren L, Zhang Y, Shan Z, Peng X. Diosgenin Targets CaMKK2 to Alleviate Type II Diabetic Nephropathy through Improving Autophagy, Mitophagy and Mitochondrial Dynamics. Nutrients. 2023; 15(16):3554. https://doi.org/10.3390/nu15163554
Chicago/Turabian StyleZhong, Yujie, Ruyi Jin, Ruilin Luo, Jiayu Liu, Luting Ren, Yinghan Zhang, Zhongguo Shan, and Xiaoli Peng. 2023. "Diosgenin Targets CaMKK2 to Alleviate Type II Diabetic Nephropathy through Improving Autophagy, Mitophagy and Mitochondrial Dynamics" Nutrients 15, no. 16: 3554. https://doi.org/10.3390/nu15163554
APA StyleZhong, Y., Jin, R., Luo, R., Liu, J., Ren, L., Zhang, Y., Shan, Z., & Peng, X. (2023). Diosgenin Targets CaMKK2 to Alleviate Type II Diabetic Nephropathy through Improving Autophagy, Mitophagy and Mitochondrial Dynamics. Nutrients, 15(16), 3554. https://doi.org/10.3390/nu15163554