Systematic Review

How to Keep the Balance between Red and Processed Meat Intake and Physical Activity Regarding Mortality: A Dose-Response Meta-Analysis

1
Department of Epidemiology, School of Public Health, Harbin Medical University, 157 Baojian Road, Nangang District, Harbin 150028, China
2
National Key Disciplines of Nutrition and Food Hygiene, Department of Nutrition and Food Hygiene, School of Public Health, Harbin Medical University, 157 Baojian Rd., Nangang District, Harbin 150028, China
3
NHC Key Laboratory of Etiology and Epidemiology, Harbin 150028, China
*
Authors to whom correspondence should be addressed.
These authors contributed equally to this work.
Nutrients 2023, 15(15), 3373; https://doi.org/10.3390/nu15153373
Submission received: 18 June 2023 / Revised: 16 July 2023 / Accepted: 27 July 2023 / Published: 29 July 2023
(This article belongs to the Section Nutrition and Public Health)

Abstract

:
Background: Non-communicable diseases have become a major threat to public health, with cardiovascular diseases (CVDs) and cancer being the top two causes of death each year. Objective: Our objective is to evaluate the balanced association between the effect of red and processed meat intake on the risk of death and the effect of physical activity on the risk of mortality, where the risk of death includes all causes, CVDs, and cancers. Methods: We searched electronic databases, including PubMed, ISI Web of Science, Embase, and the Cochrane Library, for prospective studies reporting risk estimates for the association between the intake of red and processed meat, walking, and muscle-strengthening activity (MSA) and the risk of mortality from all causes, CVDs, and cancer. We extracted fully adjusted effect estimates from original studies and performed a summary analysis using the fixed and random-effect models. Results: A conventional meta-analysis showed that red meat and processed meat were positively associated with the risk of mortality, and daily steps and MSA were negatively associated with the risk of death. Further analysis of the dose–response relationship showed that a risk reduction (20%) from 39.5 min/week of MSA or 4100 steps/d was equivalent to an increased risk of all-cause mortality from a daily intake of 103.4 g/d of red meat or 50 g/d of processed meat. The risk was further decreased as the number of steps per day increased, but the risk reversed when the MSA exceeded the threshold (39.5 min/week). Conclusions: Adherence to physical activity is an effective way to reduce the risk of mortality due to meat intake. However, the total intake of red meat and processed meat should be controlled, especially the latter. Walking is recommended as the main daily physical activity of choice, while MSAs are preferred when time is limited, but it should be noted that longer MSAs do not provide additional benefits.

1. Introduction

Non-communicable diseases are one of the major challenges to public health, causing 71% of global deaths each year. Cardiovascular diseases (CVDs) are the leading cause of death from non-communicable diseases, accounting for 17.9 million deaths annually, followed by cancer (9.3 million) [1].
Unhealthy diets and physical activity are major risks and protective factors for chronic diseases and associated mortality, respectively [1]. Meat and its products are the main source of dietary protein for humans. Red and processed meat consumption remains high in developed countries like the USA and the UK [2,3], and it is increasing at a rate of 5–6% per year in developing countries, with the majority of consumption being red meat [4]. However, according to estimates from the Global Burden of Disease Study, approximately 813,307 and 231,091 people died from CVDs and cancers, respectively, in 2019 because of excessive red and processed meat consumption, with the majority of these deaths occurring in high- and middle-income countries. Physical activity can generally be categorized as aerobic or anaerobic, with walking being the simplest form of aerobic exercise. Anaerobic muscle-strengthening activities (MSAs) are defined as “activities that use equipment that primarily involves upper body movement and muscle strengthening”, including push-ups, bench-presses, sit-ups, and weight-lifting activities. The benefits of walking and MSAs contribute not only to lowering incidents of CVDs, diabetes, obesity, and cancers but also to lowering the mortality rate from multiple chronic conditions [5,6]. Findings from 15 international cohorts suggested that subjects who walked 10,901 steps per day had a 53% lower risk of all-cause mortality compared with 3553 steps [7]. Another study showed that MSAs over 60–150 min per week were associated with a lower mortality risk from CVDs by 20%–25%, cancer by 15–20%, and overall mortality by 20–25% [8].
Although numerous reports have revealed the harmful effects of excessive meat intake on mortality risk, few studies provide any insight into how to choose between red and processed meat. Even less evidence is available on how one should choose between walking and MSAs. From the perspective of individual prevention, it is crucial to accurately balance the mortality risk caused by exposure to risk and protective factors according to dose, but, to the best of our knowledge, this has never been evaluated. Therefore, this study aims to reveal a balanced scale by assessing the dose–response relationship between meat intake, daily steps, and MSAs on mortality outcomes based on a systematic review and dose–response meta-analysis.

2. Methods

Findings from this systematic review and meta-analysis were reported based on the Preferred Reporting Items for Systematic Review and Meta-Analyses (PRISMA) guidelines. The review protocol is registered with the PROSPERO database (CRD42022320178).

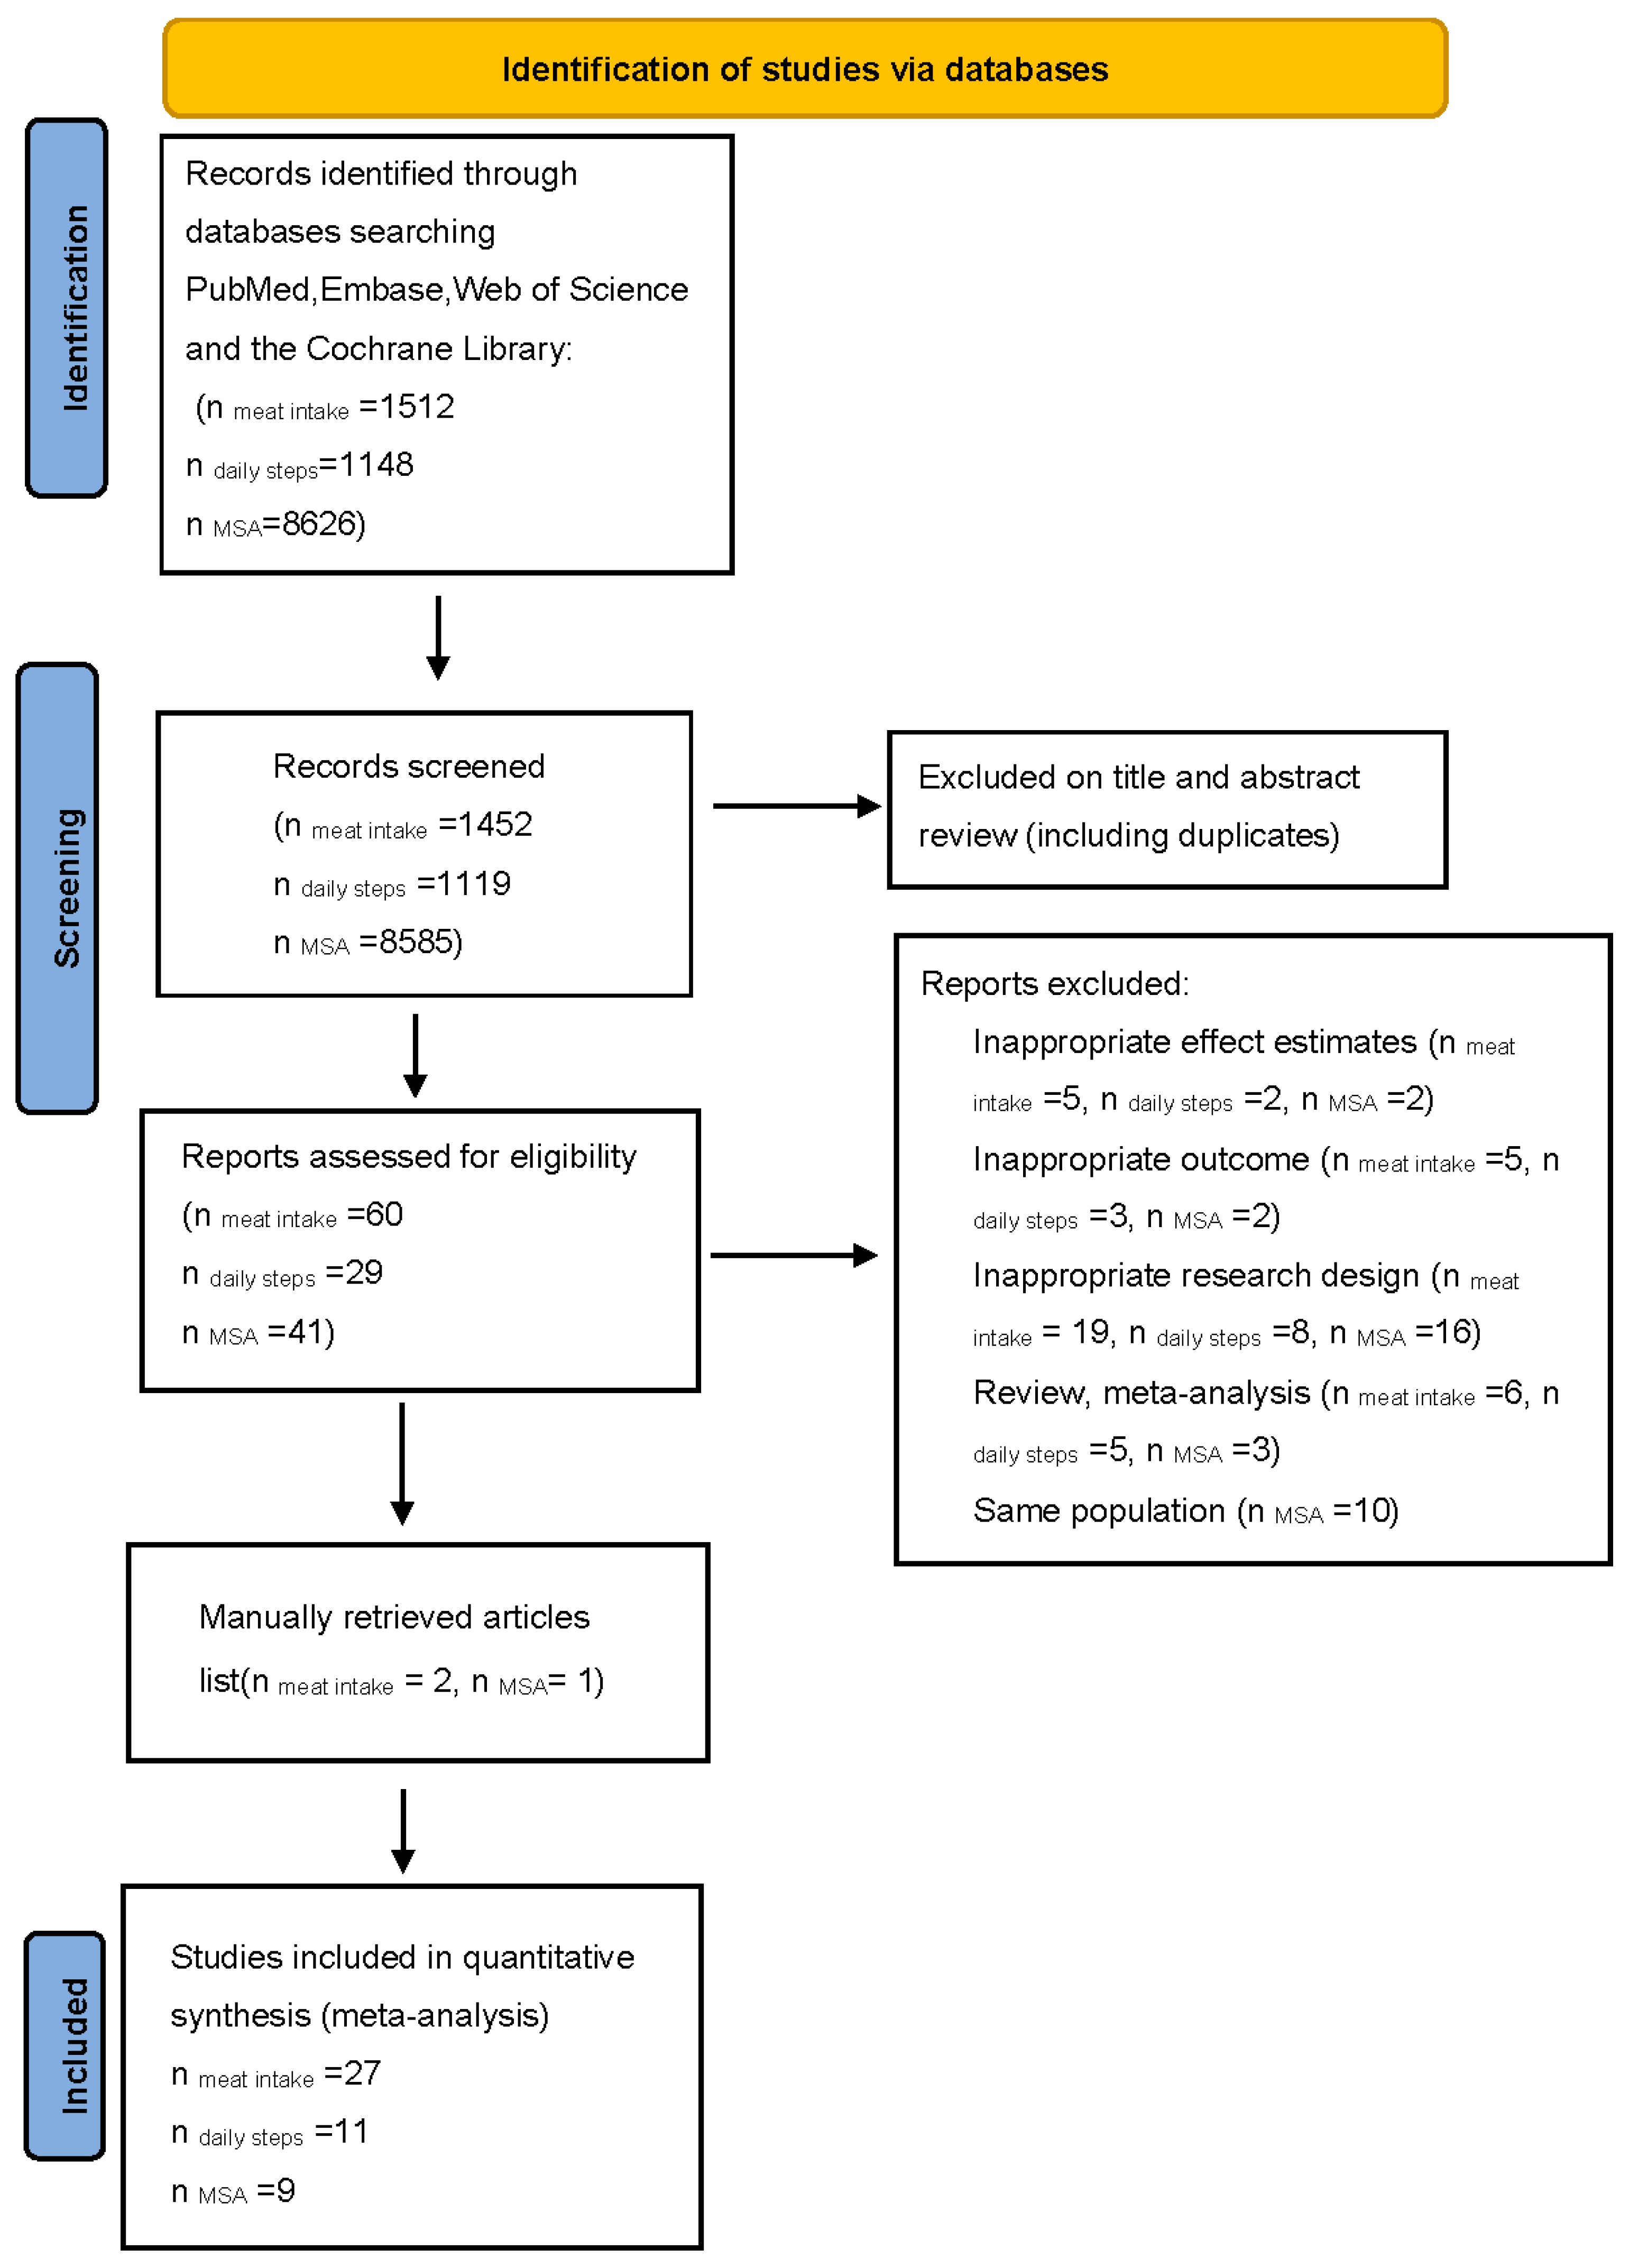
2.1. Search Strategy

We conducted a systematic search of all articles in English published up to 31 December 2021 in online databases, including PubMed, Web of Science, Embase, and the Cochrane Library. The reference lists of selected papers and recent reviews were cross-checked manually to identify any articles that might have been missed. Details of the study’s selection process are shown in Figure 1. Table S1 provides the information on the search terms.

2.2. Study Selection and Eligibility Criteria

Published studies were included if they were observational prospective studies conducted on human adults (aged ≥18 years) and with reported effect sizes, including hazard ratios (HRs) or relative risks (RRs) with corresponding 95% confidence intervals (95% CIs). All outcomes were classified based on the World Health Organization’s ICD-10 (International Classification of Diseases, 10th revision) or ICD-9 (9th revision) in original studies. If the same data set was published in more than one publication, the most recent publication or that with the largest number of participants was included. The inclusion criteria were (1) studies that analyzed the association between the intake of red meat, processed meat, or the mixed consumption of both as the exposure and mortality from all causes, CVDs, or cancers as the outcome; (2) studies that analyzed the association between MSAs and mortality from all causes, CVDs, or cancers; (3) studies that analyzed the association between daily steps and mortality from all causes, CVDs, or cancers. The exclusion criteria were (1) letters, comments, reviews, meta-analyses, and ecological studies; (2) studies performed on children or adolescents or patients with end-stage cancer or critical illness; (3) studies with insufficient data (e.g., exposure or outcome data).

2.3. Data Extraction

Two authors (Y.W. and Y.C.) independently extracted data from eligible studies by using a standard data extraction form; disagreements were resolved by consensus between the two reviewers or in group meetings. In group meetings, the two reviewers discuss and compare each other’s extraction results, and all the members involved in the data extraction stage (Y.W., Y.C., B.P. and J.Y.) reach a consensus based on the discussed results.
From each eligible article, we extracted the first author’s name, year of publication, population ethnicity, study design, age range, health status at the start of the study, sex, cohort size, number of outcomes, follow-up time, exposure, exposure assessment methods, outcomes, outcome assessment methods, comparison categories, HRs, RRs, 95% CIs, and variables adjusted for in the analysis. If the included studies reported both crude and multivariable-adjusted effect estimates, the most fully adjusted outcomes were used in the present meta-analysis.

2.4. Risk of Bias Assessment and GRADE Assessment

The Newcastle–Ottawa scale (NOS) was used to assess the quality of included studies. The NOS was adapted to evaluate the selection, comparability, and outcome/exposure of the individual study [9]. A star was awarded for every quality item, with a maximum of nine stars for the highest quality. Thus, 0–3, 4–6, and 7–9 stars were considered poor, fair, and good quality, respectively (Table S4). The certainty of the evidence was assessed using the GRADE (Grading of Recommendations Assessment, Development, and Evaluation) approach for each outcome [10]. According to GRADE, observational studies start at low certainty and may be downgraded for risk of bias, inconsistency, indirectness, imprecision, or publication bias and may be upgraded for a large effect, if suspected biases work against the observed direction of the effect or for a dose–response gradient. All assessments were conducted independently by two reviewers (Y.W. and Y.C.), and disagreements were resolved by consensus between the two reviewers or in a group meeting.

2.5. Data Synthesis and Statistical Analysis

In the present meta-analysis, the HRs and 95% CIs were considered the effect size for all studies, and the RRs were deemed equivalent to the HRs. The HRs and 95% CIs for comparisons of the highest versus lowest categories of meat intake, MSAs, and daily steps were used to calculate log HRs with standard errors for the primary analyses. Heterogeneity between studies was evaluated with Q and I2 statistics. For the Q statistic, a p < 0.1 was considered significant. The I2 value was used to assess the amount of heterogeneity between studies, with an I2 ≥ 50 being of high heterogeneity, and a random effect model (Paule and Mandel) was chosen. An I2 < 50 was considered to show low heterogeneity, and a fixed effect model (Paule and Mandel) was chosen. A funnel plot was generated to assess the potential publication bias, and Egger’s linear regression and Beeg’s rank test were applied to test the symmetry. We also conducted sensitivity analyses to investigate the stability of the results, in which each prospective cohort study was excluded in turn to examine the influence of that study on the overall estimate. Subgroup analyses were conducted to investigate the source of heterogeneity.
In addition, the linear trends and nonlinear dose–response trends were both examined to describe the association between red and processed meat intake, MSAs, daily steps, and mortality outcomes using a restricted cubic spline model of four-section fixed-percentile (5%, 35%, 65%, and 95%) exposure distribution to evaluate the association. For this purpose, exposure dose, the number of cases, person-years, and adjusted HRs with 95% CIs across three or more quantitative categories in each study were extracted. If only the total number of cases or person-years was reported, the distribution of cases or person-years was estimated using the total number of cases and person-years [11]. If the total number of person-years was not reported, we approximated it by multiplying the total number of participants by the median or mean of the follow-up period. For studies reporting exposure in each category as a range, we considered the midpoint of the upper and lower bounds. Open-ended categories were considered to have the same widths as the closest category. Finally, the balanced scale was performed based on the results of dose–response relationships by calculating the inverse equilibrium of the HR suffered because of meat intake and the exposed dose of physical activity. Statistical analyses were conducted using STATA version 16.0 and R version 4.1.1.

3. Results

Table 1, Table 2 and Table 3 and Tables S2 and S3 show the characteristics of the studies included. The study quality was, in general, high because the vast majority of studies were in the group with 7–9 stars (Table S4). The respective means (medians) were 7.7 and 8 for meat intake and mortality, 8.18 and 8 for daily steps and all-cause mortality, and 7 and 7 for MSA and mortality.

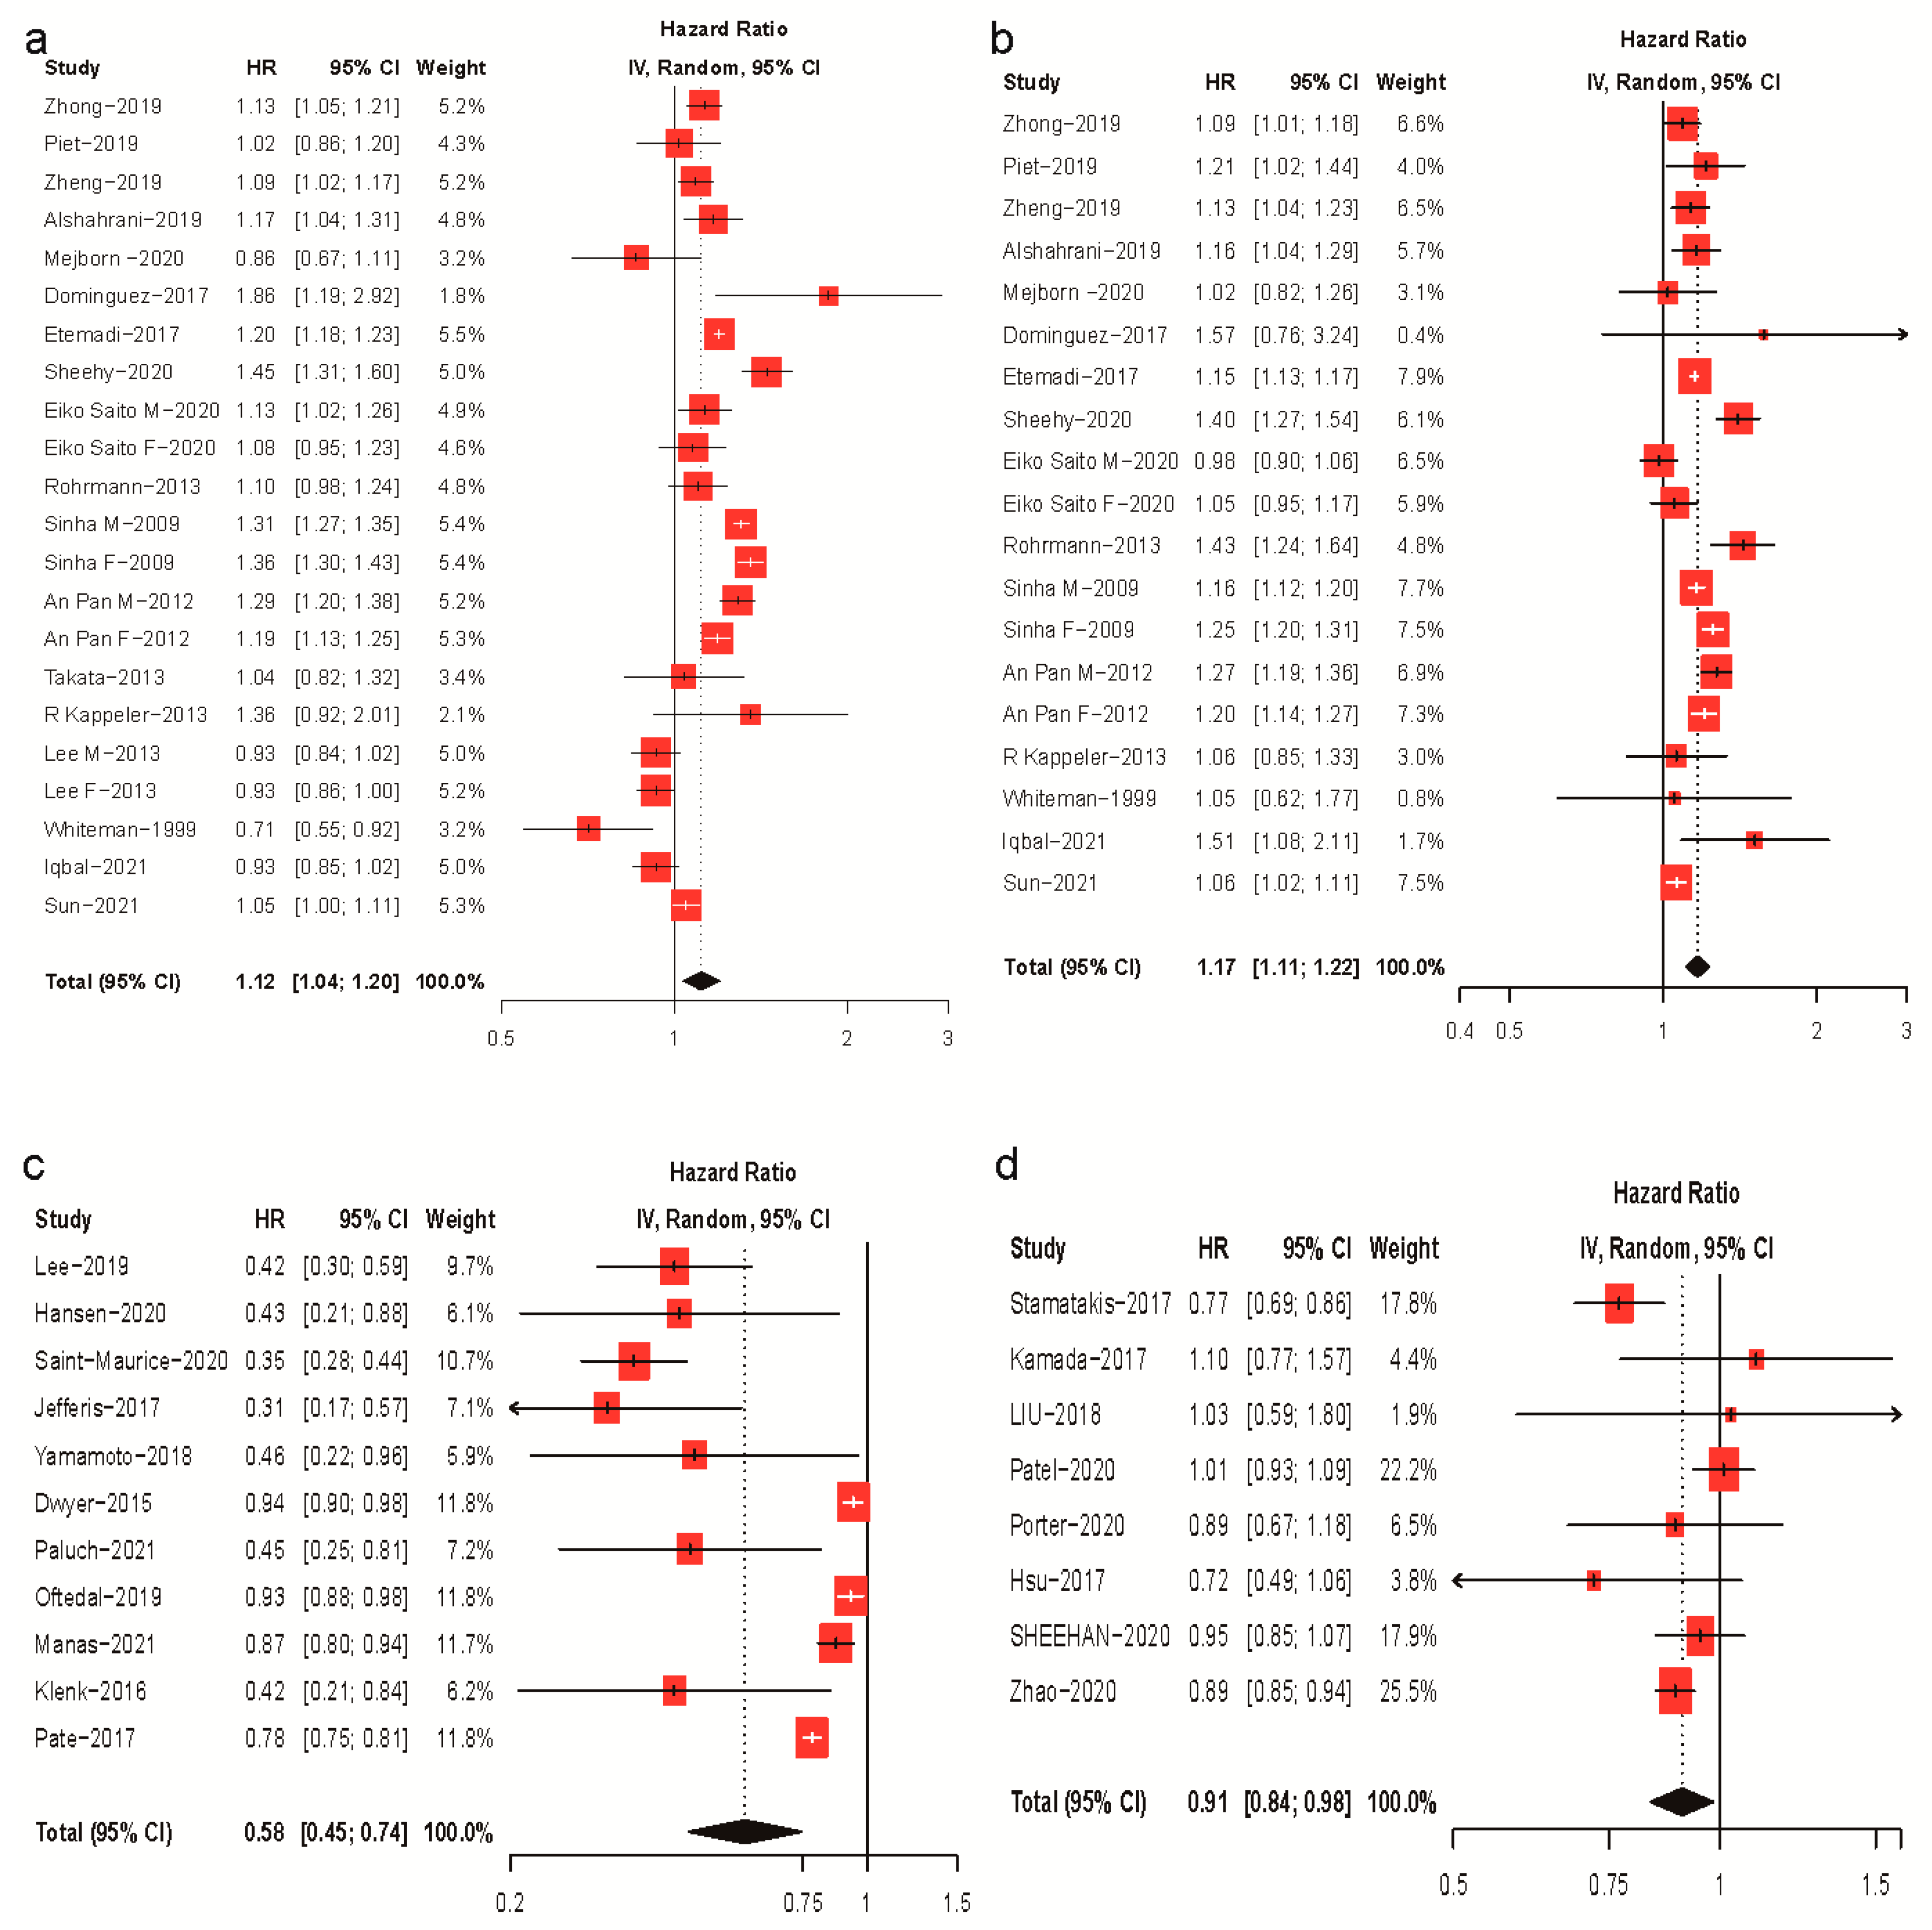
3.1. Meta-Analysis of Meat Intake, Physical Activity, and Mortality Risk

Overall, 11,286 articles were identified in the initial search. Following the exclusion of duplicates and those that did not meet the inclusion criteria, 130 full-text articles of potentially relevant studies were identified. In total, 76 records were excluded because they were review and meta-analysis studies (n = 14); the exposure or outcome was not of interest (n = 10); the studies had insufficient data (n = 9); or the studies were on an unhealthy population (n = 43). We further excluded 10 records because of multiple publications from the same population cohorts. By contrast, three studies were added after a manual search and review of the reference lists. Finally, 47 articles were included (Figure 1).
Of the 47 articles, 27 reported the effect sizes for meat intake with 5,893,740 participants and 435,880 deaths, 11 reported the effect sizes of daily steps with 173,041 participants and 46,159 deaths, and 9 reported the effect sizes of MSAs with 1,023,245 participants and 103,211 deaths. Of these publications, 40 reported the effect sizes of all-cause mortality, 23 of CVD mortality, and 27 of cancer mortality.
In comparisons of the highest versus lowest categories, the daily intake of red meat (18 papers [12,13,14,15,16,17,18,19,20,21,22,23,24,25,26,27,28,29]) and processed meat (16 papers [12,13,14,15,16,17,19,20,21,22,23,24,25,27,28,29]) was associated with a 12% (HR: 1.12; 95% CI: 1.04–1.20) and 17% (HR: 0.77; 95% CI 0.61–0.98) increased risk of all-cause mortality, respectively (Figure 2). Daily steps (eleven papers [30,31,32,33,34,35,36,37,38,39,40]) and MSAs (eight papers [41,42,43,44,45,46,47,48]) were associated with a 42% (HR: 0.58; 95% CI: 0.45–0.74) and 9% (HR: 0.91; 95% CI: 0.84–0.98) lower risk of all-cause mortality, respectively (Figure 2). Substantial heterogeneity was observed in the included studies (I2 = 92%, p < 0.01 for red meat; I2 = 80%, p < 0.01 for processed meat; I2 = 93%, p < 0.01 for daily steps; I2 = 62%, p < 0.01 for MSAs). No evidence of publication bias was found in the analyses of red meat (Egger’s test, p = 0.069; Begg’s test, p = 0.430), processed meat (p = 0.638; p = 0.576), or MSA (p = 0.994; p = 0.902). Little evidence of publication bias was observed in the daily steps analysis (Egger’s test, p = 0.040; Begg’s test, p = 0.815) (Table S10).
Subgroup comparisons and sensitivity analyses indicated that, for all-cause mortality risks, there was no significant difference between red and processed meat (p = 0.34), whereas walking was more effective than MSA (p < 0.01). Insufficient data were available for analyses of CVDs and cancer mortality regarding walking. Detailed results are shown in the Supplementary Materials.

3.2. Dose–Response Analysis of Meat Intake and Mortality Risk

The dose–response analysis of red meat intake and all-cause mortality included 13 cohort studies with 28,875,891 person-years and 305,672 deaths [12,14,15,16,19,20,21,22,23,24,26,27,28], CVD mortality included 10 cohort studies with 18,663,795 person-years and 44,294 deaths [12,16,20,21,22,23,24,26,27,49], and cancer mortality included 10 cohort studies with 27,078,442 person-years and 106,331 deaths [12,15,16,20,21,22,23,24,27,49]. A linear dose–response relationship was observed between red meat intake and CVD mortality (pnonlinearity < 0.001) and cancer mortality (pnonlinearity < 0.001). For every additional 20 g of red meat consumed per day, the CVD and cancer mortalities increased by 4% (HR: 1.04; 95% CI 1.03–1.04) and 2% (HR: 1.02; 95% CI 1.02–1.03), respectively (Figure S4). There was a nonlinear dose–response relationship between red meat intake and all-cause mortality (pnonlinearity < 0.05). (Figure S4).
The dose–response analysis of processed meat and all-cause mortality included 12 cohort studies with a total of 27,411,677 person-years and 295,519 deaths [12,14,15,16,19,20,21,22,23,24,27,28]; CVD mortality included 8 cohort studies with a total of 16,781,876 person-years and 38,733 deaths [12,16,20,21,22,23,24,27]; and cancer mortality included 9 cohort studies with a total of 25,369,466 person-years and 100,510 deaths [12,15,16,20,21,22,23,24,27]. Processed meat intake was associated with all-cause mortality, CVD mortality, and cancer mortality in a nonlinear dose–response relationship (all pnonlinearity < 0.05). The risk of mortality positively is correlated with an increasing intake of processed meat products. Initially, the risk of mortality increased rapidly as the daily intake increased, but the trend tapered, and the increase in risk slowed as the intake exceeded 60–80 g/day (at which point, the risk of all-cause mortality increased by 26%, CVD mortality by 12%, and cancer mortality by 11%) (Figure S4).
Eight cohort studies were included in the dose–response analysis of mixed red and processed meat consumption and the risk of all-cause mortality [12,14,15,20,24,28,50,51], which included 15,763,369 person-years with 194,780 deaths. Five cohort studies for CVD mortality included 6,557,213 person-years with 15,994 deaths [12,20,24,50,51], and six cohort studies for cancer mortality included 15,144,987 person-years with 64,163 deaths [12,15,20,24,50,51]. A linear dose–response relationship between mixed meat consumption and CVD mortality was observed (pnonlinearity = 0.9153). For every additional 40 g of mixed meat consumption per day, the risk of CVD mortality increased by 4% (HR: 1.04; 95% CI 1.03–1.05). A nonlinear dose–response relationship between mixed meat consumption and all-cause or cancer mortality was observed (pnonlinearity < 0.05). The risk of mortality increases with the intake of mixed meat, but the trends became slower when the daily intakes exceed 240 g/day (at which point, the risk of all-cause mortality increased by 33% and cancer mortality by 23%) (Figure S4).

3.3. Dose–Response Analysis of Daily Steps, MSAs, and Mortality Risk

There were five cohort studies included in the dose–response analysis of daily steps and the risk of all-cause mortality [31,32,34,37,40] with 124,351 person-years and 956 deaths. We found a linear relationship between daily steps and all-cause mortality (pnonlinearity = 0.4192), such that, for every additional 2000 steps per day, the risk of all-cause mortality decreased by 17% (HR: 0.83; 95% CI 0.79–0.86) (Figure S6). The dose–response of daily steps and mortality risk due to CVDs or cancer were not performed because of limited data.
Four cohorts were included in the dose–response analysis of MSAs and all-cause mortality with 2,004,873 person-years and 27,128 deaths [42,43,44,47]. Four studies examined the dose–response analysis between MSAs and CVD mortality with 2,018,472 person-years and 8031 deaths [42,43,44,47] and three studies for MSAs and cancer mortality with 1,916,240 person-years and 7875 deaths [42,44,47]. Significant nonlinear dose–responses were found between the length of time of MSAs per week and all-cause, CVD, and cancer mortalities (all pnonlinearity < 0.05). The analyses indicated a J-shaped relationship between MSA time and the risk of mortality, with the risk being lowest at 30–40 min/week, but then, it increased sharply (Figure S5).
When MSA was 39.5 min/week, the risk of all-cause mortality was reduced by 20% (HR: 0.80; 95% CI 0.75–0.84), which was much higher than the effect for the comparisons of the highest versus lowest categories (0.91; 95% CI: 0.84–0.98). Conversely, when MSA was 30 min/week, the risk of CVD and cancer mortalities was reduced by 22% (HR: 0.78; 95% CI 0.70–0.87) and 13% (HR: 0.87; 95% CI 0.79–0.96), respectively.

3.4. Subgroup and Sensitivity Analyses

Subgroup analyses were performed based on the study region, methods of meat intake surveys, the number of participants, the meat intake unit, and the published year. The results showed that the source of heterogeneity in studies of red meat intake and cancer mortality may be caused by the number of participants (Table S5). Subgroup analyses on the relationship between MSAs and all-cause mortality were performed based on the study region, participation, follow-up years, and grouping criteria. The results showed that the source of heterogeneity may be the study region and the follow-up years (Table S5). Significant findings persisted across most subgroups, and there was little evidence of heterogeneity between most subgroups (Table S5). The results persisted in sensitivity analyses when excluding one study at a time from each analysis (Figures S9–S13).

3.5. GRADE Assessment

Because of statistical heterogeneity and publication bias, the certainty of the evidence was downgraded to very low for the associations of red meat intake and mortality; processed meat intake and the risk of mortality from all causes and CVDs; mixed red and processed meat intake and mortality; MSA and the risk of mortality from all-causes and cancer; and daily steps and all-cause mortality (Table S10).

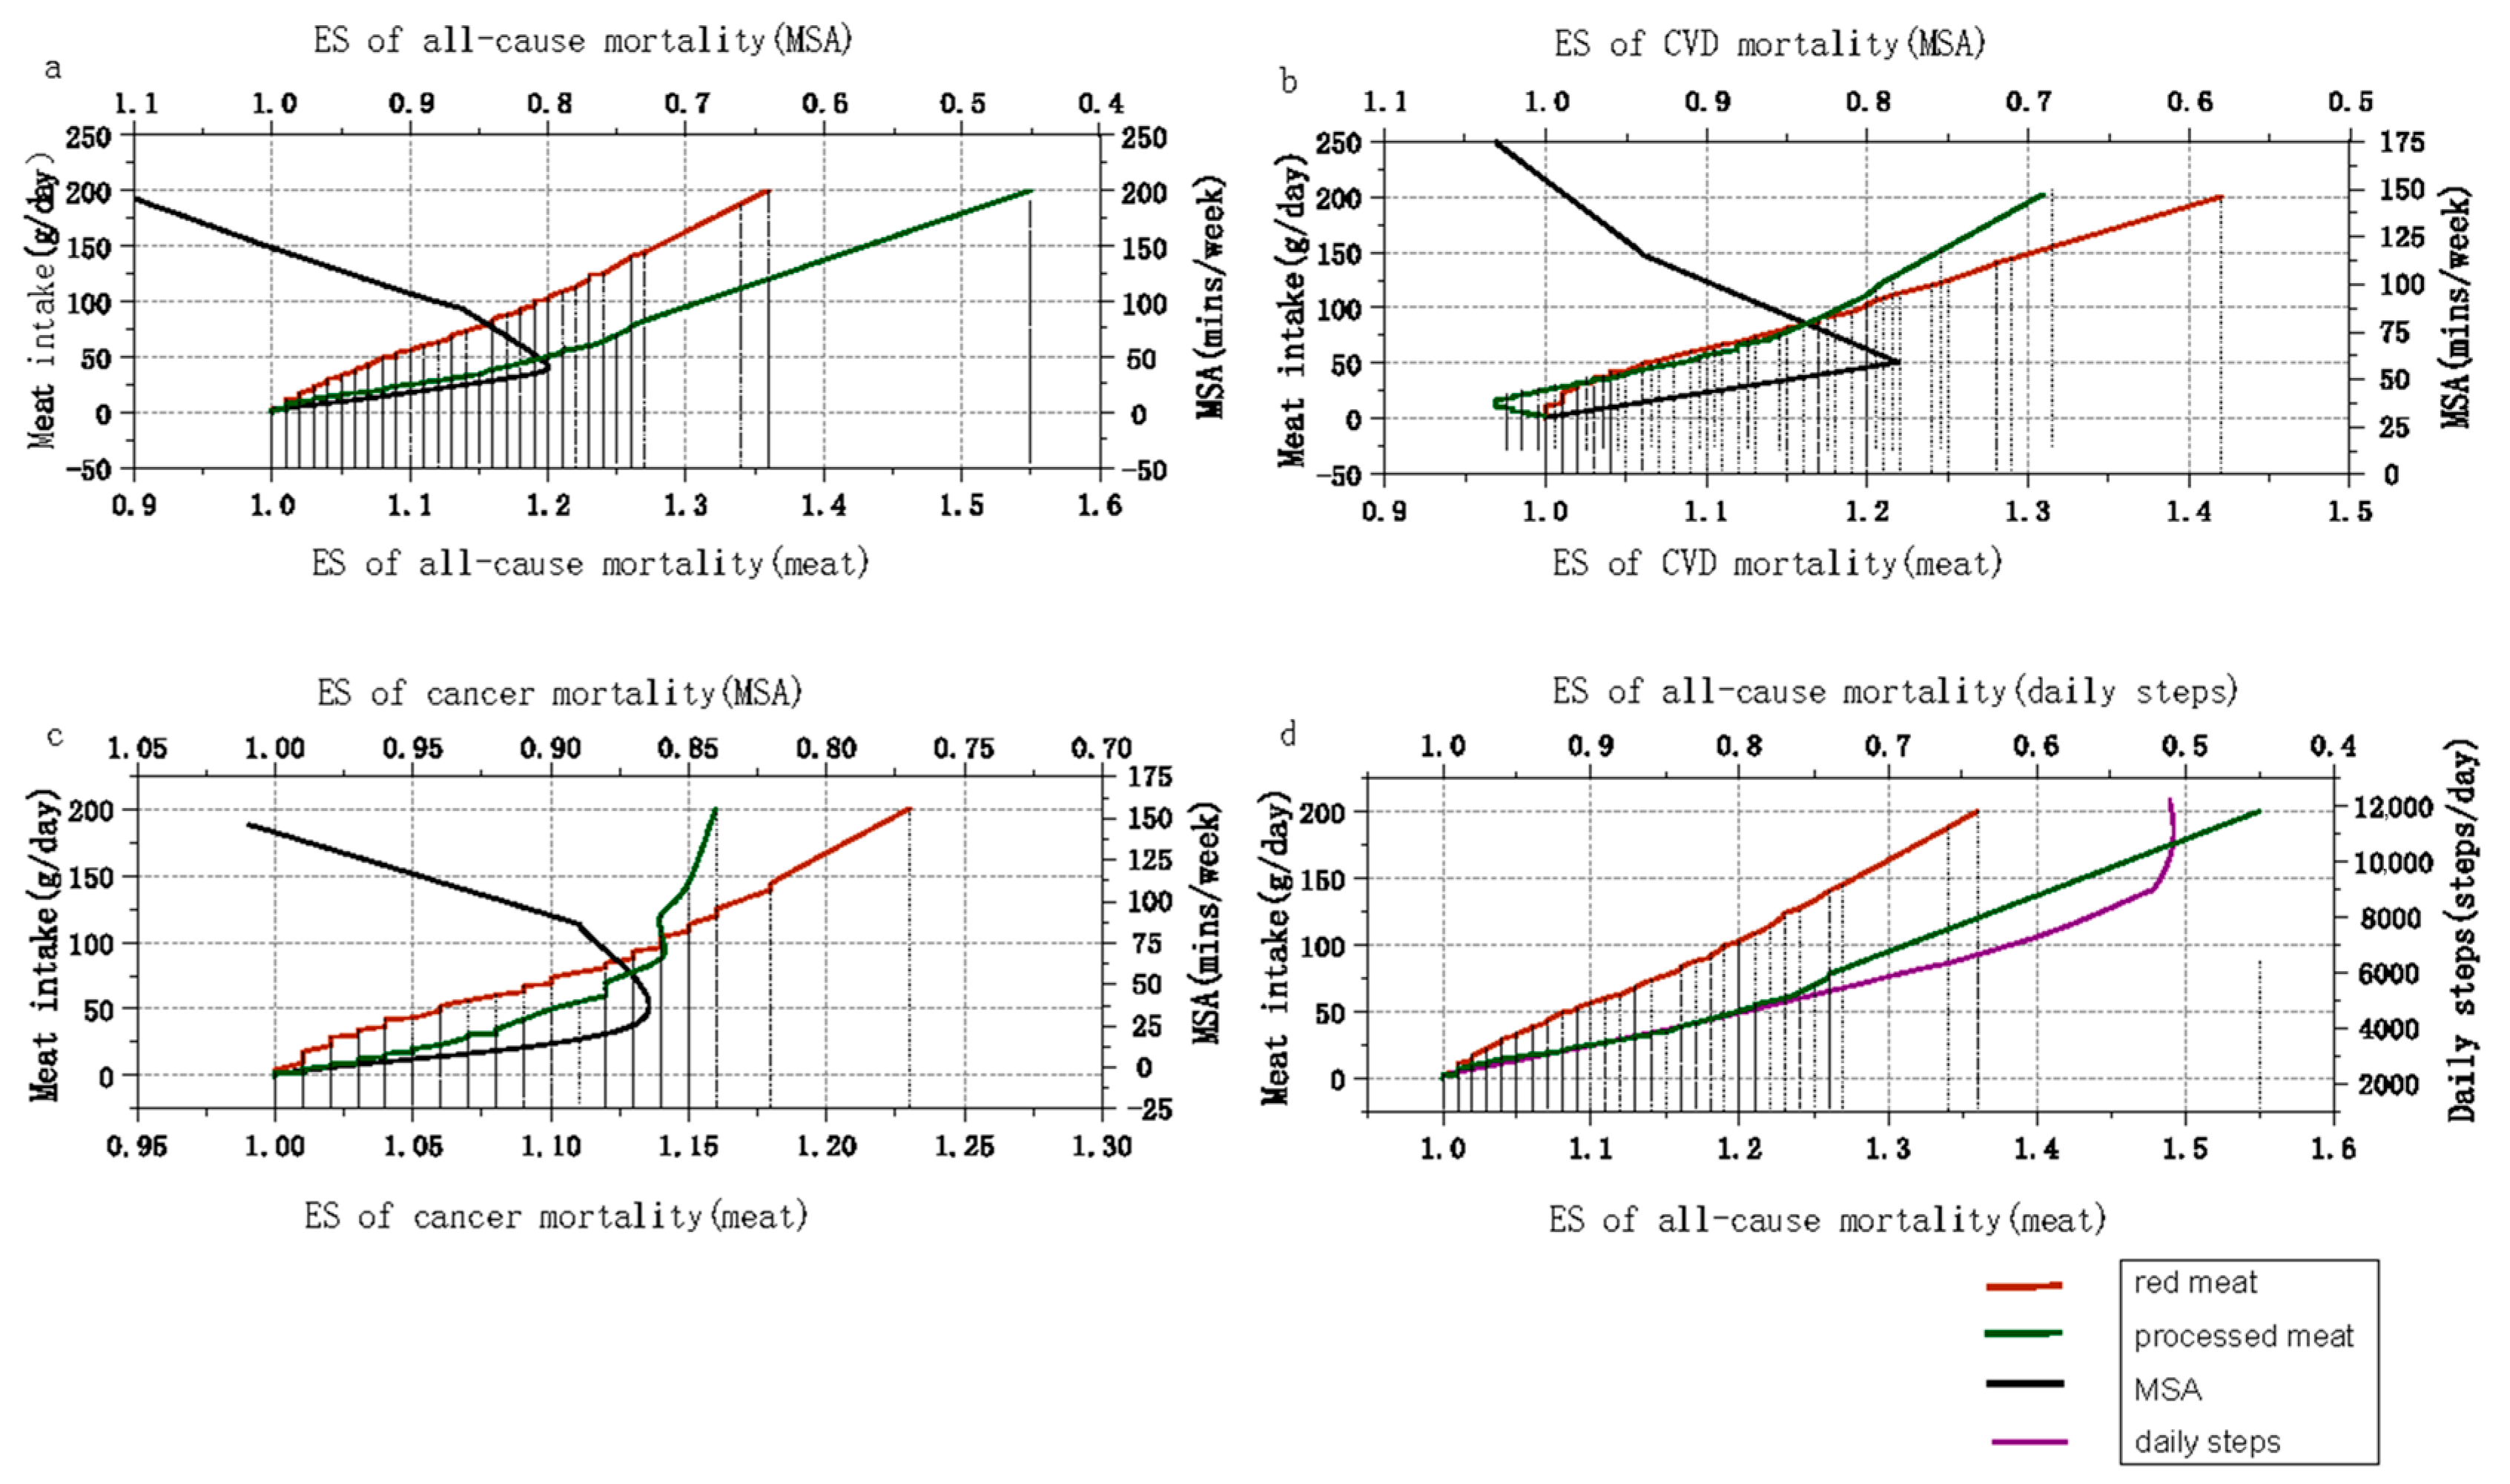
3.6. Balanced Dose–Response Relationship between Meat Intake and Physical Activity

As shown in Figure 3, the reduced risk (20%) from 39.5 min/week of MSA or 4100 steps/day was equivalent to the increased risk of all-cause mortality due to the intake of 103.4 g/day red meat or 50 g/day processed meat. The estimation of the allowable intake of red meat was higher for the same amount of risk than processed meat; the risk decreased further as the number of steps per day increased, but the risk was reversed when MSA exceeded the threshold (39.5 min/week) (Figure 3a,d, Table S9).
For the same risk of mortality, the consumption of red meat was initially greater than that of processed meat, whereas, as the risk of mortality increased further, the consumed amount of processed meat exceeded that of red meat. The reduced CVD mortality risk (22%) for 30 min/week of MSA was equivalent to the increased risk due to 105.40 g/day of red meat intake or 119.22 g/day of processed meat intake (Figure 3b, Table S9). Additionally, 30 min/week of MSA was equivalent to the 13% risk of cancer mortality associated with 88.35 g/day of red meat or 69.70 g/day of processed meat intake (Figure 3c, Table S9). Unlike the results for all-cause mortality risk, the tolerable intake of red meat was higher than that of processed meat when the increased risk of CVD (cancer) mortality was <16% (14%), and when this threshold was exceeded, processed meat had a greater tolerable intake.

4. Discussion

4.1. Findings of this Study

This study systematically investigated the trade-offs between red and processed meat intake and physical activity in long-term mortality outcomes. We compared the risk of mortality due to meat intake and physical activity separately and found that processed meat showed a higher all-cause mortality risk than red meat, while walking was more effective than MSA in reducing mortality risk but required longer activity.

4.2. Comparison with Other Studies and Mechanistic Insights

Numerous observational studies have shown that the high consumption of red meat and processed meat products is associated with an increased risk of mortality [52,53,54]. Our findings are consistent with those of recent meta-analysis studies that showed that red meat and processed meat consumption are associated with an increased risk of all-cause, CVD, and cancer mortality and that there is a positive dose–response relationship [53,54,55]. Interestingly, when comparing the dose responses, we further noted that red meat consumption was almost twice as high as processed meat consumption at the same risk of all-cause mortality. Processed meats are defined as products typically made from red meat that has been cured, salted, or smoked (e.g., ham or bacon) to improve the durability of the food product and/or to improve the color and taste and often contain large amounts of minced fatty tissue (e.g., sausages). Therefore, in contrast to red meat, at the same intake, processed meat may lead to an increased intake of saturated fats, cholesterol, salt, nitrite, polycyclic aromatic hydrocarbons, and heterocyclic amines [15,56]. All of these chemicals have been shown to cause chronic noncommunicable diseases, including cancer [57,58], CVDs [59,60], and diabetes [61]. This may explain why processed meat has a lower intake dose than red meat intake when the risk of all-cause mortality is the same.
By contrast, when we focused on CVDs and cancer, we found that, for the same risk of mortality, red meat consumption was initially greater than processed meat consumption, but with the increase in intake, the gap between the two gradually narrowed until the intake reached 84.86 g/day (CVDs) and 100 g/day (cancer), at which point, this was reversed. The biggest difference between processed and unprocessed meats is the number of preservatives, such as nitrites [62]. The risk of cancer in certain populations may be increased if the diet is high in nitrites. However, small doses of nitrite can lower blood pressure through vasodilatory properties, which may explain the differences we observed between red meat and processed meat intake in terms of cardiovascular disease and cancer mortality [63]. As is well known, the etiology of CVDs and cancer is complex, involving the interactions of genetic, environmental, and lifestyle factors. As a part of the diet, meat intake tends to be highly correlated with other diets and living habits. For example, high red and processed meat consumption, a hallmark of Western dietary patterns, typically involves the consumption of more than 100 g/day, together with the high consumption of sugar-sweetened beverages, refined grains, and nonmeat foods high in sodium, added sugar, and saturated fats [16,64]. This eating pattern is also associated with other unhealthy lifestyle behaviors, such as low physical activity, high alcohol intake, and tobacco use [1]. All of these may increase the risk of mortality from CVDs and cancer [65,66]. These findings emphasize the importance of distinguishing between meat types because processed meat appears to lead to higher mortality than unprocessed meat when total meat consumption cannot be limited to <100 g/day. However, an effort to limit the total amount of meat intake is the most effective method.
Physiological performance maintenance and health improvements generally result from regular physical activity, and most of these effects are highly predictable and dose-dependent and can be extended to various types of populations [7,67]. Walking, as an aerobic exercise, can improve body composition, lipids, insulin resistance, and inflammation. Epidemiological evidence suggests that 10 to 20 min of leisure aerobic exercise every day is sufficient to extend life expectancy [68], while high-level aerobic exercise (e.g., running) can provide additional survival benefits, which is 3–5 times the recommended minimum physical activity (75–150 min/week) at most, with an up to 10-fold-higher training volume generally considered to be safe and well-tolerated [69,70]. Recently, some studies aimed to determine the association between the number of steps per day and the risk of all-cause mortality [7,71]. Our dose–response meta-analysis also indicated a sharp linear inverse association, with an increase of 2000 steps per day associated with a 17% reduction in all-cause mortality, and the risk of mortality decreased proportionally with the increase in steps per day from 2000 to 12,000. Similar to the aforementioned biological mechanisms of walking, MSAs can increase muscle mass and strength, thereby improving glycemic control and insulin sensitivity. _ENREF_74 Moreover, MSAs are thought to reduce adiposity, such as visceral fat, and improve other mediating risk factors, including blood pressure, lipids, and lipoproteins [72]. However, for MSA, the dose–response curve for the risk of all-cause, CVD, and cancer mortalities in our research was J-shaped, suggesting that the greatest health benefits of MSA can be achieved when its duration is approximately 30–40 min/week. The meta-analysis by Giovannucci et al. also showed that, for CVD and all-cause mortality risks, the benefits of higher MSA levels (≥2.5 h/week) were less, or even detrimental, relative to lower MSA levels [8]. Although some studies have shown that high-intensity resistance training may have some adverse effects, such as increased arterial stiffness and myocardial hypertrophy [73], there is still insufficient evidence to explain why participation in MSA for a longer time has no additional benefits or why it may even reduce benefits. Training > 2.5 h (150 min) per week requires caution. Therefore, in terms of time efficiency, less time spent on MSA than walking reduced the risk of all-cause mortality by the same amount; therefore, it is recommended to conduct no more than 40 min/week of MSA to help reduce the risk of mortality. For walking, even a slight increase in steps per day was associated with a significantly reduced risk of all-cause mortality. However, health effect estimates for over 12,000 steps per day remain limited.
Epidemiologic and animal studies have clearly established that physical activity and diet play significant roles in healthy metabolism and disease prevention [74,75,76]. For example, a cohort study conducted by Ismael et al. examined the joint association between physical activity and Mediterranean diet scores and found that, among those who insisted on high physical activity and healthy diet scores, the risk of all-cause mortality was reduced the most [77]. A few experimental studies involving human subjects have indicated that high-intensity exercise frequently counteracts the negative metabolic consequences of overeating, including insulinemic responses, cardiometabolic profiles, and gene expression in adipose tissue [75,76]. In a short-term experimental study on mice conducted by Gioscia-Ryan et al., a Western diet worsened age-related endothelial dysfunction, vascular oxidative stress, and aortic inflammation, while exercise lessened or even reversed all these effects [74]. The fundamental metabolic pathways that food and exercise might use to impair and improve health, respectively, are substantially the same [67]. However, the mechanisms by which diet and physical activity interact and how to achieve the optimal combination of the two for benefit remain elusive. In our study, we partially visualized the balance of mortality risk between physical activity and red or processed meat intake using dose–response relationship graphs. For all-cause mortality, consuming 103.4 g of red meat or 50 g of processed meat per day increased the risk by 20%, and these risks were equivalent to the risk reduction associated with walking and MSA requiring 4100 steps/day and 39.5 min/week, respectively. These findings imply that, when one consumes red or processed meat in one’s diet, one may be able to mitigate the increased mortality risk associated with red and processed meat intake by engaging in a certain amount of physical activity, from simple walking to time-saving MSA. Overall, the main implication of our results is to help people adjust their physical activity patterns and durations according to their daily intake of red and processed meat by referring to the balanced scale we provided and thereby reduce the possible increased mortality due to the adverse physiological outcomes of the long-term consumption of excessive red and processed meat.

4.3. Strengths and Weaknesses of this Study

The most significant strength of this meta-analysis is that, for the first time, risk factors for mortality were jointly analyzed with protective factors to infer a balanced association between red and processed meat intake and daily step count and MSA from a dose–response meta-analysis. Since only the effect sizes with the most complete adjustment for confounding factors were included, the stability of the results was ensured to the greatest extent. In addition, a study [78] based on the UK Biobank population examined independent and interactive associations between physical activity and diet and all-cause and CVD, and no additive or multiplicative interactions between physical activity categories and dietary quality was found. Therefore, this means that the equilibrium relationship we inferred should exist even in the same population in the real world, rather than just a model-based relational assumption. Second, we determined the reference intake dose of red meat versus processed meat at the same mortality risk and the MSA time threshold for the most efficient reduction in mortality risk based on the dose–response correlation curves so as to recommend more appropriate protein sources and exercise modalities. Third, all included studies were prospective, and recall bias and selection bias were negligible. Finally, the large number of participants and mortalities allowed for a more accurate quantitative assessment of the association between meat intake, MSA, daily steps, and mortality, making it more reliable than any single study.
This study has some limitations. First, when estimating meat intake, measurement error is inevitable. Second, there was obvious heterogeneity between the included studies, which may have resulted from differences in follow-ups, exposure assessment methods, frequency of dietary assessments, and adjustments of confounding factors. Heterogeneity and publication bias both reduce the certainty of meta-analysis evidence, thus affecting the accuracy of the balance scale estimation. Third, we quantified the balanced relationship between meat intake and physical activity based on the point estimation of dose–response curves in the meta-analysis, which still requires conservative and strict interpretation. Fourth, a high level of physical activity cannot completely compensate for the adverse impact of an unhealthy diet on the physiology and mortality risk [78]; what we proposed is purely a preventive balance reference. Finally, in our study, the search deadline was December 2021, but we recently searched and found no other studies of high quality from a different database.

5. Conclusions

We revealed balanced associations for the effect between dietary meat intake and physical activity on mortality risk in the present analysis. Our findings suggested that processed meat may represent a higher risk of mortality than red meat. Unlike walking, a longer time spent on MSA did not correspond to a stronger protective effect after the risk threshold was exceeded. We provided a balanced scale of mortality risk associated with red and processed meat intake and that of daily steps and MSA duration, which may lead to the design of more effective and efficient interventions and policies.

Supplementary Materials

The following supporting information can be downloaded at https://www.mdpi.com/article/10.3390/nu15153373/s1: Table S1: Medical subject headings (MeSH) and non-MeSH keywords used to search relevant publications. Table S2: Characteristics of included studies for association between meat intake and mortality from cardiovascular disease and cancer. Table S3: Characteristics of included studies for association between muscle-strengthening activity and mortality from cardiovascular disease and cancer. Table S4: Results of risk of bias assessment based on the Newcastle-Ottawa scale. Table S5: Association of meat intake, daily steps and muscle-strengthening activity for different subgroups. Table S6: The balanced relationship between meat intake and physical activity (all-cause mortality). Table S7: The balanced relationship between meat intake and physical activity (cardiovascular disease mortality). Table S8: The balanced relationship between meat intake and physical activity (cancer mortality). Table S9: The balanced relationship between meat intake and physical activity. Table S10: The pooled estimates of red and processed meat, physical activity and all-cause, cardiovascular disease and cancer mortality. Table S11: PRISMA Checklist of the systematic review and meta-analysis. Table S12: PRISMA Abstracts Checklist of the systematic review and meta-analysis. Table S13: Number of studies from different databases. Figure S1: Forest plots of meta-analyses of red and processed meat intake and mortality risk. Figure S2: Forest plots of meta-analyses of mixed intake of red and processed meat and mortality risk. Figure S3: Forest plots of meta-analyses of muscle-strengthening activity (MSA) and mortality outcomes. Figure S4: Linear and non-linear dose-response relationships between red and processed meat intake and mortality risk. Figure S5: Non-linear dose-response relationships between MSA and mortality risk. Figure S6: Linear dose-response relationships between daily steps all-cause mortality. Figure S7: Balanced associations between mixed intake of red and processed meat and muscle-strengthening activity. Figure S8: Balanced associations between mixed intake red and processed meat, daily steps and all-cause mortality. Figure S9: Sensitivity analysis of mixed red and processed intake and mortality outcomes. Figure S10: Sensitivity analysis of red meat intake and mortality outcomes. Figure S11: Sensitivity analysis of processed intake and mortality outcomes. Figure S12: Sensitivity analysis of muscle-strengthening activity (MSA) and mortality outcomes. Figure S13: Sensitivity analysis of daily steps and all-cause mortality. Figure S14: Funnel plot of included studies in the meta-analysis of the intake of mixed red and processed meat and mortality from all-cause, cardiovascular disease and cancer. Figure S15: Funnel plot of included studies in the meta-analysis of the intake of red meat and mortality from all-cause, cardiovascular disease, and cancer. Figure S16: Funnel plot of included studies in the meta-analysis of the intake of processed meat and mortality from all-cause, cardiovascular disease, and cancer. Figure S17: Funnel plot of included studies in the meta-analysis of daily steps and all-cause mortality. References [79,80,81,82,83,84,85,86] are mentioned in Supplementary Materials.

Author Contributions

Y.W. and M.W. contributed equally to this work. F.W. and Y.Z. are joint corresponding authors. F.W. conceived the idea for the review. F.W. designed, supervised, and coordinated the study. Y.Z. gave crucial intellectual input. Y.W. and Y.C. searched the literature, extracted data, and assessed the risk of bias. Z.L., J.Y., B.P., Y.G., Y.Y. and Z.H. coded the statistical analyses, figures. Y.W. and F.W. interpreted the data. Y.W., M.W. and F.W. drafted the manuscript. F.W. obtained funding. All authors have read and agreed to the published version of the manuscript.

Funding

This work was supported by the grants from National Nature Science Foundation of China (No. 82173514). The funders of the study had no role in the study design, data collection, data analysis, data interpretation, or writing of the report.

Data Availability Statement

No new data were created or analyzed in this study. Data sharing is not applicable to this article.

Conflicts of Interest

The authors declare no conflict of interest.

References

  1. World Health Organization. NCD Mortality and Morbidity. 2017, Volume 18. Available online: https://www.who.int/data/gho/data/themes/topics/topic-details/GHO/ncd-mortality (accessed on 24 November 2022).
  2. Stewart, C.; Piernas, C.; Cook, B.; Jebb, S.A. Trends in UK meat consumption: Analysis of data from years 1–11 (2008–09 to 2018–19) of the National Diet and Nutrition Survey rolling programme. Lancet Planet. Health 2021, 5, e699–e708. [Google Scholar] [CrossRef] [PubMed]
  3. Zeng, L.; Ruan, M.; Liu, J.; Wilde, P.; Naumova, E.N.; Mozaffarian, D.; Zhang, F.F. Trends in Processed Meat, Unprocessed Red Meat, Poultry, and Fish Consumption in the United States, 1999–2016. J. Acad. Nutr. Diet. 2019, 119, 1085–1098.e12. [Google Scholar] [CrossRef] [PubMed]
  4. Godfray, H.C.J.; Aveyard, P.; Garnett, T.; Hall, J.W.; Key, T.J.; Lorimer, J.; Pierrehumbert, R.T.; Scarborough, P.; Springmann, M.; Jebb, S.A. Meat consumption, health, and the environment. Science 2018, 361, eaam5324. [Google Scholar] [CrossRef] [PubMed] [Green Version]
  5. Flegal, K.M.; Kit, B.K.; Orpana, H.; Graubard, B.I. Association of All-Cause Mortality with Overweight and Obesity Using Standard Body Mass Index Categories: A systematic review and meta-analysis. JAMA 2013, 309, 71–82. [Google Scholar] [CrossRef] [PubMed] [Green Version]
  6. Rouhani, M.H.; Salehi-Abargouei, A.; Surkan, P.J.; Azadbakht, L. Is there a relationship between red or processed meat intake and obesity? A systematic review and meta-analysis of observational studies. Obes. Rev. 2014, 15, 740–748. [Google Scholar] [CrossRef] [PubMed]
  7. Paluch, A.E.; Bajpai, S.; Bassett, D.R.; Carnethon, M.R.; Ekelund, U.; Evenson, K.R.; Galuska, D.A.; Jefferis, B.J.; Kraus, W.E.; Lee, I.-M.; et al. Daily steps and all-cause mortality: A meta-analysis of 15 international cohorts. Lancet Public Health 2022, 7, e219–e228. [Google Scholar] [CrossRef]
  8. Giovannucci, E.L.; Rezende, L.F.M.; Lee, D.H. Muscle-strengthening activities and risk of cardiovascular disease, type 2 diabetes, cancer and mortality: A review of prospective cohort studies. J. Intern. Med. 2021, 290, 789–805. [Google Scholar] [CrossRef]
  9. Stang, A. Critical evaluation of the Newcastle-Ottawa scale for the assessment of the quality of nonrandomized studies in meta-analyses. Eur. J. Epidemiol. 2010, 25, 603–605. [Google Scholar] [CrossRef] [Green Version]
  10. Guyatt, G.H.; Oxman, A.D.; Vist, G.E.; Kunz, R.; Falck-Ytter, Y.; Alonso-Coello, P.; Schünemann, H.J. GRADE: An emerging consensus on rating quality of evidence and strength of recommendations. BMJ 2008, 336, 924–926. [Google Scholar] [CrossRef] [Green Version]
  11. Bekkering, G.E.; Harris, R.J.; Thomas, S.; Mayer, A.-M.B.; Beynon, R.; Ness, A.R.; Harbord, R.M.; Bain, C.; Smith, G.D.; Sterne, J.A.C. How Much of the Data Published in Observational Studies of the Association between Diet and Prostate or Bladder Cancer Is Usable for Meta-Analysis? Am. J. Epidemiol. 2008, 167, 1017–1026. [Google Scholar] [CrossRef] [Green Version]
  12. Alshahrani, S.M.; Fraser, G.E.; Sabaté, J.; Knutsen, R.; Shavlik, D.; Mashchak, A.; Lloren, J.I.; Orlich, M.J. Red and Processed Meat and Mortality in a Low Meat Intake Population. Nutrients 2019, 11, 622. [Google Scholar] [CrossRef] [PubMed] [Green Version]
  13. Whiteman, D.; Muir, J.; Jones, L.; Murphy, M.; Key, T. Dietary questions as determinants of mortality: The OXCHECK experience. Public Health Nutr. 1999, 2, 477–487. [Google Scholar] [CrossRef] [PubMed] [Green Version]
  14. Dominguez, L.J.; Bes-Rastrollo, M.; Basterra-Gortari, F.J.; Gea, A.; Barbagallo, M.; Martínez-González, M.A. Should we recommend reductions in saturated fat intake or in red/processed meat consumption? The SUN prospective cohort study. Clin. Nutr. 2018, 37, 1389–1398. [Google Scholar] [CrossRef] [PubMed] [Green Version]
  15. Etemadi, A.; Sinha, R.; Ward, M.H.; Graubard, B.I.; Inoue-Choi, M.; Dawsey, S.M.; Abnet, C.C. Mortality from Different Causes Associated with Meat, Heme Iron, Nitrates, and Nitrites in the NIH-AARP Diet and Health Study: Population Based Cohort Study. BMJ 2017, 357, j1957. [Google Scholar] [CrossRef] [PubMed] [Green Version]
  16. Iqbal, R.; Dehghan, M.; Mente, A.; Rangarajan, S.; Wielgosz, A.; Avezum, A.; Seron, P.; AlHabib, K.F.; Lopez-Jaramillo, P.; Swaminathan, S.; et al. Associations of unprocessed and processed meat intake with mortality and cardiovascular disease in 21 countries [Prospective Urban Rural Epidemiology (PURE) Study]: A prospective cohort study. Am. J. Clin. Nutr. 2021, 114, 1049–1058. [Google Scholar] [CrossRef] [PubMed]
  17. Kappeler, R.; Eichholzer, M.; Rohrmann, S. Meat consumption and diet quality and mortality in NHANES III. Eur. J. Clin. Nutr. 2013, 67, 598–606. [Google Scholar] [CrossRef] [PubMed]
  18. Lee, J.E.; McLerran, D.F.; Rolland, B.; Chen, Y.; Grant, E.J.; Vedanthan, R.; Inoue, M.; Tsugane, S.; Gao, Y.-T.; Tsuji, I.; et al. Meat intake and cause-specific mortality: A pooled analysis of Asian prospective cohort studies. Am. J. Clin. Nutr. 2013, 98, 1032–1041. [Google Scholar] [CrossRef] [Green Version]
  19. Mejborn, H.; Møller, S.P.; Thygesen, L.C.; Biltoft-Jensen, A. Dietary Intake of Red Meat, Processed Meat, and Poultry and Risk of Colorectal Cancer and All-Cause Mortality in the Context of Dietary Guideline Compliance. Nutrients 2020, 13, 32. [Google Scholar] [CrossRef]
  20. Sun, Q.; Pan, A.; Bernstein, A.M.; Schulze, M.B.; Manson, J.E.; Stampfer, M.J.; Willett, W.C.; Hu, F.B. Red Meat Consumption and Mortality: Results from 2 prospective cohort studies. Arch. Intern. Med. 2012, 172, 555–563. [Google Scholar] [CrossRef] [Green Version]
  21. Sinha, R.; Graubard, B.I.; Leitzmann, M.F.; Schatzkin, A. Meat Intake and Mortality: A Prospective Study of Over Half a Million People. Arch. Intern. Med. 2009, 169, 562–571. [Google Scholar] [CrossRef]
  22. Rohrmann, S.; Overvad, K.; Bueno-de-Mesquita, H.B.; Jakobsen, M.U.; Egeberg, R.; Tjønneland, A.; Nailler, L.; Boutron-Ruault, M.-C.; Clavel-Chapelon, F.; Krogh, V.; et al. Meat consumption and mortality—Results from the European Prospective Investigation into Cancer and Nutrition. BMC Med. 2013, 11, 63. [Google Scholar] [CrossRef] [PubMed] [Green Version]
  23. Saito, E.; Tang, X.; Abe, S.K.; Sawada, N.; Ishihara, J.; Takachi, R.; Iso, H.; Shimazu, T.; Yamaji, T.; Iwasaki, M.; et al. Association between meat intake and mortality due to all-cause and major causes of death in a Japanese population. PLoS ONE 2020, 15, e0244007. [Google Scholar] [CrossRef] [PubMed]
  24. Sheehy, S.; Palmer, J.R.; Rosenberg, L. High Consumption of Red Meat Is Associated with Excess Mortality Among African-American Women. J. Nutr. 2020, 150, 3249–3258. [Google Scholar] [CrossRef] [PubMed]
  25. Sun, Y.; Liu, B.; Snetselaar, L.G.; Wallace, R.B.; Shadyab, A.H.; Kroenke, C.H.; Haring, B.; Howard, B.V.; Shikany, J.M.; Valdiviezo, C.; et al. Association of Major Dietary Protein Sources with All-Cause and Cause-Specific Mortality: Prospective Cohort Study. J. Am. Heart Assoc. 2021, 10, e015553. [Google Scholar] [CrossRef]
  26. Takata, Y.; Shu, X.-O.; Gao, Y.-T.; Li, H.; Zhang, X.; Gao, J.; Cai, H.; Yang, G.; Xiang, Y.-B.; Zheng, W. Red Meat and Poultry Intakes and Risk of Total and Cause-Specific Mortality: Results from Cohort Studies of Chinese Adults in Shanghai. PLoS ONE 2013, 8, e56963. [Google Scholar] [CrossRef] [Green Version]
  27. van den Brandt, P.A. Red meat, processed meat, and other dietary protein sources and risk of overall and cause-specific mortality in The Netherlands Cohort Study. Eur. J. Epidemiol. 2019, 34, 351–369. [Google Scholar] [CrossRef] [Green Version]
  28. Zheng, Y.; Li, Y.; Satija, A.; Pan, A.; Sotos-Prieto, M.; Rimm, E.; Willett, W.C.; Hu, F.B. Association of changes in red meat consumption with total and cause specific mortality among US women and men: Two prospective cohort studies. BMJ 2019, 365, l2110. [Google Scholar] [CrossRef] [Green Version]
  29. Zhong, V.W.; Van Horn, L.; Greenland, P.; Carnethon, M.R.; Ning, H.; Wilkins, J.T.; Lloyd-Jones, D.M.; Allen, N. Associations of Processed Meat, Unprocessed Red Meat, Poultry, or Fish Intake with Incident Cardiovascular Disease and All-Cause Mortality. JAMA Intern. Med. 2020, 180, 503–512. [Google Scholar] [CrossRef]
  30. Dwyer, T.; Pezic, A.; Sun, C.; Cochrane, J.; Venn, A.; Srikanth, V.; Jones, G.; Shook, R.; Sui, X.; Ortaglia, A.; et al. Objectively Measured Daily Steps and Subsequent Long Term All-Cause Mortality: The Tasped Prospective Cohort Study. PLoS ONE 2015, 10, e0141274. [Google Scholar] [CrossRef]
  31. Hansen, B.H.; Dalene, K.E.; Ekelund, U.; Fagerland, M.W.; Kolle, E.; Steene-Johannessen, J.; Tarp, J.; Anderssen, S.A. Step by step: Association of device-measured daily steps with all-cause mortality—A prospective cohort Study. Scand. J. Med. Sci. Sports 2020, 30, 1705–1711. [Google Scholar] [CrossRef]
  32. Jefferis, B.J.; Parsons, T.J.; Sartini, C.; Ash, S.; Lennon, L.T.; Papacosta, O.; Morris, R.W.; Wannamethee, S.G.; Lee, I.-M.; Whincup, P.H. Objectively measured physical activity, sedentary behaviour and all-cause mortality in older men: Does volume of activity matter more than pattern of accumulation? Br. J. Sports Med. 2018, 53, 1013–1020. [Google Scholar] [CrossRef]
  33. Klenk, J.; Dallmeier, D.; Denkinger, M.D.; Rapp, K.; Koenig, W.; Rothenbacher, D. ActiFE Study Group Objectively Measured Walking Duration and Sedentary Behaviour and Four-Year Mortality in Older People. PLoS ONE 2016, 11, e0153779. [Google Scholar] [CrossRef] [PubMed] [Green Version]
  34. Lee, I.-M.; Shiroma, E.J.; Kamada, M.; Bassett, D.R.; Matthews, C.E.; Buring, J.E. Association of Step Volume and Intensity with All-Cause Mortality in Older Women. JAMA Intern. Med. 2019, 179, 1105–1112. [Google Scholar] [CrossRef] [PubMed]
  35. Mañas, A.; Cruz, B.D.P.; Ekelund, U.; Reyna, J.L.; Gómez, I.R.; Carreño, J.A.C.; Mañas, L.R.; García, F.J.G.; Ara, I. Association of accelerometer-derived step volume and intensity with hospitalizations and mortality in older adults: A prospective cohort study. J. Sport Health Sci. 2021, 11, 578–585. [Google Scholar] [CrossRef]
  36. Oftedal, S.; Holliday, E.G.; Attia, J.; Brown, W.J.; Collins, C.E.; Ewald, B.; Glozier, N.; McEvoy, M.; Morgan, P.J.; Plotnikoff, R.C.; et al. Daily steps and diet, but not sleep, are related to mortality in older Australians. J. Sci. Med. Sport 2020, 23, 276–282. [Google Scholar] [CrossRef] [Green Version]
  37. Paluch, A.E.; Gabriel, K.P.; Fulton, J.E.; Lewis, C.E.; Schreiner, P.J.; Sternfeld, B.; Sidney, S.; Siddique, J.; Whitaker, K.M.; Carnethon, M.R. Steps per Day and All-Cause Mortality in Middle-aged Adults in the Coronary Artery Risk Development in Young Adults Study. JAMA Netw. Open 2021, 4, e2124516. [Google Scholar] [CrossRef]
  38. Patel, A.V.; Hildebrand, J.S.; Leach, C.R.; Campbell, P.T.; Doyle, C.; Shuval, K.; Wang, Y.; Gapstur, S.M. Walking in Relation to Mortality in a Large Prospective Cohort of Older U.S. Adults. Am. J. Prev. Med. 2018, 54, 10–19. [Google Scholar] [CrossRef] [PubMed]
  39. Saint-Maurice, P.F.; Troiano, R.P.; Bassett, D.R., Jr.; Graubard, B.I.; Carlson, S.A.; Shiroma, E.J.; Fulton, J.E.; Matthews, C.E. Association of Daily Step Count and Step Intensity with Mortality among US Adults. JAMA 2020, 323, 1151–1160. [Google Scholar] [CrossRef]
  40. Yamamoto, N.; Miyazaki, H.; Shimada, M.; Nakagawa, N.; Sawada, S.S.; Nishimuta, M.; Kimura, Y.; Kawakami, R.; Nagayama, H.; Asai, H.; et al. Daily step count and all-cause mortality in a sample of Japanese elderly people: A cohort study. BMC Public Health 2018, 18, 540. [Google Scholar] [CrossRef] [Green Version]
  41. Hsu, B.; Merom, D.; Blyth, F.M.; Naganathan, V.; Hirani, V.; Le Couteur, D.G.; Seibel, M.; Waite, L.M.; Handelsman, D.J.; Cumming, R. Total Physical Activity, Exercise Intensity, and Walking Speed as Predictors of All-Cause and Cause-Specific Mortality Over 7 Years in Older Men: The Concord Health and Aging in Men Project. J. Am. Med. Dir. Assoc. 2018, 19, 216–222. [Google Scholar] [CrossRef]
  42. Kamada, M.; Shiroma, E.J.; Buring, J.E.; Miyachi, M.; Lee, I. Strength Training and All-Cause, Cardiovascular Disease, and Cancer Mortality in Older Women: A Cohort Study. J. Am. Heart Assoc. 2017, 6, e007677. [Google Scholar] [CrossRef] [PubMed] [Green Version]
  43. Liu, Y.; Lee, D.-C.; Li, Y.; Zhu, W.; Zhang, R.; Sui, X.; Lavie, C.J.; Blair, S.N. Associations of Resistance Exercise with Cardiovascular Disease Morbidity and Mortality. Med. Sci. Sports Exerc. 2019, 51, 499–508. [Google Scholar] [CrossRef] [PubMed]
  44. Patel, A.V.; Hodge, J.M.; Rees-Punia, E.; Teras, L.R.; Campbell, P.T.; Gapstur, S.M. Relationship between Muscle-Strengthening Activity and Cause-Specific Mortality in a Large US Cohort. Prev. Chronic Dis. 2020, 17, E78. [Google Scholar] [CrossRef] [PubMed]
  45. Porter, A.K.; Cuthbertson, C.C.; Evenson, K.R. Participation in specific leisure-time activities and mortality risk among U.S. adults. Ann. Epidemiol. 2020, 50, 27–34.e1. [Google Scholar] [CrossRef] [PubMed]
  46. Sheehan, C.M.; Li, L. Associations of Exercise Types with All-Cause Mortality among U.S. Adults. Med. Sci. Sports Exerc. 2020, 52, 2554–2562. [Google Scholar] [CrossRef]
  47. Stamatakis, E.; Lee, I.-M.; Bennie, J.; Freeston, J.; Hamer, M.; O’donovan, G.; Ding, D.; Bauman, A.; Mavros, Y. Does Strength-Promoting Exercise Confer Unique Health Benefits? A Pooled Analysis of Data on 11 Population Cohorts with All-Cause, Cancer, and Cardiovascular Mortality Endpoints. Am. J. Epidemiol. 2018, 187, 1102–1112. [Google Scholar] [CrossRef] [Green Version]
  48. Zhao, M.; Veeranki, S.P.; Magnussen, C.G.; Xi, B. Recommended physical activity and all cause and cause specific mortality in US adults: Prospective cohort study. BMJ 2020, 370, m2031. [Google Scholar] [CrossRef]
  49. Segawa, H.; Kondo, K.; Kadota, A.; Yamauchi, H.; Ohno, S.; Tanaka-Mizuno, S.; Okuda, N.; Miyagawa, N.; Arima, H.; Okamura, T.; et al. Association of Red Meat Intake with the Risk of Cardiovascular Mortality in General Japanese Stratified by Kidney Function: NIPPON DATA80. Nutrients 2020, 12, 3707. [Google Scholar] [CrossRef]
  50. Bellavia, A.; Stilling, F.; Wolk, A. High red meat intake and all-cause cardiovascular and cancer mortality: Is the risk modified by fruit and vegetable intake? Am. J. Clin. Nutr. 2016, 104, 1137–1143. [Google Scholar] [CrossRef] [Green Version]
  51. Farvid, M.S.; Malekshah, A.F.; Pourshams, A.; Poustchi, H.; Sepanlou, S.G.; Sharafkhah, M.; Khoshnia, M.; Farvid, M.; Abnet, C.C.; Kamangar, F.; et al. Dietary Protein Sources and All-Cause and Cause-Specific Mortality: The Golestan Cohort Study in Iran. Am. J. Prev. Med. 2017, 52, 237–248. [Google Scholar] [CrossRef] [Green Version]
  52. Händel, M.N.; Cardoso, I.; Rasmussen, K.M.; Rohde, J.F.; Jacobsen, R.; Nielsen, S.M.; Christensen, R.; Heitmann, B.L. Processed meat intake and chronic disease morbidity and mortality: An overview of systematic reviews and meta-analyses. PLoS ONE 2019, 14, e0223883. [Google Scholar] [CrossRef] [PubMed] [Green Version]
  53. Wang, X.; Lin, X.; Ouyang, Y.Y.; Liu, J.; Zhao, G.; Pan, A.; Hu, F.B. Red and processed meat consumption and mortality: Dose–response meta-analysis of prospective cohort studies. Public Health Nutr. 2016, 19, 893–905. [Google Scholar] [CrossRef] [PubMed] [Green Version]
  54. Abete, I.; Romaguera, D.; Vieira, A.R.; Lopez de Munain, A.; Norat, T. Association between total, processed, red and white meat consumption and all-cause, CVD and IHD mortality: A meta-analysis of cohort studies. Br. J. Nutr. 2014, 112, 762–775. [Google Scholar] [CrossRef] [PubMed] [Green Version]
  55. Farvid, M.S.; Sidahmed, E.; Spence, N.D.; Angua, K.M.; Rosner, B.A.; Barnett, J.B. Consumption of red meat and processed meat and cancer incidence: A systematic review and meta-analysis of prospective studies. Eur. J. Epidemiol. 2021, 36, 937–951. [Google Scholar] [CrossRef] [PubMed]
  56. Rohrmann, S.; Linseisen, J. Processed meat: The real villain? Proc. Nutr. Soc. 2015, 75, 233–241. [Google Scholar] [CrossRef] [PubMed]
  57. D’elia, L.; Rossi, G.; Ippolito, R.; Cappuccio, F.P.; Strazzullo, P. Habitual salt intake and risk of gastric cancer: A meta-analysis of prospective studies. Clin. Nutr. 2012, 31, 489–498. [Google Scholar] [CrossRef]
  58. Abid, Z.; Cross, A.J.; Sinha, R. Meat, dairy, and cancer. Am. J. Clin. Nutr. 2014, 100 (Suppl. S1), 386S–393S. [Google Scholar] [CrossRef] [Green Version]
  59. O’Donnell, M.; Mente, A.; Yusuf, S. Sodium Intake and Cardiovascular Health. Circ. Res. 2015, 116, 1046–1057. [Google Scholar] [CrossRef]
  60. Chowdhury, R.; Warnakula, S.; Kunutsor, S.; Crowe, F.; Ward, H.A.; Johnson, L.; Franco, O.; Butterworth, A.S.; Forouhi, N.; Thompson, S.G.; et al. Association of Dietary, Circulating, and Supplement Fatty Acids with Coronary Risk: A systematic review and meta-analysis. Ann. Intern. Med. 2014, 160, 398–406. [Google Scholar] [CrossRef]
  61. Tong, M.; Neusner, A.; Longato, L.; Lawton, M.; Wands, J.R.; De La Monte, S.M. Nitrosamine exposure causes insulin resistance diseases: Relevance to type 2 diabetes mellitus, non-alcoholic steatohepatitis, and Alzheimer’s disease. J. Alzheimer’s Dis. 2009, 17, 827–844. [Google Scholar]
  62. Micha, R.; Michas, G.; Mozaffarian, D. Unprocessed Red and Processed Meats and Risk of Coronary Artery Disease and Type 2 Diabetes—An Updated Review of the Evidence. Curr. Atheroscler. Rep. 2012, 14, 515–524. [Google Scholar] [CrossRef] [PubMed] [Green Version]
  63. Gilchrist, M.; Shore, A.C.; Benjamin, N. Inorganic nitrate and nitrite and control of blood pressure. Cardiovasc. Res. 2010, 89, 492–498. [Google Scholar] [CrossRef] [PubMed] [Green Version]
  64. Shan, Z.; Rehm, C.D.; Rogers, G.; Ruan, M.; Wang, D.D.; Hu, F.B.; Mozaffarian, D.; Zhang, F.F.; Bhupathiraju, S.N. Trends in Dietary Carbohydrate, Protein, and Fat Intake and Diet Quality among US Adults, 1999–2016. JAMA J. Am. Med. Assoc. 2019, 322, 1178–1187. [Google Scholar] [CrossRef] [Green Version]
  65. Chudasama, Y.V.; Khunti, K.; Gillies, C.L.; Dhalwani, N.N.; Davies, M.J.; Yates, T.; Zaccardi, F. Healthy lifestyle and life expectancy in people with multimorbidity in the UK Biobank: A longitudinal cohort study. PLOS Med. 2020, 17, e1003332. [Google Scholar] [CrossRef]
  66. van den Brandt, P.A. The impact of a healthy lifestyle on the risk of esophageal and gastric cancer subtypes. Eur. J. Epidemiol. 2022, 37, 931–945. [Google Scholar] [CrossRef]
  67. Vuori, I. Health benefits of physical activity with special reference to interaction with diet. Public Health Nutr. 2001, 4, 517–528. [Google Scholar] [CrossRef]
  68. Wen, C.P.; Wai, J.P.M.; Tsai, M.K.; Yang, Y.C.; Cheng, T.Y.D.; Lee, M.-C.; Chan, H.T.; Tsao, C.K.; Tsai, S.P.; Wu, X. Minimum amount of physical activity for reduced mortality and extended life expectancy: A prospective cohort study. Lancet 2011, 378, 1244–1253. [Google Scholar] [CrossRef]
  69. Piercy, K.L.; Troiano, R.P.; Ballard, R.M.; Carlson, S.A.; Fulton, J.E.; Galuska, D.A.; George, S.M.; Olson, R.D. The Physical Activity Guidelines for Americans. JAMA 2018, 320, 2020–2028. [Google Scholar] [CrossRef]
  70. Arem, H.; Moore, S.C.; Patel, A.; Hartge, P.; De Gonzalez, A.B.; Visvanathan, K.; Campbell, P.T.; Freedman, M.; Weiderpass, E.; Adami, H.O.; et al. Leisure Time Physical Activity and Mortality: A detailed pooled analysis of the dose-response relationship. JAMA Intern. Med. 2015, 175, 959–967. [Google Scholar] [CrossRef] [PubMed] [Green Version]
  71. Jayedi, A.; Gohari, A.; Shab-Bidar, S. Daily Step Count and All-Cause Mortality: A Dose–Response Meta-analysis of Prospective Cohort Studies. Sports Med. 2022, 52, 89–99. [Google Scholar] [CrossRef] [PubMed]
  72. Kelley, G.A.; Kelley, K.S. Impact of progressive resistance training on lipids and lipoproteins in adults: A meta-analysis of randomized controlled trials. Prev. Med. 2009, 48, 9–19. [Google Scholar] [CrossRef] [PubMed]
  73. Miyachi, M. Effects of resistance training on arterial stiffness: A meta-analysis. Br. J. Sports Med. 2013, 47, 393–396. [Google Scholar] [CrossRef] [PubMed]
  74. Gioscia-Ryan, R.A.; Clayton, Z.S.; Zigler, M.C.; Richey, J.J.; Cuevas, L.M.; Rossman, M.J.; Battson, M.L.; Ziemba, B.P.; Hutton, D.A.; VanDongen, N.S.; et al. Lifelong voluntary aerobic exercise prevents age- and Western diet- induced vascular dysfunction, mitochondrial oxidative stress and inflammation in mice. J. Physiol. 2021, 599, 911–925. [Google Scholar] [CrossRef] [PubMed]
  75. Bray, G.A.; Bouchard, C. The biology of human overfeeding: A systematic review. Obes. Rev. 2020, 21, e13040. [Google Scholar] [CrossRef]
  76. Duval, C.; Rouillier, M.-A.; Rabasa-Lhoret, R.; Karelis, A.D. High Intensity Exercise: Can It Protect You from a Fast Food Diet? Nutrients 2017, 9, 943. [Google Scholar] [CrossRef] [Green Version]
  77. Alvarez-Alvarez, I.; Zazpe, I.; de Rojas, J.P.; Bes-Rastrollo, M.; Ruiz-Canela, M.; Fernandez-Montero, A.; Hidalgo-Santamaría, M.; Martínez-González, M.A. Mediterranean diet, physical activity and their combined effect on all-cause mortality: The Seguimiento Universidad de Navarra (SUN) cohort. Prev. Med. 2018, 106, 45–52. [Google Scholar] [CrossRef]
  78. Ding, D.; Van Buskirk, J.; Nguyen, B.; Stamatakis, E.; Elbarbary, M.; Veronese, N.; Clare, P.J.; Lee, I.-M.; Ekelund, U.; Fontana, L. Physical activity, diet quality and all-cause cardiovascular disease and cancer mortality: A prospective study of 346 627 UK Biobank participants. Br. J. Sports Med. 2022, 56, 1148–1156. [Google Scholar] [CrossRef]
  79. Rashmi Sinha, P.A.J.C.; Graubard, B.I.; Leitzmann, M.M.F.; Schatzkin, A. Meat Intake and Mortality a Prospective Study of over Half a Million People; American Medical Association: Chicago, IL, USA, 2009. [Google Scholar]
  80. Argyridou, S.; Zaccardi, F.; Davies, M.J.; Khunti, K.; Yates, T. Relevance of physical function in the association of red and processed meat intake with all-cause, cardiovascular, and cancer mortality. Nutr. Metab. Cardiovasc. Dis. 2019, 29, 1308–1315. [Google Scholar] [CrossRef] [PubMed]
  81. McCullough, M.L.; Robertson, A.S.; Jacobs, E.J.; Calle, E.E.; Thun, M.J. A Prospective Study of Diet and Stomach Cancer Mortality in United States Men and Women. Cancer Epidemiol. Biomark. Prev. 2001, 10, 1201–1205. [Google Scholar]
  82. Breslow, R.A.; Graubard, B.I.; Sinha, R.; Subar, A.F. Diet and lung cancer mortality: A 1987 National Health Interview Survey cohort study. Cancer Causes Control 2000, 11, 419–431. [Google Scholar] [CrossRef]
  83. Shaukat, A.; Dostal, A.; Menk, J.; Church, T.R. BMI Is a Risk Factor for Colorectal Cancer Mortality. Dig. Dis. Sci. 2017, 62, 2511–2517. [Google Scholar] [CrossRef] [PubMed]
  84. Coughlin, S.S.; Calle, E.E.; Patel, A.V.; Thun, M.J. Predictors of pancreatic cancer mortality among a large cohort of United States adults. Cancer Causes Control 2000, 11, 915–923. [Google Scholar] [CrossRef] [PubMed]
  85. Zhang, J.; Hayden, K.; Jackson, R.; Schutte, R. Association of red and processed meat consumption with cardiovascular morbidity and mortality in participants with and without obesity: A prospective cohort study. Clin. Nutr. 2021, 40, 3643–3649. [Google Scholar] [CrossRef] [PubMed]
  86. Siahpush, M.; Farazi, P.A.; Wang, H.; Robbins, R.E.; Singh, G.K.; Su, D. Muscle-strengthening physical activity is associated with cancer mortality: Results from the 1998–2011 National Health Interview Surveys, National Death Index record linkage. Cancer Causes Control 2019, 30, 663–670. [Google Scholar] [CrossRef]
Figure 1. Preferred Reporting Items for Systematic Reviews and Meta-Analyses (PRISMA) flow diagram for search strategy.
Nutrients 15 03373 g001
Figure 2. Forest plots of meta-analyses of red and processed meat intake, daily steps, and MSA and all-cause mortality. (a) Red meat intake and all-cause mortality; (b) processed meat intake and all-cause mortality; (c) daily steps and all-cause mortality; (d) MSA and all-cause mortality.
Nutrients 15 03373 g002
Figure 3. Balanced associations between red and processed meat intake and muscle-strengthening activity and daily steps. (a) Meat intake, MSA, and all-cause mortality; (b) meat intake, MSA, and CVD mortality; (c) meat intake, MSA, and cancer mortality; (d) meat intake, daily steps, and all-cause mortality.
Nutrients 15 03373 g003
Table 1. Characteristics of included studies for association between meat intake and all-cause mortality.
Author, Year of Publication, Country Age * No.
of Participants
Follow-Up
(Years) †
No. of
Deaths
Exposure Exposure
Assessment
Comparison of
Meat Intake
Effect Size
(95% CI) §
Adjustment
Zhong, 2019, 53.729,682198875Red meatFFQ2 vs. 0 servings/weekHR 1.03 (1.01–1.05)1,2,3,4,5,6,7,8,9,10,11,
US Processed 2 vs. 0 servings/weekHR 1.03 (1.02–1.05)12,13,14,15,16,17,18
Piet A, 2019, 55–69M 58,279105797Red meatFFQ140.4 vs. 41.3 g/dayHR 1.02 (0.86–1.2)1,2,4,5,6,9,11,14,19,20,
The Netherlands W 62,573 3026Processed 30.8 vs. 0 g/dayHR 1.21 (1.02–1.44)21,22,23,24,25,26,27
Zheng, 2019, M 30–5527,916409,073 **5593Red meatFFQ>0.5/change of <0.15 serving/dayHR 1.10 (1.04–1.17)1,3,6,8,9,21,22,23,24,28
USW 40–7553,553804,685 **8426Processed >0.5/change of <0.15 serving/dayHR 1.13 (1.04–1.23)29,30,31,32,33,34,35,36
Alshahrani,>2572,14911.87961Red meatFFQ41.7 vs. 4 g/dayHR 1.17 (1.05–1.32)1,2,3,4,5,6,9,18,21,22,
2019, US Processed 9.4 vs. 0.7 g/dayHR 1.16 (1.04–1.29)24,32,33,34,35,36,37,38
and Canada Combined 42.8 vs. 1.4 g/dayHR 1.25 (1.12–1.40)39,40,41,42,43,44,45,4647,48
Mejborn, 2020,15–759848NR640Red meat7-day pre-coded >97 vs. <41 g/dayHR 0.86 (0.67–1.12)2,3,4,5,6,8,9,24
Denmark Processedfood diary>58 vs. <19 g/dayHR 1.02 (0.82–1.26)
Argyridou, 2019, UK40–69419,075715,058CombinedFFQ7.0 vs. 1.5 servings/weekHR 1.252 (1.172–1.338)1,2,3,4,6,8,9,11,14,24, 47,48,49,50,51,52
Dominguez, >4518,5409.5255Red meat136-item >7 vs. <3 servings/weekHR 1.86 (1.19–2.93)2,4,5,6,9,24,25,53,56,
2017, ProcessedFFQ>7 vs. <3 servings/weekHR 1.57 (0.76–3.24)74,82,83,84
Spain Combined >7 vs. <3 servings/weekHR 1.31 (0.75–2.30)
Etemadi, 50–71M 316,50515.684,848Red meat124-item 50.3 vs. 6.9 g/1000 kcalHR 1.20 (1.17–1.22)1,2,3,4,5,6,8,9,11,14,24,
2017, US W 220,464 43,676ProcessedFFQ17.2 vs. 2.3 g/1000 kcalHR 1.15 (1.13–1.17)29,30,37,54,55,56,57,58
Sheehy, 38W 56,314225054Red meatFFQ1.0 vs. 0.01 serving/dayHR 1.47 (1.33–1.62)4,5,6,8,21,24,28,30,60,
2020, US Processed 1.2 vs. 0.01 serving/dayHR 1.40 (1.28–1.55)61,62
Saito, 45–74M 40,072146266Red meatFFQ92.9 vs. 14.3 g/dHR 1.13 (1.02–1.26)1,5,6,9,11,14,15,16,18,
2020, Japan Processed 8.4 vs. 1.3 g/dHR 0.98 (0.91–1.07)21,22,24,47,63,64,65
W 47,435 3620Red meat 90.3 vs. 13.6 g/dHR 1.08 (0.95–1.24)
Processed 11.7 vs. 2.1 g/dHR 1.05 (0.95–1.17)
Rohrmann, 35–69448,56812.726,344Red meatFFQ160+ vs. 10–19.9 g/dHR 1.10 (0.98–1.24)1,2,4,5,6,7,8,9,24,31,59
2013, Europe Processed 160+ vs. 10–19.9 g/dHR 1.43 (1.24–1.64)
Sinha, 50–71500,00010M 47,976Red meat124-item 68.1 vs. 9.3 g/1000 kcalHR 1.31 (1.27–1.35)4,6,8,9,11,14,19,24,26
2009, US ProcessedFFQ19.4 vs. 5.1 g/1000 kcalHR 1.16 (1.12–1.19)30,37,66
W 23,276Red meat 65.9 vs. 9.1 g/1000 kcalHR 1.36 (1.30–1.43)
Processed 16.0 vs. 3.8 g/1000 kcalHR 1.25 (1.20–1.31)
Pan, NAM 37,69822M 8926Red meatFFQ2.36 vs. 0.22 servings/dayHR 1.29 (1.20–1.38)1,3,5,6,8,9,11,14,21,22,
2012, US Processed 2.36 vs. 0.22 servings/dayHR 1.27 (1.19–1.36)24,28,29,30,34,35,36,43
Combined 2.36 vs. 0.22 servings/dayHR 1.37 (1.27–1.47)
W 83,64428W 15,000Red meat 3.1 vs. 0.53 servings/dayHR 1.19 (1.13–1.25)
Processed 3.1 vs. 0.53 servings/dayHR 1.20 (1.14–1.27)
Combined 3.1 vs. 0.53 servings/dayHR 1.24 (1.17–1.30)
Takata, 40–74M 61,483334,281 **2733Red meatFFQ114.9 vs. 20.0 g/dayHR 1.18 (1.02–1.35)1,4,5,6,7,8,9,11,14,47,
2013, China W 74,941803,265 **4210Red meat 94.8 vs. 15.0 g/dayHR 0.92 (0.82–1.03)48,59,67,68,69
Bellavia, 2016,45–83M 40,0891610,423Red meatFFQ140 vs. 31 g/dayHR 1.21 (1.13–1.29)2,4,5,7,8,9,22,24,47
Sweden W 34,556 7486
Kappeler, 2013,
US
>1817,61122M 1908Red meat
Processed
FFQ45+ vs. 0–6 times/week
45+ vs. 0–6 times/week
HR 1.24 (0.76–2.02)
HR 1.06 (0.75–1.50)
1,2,3,6,8,9,11,14,21,22,24,26,29,32,35,36,37,61
W 1775Red meat 45+ vs. 0–6 times/weekHR 1.49 (0.76–2.94)73,74
Processed 45+ vs. 0–6 times/weekHR 1.16 (0.86–1.55)
Lee, 2013, 17–92M 112,3106.6–15.523,515Red meatFFQQ4/Q1HR 0.93 (0.84–1.02)1,4,5,6,9,11,14,24,76
Asian W 184,411 16,699Red meat Q4/Q1HR 0.93 (0.86–1.00)
Whiteman, 35–6410,5229514Red meatFFQ4–7 vs. <1 day week-1HR 0.71 (0.55–0.92)1,2,6
1999, UK Processed 4–7 vs. <1 day week-1HR 1.05 (0.62–1.76)
Farvid, 2016, Iran51.642,403113291Red meat 0.43 vs. 0.02 serving/dayHR 1.04 (0.93–1.17)1,2,3,4,5,6,8,9,24,30,37,51,70,76
Iqbal, 2021, 35–70134,2979.57789Red meatFFQ≥250/<50 g/weekHR 0.93 (0.85, 1.02)1,2,4,5,6,8,11,12,14,
21 countries Processed ≥250/<50 g/weekHR 1.51 (1.08, 2.10)41,22,78,79,80
Sun, 2021, 50–79102,52118.125,976Red meatFFQ3.2/0.3 oz equivalent/dHR 1.05 (0.99–1.10)1,3,4,5,6,8,9,11,14,17
US Processed 1.0/0.01 oz equivalent/dHR 1.06 (1.01–1.10)22,41,43,67,71,74,81
Combined 3.9/0.4 oz equivalent/dHR 1.10 (1.05–1.15)
FFQ = food frequency questionnaire; HR = hazard ratio; M = men CI = confidence interval; NR = not reported; W = women. * Presented as mean or range. ** Person-years. † Number of years that individuals were followed up in the prospective cohort studies. § These effect sizes are for comparison of the highest and the lowest categories. Adjustments: age (1), sex (2), race/ethnicity (3), educational level (4), total energy (5), smoking status (6), smoking pack-years (7), physical activity (8), alcohol intake (9), hormone therapy (10), fruits (11), legumes (12), potatoes (13), vegetables (14), low-fat dairy products (15), high-fat dairy products (16), sugar-sweetened beverages (17), eggs (18), number of cigarettes smoked per day (19), years of smoking (20), history of physician-diagnosed hypertension (21), history of physician-diagnosed diabetes (22), body height (23), BMI (24), non-occupational physical activity (25), use of nutritional supplements (26), in women postmenopausal HRT (27), family history of myocardial infarction (28), family history of diabetes (29), family history of cancer (30), weight (31), aspirin use (32), multivitamin use (33), menopausal status (34), postmenopausal hormone therapy use for women (35), physician-diagnosed hypercholesterolemia (36), marital status (37), exercise (38), sleep (39), the use of statin (40), the use of blood pressure medications (41), cruciferous vegetables (42), whole grain (43), nuts (44), seeds (45), total dairy (46),fish (47), unprocessed poultry (48), Townsend score (49), employment (50), number of medications (51), salt added to food (52), time TV viewing (53), quintiles of a composite deprivation index (54), perceived health at baseline (55), history of heart disease (56), history of stroke (57), usual activity throughout the day (58), total meat intake (59), geographic region (60), neighborhood SES (socioeconomic status) (61), Alternative Healthy Eating Index without red meat (62), quartile of metabolic equivalent task-hours/d (63), sodium (64), total fat (65), time since quitting for former smokers (66), income (67), occupation (68), comorbidity index (69), systolic blood pressure (70), proteinuria (71), overall health (72), use of ibuprofen (73), family history of hypercholesterolemia (74), history of gallstones (75), residency (76), opium use (77), wealth score (78), location (79), starchy foods (80), unopposed estrogen use (81), year of entering the cohort (82), history of depression (83), following special diets at baseline (84).
Table 2. Characteristics of included studies for association between muscle-strengthening activity and all-cause mortality.
Author, Year of Publication, CountryAge *Sample sizeFollow-Up
(Years) †
No. of
Cases
ExposureExposure
Assessment
Comparison of
Meat Intake
Effect Size
(95% CI) §
Adjustment
Zhao, 2020, ≥18479,8568.7559,819MSASelf-reported<2 times/weekHR 11,2,3,4,5,6,7,8,9
US ≥2 times/weekHR 0.89 (0.85–0.94)
Stamatakis, ≥1972,4599.25763Strength-QuestionnaireNoneHR 11,2,4,6,7,8,11,12
2017, UK promoting exercise AnyHR 0.77 (0.69–0.87)
Kamada, 2017, 62.228,879123055StrengthQuestionnaire0RR 12,3,4,6,7,8,13,14,15,16,
US(Mean) training ≥150 min/weekRR 1.10 (0.77–1.56)17,18,19,20,21,22,23,24,25,26,27,28
LIU, 2018, US18–8912,59110276Resistance Questionnaire0HR 11,2,6,7,8,24,27,29,30
exercise ≥120 min/weekHR 1.03 (0.59–1.80)
Patel, 70.272,4621317,750MSAQuestionnaire0HR 11,2,4,5,6,7,8,31,32,33,
2020, US ≥2 h/weekHR 1.01 (0.93–1.09)34,35,36,37
Porter, 2020, 46.317,93811.93799WeightliftingQuestionnaireNoHR 11,2,3,4,6,7,8,38
US(Mean) YesHR 0.89 (0.67–1.17)
Hsu, 2017, ≥7017057519Muscle-QuestionnaireNoHR 12,3,4,6,7,8,26,27,36,50,
Australia strengthening exercise YesHR 0.72 (0.49–1.06)51,52,53
Sheehan, 18–8426,727174955WeightliftingQuestionnaireNoHR 11,2,3,4,5,6,7,8,50,51,54,
2020, US YesHR 0.95 (0.85–1.07)55,56,57
MSA = muscle-strengthening activity; HR = hazard ratio; RR = risk ratio; CI = confidence interval; CVD = cardiovascular disease; NR = not reported; * Presented as mean or range. † The number of years that individuals were followed up in the prospective cohort studies. § These effect sizes are for comparison of the highest and the lowest categories. Adjustments: sex (1), age (2), race/ethnicity (3), education (4), marital status (5), body mass index (6), smoking status (7), alcohol intake (8), chronic conditions (9), long-standing illness (10), psychological distress (11), weekly physical activity volume excluding the volume of strength-promoting activity (12), trial randomization (13), postmenopausal status (14), hormone use (15), parental history of myocardial infarction or cancer (16), energy intake (17), saturated fat intake (18), fiber intake (19), fruit and vegetable intake (20), physical examination for screening (21), time per week spent in aerobic activity (22), MVPA (for strength training and vice versa) (23), incidence of hypertension (24), high cholesterol (25), cardiovascular diseases (26), diabetes mellitus (27), cancer before and during follow-up (28), parental history of CVD (29), hypercholesterolemia (30), survey type (31), self-reported overall health (32), work status (33), TV sitting time (34), aspirin use (35), comorbidity score (36), aerobic moderate-to-vigorous physical activity (37), household (38), use of an ambulatory device (39), total cholesterol level (40), statin medication use (41), measured mean arterial blood pressure (42), following physician-diagnosed conditions (43), arthritis (44), stroke (45), serum C-reactive protein (46), congestive heart failure (47), coronary artery disease (48), emphysema (49), self-rated health (50), ADL disability (51), depression (52), PASE score (53), income (54), nativity status (55), census region of residence (56), home ownership (57), eGFR (58), need special equipment to walk (59).
Table 3. Characteristics of included studies for association between daily steps and all-cause mortality in adults aged 45 or older.
Author, CountryAge *Sample SizeFollow-Up
(Years) †
No. of
Cases
ExposureExposure
Assessment
Number of
Steps per Day
Effect Size
(95% CI) §
Adjustment
Lee, 2019, US≥4516,7414.3504StepsActiGraph 2718HR 11,2,3,4,5,6,7,8,9,10,11,12,
GT3X+ accelerometers4363HR 0.59 (0.47–0.75)13,14
5905HR 0.54 (0.41–0.72)
8442HR 0.42 (0.3–0.6)
Hansen, 2020, 5721839.1119StepsActiGraph, LLC, 4651HR 12,3,4,15,16,21,22,23
Norway Pensacola, FL6862HR 0.52 (0.29–0.93)
8670HR 0.5 (0.27–0.94)
11,467HR 0.43 (0.21–0.88)
Maurice, 2020, 56.8484010.11165StepsActiGraph 7164 4000HR 11,3,4,12.15.16.22,24,26,27,
US 8000HR 0.49 (0.44–0.55)28,29,30
12,000HR 0.35 (0.28–0.45)
Jefferis, 2017, UK78.411815194StepsActiGraph GT3x1895HR 11,2,3,4,22,25,33,34,35,
3646HR 0.63 (0.43–1.54)36,37
5302HR 0.59 (0.39–0.9)
8401HR 0.31 (0.17–0.57)
Yamamoto, 2018, 714199.876Stepsspring-levered 3394HR 13,4,15,22,23
Japan pedometer (EC-100S, 5310HR 0.81 (0.43–1.54)
YAMASA, Tokyo, 6924HR 1.26 (0.7–2.26)
Japan)10,241HR 0.46 (0.22–0.96)
Oftedal, 2019,
Australia
65.416979.6NRStepsDigiwalkerSW-200 pedometer Per 1000 steps per dayHR 0.93 (0.88–0.98)1,3,15,38
Dwyer, 2015, 58.8257610219StepsOmron HJ-0030–5550HR 11,3,4,15,22,39
Australia Omron HJ-1025551–8000HR 0.43 (0.30–0.62)
8001–10,000HR 0.25 (0.16–0.38)
10,001–13,500HR 0.24 (0.15–0.37)
13,501–39,164HR 0.10 (0.05–0.18)
Manas, 2021, Spain78.87685.789StepsActiTrainer
ActiGraphwGT3X-BT;
ActiGraph, Pensacola,
per additional 1000 stepsHR 0.87 (0.81–0.95)1,2,15,16,22,38,40,41
Paluch, 2021, US45.2211010.872StepsActiGraph 71645837HR 11,2,3,4,12,13,15,16,22,23,
8502HR 0.28 (0.15–0.54)25,26,42,43,44
11,815HR 0.45 (0.25–0.81)
Klenk, 2016, US75.612714100Walking durationactivPAL, PAL Technologies Ltd., Glasgow, UK128.4–290.5 vs. 3.7–76.1 min/dayHR 0.39 (0.19–0.78)1,3,4,13,14,15,16,22,26,31,44
Pate, 2017, US69.8139,2551343,621Walking durationassessed by asking>6 h/week vs. <2 h/weekHR 0.78 (0.75–0.81)4,7,8,25,26,39,40,45,46,47
* Presented as mean or range. † The number of years that individuals were followed up in the prospective cohort studies. § These effect sizes are for comparison of the highest and the lowest categories. Age (1), wear time (2), smoking status (3), alcohol use (4), intake of saturated fat (5), intake of saturated fiber (6), intake of saturated fruits (7), intake of saturated vegetables (8), hormone therapy (9), parental history of myocardial infarction (10), family history of cancer (11), general health (12), history of cardiovascular disease (13), history of cancer and cancer screening (14), gender (15), educational attainment (16), IMD (17), weight status (18), GP Management System (19), number of self-reported chronic illnesses at baseline (20),VPA (21), body mass index (22), number of medical conditions (23), diet quality (24), race/ethnicity (25), diabetes (26), stroke (27), coronary heart disease (28), heart failure (29), cancer (30), chronic bronchitis (31), emphysema (32), mobility limitation (33), season of wear (34), social class (35), sleep time (36), living alone (37), household income (38), total energy intake from all sources (kJ) (39), marital status (40), comorbidities (41), study center (42), systolic blood pressure (43), hyperlipidemia (44), red/processed meat intake (45), occupational status (46), leisure-time sitting (47).
Disclaimer/Publisher’s Note: The statements, opinions and data contained in all publications are solely those of the individual author(s) and contributor(s) and not of MDPI and/or the editor(s). MDPI and/or the editor(s) disclaim responsibility for any injury to people or property resulting from any ideas, methods, instructions or products referred to in the content.

