
A Fatty Diet Induces a Jejunal Ketogenesis Which Inhibits Local SGLT1-Based Glucose Transport via an Acetylation Mechanism—Results from a Randomized Cross-Over Study between Iso-Caloric High-Fat versus High-Carbohydrate Diets in Healthy Volunteers

 , ,
, , 
 , and
, and 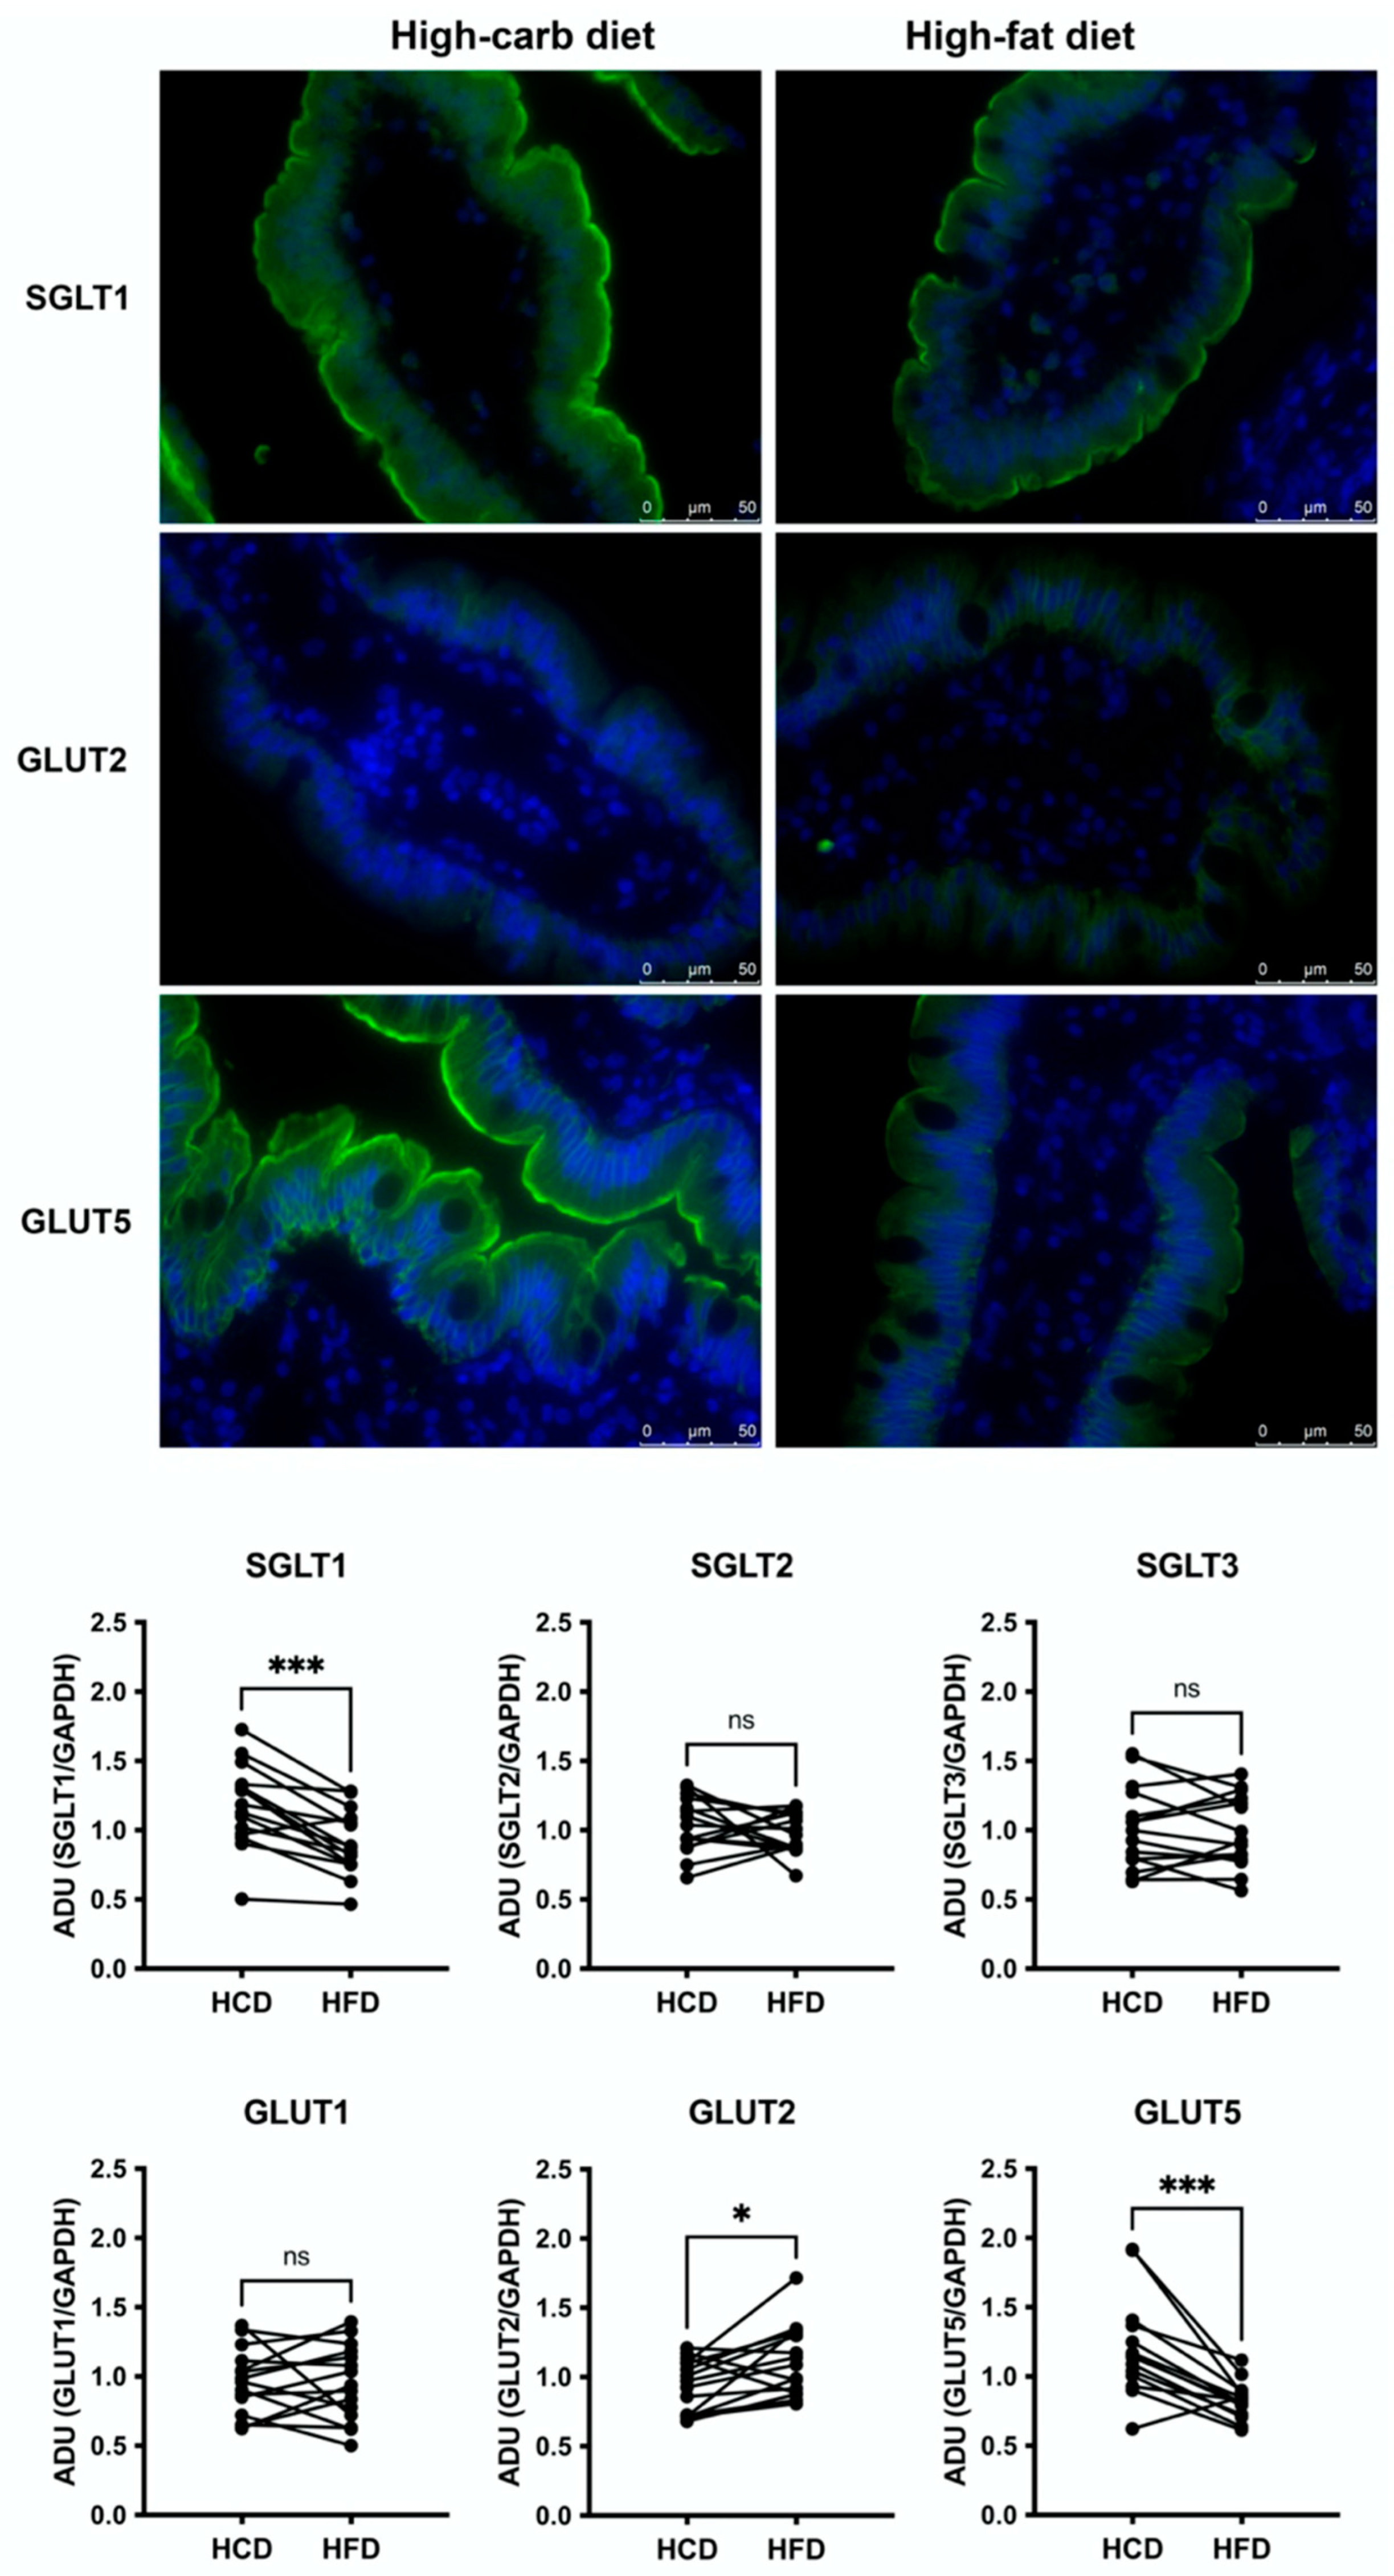
Abstract
:1. Introduction
2. Methods
2.1. The Clinical Study
2.2. Enteroscopy
2.3. Immunofluorescence and Western Blotting
2.4. Ussing Chamber Experiments
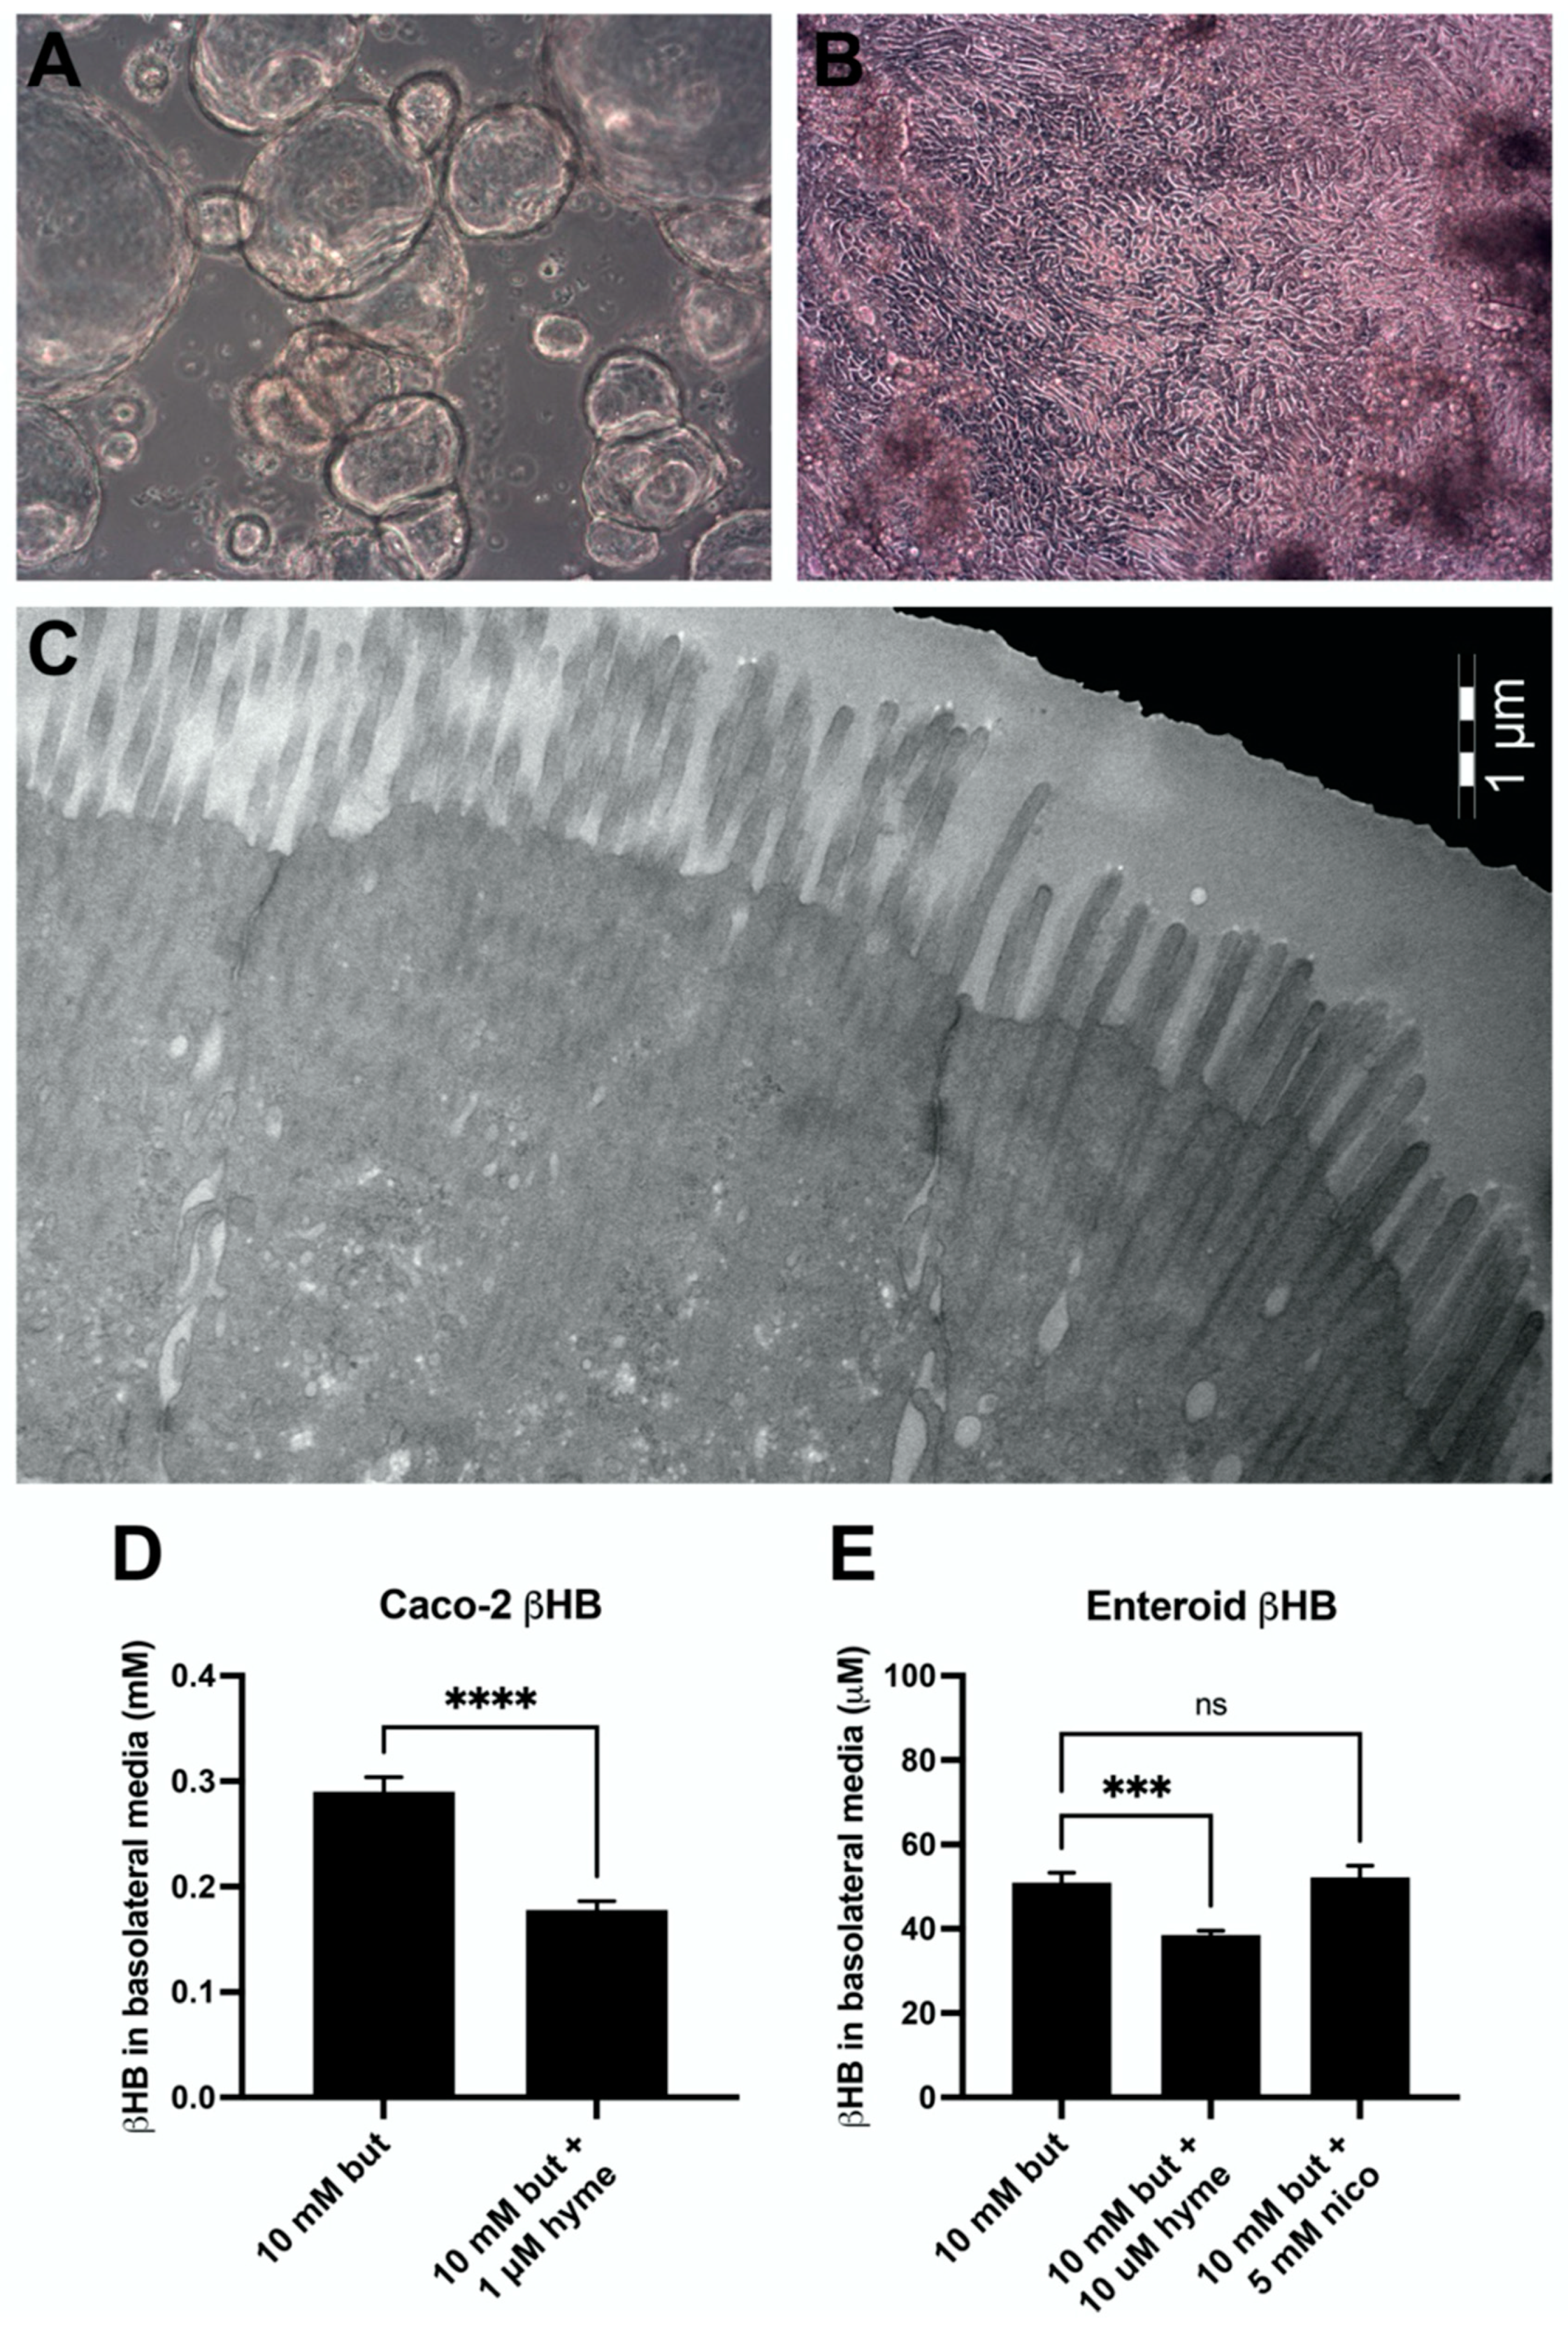
2.5. Caco-2 and Human Jejunal Enteroid Monolayer Cell Cultures
2.6. Statistics
3. Results
3.1. Jejunal Epithelial Monosaccharide Transporters
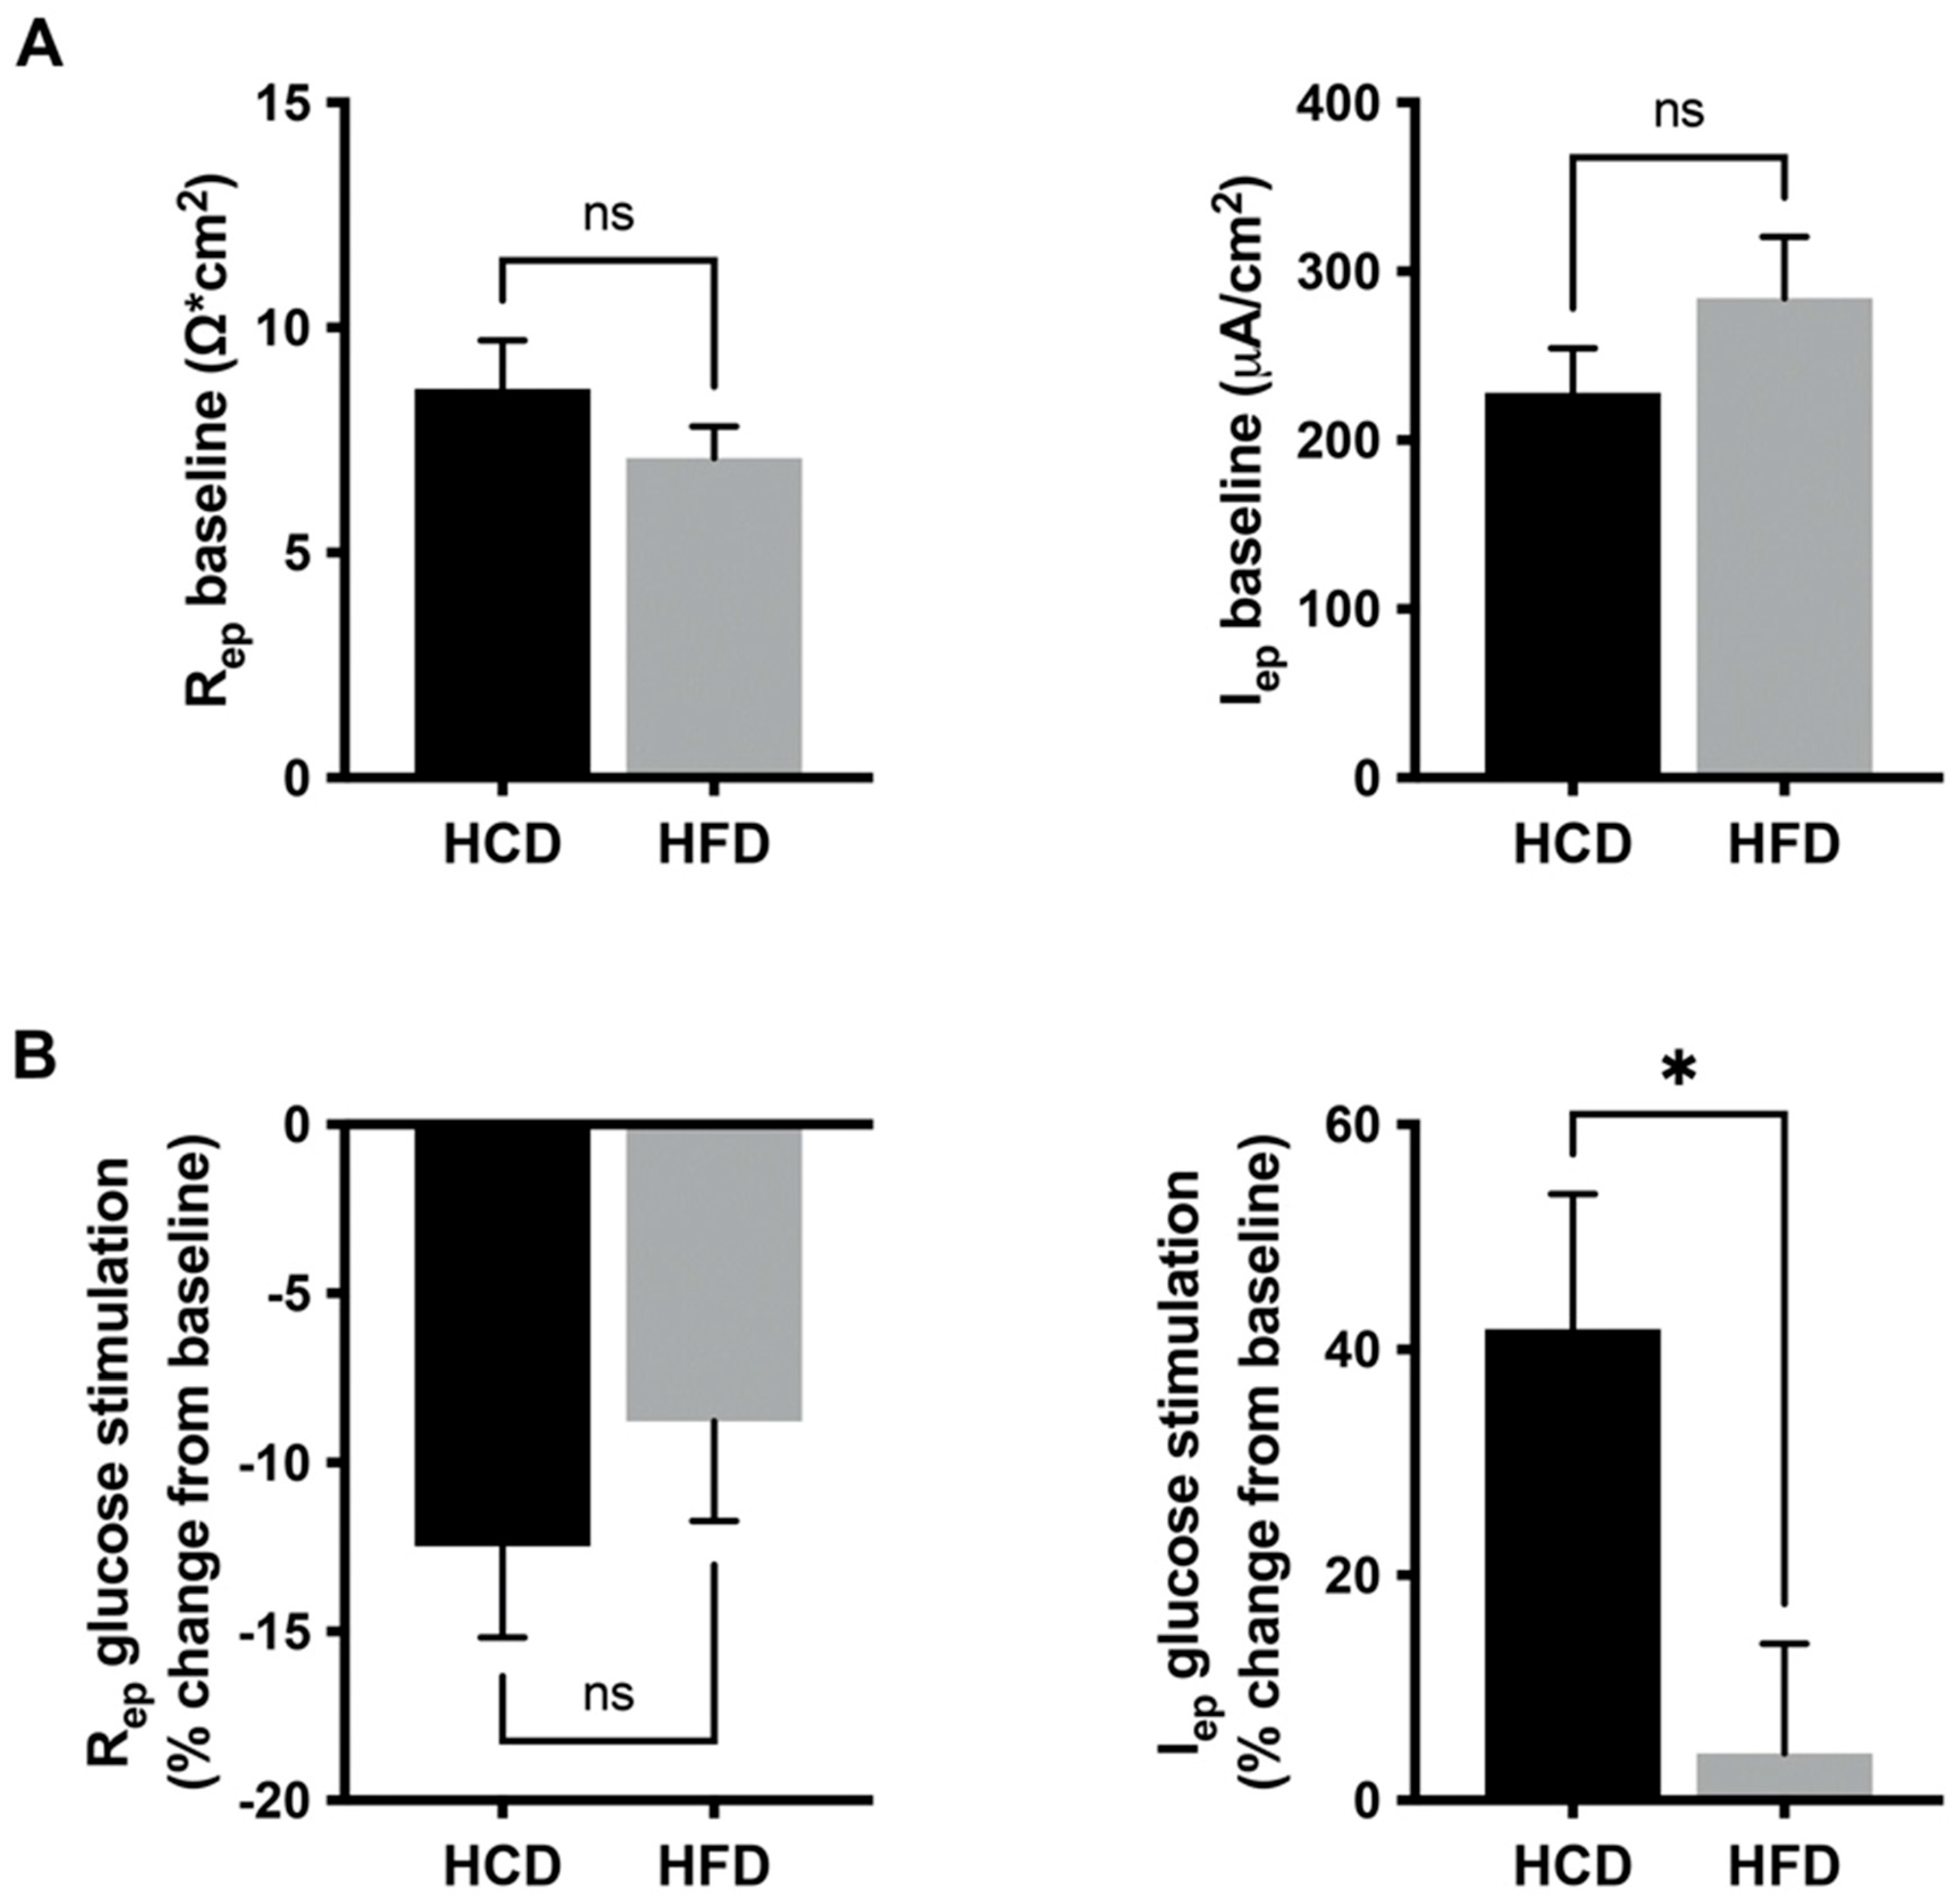
3.2. Glucose Induced a Mucosal Electrogenic Response after High-Carbohydrate Diet
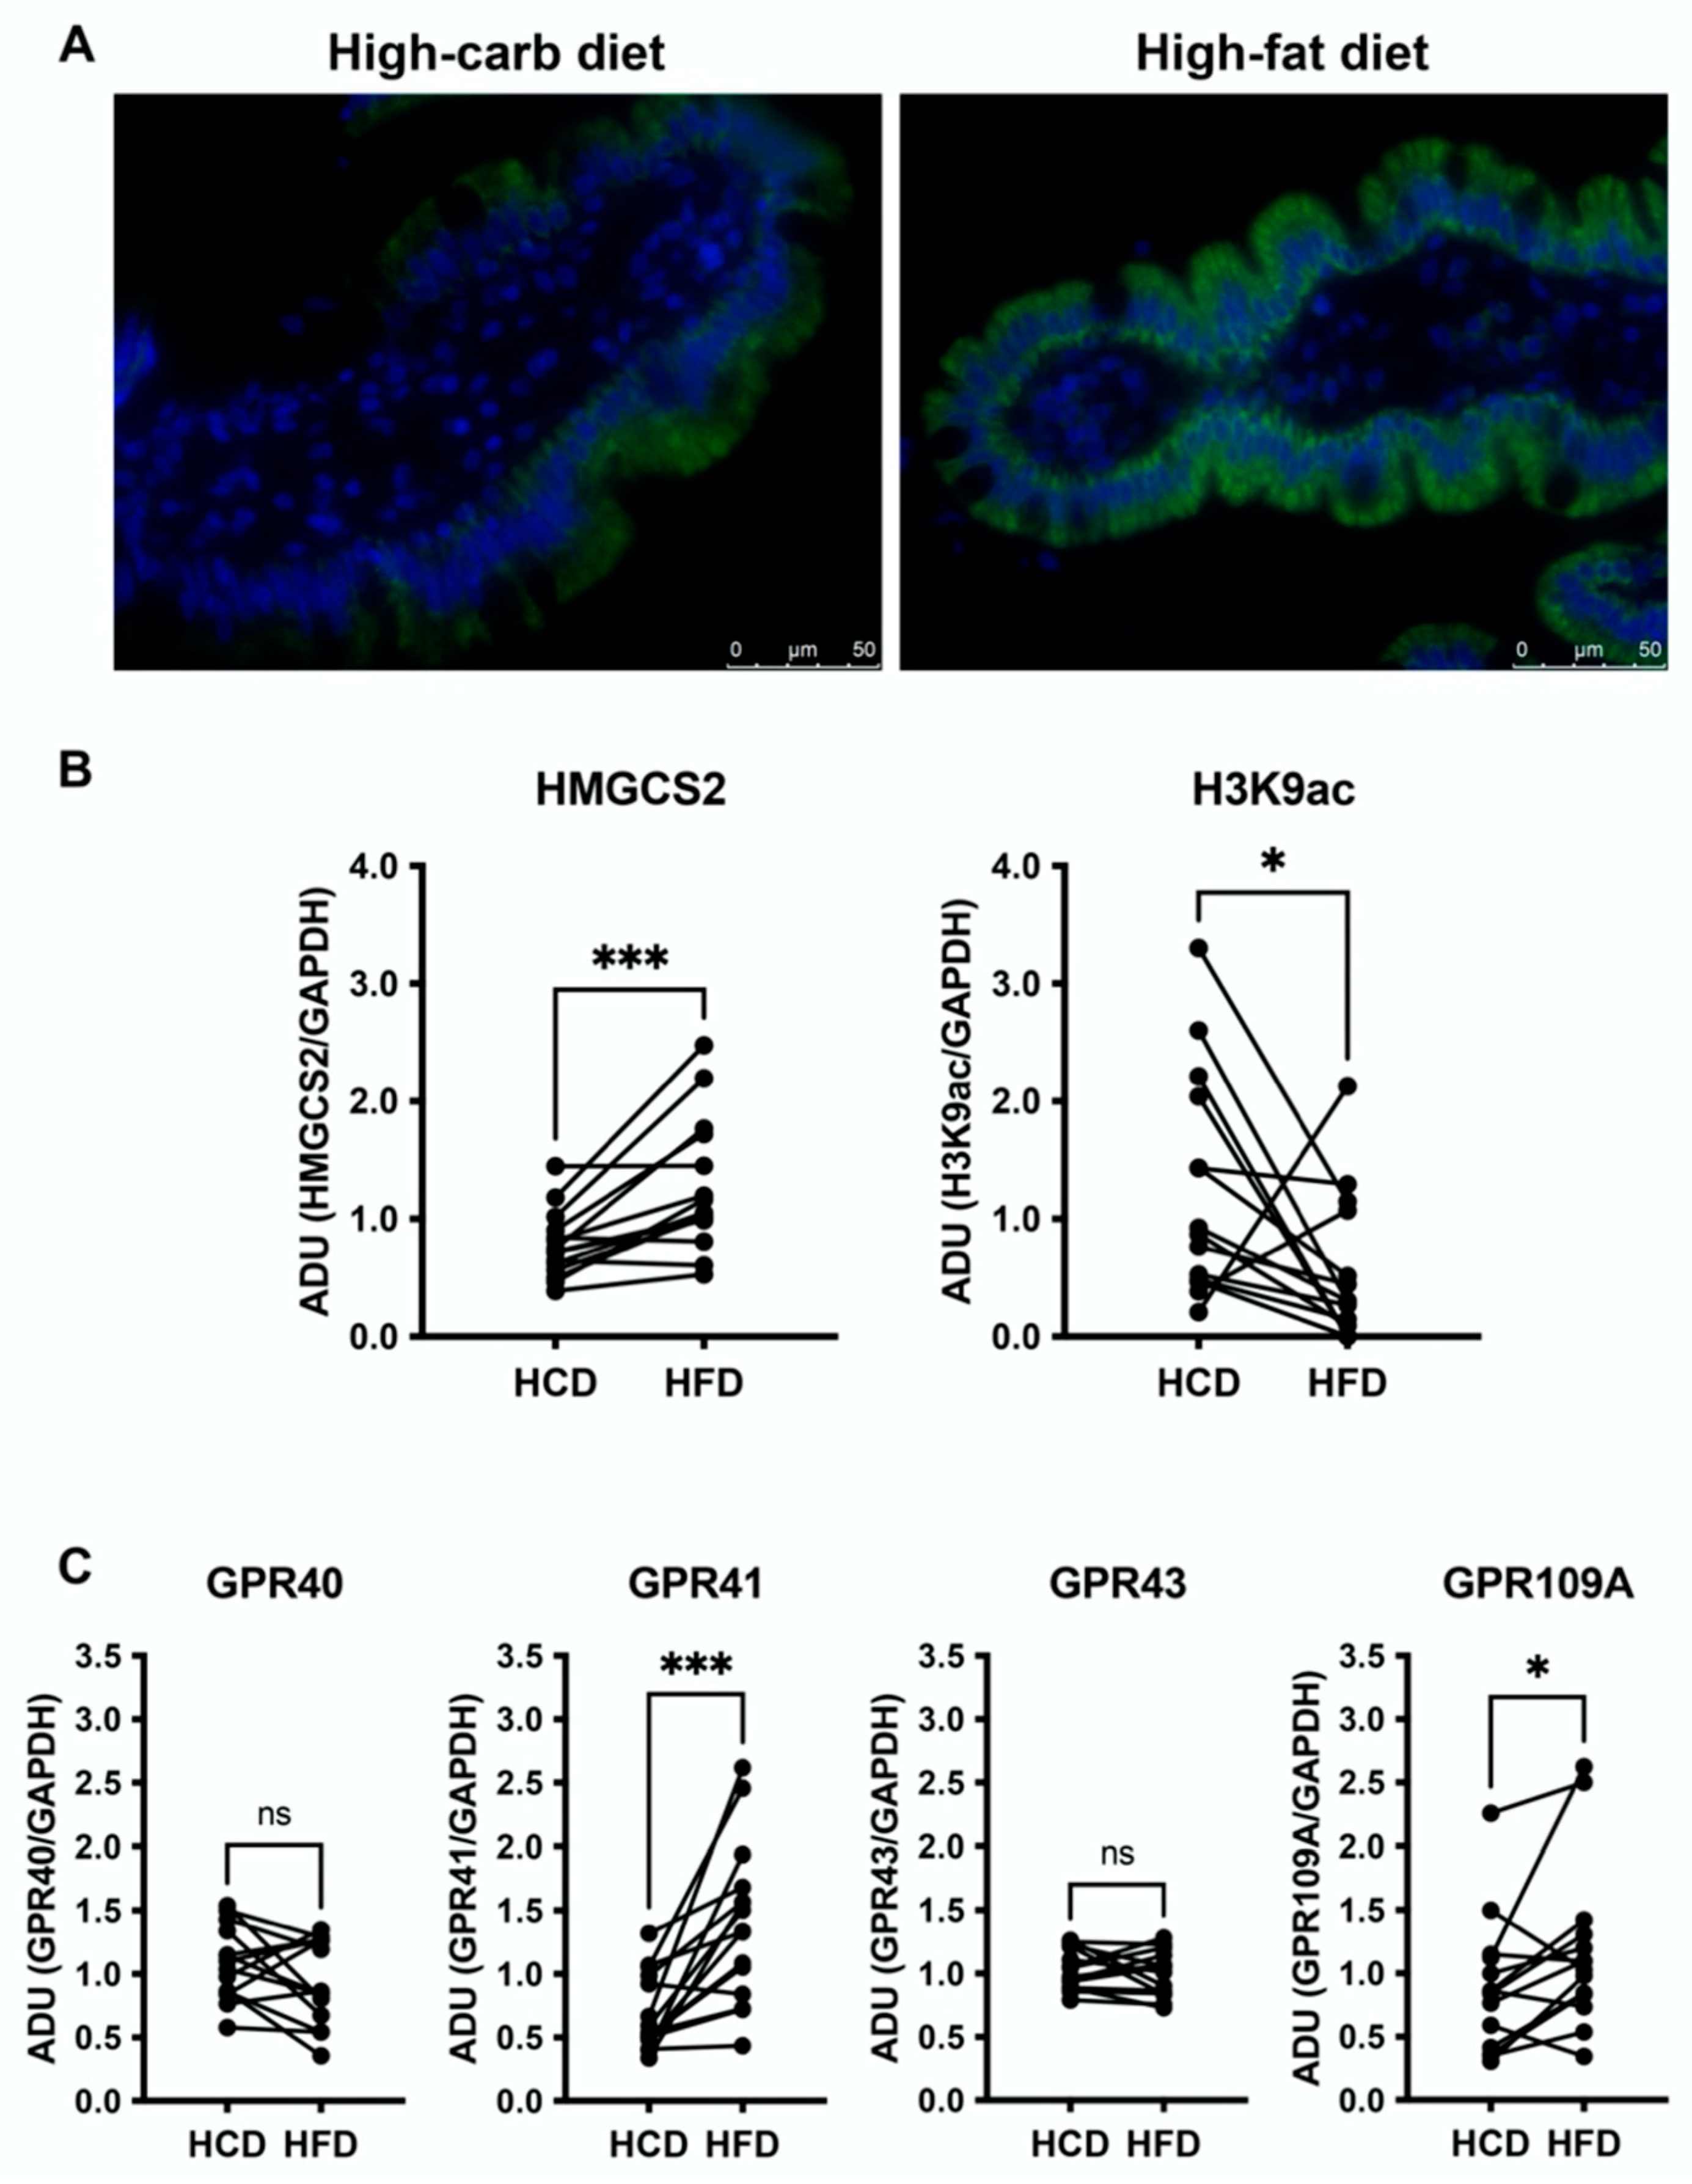
3.3. High-Fat Diet Increases HMGCS2 in the Jejunal Mucosa and Downregulates H3K9ac
3.4. Jejunal GPR41 and GPR109A Are Upregulated following the High-Fat Diet
3.5. Ketogenesis in Caco-2 and Human Jejunal Enteroid Cells
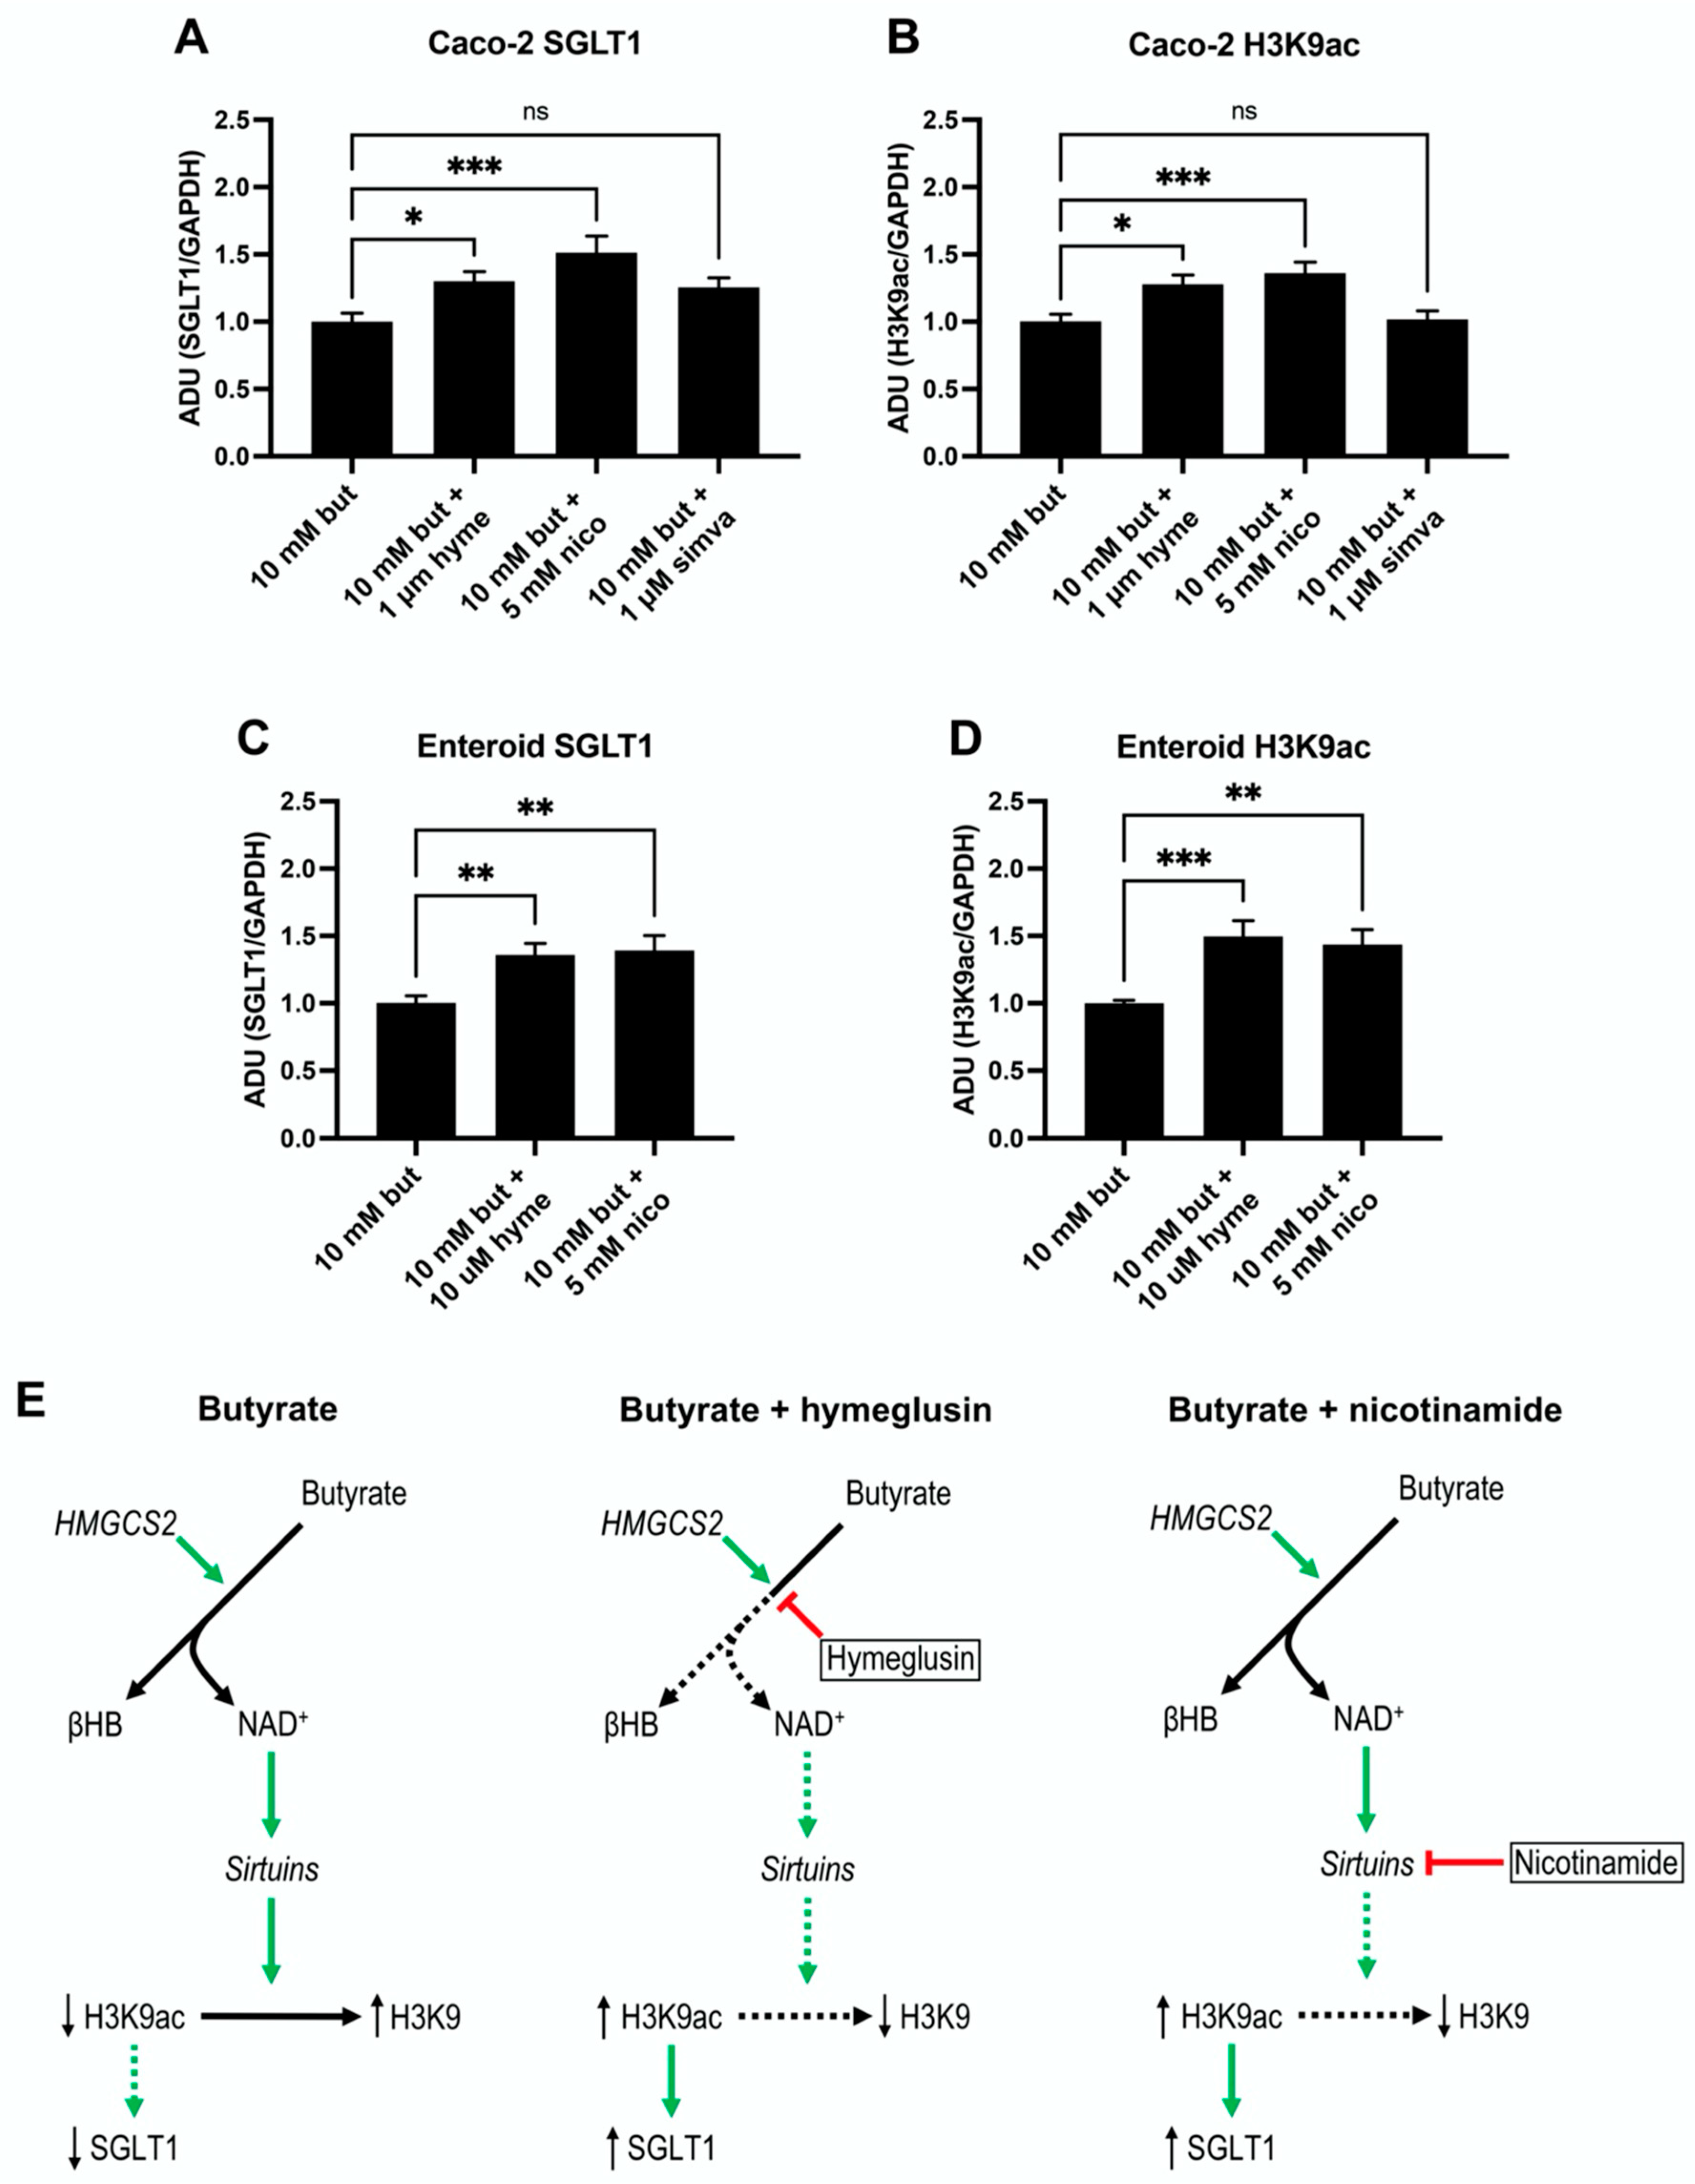
3.6. SGLT1 Expression and Acetylation of H3K9 Increase by Sirtuins Activation
4. Discussion
5. Conclusions
Supplementary Materials
Author Contributions
Funding
Institutional Review Board Statement
Informed Consent Statement
Data Availability Statement
Acknowledgments
Conflicts of Interest
References
- Wright, E.M.; Loo, D.D.; Hirayama, B.A. Biology of human sodium glucose transporters. Physiol. Rev. 2011, 91, 733–794. [Google Scholar] [CrossRef] [PubMed]
- Koepsell, H. Glucose transporters in the small intestine in health and disease. Pflug. Arch. 2020, 472, 1207–1248. [Google Scholar] [CrossRef] [PubMed]
- Lehmann, A.; Hornby, P.J. Intestinal SGLT1 in metabolic health and disease. Am. J. Physiol. Gastrointest. Liver Physiol. 2016, 310, G887–G898. [Google Scholar] [CrossRef] [PubMed]
- Helander, H.F.; Fandriks, L. Surface area of the digestive tract—revisited. Scand. J. Gastroenterol. 2014, 49, 681–689. [Google Scholar] [CrossRef]
- Wallenius, V.; Elebring, E.; Casselbrant, A.; Laurenius, A.; le Roux, C.W.; Docherty, N.G.; Biorserud, C.; Bjornfot, N.; Engstrom, M.; Marschall, H.U.; et al. Glycemic Control and Metabolic Adaptation in Response to High-Fat versus High-Carbohydrate Diets-Data from a Randomized Cross-Over Study in Healthy Subjects. Nutrients 2021, 13, 3322. [Google Scholar] [CrossRef] [PubMed]
- Wallenius, V.; Elias, E.; Elebring, E.; Haisma, B.; Casselbrant, A.; Larraufie, P.; Spak, E.; Reimann, F.; le Roux, C.W.; Docherty, N.G.; et al. Suppression of enteroendocrine cell glucagon-like peptide (GLP)-1 release by fat-induced small intestinal ketogenesis: A mechanism targeted by Roux-en-Y gastric bypass surgery but not by preoperative very-low-calorie diet. Gut 2020, 69, 1423–1431. [Google Scholar] [CrossRef]
- Shimazu, T.; Hirschey, M.D.; Newman, J.; He, W.; Shirakawa, K.; Le Moan, N.; Grueter, C.A.; Lim, H.; Saunders, L.R.; Stevens, R.D.; et al. Suppression of oxidative stress by beta-hydroxybutyrate, an endogenous histone deacetylase inhibitor. Science 2013, 339, 211–214. [Google Scholar] [CrossRef]
- Anderson, K.A.; Madsen, A.S.; Olsen, C.A.; Hirschey, M.D. Metabolic control by sirtuins and other enzymes that sense NAD(+), NADH, or their ratio. Biochim. Biophys. Acta Bioenerg. 2017, 1858, 991–998. [Google Scholar] [CrossRef]
- Adamkova, K.; Yi, Y.J.; Petr, J.; Zalmanova, T.; Hoskova, K.; Jelinkova, P.; Moravec, J.; Kralickova, M.; Sutovsky, M.; Sutovsky, P.; et al. SIRT1-dependent modulation of methylation and acetylation of histone H3 on lysine 9 (H3K9) in the zygotic pronuclei improves porcine embryo development. J. Anim. Sci. Biotechnol. 2017, 8, 83. [Google Scholar] [CrossRef]
- Mifflin, M.D.; St Jeor, S.T.; Hill, L.A.; Scott, B.J.; Daugherty, S.A.; Koh, Y.O. A new predictive equation for resting energy expenditure in healthy individuals. Am. J. Clin. Nutr. 1990, 51, 241–247. [Google Scholar] [CrossRef]
- Bjorkman, E.; Casselbrant, A.; Lundberg, S.; Fandriks, L. In vitro assessment of epithelial electrical resistance in human esophageal and jejunal mucosae and in Caco-2 cell layers. Scand. J. Gastroenterol. 2012, 47, 1321–1333. [Google Scholar] [CrossRef] [PubMed]
- Sato, T.; Stange, D.E.; Ferrante, M.; Vries, R.G.; Van Es, J.H.; Van den Brink, S.; Van Houdt, W.J.; Pronk, A.; Van Gorp, J.; Siersema, P.D.; et al. Long-term expansion of epithelial organoids from human colon, adenoma, adenocarcinoma, and Barrett’s epithelium. Gastroenterology 2011, 141, 1762–1772. [Google Scholar] [CrossRef] [PubMed]
- Casselbrant, A.; Malinauskas, M.; Marschall, H.U.; Wallenius, V.; Fandriks, L. Angiotensin II exerts dual actions on sodium-glucose transporter 1-mediated transport in the human jejunal mucosa. Scand. J. Gastroenterol. 2015, 50, 1068–1075. [Google Scholar] [CrossRef] [PubMed]
- Ehrenkranz, J.R.; Lewis, N.G.; Kahn, C.R.; Roth, J. Phlorizin: A review. Diabetes Metab. Res. Rev. 2005, 21, 31–38. [Google Scholar] [CrossRef] [PubMed]
- Douard, V.; Ferraris, R.P. The role of fructose transporters in diseases linked to excessive fructose intake. J. Physiol. 2013, 591, 401–414. [Google Scholar] [CrossRef]
- Ait-Omar, A.; Monteiro-Sepulveda, M.; Poitou, C.; Le Gall, M.; Cotillard, A.; Gilet, J.; Garbin, K.; Houllier, A.; Chateau, D.; Lacombe, A.; et al. GLUT2 accumulation in enterocyte apical and intracellular membranes: A study in morbidly obese human subjects and ob/ob and high fat-fed mice. Diabetes 2011, 60, 2598–2607. [Google Scholar] [CrossRef]
- Kellett, G.L.; Brot-Laroche, E.; Mace, O.J.; Leturque, A. Sugar absorption in the intestine: The role of GLUT2. Annu. Rev. Nutr. 2008, 28, 35–54. [Google Scholar] [CrossRef]
- Scow, J.S.; Tavakkolizadeh, A.; Zheng, Y.; Sarr, M.G. Acute “adaptation” by the small intestinal enterocyte: A posttranscriptional mechanism involving apical translocation of nutrient transporters. Surgery 2011, 149, 601–605. [Google Scholar] [CrossRef]
- Roder, P.V.; Geillinger, K.E.; Zietek, T.S.; Thorens, B.; Koepsell, H.; Daniel, H. The role of SGLT1 and GLUT2 in intestinal glucose transport and sensing. PLoS ONE 2014, 9, e89977. [Google Scholar] [CrossRef]
- Cavin, J.B.; Couvelard, A.; Lebtahi, R.; Ducroc, R.; Arapis, K.; Voitellier, E.; Cluzeaud, F.; Gillard, L.; Hourseau, M.; Mikail, N.; et al. Differences in Alimentary Glucose Absorption and Intestinal Disposal of Blood Glucose After Roux-en-Y Gastric Bypass vs Sleeve Gastrectomy. Gastroenterology 2016, 150, 454–464.e459. [Google Scholar] [CrossRef]
- Saeidi, N.; Meoli, L.; Nestoridi, E.; Gupta, N.K.; Kvas, S.; Kucharczyk, J.; Bonab, A.A.; Fischman, A.J.; Yarmush, M.L.; Stylopoulos, N. Reprogramming of intestinal glucose metabolism and glycemic control in rats after gastric bypass. Science 2013, 341, 406–410. [Google Scholar] [CrossRef] [PubMed]
- Chan, L.K.; Leung, P.S. Multifaceted interplay among mediators and regulators of intestinal glucose absorption: Potential impacts on diabetes research and treatment. Am. J. Physiol. Endocrinol. Metab. 2015, 309, E887–E899. [Google Scholar] [CrossRef] [PubMed]
- Veyhl-Wichmann, M.; Friedrich, A.; Vernaleken, A.; Singh, S.; Kipp, H.; Gorboulev, V.; Keller, T.; Chintalapati, C.; Pipkorn, R.; Pastor-Anglada, M.; et al. Phosphorylation of RS1 (RSC1A1) Steers Inhibition of Different Exocytotic Pathways for Glucose Transporter SGLT1 and Nucleoside Transporter CNT1, and an RS1-Derived Peptide Inhibits Glucose Absorption. Mol. Pharmacol. 2016, 89, 118–132. [Google Scholar] [CrossRef] [PubMed]
- Helenius, T.O.; Misiorek, J.O.; Nystrom, J.H.; Fortelius, L.E.; Habtezion, A.; Liao, J.; Asghar, M.N.; Zhang, H.; Azhar, S.; Omary, M.B.; et al. Keratin 8 absence down-regulates colonocyte HMGCS2 and modulates colonic ketogenesis and energy metabolism. Mol. Biol. Cell. 2015, 26, 2298–2310. [Google Scholar] [CrossRef] [PubMed]
- Hegardt, F.G. Mitochondrial 3-hydroxy-3-methylglutaryl-CoA synthase: A control enzyme in ketogenesis. Biochem. J. 1999, 338 Pt 3, 569–582. [Google Scholar] [CrossRef] [PubMed]
- Clara, R.; Schumacher, M.; Ramachandran, D.; Fedele, S.; Krieger, J.P.; Langhans, W.; Mansouri, A. Metabolic Adaptation of the Small Intestine to Short- and Medium-Term High-Fat Diet Exposure. J. Cell. Physiol. 2017, 232, 167–175. [Google Scholar] [CrossRef]
- Kimura, I.; Ichimura, A.; Ohue-Kitano, R.; Igarashi, M. Free Fatty Acid Receptors in Health and Disease. Physiol. Rev. 2020, 100, 171–210. [Google Scholar] [CrossRef]
- Honma, K.; Mochizuki, K.; Goda, T. Inductions of histone H3 acetylation at lysine 9 on SGLT1 gene and its expression by feeding mice a high carbohydrate/fat ratio diet. Nutrition 2009, 25, 40–44. [Google Scholar] [CrossRef]
- Inoue, S.; Mochizuki, K.; Goda, T. Jejunal induction of SI and SGLT1 genes in rats by high-starch/low-fat diet is associated with histone acetylation and binding of GCN5 on the genes. J. Nutr. Sci. Vitaminol. 2011, 57, 162–169. [Google Scholar] [CrossRef]
- Yamauchi, H.; Honma, K.; Mochizuki, K.; Goda, T. Regulation of the circadian rhythmic expression of Sglt1 in the mouse small intestine through histone acetylation and the mRNA elongation factor, BRD4-P-TEFb. Biosci. Biotechnol. Biochem. 2018, 82, 1176–1179. [Google Scholar] [CrossRef]
- Menzies, K.J.; Zhang, H.; Katsyuba, E.; Auwerx, J. Protein acetylation in metabolism—metabolites and cofactors. Nat. Rev. Endocrinol. 2016, 12, 43–60. [Google Scholar] [CrossRef] [PubMed]
- Liu, H.; Wang, J.; He, T.; Becker, S.; Zhang, G.; Li, D.; Ma, X. Butyrate: A Double-Edged Sword for Health? Adv. Nutr. 2018, 9, 21–29. [Google Scholar] [CrossRef] [PubMed]
- Tomoda, H.; Ohbayashi, N.; Morikawa, Y.; Kumagai, H.; Omura, S. Binding site for fungal beta-lactone hymeglusin on cytosolic 3-hydroxy-3-methylglutaryl coenzyme A synthase. Biochim. Biophys. Acta. 2004, 1636, 22–28. [Google Scholar] [CrossRef] [PubMed]
- García-Aguilar, A.; Guillén, C.; Nellist, M.; Bartolomé, A.; Benito, M. TSC2 N-terminal lysine acetylation status affects to its stability modulating mTORC1 signaling and autophagy. Biochim. Biophys. Acta. 2016, 1863, 2658–2667. [Google Scholar] [CrossRef]
- Villmones, H.C.; Svanevik, M.; Ulvestad, E.; Stenstad, T.; Anthonisen, I.L.; Nygaard, R.M.; Dyrhovden, R.; Kommedal, O. Investigating the human jejunal microbiota. Sci. Rep. 2022, 12, 1682. [Google Scholar] [CrossRef]
- Balaz, M.; Becker, A.S.; Balazova, L.; Straub, L.; Müller, J.; Gashi, G.; Maushart, C.I.; Sun, W.; Dong, H.; Moser, C.; et al. Inhibition of Mevalonate Pathway Prevents Adipocyte Browning in Mice and Men by Affecting Protein Prenylation. Cell Metab. 2019, 29, 901–916.e908. [Google Scholar] [CrossRef]
- Wang, Q.; Zhou, Y.; Rychahou, P.; Fan, T.W.; Lane, A.N.; Weiss, H.L.; Evers, B.M. Ketogenesis contributes to intestinal cell differentiation. Cell Death Differ. 2017, 24, 458–468. [Google Scholar] [CrossRef]
- Cheng, C.W.; Biton, M.; Haber, A.L.; Gunduz, N.; Eng, G.; Gaynor, L.T.; Tripathi, S.; Calibasi-Kocal, G.; Rickelt, S.; Butty, V.L.; et al. Ketone Body Signaling Mediates Intestinal Stem Cell Homeostasis and Adaptation to Diet. Cell 2019, 178, 1115–1131.e1115. [Google Scholar] [CrossRef]


Publisher’s Note: MDPI stays neutral with regard to jurisdictional claims in published maps and institutional affiliations. |
© 2022 by the authors. Licensee MDPI, Basel, Switzerland. This article is an open access article distributed under the terms and conditions of the Creative Commons Attribution (CC BY) license (https://creativecommons.org/licenses/by/4.0/).
Share and Cite
Elebring, E.; Wallenius, V.; Casselbrant, A.; Docherty, N.G.; le Roux, C.W.; Marschall, H.-U.; Fändriks, L. A Fatty Diet Induces a Jejunal Ketogenesis Which Inhibits Local SGLT1-Based Glucose Transport via an Acetylation Mechanism—Results from a Randomized Cross-Over Study between Iso-Caloric High-Fat versus High-Carbohydrate Diets in Healthy Volunteers. Nutrients 2022, 14, 1961. https://doi.org/10.3390/nu14091961
Elebring E, Wallenius V, Casselbrant A, Docherty NG, le Roux CW, Marschall H-U, Fändriks L. A Fatty Diet Induces a Jejunal Ketogenesis Which Inhibits Local SGLT1-Based Glucose Transport via an Acetylation Mechanism—Results from a Randomized Cross-Over Study between Iso-Caloric High-Fat versus High-Carbohydrate Diets in Healthy Volunteers. Nutrients. 2022; 14(9):1961. https://doi.org/10.3390/nu14091961
Chicago/Turabian StyleElebring, Erik, Ville Wallenius, Anna Casselbrant, Neil G. Docherty, Carel W. le Roux, Hanns-Ulrich Marschall, and Lars Fändriks. 2022. "A Fatty Diet Induces a Jejunal Ketogenesis Which Inhibits Local SGLT1-Based Glucose Transport via an Acetylation Mechanism—Results from a Randomized Cross-Over Study between Iso-Caloric High-Fat versus High-Carbohydrate Diets in Healthy Volunteers" Nutrients 14, no. 9: 1961. https://doi.org/10.3390/nu14091961
APA StyleElebring, E., Wallenius, V., Casselbrant, A., Docherty, N. G., le Roux, C. W., Marschall, H.-U., & Fändriks, L. (2022). A Fatty Diet Induces a Jejunal Ketogenesis Which Inhibits Local SGLT1-Based Glucose Transport via an Acetylation Mechanism—Results from a Randomized Cross-Over Study between Iso-Caloric High-Fat versus High-Carbohydrate Diets in Healthy Volunteers. Nutrients, 14(9), 1961. https://doi.org/10.3390/nu14091961