Article

Development of the Hedonic Overeating–Questionnaire (HEDO–Q)

1
Integrated Research and Treatment Center Adiposity Diseases, Behavioral Medicine Research Unit, Department of Psychosomatic Medicine and Psychotherapy, University of Leipzig Medical Center, 04103 Leipzig, Germany
2
Clinic for Cognitive Neurology, University of Leipzig Medical Center, 04103 Leipzig, Germany
3
Department of Neurology, Max Planck Institute for Human Cognitive and Brain Sciences, 04103 Leipzig, Germany
4
Department of Psychiatry and Psychotherapy, University Hospital, LMU Munich, 80336 Munich, Germany
5
Schoen Clinic Roseneck, 83209 Prien am Chiemsee, Germany
6
Department of Psychosomatic Medicine and Psychotherapy, University Medical Center of the Johannes Gutenberg University of Mainz, 55131 Mainz, Germany
7
Ernst-Abbe-Hochschule, University of Applied Sciences, 07745 Jena, Germany
*
Author to whom correspondence should be addressed.
These authors contributed equally to this work.
Nutrients 2022, 14(9), 1865; https://doi.org/10.3390/nu14091865
Submission received: 31 March 2022 / Revised: 25 April 2022 / Accepted: 27 April 2022 / Published: 29 April 2022
(This article belongs to the Section Nutritional Policies and Education for Health Promotion)

Abstract

:
Addictive-like eating is prevalent, but a clear conceptualization and operationalization outside of an addiction framework is lacking. By adopting a biopsychological framework of food reward, this study sought to develop and evaluate a brief self-report questionnaire for the trait assessment of hedonic overeating and dyscontrol. Items in the Hedonic Overeating–Questionnaire (HEDO–Q) were constructed following a rational approach and psychometrically evaluated in a large random sample from the German population (N = 2531). A confirmatory factor analysis supported the unidimensional nature of the six-item HEDO–Q with the three postulated components of wanting, liking, and dyscontrol. Psychometric properties were favorable with good corrected item-total correlations, acceptable item difficulty and homogeneity, and high internal consistency. Population norms were provided. The HEDO–Q revealed strict measurement invariance for sex and partial invariance for age and weight status. Discriminant validity was demonstrated in distinguishing participants with versus without eating disturbances or obesity. Associations with the established measures of eating disorder and general psychopathology supported the convergent and divergent validity of the HEDO–Q. This first evaluation indicates good psychometric properties of the HEDO–Q in the general population. Future validation work is warranted on the HEDO–Q’s stability, sensitivity to change, and predictive and construct validity.

1. Introduction

Worldwide, obesity, an excess accumulation of body fat, defined through a body mass index (BMI) ≥ 30.0 kg/m2 [1], has more than tripled over the past three decades [2]. This pandemic rise in obesity, especially in Western industrialized countries, is often attributed to excessive energy intake fostered by the obesogenic environment with ubiquitous access to highly palatable and calorific but unhealthy food [3,4]. Citing similarities in neurobiological reward processes between obesity and substance-based addictions, the food addiction (FA) hypothesis [5] postulates that specific foods, particularly those high in sugar or fat or highly or ultra-processed foods, may provoke addictive behavioral responses in vulnerable individuals, characterized by high impulsivity and reward sensitivity, by over-activating reward-related brain circuits, leading to desensitization [6]. Relatedly, the definition of FA follows the criteria for addictive disorders, including substance dependence in the Diagnostic and Statistical Manual of Mental Disorders Fourth Edition (DSM–IV) [7], or substance use disorder in the Fifth Edition (DSM–5) [8]. Notwithstanding, the validity and clinical utility of a potential clinical FA diagnosis still need to be demonstrated [9].
Since its introduction, the FA hypothesis has been energetically and controversially discussed [10,11,12,13,14]. FA has mostly been operationalized through self-report, using the empirically supported Yale Food Addiction Scale (YFAS 2.0 for the DSM–5) [15] for the trait assessment of addictive behavioral responses towards certain foods, for example, those high in sugar or fat, over the last 12 months. From the 35 items (or 13 items for the abbreviated mYFAS 2.0), a continuous symptom count is calculated by summing the 11 DSM–5 symptoms for substance use disorders [5]. FA is considered to be present if ≥2 symptoms (e.g., strong cravings, unsuccessful attempts to cut down, overeating despite negative consequences, withdrawal, tolerance) and clinically significant impairment/distress are present. The main critique of the FA hypothesis pertains to the self-report assessment when adhering to a clinical addiction framework, as well as the relevance of diagnostic criteria of substance use disorder for eating. For example, certain criteria of substance use disorder such as physical symptoms of withdrawal (e.g., trembling, restlessness, seizures) or tolerance have not been demonstrated regarding food in humans [16]. Most importantly, there is a lack of evidence that specific foods contain biochemical addictive substances [16,17]. In addition, despite similarities between obesity and substance use disorder in neurobiological reactions to food and food stimuli versus drugs, substantial differences have been documented [18], and neuroimaging studies have not equivocally supported a severe or consistent perturbance of functional responses to food stimuli in the main brain regions implicated in reward processing [16,19]. Notwithstanding, the concept of FA is widely appealing not only to researchers, but also to the lay public [20], with self-labeled “food addicts”. For example, those with FA show preferences for highly processed foods high in fat and refined carbohydrates [21], overeating behavior [22], and perceptions of symptoms of withdrawal and tolerance [23]. Implications of the FA concept for treatment, however, still remain unclear [6].
In order to circumvent the much-criticized causal assumption of addictive substances such as foods, it was proposed that eating itself could be addictive and that such an addictive-like eating (ALE) could form the clinical presentation of a behavioral addiction or “eating addiction”. In fact, among the eating disorders, the obesity-associated binge-eating disorder (BED), characterized by recurrent binge eating (i.e., consumption of unambiguously large amounts of food with the subjective feeling of losing control over eating) in the absence of regular weight-compensatory behaviors [8], was proposed to represent a behavioral eating addiction [11,24], although the DSM–5 diagnostic criteria of BED do not follow an addiction framework [8]. While trait FA and BED as a clinical eating disorder share certain behaviors (e.g., strong cravings for food, especially if high in fat or sugar), FA determined through the YFAS 2.0 was found to be present in most but not all women with BED (80%), but it was also present at very high rates in women with bulimia nervosa (approximately 95%) and even in those with anorexia nervosa (71%), particularly co-occurring with the binge-purge subtype [15]. This suggests that the FA trait is prevalent across the eating disorders, especially if binge-eating episodes are present, but that not all individuals with eating disorders or those with BED exhibit this trait. Likewise, although proposed initially for obesity, FA presents across the weight range, with individuals with obesity significantly more frequently affected (19.3%) than those with overweight (10.0%) or normal weight (12.2%) [25].
Importantly, there is still no consensus on how to conceptualize and measure ALE [6,10] if not related to FA. Referring to dual-process theories of motivation, highlighting interactions between a hedonic appetitive system and a cognitive control system, Ruddock et al. [26] developed the Addiction-like Eating Behavior Scale with two subscales: Appetitive Drive, mostly including items on overeating, and Low Dietary Control, mostly including items on dietary restraint and violations. While the initial psychometric characteristics were favorable, the scale was criticized for adhering to the substance-based framework, assessing eating problems specifically with high-fat/high-sugar, processed, or unhealthy foods and using items derived from descriptions of self-identified “food addicts” [27], while thought to address ALE in a behavioral addictions perspective without specifically defining an addictive substance [28].
A greater understanding of ALE was expected from adopting a broader biopsychological framework of food reward [14] that distinguishes two state-dependent processes: the motivational component of wanting (i.e., incentive salience), commonly defined as a food craving or a strong desire or urge for food, and the hedonic component of liking [29], defined as a qualitative-evaluative experience of pleasure [30]. Both components are based on dissociable, partly overlapping neural pathways [31,32], with wanting being a result of the activation of a large and robust brain system including mesocorticolimbic dopaminergic pathways, while liking results from smaller hedonic hotspots in the limbic system, with the involvement of opioid motivation circuits. Importantly, while both wanting and liking form normative hedonic processes of regular eating, hedonic overeating or ALE could result from an adaptation to the obesogenic food environment [12,14] in terms of an incentive sensitization, magnifying wanting and detaching it from liking [33].
Behaviorally, wanting and liking have mostly been measured as state-based through direct assessment via explicit self-report. For example, among multiple experimental paradigms used for measurement [34], the presumably most popular Leeds Food Preference Questionnaire [35], a computerized task, measures explicit wanting and explicit liking though visual analogue scales, in addition to implicit wanting operationalized through a forced choice procedure. The state measures of explicit wanting and explicit liking were—to varying degrees—associated with conceptually similar trait measures. For example, positive associations between explicit liking and trait disinhibition have been found [36,37], whereas associations of explicit wanting and explicit liking with trait measures of binge eating were heterogenous [34,38]. Given that most psychological constructs include both stable, dispositional trait components and fluctuating, situational state components [39], it is notable that food-related wanting and liking have not been operationalized as traits. A number of self-report questionnaires or subscales cover single trait aspects of wanting and liking, for example, craving (e.g., Food Cravings Questionnaires) [40,41] or reward-based eating (e.g., Power of Food Scale [42]; Reward-based Eating Drive 13 [43,44]), most of which are lengthy and do not offer a joint operationalization.
To the best of our knowledge, a self-report questionnaire for the trait assessment of explicit wanting and explicit liking is lacking. Neuroimaging research suggests that the obesogenic environment favors—in vulnerable persons—a hedonic rather than homeostatic control of food intake, which—coupled with impaired inhibitory control [45] —may increase the likelihood of hedonic overeating and weight gain [46]. Based on this research, we propose to operationalize not only trait wanting and trait liking in a new self-report questionnaire, but also dyscontrol or a breakdown of cognitive control over eating, a component of ALE derived from qualitative research [47]. In addition, dyscontrol, as assessed with cognitive inhibition tasks, was found to be associated with decreased prefrontal activation in individuals with BED, bulimia nervosa, and obesity [48]. From a neuroeconomic perspective, eating decisions, assessed using (implicit) bedding paradigms on food items according to a “willingness to pay” theory, result from integrating diverse food-related signaling, including the motivation, liking, and controlling of adverse eating-related consequences in a subjective value encoded in the orbitofrontal cortex, thereby initiating motor behaviors and eventually (non)action [49]. The predominantly prefrontal cognitive control system [50] is thought to interact with the reward system, providing top-down regulation of food-related attention, decision-making, and motivation [51], which provides further justification for joint assessment. In this context, the goal of this study was to develop and evaluate a trait self-report measure of food-related wanting, liking, and dyscontrol for the study of hedonic overeating in population-based or clinical research in a brief, economic format.

2. Materials and Methods

2.1. Participants

A random sample of the German population was drawn for a survey investigation on physical and mental well-being in May–July 2019, with assistance from a demographic research institute (USUMA, Berlin, Germany). A reference system for representative studies in Germany was used for sampling (https://www.adm-ev.de/en/services/the-adm-sampling-system accessed on 4 March 2019). Accordingly, a three-stage random sampling procedure served to determine sample point regions based on representative data; target households within regions; and target persons within households.
Pursuing this approach, 5393 noninstitutionalized civilians ≥14 years of age with sufficient German language skills were selected, of which 2542 individuals participated in the survey, corresponding to a response rate of 47.1% (households: 735 not reached, 1233 refused; target persons: 193 not reached, 29 incapacitated, 661 refused). Missing data led to the further exclusion of 11 participants (0.2%), leaving a final sample of N = 2531 individuals for this study.
The study was approved by the Ethics Committee of the University of Leipzig (No. 145/19-ek). Trained assessors visited the participants in person, informed them about the study procedures in a verbal and written format, and obtained informed consent. For minor participants, one parent was additionally required to provide informed consent. Participants were first interviewed by the assessors with a structured questionnaire on basic sociodemographic information and then were asked to complete the self-report questionnaires (cf. Section 2.2) on their own, while the assessor remained available to help if needed.
The total study sample consisted of 1350 women (53.3%) and 1181 men (46.7%) with a mean age of 48.4 years (SD = 17.9) and a mean BMI of 25.82 kg/m2 (SD = 5.02), calculated from self-reported height and weight (Table 1). Regarding weight status, 48.2% of participants were classified as normal weight or underweight, 36.5% were classified as overweight, and 14.3% were classified as obese [1].

2.2. Measures

2.2.1. Hedonic Overeating–Questionnaire

The development of the Hedonic Overeating–Questionnaire (HEDO–Q) to assess wanting (food craving; anticipatory reward component), liking (pleasure to eat; consummatory reward component), and dyscontrol (loss of control over eating) followed established recommendations for scale development [52,53]. In phase I (item development), an item pool was constructed for the assessment of the three theoretically derived domains (cf. Section 1). Sources for item construction were descriptions of hedonic overeating or ALE of patients with obesity and BED (N = 15) at the Obesity Outpatient Unit at Leipzig University Medical Center, and self-report questionnaires targeting similar content were inspected (e.g., Addiction-like Eating Behavior Scale [26], Reward-based Eating Drive 13 [54], Power of Food Scale [42,55], Yale Food Addiction Scale [56], Self-regulation of Eating Behavior Questionnaire [57,58], Eating Inventory [59,60], and Eating Disorder Examination-Questionnaire [61,62]). Note that these questionnaires served as sources of inspiration, but the HEDO–Q does not include any verbatim or adapted items from these questionnaires. The resulting item pool of 52 items was evaluated for content validity, in order to ensure that an item adequately assessed the given domain. Items were required to be applicable across the spectrum of weight and eating disturbances to normalcy and discriminate between presentations. References to specific foods or food properties and addiction labels were omitted. Items pertaining to potential antecedents (e.g., mood, restrained eating, food cues) or consequences of eating (e.g., fear of weight gain) were excluded, which resulted in a reduced item pool of 18 items. In phase II (scale development), these 18 items were reviewed by research psychologists (N = 5) with a specialty in eating and weight disorders at Leipzig University Medical Center. Specifically, experts individually rated each item regarding validity and comprehension on a 5-point Likert scale. Subsequently, the 9 items with the highest ratings were selected for the preliminary questionnaire, a feasible length for epidemiological applications. The preliminary HEDO–Q was provided with a 5-point scale (0 = never to 4 = always) containing three items each targeting wanting, liking, and dyscontrol, one of which was reverse-scored. In phase III (scale evaluation, see below), the three reverse-scored items had to be removed because of psychometric deficiencies (cf. Section 2.3). For the final six items of the HEDO–Q, a total mean score and the mean scores of wanting, liking, and dyscontrol were computed, with higher scores indicating greater hedonic overeating.

2.2.2. Eating Disorder Examination–Questionnaire

For convergent and divergent validation, the 8-item short form of the eating Disorder Examination-Questionnaire (EDE–Q) [61,62], the EDE–Q8 [63], was used to assess global eating disorder psychopathology. Two items each cover the concepts of restraint, eating concern, weight concern, and shape concern and are provided with a 7-point Likert scale (0 = characteristic was not present; 6 = characteristic was present every day/in extreme form). A mean global score is calculated, with higher scores indicating greater eating disorder psychopathology. Internal consistency based on this study’s data was excellent (Cronbach’s α = 0.919, 95% CI 0.909–0.928; McDonald’s ω total = 0.937, 95% CI 0.933–0.941). We expected small-sized associations of the EDE–Q8 with noneating-disorder-specific liking and medium-to-large-sized associations with wanting and dyscontrol.

2.2.3. Patient Health Questionnaire

The Patient Health Questionnaire–4 (PHQ–4) [64], the ultra-short form of the 78-item PHQ [65] with 4 items, was used for determining divergent validity and assessing depressive symptoms (PHQ–2) and generalized anxiety disorder symptoms (GAD–2). Rated on a 4-point Likert scale (0 = not at all; 3 = nearly every day), items are summed up to scale scores, with higher scores indicating greater psychopathology. Both the PHQ–2 and GAD–2 had an acceptable-to-good internal consistency (PHQ–4: Cronbach’s α = 0.843, 95% CI 0.827–0.858; McDonald’s ω total = 0.843, 95% CI 0.825–0.861). We assumed small-sized associations with the HEDO–Q.

2.2.4. Measures for Discriminant Validation

Discriminant validity was determined for weight status, comparing participants with obesity (BMI ≥ 30.0 kg/m2) versus those without obesity (BMI < 30.0 kg/m2; cf. Section 2.1.), and eating disturbances, comparing those with versus without these disturbances. Eating disturbances were operationalized using two EDE–Q items [61,62], assessing the number of objective binge-eating episodes and compensatory behaviors (aggregated assessment of self-induced vomiting, laxative misuse, and driven exercising) over the past 28 days, dichotomized to any objective binge eating and/or any compensatory behaviors. Based on the population-based research regarding self-reported hedonic hunger, general food craving, and binge eating in the population [55,66,67], we expected greater hedonic overeating in subsamples with versus without obesity and eating disturbances, respectively, but no differences by sex.

2.3. Data Analytic Plan

We applied chained equation modeling [68] using the variables age, sex, weight status, household income, migration background, and marital status to estimate missing data (<1% for each item of the HEDO–Q). To avoid unrealistic item values, the estimated values (ŷ) were corrected using predictive mean matching (i.e., the realistic values closest to the predicted value were chosen). We used the R package mice [69] for this analysis. To evaluate the factorial validity of the HEDO–Q, a higher order factor model with four three-order factors comprising three postulated subscales was analyzed using confirmatory factor analysis (CFA). (Three negatively polarized items with reversed wording were excluded in an initial data analysis phase due to psychometric deficiencies). We used robust maximum likelihood estimation (MLM) with the mean-adjusted Satorra-Bentler χ2 statistic, which has been shown to be robust to the violation of normality. Model fit was assessed using the Comparative Fit Index (CFI), the Tucker Lewis Index (TLI), the Standardized Root Mean Square Residual (SRMR), and the Root Mean Square Error of Approximation (RMSEA). Per convention, CFI and TLI > 0.900 indicate an adequate model fit and CFI and TLI > 0.950 indicate a good fit [70]. SRMR < 0.08 is considered to represent a good fit [70]. RMSEA values <0.050 represent a close fit, values between 0.050–0.080 represent a reasonably close fit, and values >0.080 represent an unacceptable fit [71].
Furthermore, we conducted measurement invariance analyses across sex, age, and weight status using the sequential strategy for second-order factorial models described by Chen, Sousa, and West [72,73]. The following steps were subsequently tested: configural invariance (the observed variables are correlated with the same latent constructs in both groups), weak invariance (allowing for the comparison of structural relationships between latent constructs in groups), strong invariance (allowing for the comparison of means of the latent construct between groups), and full invariance (leading to comparable reliabilities of indices in groups and comparable decisions in screening processes).
Based on the second-order model, seven models resulted. As recommended by Chen, CFI differences with a cut-off value of ΔCFI > −0.01, in addition to RMSEA changes >0.015, were used for testing the different stages of measurement invariance. In the case that one or more model parameters differed among groups, the specific parameter was freed, and we performed further invariance tests as long as at least two invariant parameters were found per invariance test (i.e., partial measurement invariance) [74]. Data analyses were carried out using the R package lavaan [75].
Regarding construct validity, independent sample t tests were calculated for determining discriminant validity on the HEDO–Q item, component, and total score level. Pearson’s r correlation coefficients served to determine associations between the HEDO–Q components and total score, respectively, and measures for convergent and divergent validation (EDE–Q8, PHQ–2, GAD–2). Item difficulty was calculated as Pi = xi/max(xi) × 100. The Shapiro–Wilk statistic was used to examine the fit of the empirical distribution to the normal curve. The test statistic W can be interpreted similar to a correlation coefficient, with values between 0 and 1, similar to the coefficient of determination. The closer the test statistic is to 1, the less deviation the actual variance shows from the hypothetical variance, thus speaking for a normal distribution. Corrected item-total correlations and the average inter-item correlation were calculated using Pearson’s r. Internal consistency was determined as Cronbach’s α and McDonald’s ω total with 95% confidence intervals (CI). Internal consistency on the components’ level with two items each was estimated using Spearman–Brown correlation coefficients [76].
Data were analyzed using R version 4.1.2 [77]. A two-tailed α < 0.05 was applied for all statistical tests.

3. Results

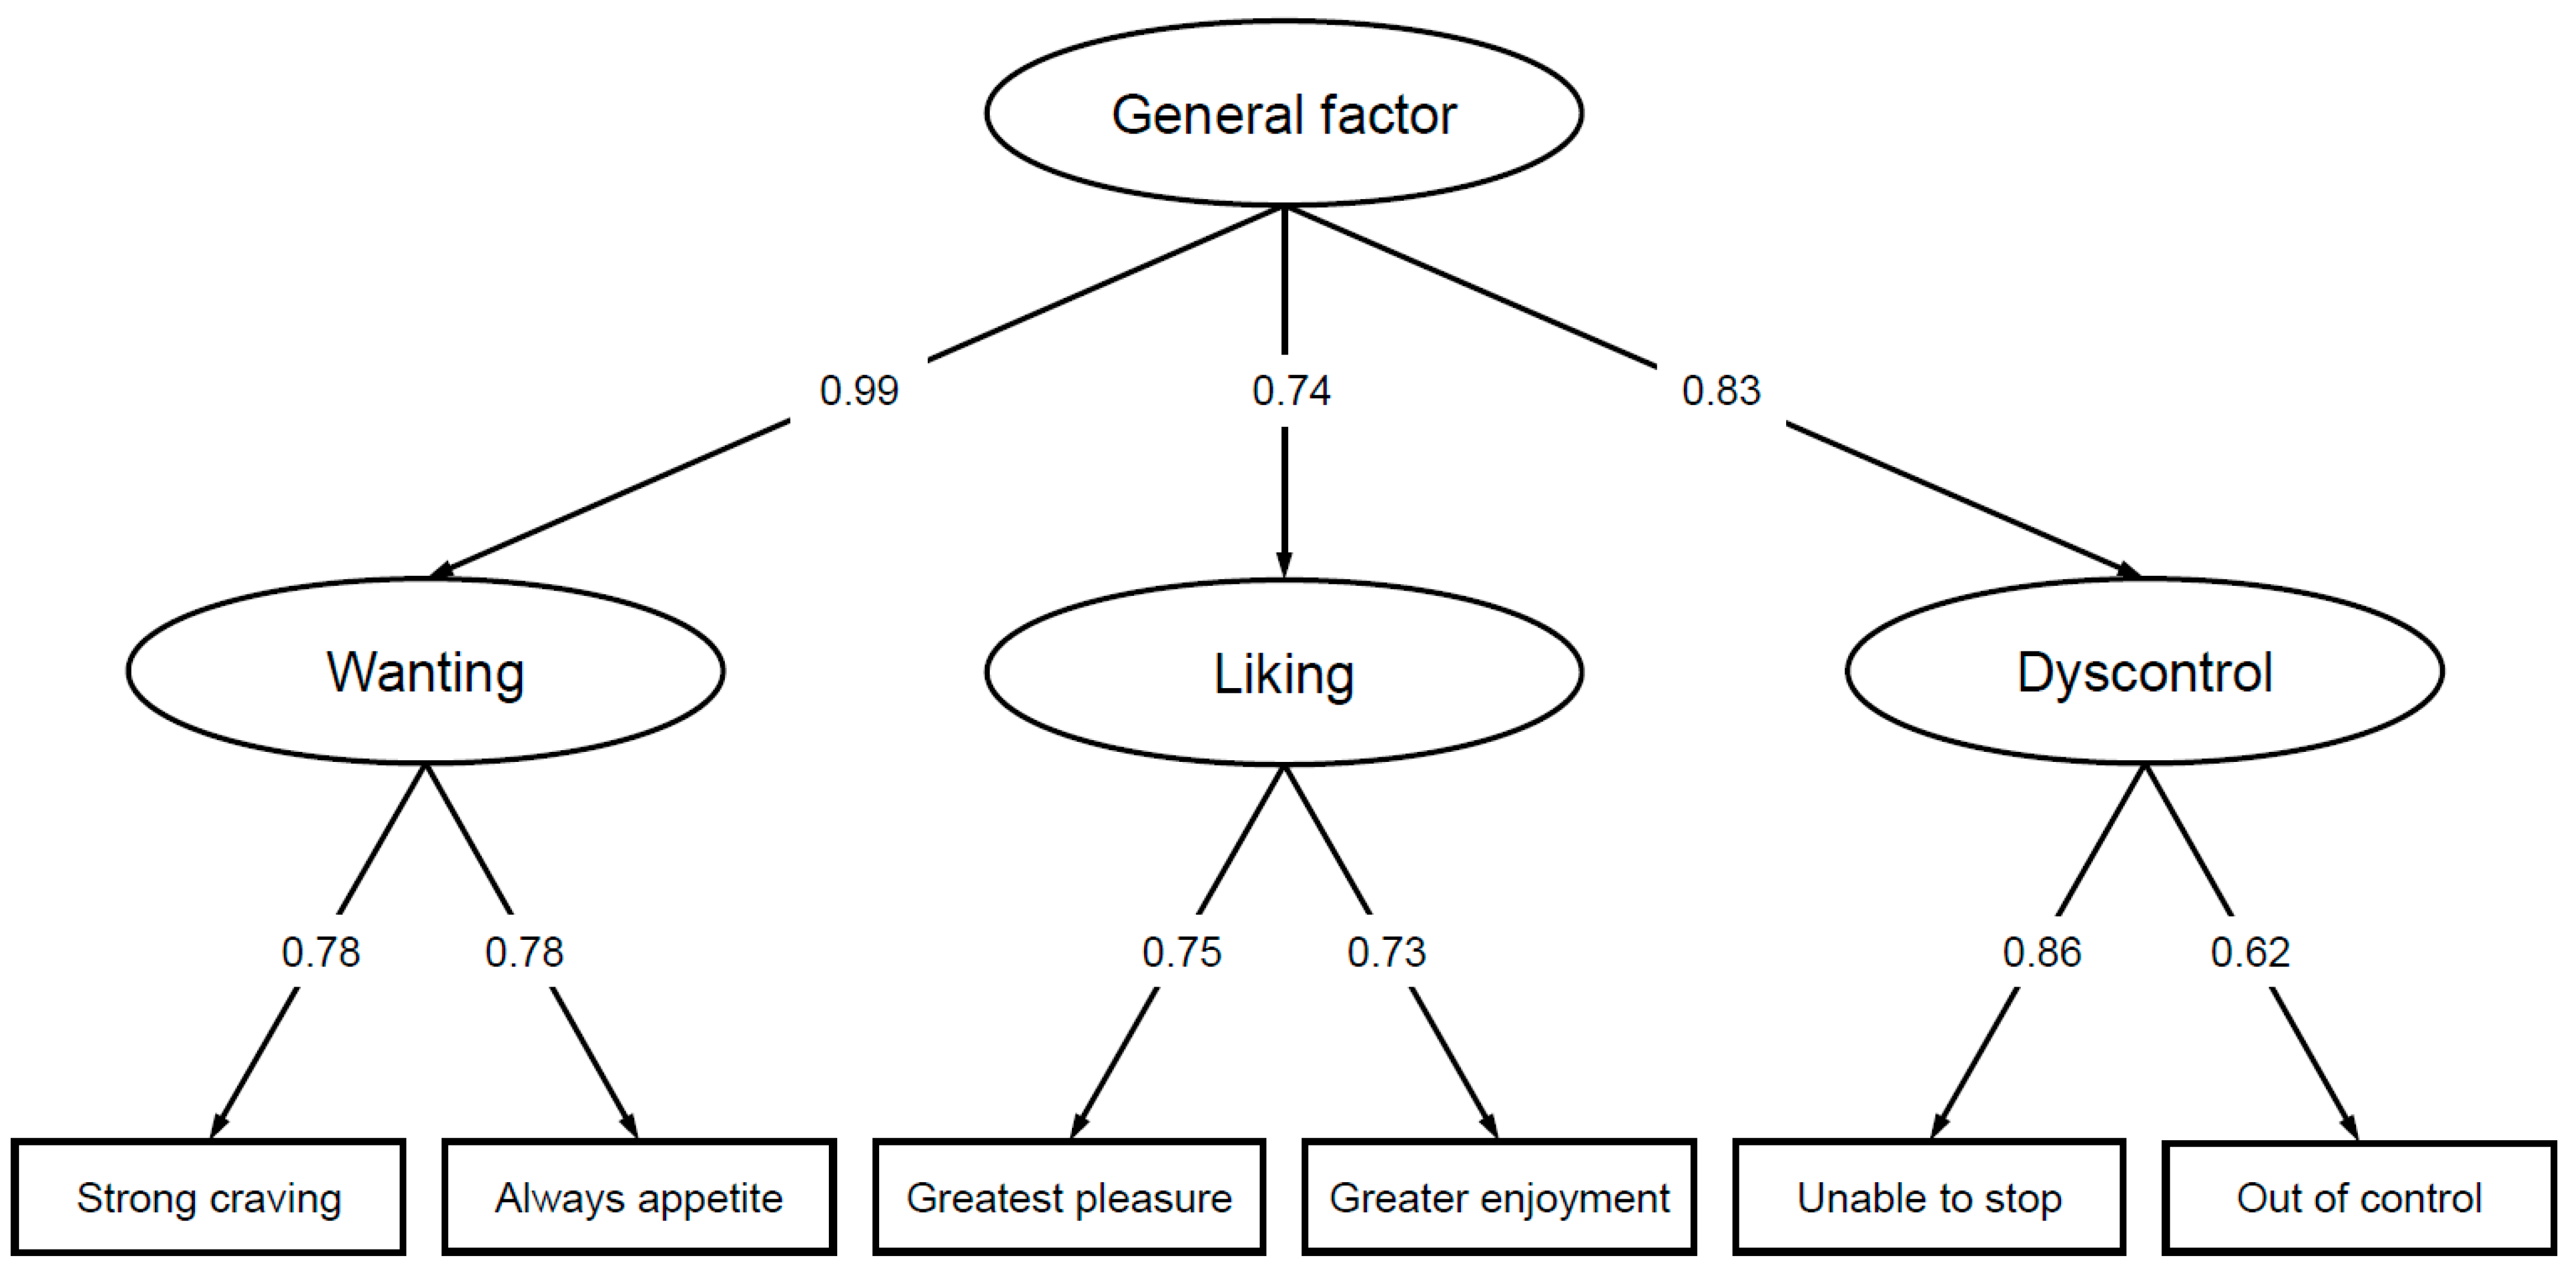
3.1. Factor Structure

The results of the CFA revealed good fit parameters for the second-order factor model (RMSEA = 0.055 [95% CI 0.039–0.072]; SRMR = 0.019; TLI = 0.978, CFI = 0.991). First- and second-order factor loadings are shown in Figure 1.

3.2. Item Characteristics

Means and standard deviations and item characteristics of the HEDO–Q are summarized in Table 2. The total mean score was 1.22 (SD = 0.71, range 0.00–4.00). The Shapiro–Wilk value, W = 0.97, for the HEDO-Q total score was indicative of approximate normality. The corrected item-total correlations for the HEDO–Q total score were good (rit = 0.61–0.79) [78], the item difficulty ranged between 11.00 (“Out of control”) and 43.50 (“Greatest pleasure”), and the item homogeneity amounted to rii = 0.44.

3.3. Internal Consistency

The internal consistency of the HEDO–Q total score was high (Cronbach’s α = 0.822, 95% CI 0.808–0.835; McDonald’s ω total = 0.830, 95% CI 0.813–0.836). The Spearman–Brown coefficients for the two-item consistency estimation ranged from rsb = 0.70–0.75 for the components of wanting, liking, and dyscontrol.

3.4. Measurement Invariance

Measurement invariance analyses of the second-order model confirmed (partial) strict invariance regarding sex, age, and weight status. A detailed description of the results can be found in Table 3.

3.5. Norms

Sex, age, and weight status-specific norms of the HEDO–Q are provided in Table 4.

3.6. Construct Validity

As hypothesized, all HEDO–Q items, components, and the total score were higher in participants with versus without obesity and in those with versus without an eating disturbance (medium-to-large effect sizes), while variations by sex were not detected (d ≤ 0.10). The results for discriminant validity are presented in Table 5.
Regarding convergent and divergent validity, as presented in Table 6, the HEDO–Q total score and the components wanting and dyscontrol showed medium-to-large-size associations with the global eating disorder psychopathology, while liking showed small-size associations, as expected. Associations of the HEDO–Q total score and components wanting and dyscontrol with symptoms of depression and generalized anxiety disorder were small, as hypothesized, and close to zero for liking.

4. Discussion

This study provides the first psychometric evaluation of the newly developed HEDO–Q for the assessment of key components of hedonic overeating. In phase I (item development), an item pool of 52 items was constructed, of which 18 items were selected after evaluating content validity. In phase II (scale development), the item pool was further reduced to 9 items based on expert ratings regarding comprehension and validity. In phase III (scale evaluation), the preliminary HEDO–Q was evaluated in a community sample randomly drawn from the German population to be representative for age and sex (N = 2531). A CFA showed a unidimensional second-order structure, while reproducing the three postulated first-order components of wanting, liking, and dyscontrol of the 6-item HEDO–Q, after removing three reverse-scored items. Psychometric properties were favorable with a low number of missing values (0.2%); good corrected item-total correlations; moderate-to-high item difficulty; and adequate item homogeneity. The high item difficulty of the dyscontrol items was related to low endorsement, especially of the item “Out of control”, which is in line with epidemiological research on binge eating that was self-reported by 4.2% of respondents in the German population [67]. Internal consistency of the total score was high, as evidenced by Cronbach’s α = 0.822 and McDonald’s ω total = 0.830. The components of wanting, liking, and dyscontrol also were internally consistent, considering the Spearman–Brown coefficients (cf. Table 2). Because of the brevity of the HEDO–Q, the total score is recommended for use in future applications. However, a meaningful use of the components’ scores could be justified in the case of acceptable sample-specific psychometric properties, especially internal consistencies of the two items within a component.
Population norms specific for sex, age, and weight status were provided. The HEDO–Q revealed strict measurement invariance for sex, indicating a fully equivalent measurement of hedonic overeating across men and women. Partial invariance for age and weight status was given; measurement equivalence was first-order strong across ages and first- and second-order strict across weight status when the intercept or residual variance of the item “Out of control” were freed, respectively. Thus, some caution should be taken in making HEDO–Q comparisons across ages and weight status. Indeed, consistent with this partial measurement invariance for age and weight status, binge eating was found to be more prevalent in younger than older age groups and in those with higher than lower body weight in population-based research [67,79].
The HEDO–Q (as well as its items and components) presented good discriminant validity for weight status and eating disturbance, as hypothesized, with higher scores in those with versus without obesity or eating disturbances, respectively, thus indicating high criterion validity and suggesting potential utility in clinical applications. Also consistent with expectations, variations by sex were not observed [55,66,67]. Future studies may address the HEDO–Q’s sensitivity to discriminate between individuals with objectively determined obesity or diagnosis of an eating disorder based on clinical interview. Given the epidemiological nature of this study, we operationalized eating disturbances through self-report using single items on binge eating and compensatory behaviors from the established EDE–Q [61,62].
Regarding convergent validity, the medium-to-large associations between the HEDO–Q and its components of wanting and dyscontrol and global eating disorder psychopathology, measured through the eight-item short form of the EDE–Q [63], indicated similarities of hedonic overeating with eating disturbances, including their tendency to experience strong cravings and to lose control over eating. However, the magnitude of these associations also showed that hedonic overeating is not the same as eating disorder psychopathology, as previously demonstrated for other scales measuring ALE [80]. As expected, liking, the consummatory reward component, which may be more characteristic of some eating disturbances or disorders (e.g., BED) than others (e.g., anorexia nervosa) [81], showed small-size associations with eating disorder psychopathology. Divergent validity was demonstrated through small-size associations of the HEDO–Q and its components wanting and dyscontrol with depressive symptoms and generalized anxiety disorder symptoms. Plausibly, associations of liking and depressive and generalized anxiety disorder symptoms were close to zero; indeed, both of these disorders are characterized by anhedonia [82]. The differences in convergent and divergent validity of wanting versus liking are consistent with neurobiological and experimental research, supporting a distinction between these two concepts [33]. Overall, the HEDO–Q demonstrated good construct validity in this initial psychometric evaluation.
Regarding strengths and limitations, a large random sample was drawn from the population, aimed to be representative for the sex and age of the German population. The response rate of 47.1% is similar to that of other comparable population-based surveys [83]. Of note, our survey included one measure of sex or gender, which are difficult to be distinguished in German language. Diverse gender was not assessed. Weight and height were measured by self-report, which often involves an underestimation of weight and overestimation of height [84,85]. Indeed, the prevalence of obesity in this study was lower than in population-based studies using objective measures (14.3 vs. 23.6%) [86]. While the distribution of the lower net household income groups roughly corresponded to that in the German population, our sample included a higher proportion of individuals with an income of 2000 –< 3500 EUR and a lower proportion of individuals with an income ≥3500 EUR [87]. Further, individuals with other than German nationality were underrepresented when compared to the respective proportion in the German population (3.6 vs. 12.4%) [88], likely related to various barriers to participation, for example, the inclusion criterion of sufficient German language skills. Future validations of the HEDO–Q in ethnically diverse populations are warranted. A further strength of this study was the use of established measures for convergent (EDE–Q8) [63] and divergent (PHQ–4) [64] validation. Future research is warranted on the convergent validation of the HEDO–Q against conceptually similar trait measures of ALE. Further, it is important to note that wanting and liking can occur independent of a conscious, cognitive representation [31,89]. For example, processes of the gut–brain reward pathways have been found to bypass conscious flavor or aroma sensory perception [89] and, thus, direct self-report assessment of explicit wanting and explicit liking. Deserving of clarification is whether or not indirect experimental assessments that commonly deduce implicit responses from participants’ performance reflect these aspects with more validity [90]. Finally, it will be important to disentangle wanting from liking in their relative contribution to eating behavior or weight management [91,92].
This first evaluation of the new HEDO–Q established good psychometric properties in the population and suggests the utility of this scale to identify hedonic overeating in individuals with obesity and eating disturbances. As the cross-sectional design impedes inferences about a causal relationship between HEDO–Q scores, obesity, and eating disturbances, longitudinal research is warranted to examine predictive validity, in addition to test-retest validity informing about temporal stability. Application of the HEDO–Q in intervention studies could elucidate its sensitivity to change [93]. Initial research suggests that state measures of explicit liking and explicit wanting, as assessed with the Leeds Food Preference Questionnaire [35], differentially respond to behavioral weight loss treatment, with potential relevance for weight loss and maintenance [94]. Whether this applies to state measures only or also to the traits wanting and liking requires further research in clinical studies on behavioral weight loss or maintenance treatment as well as eating disorder treatment. Convergent validation is not only required regarding conceptually similar scales. For example, validation against state and experimental measures under laboratory or free-living conditions, and in conjunction with psycho- or neurobiological assessments, could help to disentangle the contribution of dispositional trait and situational state hedonic overeating to food intake and related processes (e.g., attentional bias, food cue reactivity, or reward system activation [95,96,97]). The brevity of the six-item HEDO–Q, developed and evaluated in German—and translated into English based on a backtranslation procedure with a licensed translator—allows for ease of use in a variety of research and clinical settings. The items, instructions, and full scoring information of the HEDO–Q will be made available for free download on the publication server of Leipzig University (cf. https://behavioralmedicine.net/?page_id=277). Ultimately, assessment of hedonic overeating may further the understanding of this construct and inform the development of novel interventions targeting high levels of this overeating in individuals at risk for—or with fully developed—eating and weight disorders.

Author Contributions

Conceptualization, A.H., S.K., E.B., V.W. and A.M.; methodology, A.H. and S.K.; software, S.K.; validation, A.H., S.K. and E.B.; formal analysis, S.K.; investigation, E.B.; resources, A.H. and E.B.; data curation, S.K.; writing—original draft preparation, A.H. and S.K.; writing—review and editing, A.H., S.K., E.B., V.W. and A.M.; visualization, S.K.; supervision, A.H.; project administration, E.B.; funding acquisition, A.H. and E.B. All authors have read and agreed to the published version of the manuscript.

Funding

This research received no external funding.

Institutional Review Board Statement

The study was conducted in accordance with the Declaration of Helsinki and approved by the Ethics Committee of the University of Leipzig (No. 145/19-ek, 2 April 2019).

Informed Consent Statement

Informed consent was obtained from all participants involved in the study.

Data Availability Statement

Research data are not shared.

Acknowledgments

We are grateful to Jamie L. Manwaring and Stephanie Günther for their support in editing this paper and to Jayanthi Raman for her intellectual input.

Conflicts of Interest

The authors declare no conflict of interest.

References

  1. World Health Organisation. Obesity and Overweight—Key Facts. Available online: http://www.who.int/news-room/fact-sheets/detail/obesity-and-overweight (accessed on 29 March 2022).
  2. Abarca-Gómez, L.; Abdeen, Z.A.; Hamid, Z.A.; Abu-Rmeileh, N.M.; Acosta-Cazares, B.; Acuin, C.; Adams, R.J.; Aekplakorn, W.; Afsana, K.; Aguilar-Salinas, C.A.; et al. The NCD Risk Factor Collaboration (NCD-RisC). Worldwide trends in body-mass index, underweight, overweight, and obesity from 1975 to 2016: A pooled analysis of 2416 population-based measurement studies in 128·9 million children, adolescents, and adults. Lancet 2017, 390, 2627–2642. [Google Scholar] [CrossRef] [Green Version]
  3. Vandevijvere, S.; Jaacks, L.M.; Monteiro, C.A.; Moubarac, J.; Girling-Butcher, M.; Lee, A.C.; Pan, A.; Bentham, J.; Swinburn, B. Global trends in ultraprocessed food and drink product sales and their association with adult body mass index trajectories. Obes. Rev. 2019, 20, 10–19. [Google Scholar] [CrossRef] [PubMed]
  4. Ferretti, F.; Mariani, M.; Sarti, E. Is the development of obesogenic food environments a self-reinforcing process? Evidence from soft drink consumption. Glob. Health 2021, 17, 91. [Google Scholar] [CrossRef] [PubMed]
  5. Gearhardt, A.N.; Corbin, W.R.; Brownell, K.D. Preliminary validation of the Yale Food Addiction Scale. Appetite 2009, 52, 430–436. [Google Scholar] [CrossRef] [PubMed] [Green Version]
  6. Gearhardt, A.N.; Schulte, E.M. Is food addictive? A review of the science. Annu. Rev. Nut. 2021, 41, 387–410. [Google Scholar] [CrossRef]
  7. American Psychiatric Association. Diagnostic and Statistical Manual of Mental Disorders Fourth Edition (DSM-IV-TR); American Psychiatric Publishing: Arlington, TX, USA, 2000. [Google Scholar]
  8. American Psychiatric Association. Diagnostic and Statistical Manual of Mental Disorders Fifth Edition (DSM-5); American Psychiatric Publishing: Arlington, TX, USA, 2013. [Google Scholar]
  9. Schulte, E.M.; Wadden, T.A.; Allison, K.C. An evaluation of food addiction as a distinct psychiatric disorder. Int. J. Eat. Disord. 2020, 53, 1610–1622. [Google Scholar] [CrossRef]
  10. Gearhardt, A.N.; Hebebrand, J. The concept of “food addiction” helps inform the understanding of overeating and obesity: Debate consensus. Am. J. Clin. Nutr. 2021, 113, 274–276. [Google Scholar] [CrossRef]
  11. Hebebrand, J.; Albayrak, Ö.; Adan, R.; Antel, J.; Dieguez, C.; de Jong, J.; Leng, G.; Menizies, J.; Mercer, J.G.; Murphy, M.; et al. “Eating addiction”, rather than “food addiction”, better captures addictive-like eating behavior. Neurosci. Biobehav. Rev. 2014, 47, 295–306. [Google Scholar] [CrossRef] [Green Version]
  12. Lacroix, E.; Tavares, H.; von Ranson, K.M. Moving beyond the “eating addiction” versus “food addiction” debate: Comment on Schulte et al. (2017). Appetite 2018, 130, 286–292. [Google Scholar] [CrossRef]
  13. Schulte, E.M.; Potenza, M.N.; Gearhardt, A.N. Specific theoretical considerations and future research directions for evaluating addictive-like eating as a substance-based, food addiction: Comment on Lacroix et al. (2018). Appetite 2018, 130, 293–295. [Google Scholar] [CrossRef]
  14. Finlayson, G. Food addiction and obesity: Unnecessary medicalization of hedonic overeating. Nat. Rev. Endocrinol. 2017, 13, 493–498. [Google Scholar] [CrossRef] [PubMed] [Green Version]
  15. Meule, A.; Gearhardt, A.N. Ten years of the Yale Food Addiction Scale: A review of version 2.0. Curr. Addict. Rep. 2019, 6, 218–228. [Google Scholar] [CrossRef]
  16. Ziauddeen, H.; Fletcher, P.C. Is food addiction a valid and useful concept? Obes. Rev. 2013, 14, 19–28. [Google Scholar] [CrossRef] [PubMed]
  17. Westwater, M.L.; Fletcher, P.C.; Ziauddeen, H. Sugar addiction: The state of the science. Eur. J. Nutr. 2016, 55, 55–69. [Google Scholar] [CrossRef] [PubMed] [Green Version]
  18. Tomasi, D.; Volkow, N.D. Striatocortical pathway dysfunction in addiction and obesity: Differences and similarities. Crit. Rev. Biochem. Mol. Biol. 2013, 48, 1–19. [Google Scholar] [CrossRef] [PubMed]
  19. Ziauddeen, H.; Farooqi, I.S.; Fletcher, P.C. Obesity and the brain: How convincing is the addiction model? Nat. Rev. Neurosci. 2012, 13, 279–286. [Google Scholar] [CrossRef]
  20. Ruddock, H.K.; Hardman, C.A. Food addiction beliefs amongst the lay public: What are the consequences for eating behaviour? Curr. Addict. Rep. 2017, 4, 110–115. [Google Scholar] [CrossRef] [Green Version]
  21. Schulte, E.M.; Avena, N.M.; Gearhardt, A.N. Which foods may be addictive? The roles of processing, fat content, and glycemic load. PLoS ONE 2015, 10, e0117959. [Google Scholar] [CrossRef]
  22. Ruddock, H.K.; Field, M.; Hardman, C.A. Exploring food reward and calorie intake in self-perceived food addicts. Appetite 2017, 115, 36–44. [Google Scholar] [CrossRef] [Green Version]
  23. Schulte, E.M.; Smeal, J.K.; Lewis, J.; Gearhardt, A.N. Development of the Highly Processed Food Withdrawal Scale. Appetite 2018, 131, 148–154. [Google Scholar] [CrossRef]
  24. Davis, C. Compulsive overeating as an addictive behavior: Overlap between food addiction and binge eating disorder. Curr. Obes. Rep. 2013, 2, 171–178. [Google Scholar] [CrossRef] [Green Version]
  25. Schulte, E.M.; Gearhardt, A.N. Associations of food addiction in a sample recruited to be nationally representative of the United States. Eur. Eat. Disord. Rev. 2018, 26, 112–119. [Google Scholar] [CrossRef] [PubMed]
  26. Ruddock, H.K.; Christiansen, P.; Halford, J.C.G.; Hardman, C.A. The development and validation of the Addiction-like Eating Behaviour Scale. Int. J. Obes. 2017, 41, 1710–1717. [Google Scholar] [CrossRef] [PubMed] [Green Version]
  27. Schulte, E.M.; Potenza, M.N.; Gearhardt, A.N. How much does the Addiction-Like Eating Behavior Scale add to the debate regarding food versus eating addictions? Int. J. Obes. 2018, 42, 946. [Google Scholar] [CrossRef]
  28. Ruddock, H.K.; Christiansen, P.; Halford, J.C.G.; Hardman, C.A. Response to ‘Jangle fallacy epidemic in obesity research: A comment on Ruddock et al. (2017)’. Int. J. Obes. 2018, 42, 586. [Google Scholar] [CrossRef] [PubMed] [Green Version]
  29. Berridge, K.C. Food reward: Brain substrates of wanting and liking. Neurosci. Biobehav. Rev. 1996, 20, 1–25. [Google Scholar] [CrossRef]
  30. Mela, D.J. Eating for pleasure or just wanting to eat? Reconsidering sensory hedonic responses as a driver of obesity. Appetite 2006, 47, 10–17. [Google Scholar] [CrossRef]
  31. Berridge, K.C.; Robinson, T.E. Liking, wanting, and the incentive-sensitization theory of addiction. Am. Psychol. 2016, 71, 670–679. [Google Scholar] [CrossRef]
  32. Berridge, K.C.; Kringelbach, M.L. Pleasure systems in the brain. Neuron 2015, 86, 646–664. [Google Scholar] [CrossRef] [Green Version]
  33. Morales, I.; Berridge, K.C. ‘Liking’ and ‘wanting’ in eating and food reward: Brain mechanisms and clinical implications. Physiol. Behav. 2020, 227, 113152. [Google Scholar] [CrossRef]
  34. Arumäe, K.; Kreegipuu, K.; Vainik, U. Assessing the overlap between three measures of food reward. Front. Psychol. 2019, 10, 883. [Google Scholar] [CrossRef] [PubMed]
  35. Finlayson, G.; King, N.; Blundell, J.E. Is it possible to dissociate ‘liking’ and ‘wanting’ for foods in humans? A novel experimental procedure. Physiol. Behav. 2007, 90, 36–42. [Google Scholar] [CrossRef] [PubMed]
  36. Finlayson, G.; Bordes, I.; Griffioen-Roose, S.; de Graaf, C.; Blundell, J.E. Susceptibility to overeating affects the impact of savory or sweet drinks on satiation, reward, and food intake in nonobese women. J. Nutr. 2012, 142, 125–130. [Google Scholar] [CrossRef] [PubMed]
  37. French, S.A.; Mitchell, N.R.; Wolfson, J.; Finlayson, G.; Blundell, J.E.; Jeffery, R.W. Questionnaire and laboratory measures of eating behavior. Associations with energy intake and BMI in a community sample of working adults. Appetite 2014, 72, 50–58. [Google Scholar] [CrossRef] [Green Version]
  38. Finlayson, G.; Arlotti, A.; Dalton, M.; King, N.; Blundell, J.E. Implicit wanting and explicit liking are markers for trait binge eating. A susceptible phenotype for overeating. Appetite 2011, 57, 722–728. [Google Scholar] [CrossRef]
  39. Geiser, C.; Götz, T.; Preckel, F.; Freund, P.A. States and traits. Theories, models, and assessment. Eur. J. Psychol. Ass. 2017, 33, 219–223. [Google Scholar] [CrossRef]
  40. Cepeda-Benito, A.; Gleaves, D.H.; Williams, T.L.; Erath, S.A. The development and validation of the State and Trait Food-Cravings Questionnaires. Behav. Res. Ther. 2000, 31, 151–173. [Google Scholar] [CrossRef]
  41. Meule, A.; Hermann, T.; Kübler, A. A short version of the Food Cravings Questionnaire-Trait: The FCQ-T-reduced. Front. Psychol. 2014, 5, 190. [Google Scholar] [CrossRef] [Green Version]
  42. Lowe, M.R.; Butryn, M.L.; Didie, E.R.; Annunziato, R.A.; Thomas, J.G.; Crerand, C.E.; Ochner, C.; Coletta, M.C.; Bellace, D.; Wallaert, M.; et al. The Power of Food Scale. A new measure of the psychological influence of the food environment. Appetite 2009, 53, 114–118. [Google Scholar] [CrossRef]
  43. Epel, E.S.; Tomiyama, A.J.; Mason, A.E.; Laraia, B.A.; Hartman, W.; Ready, K.; Acree, M.; Adam, T.C.; Jeor, S.S.; Kessler, D. The Reward-based Eating Drive Scale: A self-report index of reward-based eating. PLoS ONE 2014, 9, e101350. [Google Scholar] [CrossRef] [Green Version]
  44. Vainik, U.; Eun Han, J.; Epel, E.S.; Tomiyama, J.; Dagher, A.; Mason, A.E. Rapid assessment of reward-related eating: The RED-X5. Obesity 2019, 27, 325–331. [Google Scholar] [CrossRef] [PubMed] [Green Version]
  45. Yang, Y.; Shields, G.S.; Guo, C.; Liu, Y. Executive function performance in obesity and overweight individuals: A meta-analysis and review. Neurosci. Biobehav. Rev. 2018, 84, 225–244. [Google Scholar] [CrossRef] [PubMed]
  46. Stice, E.; Yokum, S. Neural vulnerability factors that increase risk for future weight gain. Psychol. Bull. 2016, 142, 447–471. [Google Scholar] [CrossRef] [PubMed]
  47. Paterson, C.; Lacroix, E.; von Ranson, K.M. Conceptualizing addictive-like eating: A qualitative analysis. Appetite 2019, 141, 104326. [Google Scholar] [CrossRef] [PubMed]
  48. Saruco, E.; Pleger, B. A systematic review of obesity and binge eating associated impairment of the cognitive inhibition system. Front. Nutr. 2021, 8, 609012. [Google Scholar] [CrossRef] [PubMed]
  49. Suzuki, S.; Cross, L.; O’Doherty, J.P. Elucidating the underlying components of food valuation in the human orbitofrontal cortex. Nat. Neurosci. 2017, 20, 1780–1786. [Google Scholar] [CrossRef] [Green Version]
  50. Michaud, A.; Vainik, U.; Garcia-Garcia, I.; Dagher, A. Overlapping neural endophenotypes in addiction and obesity. Front. Endocrinol. 2017, 8, 127. [Google Scholar] [CrossRef] [Green Version]
  51. Kalon, E.; Hong, J.Y.; Tobin, C.; Schulte, T. Psychological and neurobiological correlates of food addiction. Int. Rev. Neurobiol. 2016, 129, 85–110. [Google Scholar] [CrossRef] [Green Version]
  52. Boateng, G.O.; Neilands, T.B.; Frongillo, E.A.; Melgar-Quiñonez, H.R.; Young, S.L. Best practices for developing and validating scales for health, social and behavioral research: A primer. Front. Public Health 2018, 11, 149. [Google Scholar] [CrossRef]
  53. Simms, L.J. Classical and modern methods of psychological scale construction. Soc. Personal. Psychol. Compass 2008, 2, 149. [Google Scholar] [CrossRef]
  54. Mason, A.E.; Vainik, U.; Acree, M.; Tomiyama, A.J.; Dagher, A.; Epel, E.S.; Hecht, F.M. Improving assessment of the spectrum of reward-related eating: The RED-13. Front. Psychol. 2017, 8, 795. [Google Scholar] [CrossRef] [PubMed] [Green Version]
  55. Andreeva, E.; Neumann, M.; Nöhre, M.; Brähler, E.; Hilbert, A.; de Zwaan, M. Validation of the German version of the Power of Food Scale in a general population sample. Obes. Facts. 2019, 12, 416–426. [Google Scholar] [CrossRef] [PubMed]
  56. Gearhardt, A.N.; Corbin, W.R.; Brownell, K.D. Development of the Yale Food Addiction Scale Version 2.0. Psychol. Addict. Behav. 2016, 30, 113–121. [Google Scholar] [CrossRef] [PubMed] [Green Version]
  57. Kliemann, N.; Beeken, R.J.; Wardle, J.; Johnson, F. Development and validation of the Self-Regulation of Eating Behaviour Questionnaire for adults. Int. J. Behav. Nutr. Phys. Act. 2016, 13, 87. [Google Scholar] [CrossRef] [PubMed] [Green Version]
  58. Schmalbach, I.; Schmalbach, B.; Zenger, M.; Petrowski, K.; Beutel, M.; Hilbert, A.; Brähler, E. Psychometric properties of the German version of the Self-Regulation of Eating Behavior Questionnaire. Front. Psychol. 2021, 12, 649867. [Google Scholar] [CrossRef]
  59. Stunkard, A.J.; Messick, S. The Three-factor Eating Questionnaire to measure dietary restraint, disinhibition and hunger. J. Psychosom. Res. 1985, 29, 71–83. [Google Scholar] [CrossRef]
  60. Pudel, V.; Westenhoefer, J. Fragebogen zum Essverhalten; Hogrefe: Göttingen, Germany, 1989. [Google Scholar]
  61. Fairburn, C.G.; Beglin, S.J. Eating Disorder Examination-Questionnaire (Edition 6.0). 2008. Available online: http://www.credo-oxford.com/7.2.html (accessed on 29 March 2022).
  62. Hilbert, A.; Tuschen-Caffier, B. Eating Disorder Examination-Questionnaire. Deutschsprachige Übersetzung, 2nd ed.; Dgvt-Verlag: Tübingen, Germany, 2016. [Google Scholar]
  63. Kliem, S.; Mößle, T.; Zenger, M.; Strauß, B.; Brähler, E.; Hilbert, A. The Eating Disorder Examination-Questionnaire 8: A brief measure of eating disorder psychopathology (EDE–Q8). Int. J. Eat. Disord. 2016, 49, 613–616. [Google Scholar] [CrossRef] [Green Version]
  64. Löwe, B.; Wahl, I.; Rose, M.; Spitzer, C.; Glaesmer, H.; Wingenfeld, K.; Schneider, A.; Brähler, E. A 4-item measure of depression and anxiety: Validation and standardization of the Patient Health Questionnaire-4 (PHQ-4) in the general population. J. Affect. Disord. 2010, 122, 86–95. [Google Scholar] [CrossRef]
  65. Spitzer, R.L.; Kroenke, K.; Williams, J.B. Validation and utility of a self-report version of PRIME-MD: The PHQ primary care study. JAMA 1999, 282, 1737–1744. [Google Scholar] [CrossRef] [Green Version]
  66. Chao, A.M.; Grilo, C.M.; Sinha, R. Food cravings, binge eating, and eating disorder psychopathology: Exploring the moderating roles of gender and race. Eat. Behav. 2016, 21, 41–47. [Google Scholar] [CrossRef] [Green Version]
  67. Hilbert, A.; de Zwaan, M.; Braehler, E. How frequent are eating disturbances in the population? Norms of the Eating Disorder Examination-Questionnaire. PLoS ONE 2012, 7, e29125. [Google Scholar] [CrossRef] [PubMed] [Green Version]
  68. Zhang, Z. Multiple imputation with multivariate imputation by chained equation (MICE) package. Ann. Transl. Med. 2016, 4, 30. [Google Scholar] [CrossRef] [PubMed]
  69. Van Buuren, S.; Groothuis-Oudshoorn, K. mice: Multivariate imputation by chained equations in R. J. Stat. Soft. 2011, 45, 1–67. [Google Scholar] [CrossRef] [Green Version]
  70. Hu, L.; Bentler, P.M. Cutoff criteria for fit indices in covariance structure analysis: Conventional criteria versus new alternatives. Struct. Equ. Model. Multidiscip. J. 1999, 6, 1–55. [Google Scholar] [CrossRef]
  71. Browne, M.W.; Cudeck, R. Alternative ways of assessing model fit. Sage Focus Ed. 1993, 21. [Google Scholar] [CrossRef]
  72. Chen, F.F. Sensitivity of goodness of fit indexes to lack of measurement invariance. Struct. Equ. Model. A Multidiscip. J. 2007, 14, 464–504. [Google Scholar] [CrossRef]
  73. Chen, F.F.; Sousa, K.H.; West, S.G. Teacher’s corner: Testing measurement invariance of second-order factor models. Struct. Equ. Model. A Multidiscip. J. 2005, 12, 471–492. [Google Scholar] [CrossRef]
  74. Byrne, B.M.; Shavelson, R.J.; Muthén, B.O. Testing for the equivalence of factor covariance and mean structures: The issue of partial measurement invariance. Psychol. Bull. 1989, 105, 456–466. [Google Scholar] [CrossRef]
  75. Rosseel, Y. lavaan: An R package for structural equation modeling. J. Stat. Soft. 2012, 48, 1–36. [Google Scholar] [CrossRef] [Green Version]
  76. Eisinga, R.; Grotenhuis, M.T.; Pelzer, B. The reliability of a two-item scale: Pearson, Cronbach or Spearman-Brown? Int. J. Public Health 2013, 58, 637–642. [Google Scholar] [CrossRef]
  77. R Core Team. R: A Language and Environment for Statistical Computing; R Foundation for Statistical Computing: Vienna, Austria, 2020; Available online: https://www.R-project.org/ (accessed on 29 March 2022).
  78. Moosbrugger, H.; Kelava, A. Testtheorie und Fragebogenkonstruktion (3. Überarbeitete Auflage); Springer: Berlin, Germany, 2020. [Google Scholar]
  79. Darby, A.; Hay, P.; Mond, J.; Rodgers, B.; Owen, C. Disordered eating behaviours and cognitions in young women with obesity: Relationship with psychological status. Int. J. Obes. 2007, 31, 876–882. [Google Scholar] [CrossRef] [PubMed] [Green Version]
  80. Wiedemann, A.A.; Carr, M.M.; Ivezaj, V.; Barnes, R.D. Examining the construct validity of food addiction severity specifiers. Eat. Weight. Disord. 2021, 26, 1503–1509. [Google Scholar] [CrossRef] [PubMed]
  81. Dolan, S.C.; Khindri, R.; Franko, D.L.; Thomas, J.J.; Reilly, E.E.; Eddy, K.T. Anhedonia in eating disorders: A meta-analysis and systematic review. Int. J. Eat. Disord. 2022, 55, 161–175. [Google Scholar] [CrossRef] [PubMed]
  82. Sandman, C.F.; Craske, M.G. Psychological Treatments for Anhedonia, Current Topics in Behavioral Neurosciences; Springer: Berlin/Heidelberg, Germany, 2021; pp. 1–23. [Google Scholar] [CrossRef]
  83. German National Cohort Consortium. The German National Cohort: Aims, study design and organization. Eur. J. Epidemiol. 2014, 29, 371–382. [Google Scholar] [CrossRef] [PubMed]
  84. Connor Gorber, S.; Tremblay, M.; Moher, D.; Gorber, B. A comparison of direct vs. self-report measures for assessing height, weight and body mass index: A systematic review. Obes. Rev. 2007, 8, 307–326. [Google Scholar] [CrossRef] [PubMed]
  85. Pursey, K.; Burrows, T.L.; Stanwell, P.; Collins, C.E. How accurate is web-based self-reported height, weight, and body mass index in young adults? J. Med. Internet. Res. 2014, 16. [Google Scholar] [CrossRef]
  86. Mensink, G.B.; Schienkiewitz, A.; Haftenberger, M.; Lampert, T.; Ziese, T.; Scheidt-Nave, C. Übergewicht und Adipositas in Deutschland. Bundesgesundheitsblatt Gesundheitsforschung Gesundheitsschutz 2013, 56, 786–794. [Google Scholar] [CrossRef] [PubMed] [Green Version]
  87. Federal Statistical Office. Einkommens- und Verbrauchsstichprobe: Einnahmen und Ausgaben Privater Haushalte 2018; Federal Statistical Office: Wiesbaden, Germany, 2020. Available online: https://www.destatis.de/DE/Themen/Gesellschaft-Umwelt/Einkommen-Konsum-Lebensbedingungen/Einkommen-Einnahmen-Ausgaben/Publikationen/Downloads-Einkommen/evs-einnahmen-ausgaben-privater-haushalte-2152604189004.pdf?__blob=publicationFile (accessed on 29 March 2022).
  88. Federal Statistical Office. Bevölkerung nach. Nationalität und Geschlecht; Federal Statistical Office: Wiesbaden, Germany, 2019. Available online: https://www.destatis.de/DE/Themen/Gesellschaft-Umwelt/Bevoelkerung/Bevoelkerungsstand/Tabellen/zensus-geschlecht-staatsangehoerigkeit-2019.html (accessed on 29 March 2022).
  89. de Araujo, I.E.; Schatzker, M.; Small, D.M. Rethinking food reward. Annu. Rev. Psychol. 2020, 71, 139–164. [Google Scholar] [CrossRef]
  90. Sherman, J.W.; Klein, S.A.W. The four deadly sins of implicit attitude research. Front. Psychol. 2021, 11, 604340. [Google Scholar] [CrossRef]
  91. Havermans, R.C. “You say it’s liking, I say it’s wanting …” On the difficulty of disentangling food reward in man. Appetite 2011, 57, 286–294. [Google Scholar] [CrossRef]
  92. Finlayson, G.; Dalton, M. Current progress in the assessment of ‘liking’ vs. ‘wanting’ food in human appetite. Comment on ‘“You say it’s liking, I say it’s wanting..”. On the difficulty of disentangling food reward in man’. Appetite 2012, 58, 373–378. [Google Scholar] [CrossRef] [PubMed]
  93. Oustric, P.; Beaulieu, K.; Casanova, N.; O’Connor, D.; Gibbons, C.; Hopkins, M.; Blundell, J.; Finlayson, G. Food liking but not wanting decreases after controlled intermittent or continuous energy restriction to ≥5% weight loss in women with overweight/obesity. Nutrients 2021, 13, 182. [Google Scholar] [CrossRef] [PubMed]
  94. Oustric, P.; Gibbons, C.; Beaulieu, K.; Blundell, J.; Finlayson, G. Changes in food reward during weight management interventions—A systematic review. Obes. Rev. 2018, 19, 1642–1658. [Google Scholar] [CrossRef] [PubMed]
  95. Hardman, C.A.; Jones, A.; Burton, S.; Duckwoth, J.J.; McGale, L.S.; Mead, B.R.; Roberts, C.A.; Field, M.; Werthmann, J. Food-related attentional bias and its associations with appetitive motivation and body weight: A systematic review and meta-analysis. Appetite 2021, 157, 104986. [Google Scholar] [CrossRef] [PubMed]
  96. Stott, N.; Fox, J.R.E.; Williams, M.O. Attentional bias in eating disorders: A meta-review. Int. J. Eat. Disord. 2021, 54, 1377–1399. [Google Scholar] [CrossRef]
  97. Boswell, R.G.; Kober, H. Food cue reactivity and craving predict eating and weight gain: A meta-analytic review. Obes. Rev. 2016, 17, 159–177. [Google Scholar] [CrossRef] [PubMed]
Figure 1. Confirmatory factor analysis of the 6-item Hedonic Overeating–Questionnaire (N = 2531): standardized factor loadings for the first- and second-order factors.
Nutrients 14 01865 g001
Table 1. Demographic characteristics of the study sample.
TotalWomenMen
(N = 2531)(N = 1350)(N = 1181)
Age (years)
 Mean (SD)48.4 (17.9)49.1 (17.8)47.7 (17.9)
 Median [min, max]50.0 [14.0, 95.0]50.0 [14.0, 90.0]49.0 [14.0, 95.0]
 Missing0 (0%)0 (0%)0 (0%)
Body mass index (kg/m2)25.82 (5.02)25.56 (5.40)26.12 (4.53)
 Missing23 (1.1%)18 (1.3%)5 (0.4%)
Weight status
 Underweight (<18.5 kg/m2)49 (1.9%)37 (2.7%)12 (1.0%)
 Normal weight (18.5–24.9 kg/m2)1173 (46.3%)684 (50.7%)489 (41.4%)
 Overweight (25.0–29.9 kg/m2)924 (36.5%)393 (29.1%)531 (45.0%)
 Obesity class I (30.0–34.9 kg/m2)239 (9.4%)144 (10.7%)95 (8.0%)
 Obesity class II (35.0–39.9 kg/m2)73 (2.9%)44 (3.3%)29 (2.5%)
 Obesity class III (≥40.0 kg/m2)50 (2.0%)30 (2.2%)20 (1.7%)
 Missing23 (0.9%)18 (1.3%)5 (0.4%)
Household income (net, per month)
 500 –< 1000 EUR176 (7.0%)95 (7.0%)81 (6.9%)
 1000 –< 2000 EUR716 (28.3%)456 (33.8%)260 (22.0%)
 2000 –< 3500 EUR1042 (41.2%)491 (36.4%)551 (46.7%)
 ≥3500 EUR544 (21.5%)276 (20.4%)268 (22.7%)
 Missing53 (2.1%)32 (2.4%)21 (1.8%)
Marital status
 Married/living together1101 (43.5%)553 (41.0%)548 (46.4%)
 Married/separated70 (2.8%)43 (3.2%)27 (2.3%)
 Single760 (30.0%)355 (26.3%)405 (34.3%)
 Divorced368 (14.5%)226 (16.7%)142 (12.0%)
 Widowed220 (8.7%)167 (12.4%)53 (4.5%)
 Missing12 (0.5%)6 (0.4%)6 (0.5%)
Nationality
 German2437 (96.3%)1299 (96.2%)1138 (96.4%)
 Other90 (3.6%)47 (3.5%)43 (3.6%)
 Missing4 (0.2%)4 (0.3%)0 (0%)
Notes. Displayed are means (SD), median [min, max], and N (%) derived from raw data.
Table 2. Descriptions and item characteristics of the Hedonic Overeating–Questionnaire (HEDO–Q) (N = 2531).
MSDritPirsbW
Wanting1.380.88 34.500.750.95
  Strong craving1.480.940.7837.00 0.89
  Always appetite1.291.020.7532.25 0.88
Liking1.660.94 41.500.710.96
  Greatest pleasure1.741.050.7143.50 0.90
  Greater enjoyment1.581.100.7939.50 0.91
Dyscontrol0.620.76 15.500.700.79
  Unable to stop0.800.910.7120.00 0.79
  Out of control0.440.790.6111.00 0.59
HEDO–Q1.220.71 30.50 0.97
Notes. Displayed are means and SDs of the HEDO–Q items, components, and total scale (0–4), corrected item-total correlations (rit), item difficulties (Pi), and Spearman–Brown coefficients for two-item consistency estimation per component (rsb); W = Shapiro–Wilk W test of normality.
Table 3. Measurement invariance analyses of the Hedonic Overeating–Questionnaire (HEDO–Q) for sex, age, and weight status (N = 2531).
χ2dfCFIΔCFIRMSEAΔRMSEAMeasurement Invariance
Sex (female, male)
151.65120.989 0.060
257.21150.9890.0000.055−0.005
359.52170.9890.0000.051−0.004
463.57200.9890.0000.047−0.004
568.10220.9890.0000.045−0.002
671.04250.9890.0000.042−0.003
769.91310.990+0.0010.036−0.006
Age (14–34 years, 35–54 years, 55–98 years)
147.20180.992 0.051
254.34240.9920.0000.044−0.007
363.08280.991−0.0010.0440.000
4439.12350.901−0.0900.130+0.086x
4 part 168.74320.9910.0000.041−0.003
573.39360.9910.0000.039−0.002
680.23410.9910.0000.037−0.002
7115.46530.984−0.0070.043+0.006
Weight Status (nonobese, obese)
150.13120.989 0.059
275.79150.983−0.0060.065+0.006
399.34170.977−0.0060.071+0.006
4130.44200.971−0.0060.074+0.003
5148.74220.968−0.0030.074+0.000
6176.41250.963−0.0050.075+0.001
7237.22310.932−0.0310.091+0.016x
7 part 2179.76300.959−0.0040.072−0.003
Notes. Model 1: unrestricted baseline model (configural); 2: invariance of first-order factor loadings (first-order weak); 3: additionally, invariance of second-order factor loadings (first- and second-order weak); 4: additionally, invariance of intercepts of measured variables (first-order strong); 5: additionally, invariance of intercepts of first-order factors (first- and second-order strong); 6: additionally, disturbances of first-order factors constrained across groups (first-order strict); 7: additionally, invariance of residual variances of the measured variables (first- and second-order strict); all fit statistics are robust. CFI = Comparative Fit Index; ΔCFI = CFI differences for the different measurement invariance levels; RMSEA = Root Mean Square Error of Approximation; ΔRMSEA = RMSEA differences for the different measurement invariance levels. ΔCFI≤–0.010 complemented by ΔRMSEA 0.015 indices a violation of measurement invariance. √ marks measurement invariance for the respective level. 1 Freed intercept of item “Out of control;” 2 freed residual variance of item “Out of control”.
Table 4. Norms of the Hedonic Overeating–Questionnaire (HEDO–Q) in the total sample and in subsamples by sex, age, and weight status.
TotalSexAgeWeight Status
HEDO–Q
Score
Sample
N = 2531
Women
N = 1350
Men
N = 1181
14–34 y
N = 658
35–54 y
N = 872
55–98 y
N = 1001
Nonobese
N = 2144
Obese
N = 369
0.0055434652
0.17898681093
0.33131412101216145
0.50181917151623207
0.672627242023322812
0.833537332832423817
1.004547433843524925
1.175657544753635932
1.336566645665716939
1.57273726472787647
1.677980787378848354
1.838585847984898962
2.008989898490929369
2.179291928792959573
2.339493959194969778
2.509695969495979882
2.679797989697989988
2.839898989898999992
3.009999999999999996
3.179999999999>999997
3.339999999999>99>9998
3.50>9999>999999>99>9998
3.67>99>99>9999>99>99>9999
3.83>99>99>99>99>99>99>9999
4.00>99>99>99>99>99>99>99>99
Notes. Norms are presented as HEDO–Q total mean scores and corresponding percentiles. The sample sizes (N) of the respective groups are based on the imputed data set (cf. Section 2.3), resulting in deviations from the sample description in Table 1 based on raw data. Percentiles are shown for the total sample, added by sex, age and weight status-specific percentiles. The light gray indicates elevated hedonic overeating (90th–94th percentile), the medium gray indicates high hedonic overeating (95th–98th percentile), and the dark grey indicates very high hedonic overeating (≥99th percentile).
Table 5. Group differences by sex, weight status, and eating disturbance using the Hedonic Overeating–Questionnaire (HEDO–Q).
Women
(N = 1350)
Men
(N = 1181)
Group Differences
MSDMSDt(2529)pd95% CI
Wanting1.350.881.410.871.690.0920.07−0.010.15
  Strong craving1.440.941.510.951.810.0710.07−0.010.15
  Always appetite1.271.031.311.001.230.2200.05−0.030.13
Liking1.630.961.690.931.490.1370.06−0.020.14
  Greatest pleasure1.711.061.781.031.860.0630.070.000.15
  Greater enjoyment1.561.111.601.080.790.4280.03−0.050.11
Dyscontrol0.620.770.610.74−0.270.786−0.01−0.090.07
  Unable to stop0.800.920.800.900.150.8800.01−0.070.08
  Out of control0.450.830.420.79−0.670.502−0.03−0.100.05
HEDO–Q1.20.721.240.691.260.2090.05−0.030.13
Nonobese
(N = 2144)
Obese
(N = 369)
Group Differences
MSDMSDt(2511)pd95% CI
Wanting1.290.831.920.9613.23<0.0010.750.860.63
  Strong craving1.380.902.051.0012.99<0.0010.730.840.62
  Always appetite1.200.981.801.1210.59<0.0010.600.710.49
Liking1.600.942.030.928.17<0.0010.460.570.35
  Greatest pleasure1.681.042.111.037.40<0.0010.420.530.31
  Greater enjoyment1.521.081.941.136.98<0.0010.390.500.28
Dyscontrol0.520.651.181.0316.20<0.0010.911.030.80
  Unable to stop0.700.831.371.1213.37<0.0010.750.870.64
  Out of control0.340.690.991.1714.82<0.0010.840.950.72
HEDO–Q1.140.651.710.8314.91<0.0010.840.950.73
No Eating Disturbance
(N = 1856)
Eating Disturbance
(N = 675)
Group Differences
MSDMSDt(2511)pd95% CI
Wanting1.180.791.930.8820.33<0.0010.910.821.01
  Strong craving1.280.872.020.9218.68<0.0010.840.750.93
  Always appetite1.090.931.831.0417.10<0.0010.770.680.86
Liking1.510.922.070.8913.67<0.0010.610.520.70
  Greatest pleasure1.601.012.131.0511.48<0.0010.520.430.61
  Greater enjoyment1.421.072.011.0412.38<0.0010.560.470.65
Dyscontrol0.420.581.160.924.55<0.0011.101.011.20
  Unable to stop0.570.761.411.0022.3<0.0011.000.911.09
  Out of control0.260.620.921.0519.43<0.0010.870.780.96
HEDO–Q1.040.611.720.7323.68<0.0011.060.971.16
Notes. The sample sizes (N) of the respective groups are based on the imputed data set (cf. Section 2.3), resulting in deviations from the sample description in Table 1 based on raw data.
Table 6. Associations of the Hedonic Overeating–Questionnaire (HEDO–Q) with depression and generalized anxiety disorder symptoms and eating disorder psychopathology (N = 2531).
Variable123456
1. HEDO–Q
2. Wanting0.88 **
[0.87, 0.89]
3. Liking0.81 **0.56 **
[0.80, 0.82][0.53, 0.59]
4. Dyscontrol0.78 **0.63 **0.38 **
[0.77, 0.80][0.60, 0.65][0.35, 0.42]
5. Depressive Symptoms0.15 **0.13 **0.05 *0.21 **
(PHQ–2)[0.11, 0.19][0.09, 0.16][0.01, 0.09][0.17, 0.25]
6. Generalized Anxiety0.16 **0.15 **0.04 *0.23 **0.73 **
Disorder Symptoms (GAD–2)[0.12, 0.20][0.11, 0.18][0.00, 0.08][0.19, 0.27][0.71, 0.75]
7. Global Eating Disorder0.41 **0.37 **0.21 **0.46 **0.24 **0.26 **
Psychopathology (EDE–Q8)[0.37, 0.44][0.34, 0.40][0.17, 0.24][0.43, 0.49][0.20, 0.27][0.23, 0.30]
Pearson correlation coefficients are displayed. Values in square brackets indicate the 95% confidence interval. * p < 0.05, ** p < 0.01.
Publisher’s Note: MDPI stays neutral with regard to jurisdictional claims in published maps and institutional affiliations.

