
Reproducibility of the German and Slovakian Versions of the Dietary Habits and Nutrition Beliefs Questionnaire (KomPAN)

 , , and
Abstract
1. Introduction
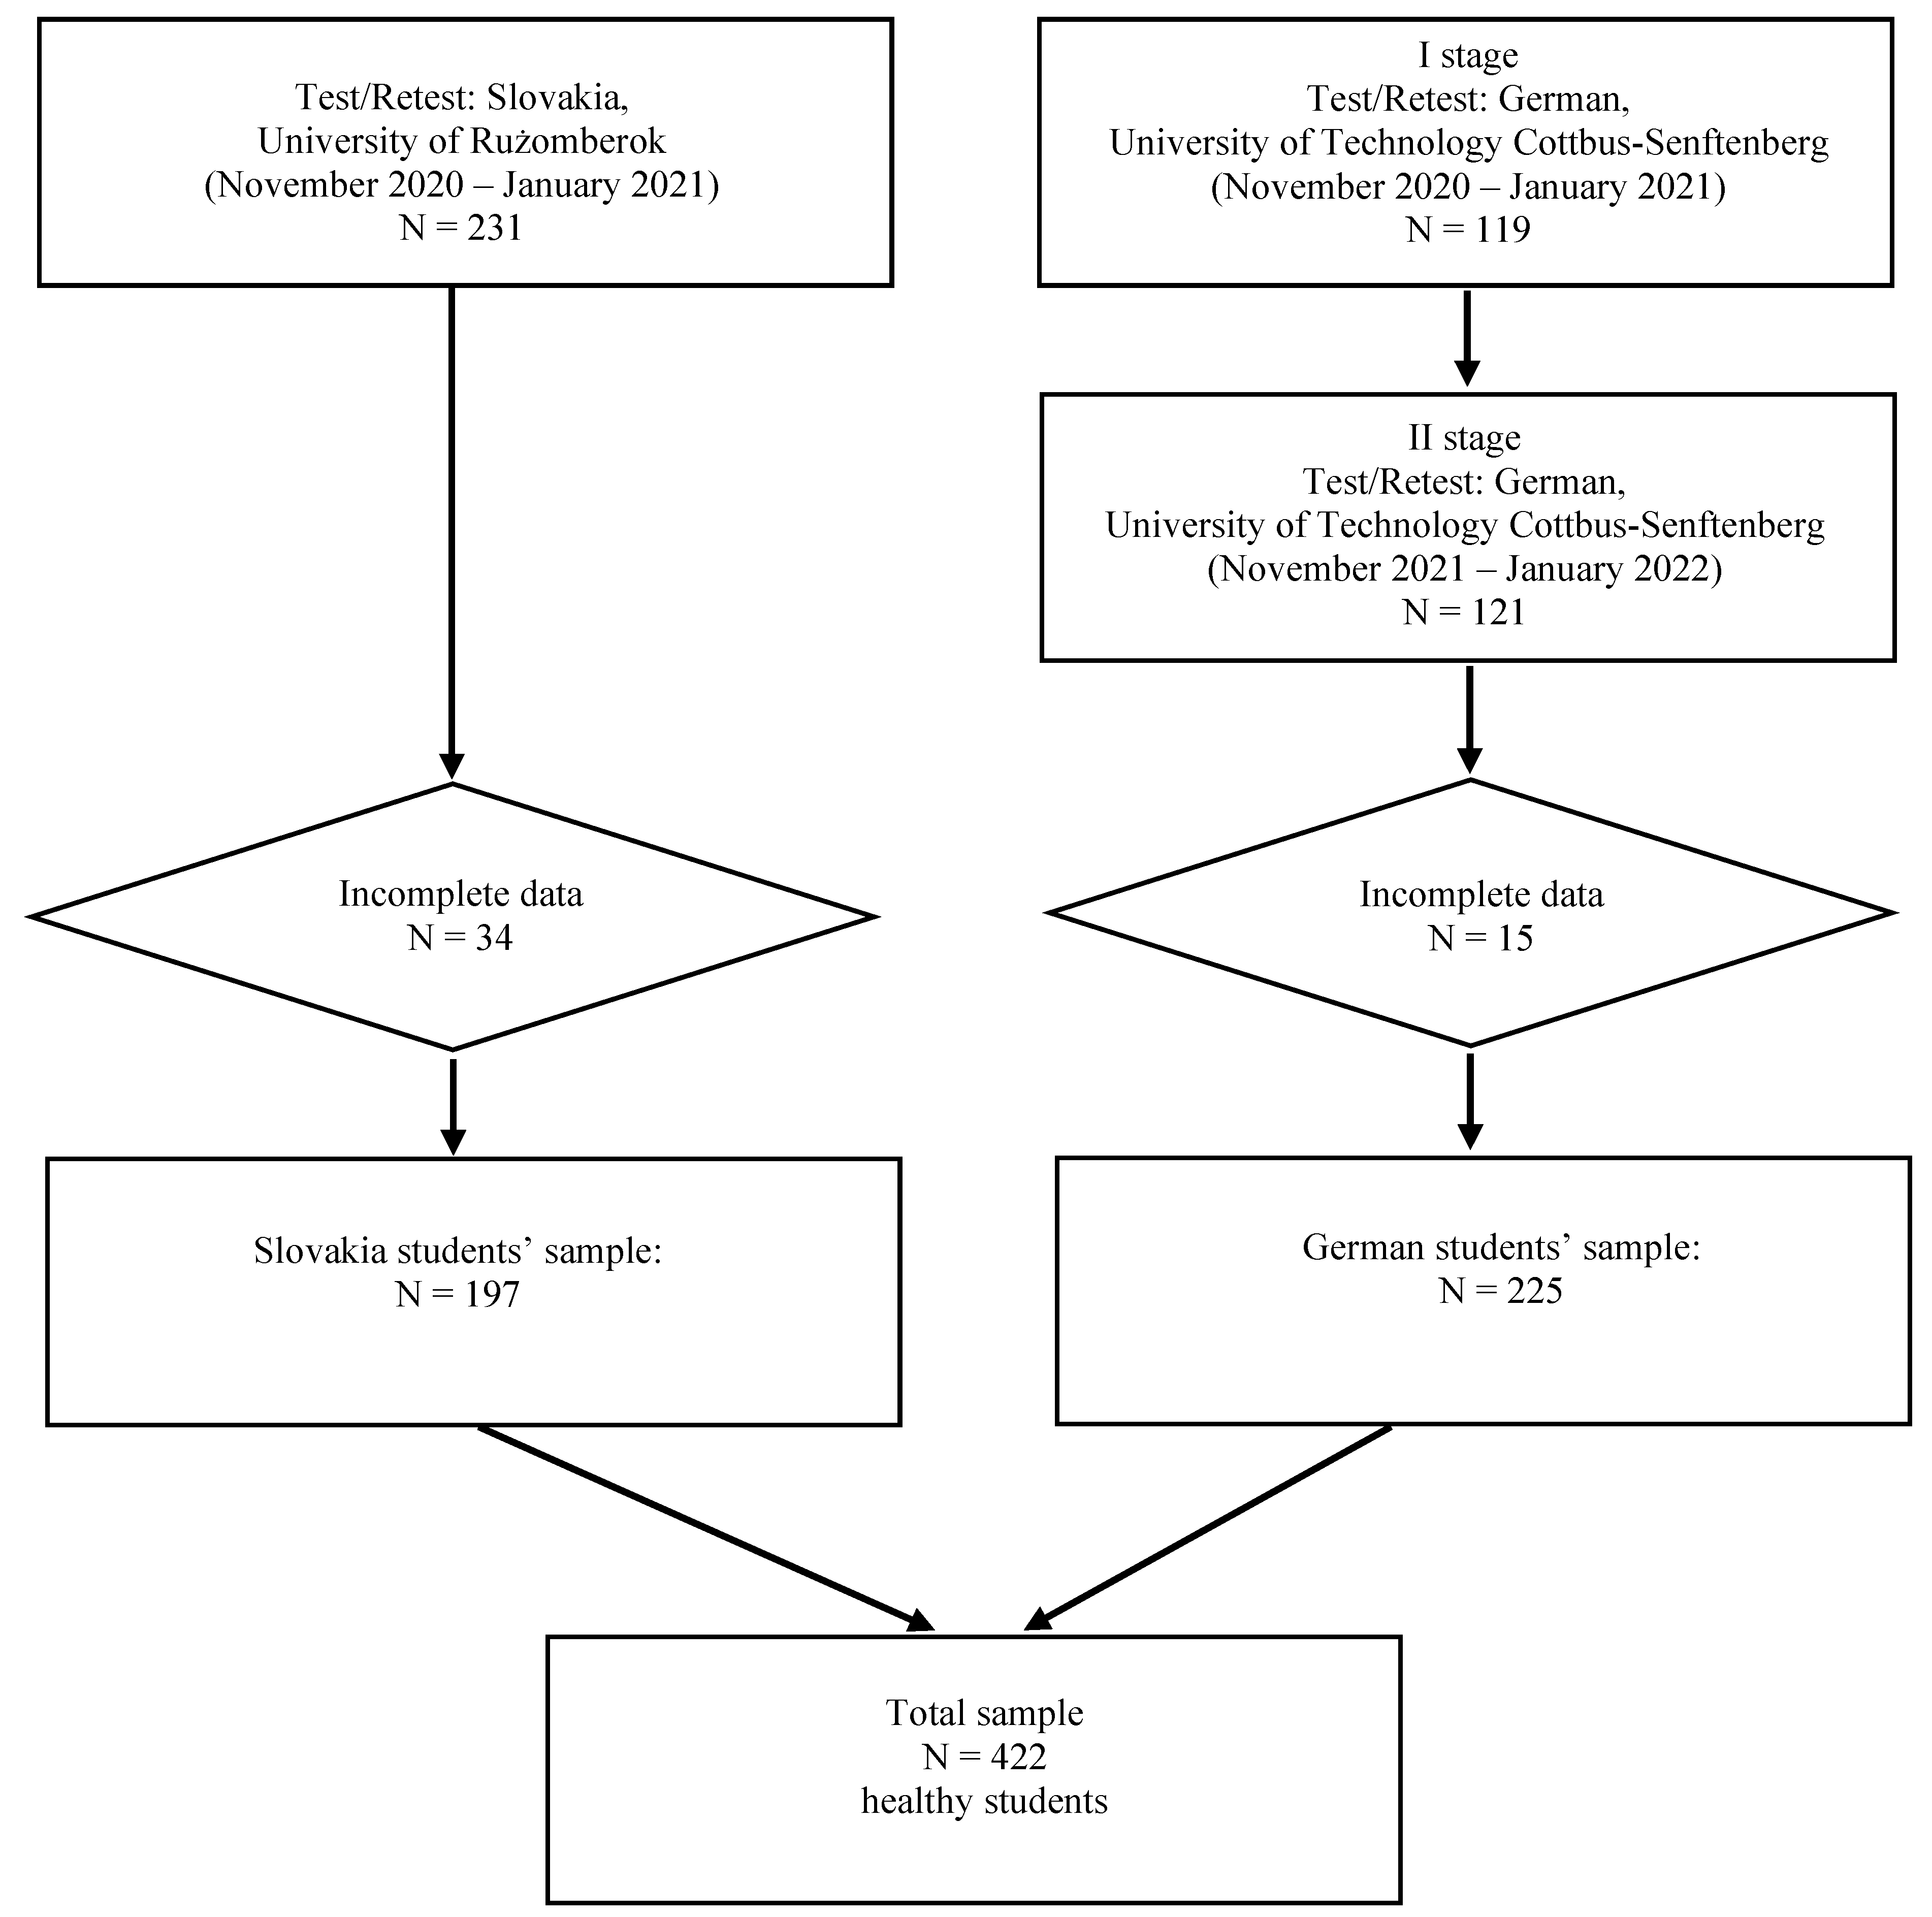
2. Material and Methods
- PHDI: the sum of food frequencies of 10 food groups (times/day);
- NHDI: the sum of food frequencies of 14 food groups (times/day);
- DQI: the product of the sum of food frequencies (expressed as times/day) of 24 food groups and weight coefficients.
3. Statistics
4. Results
5. Discussions
6. Conclusions
Supplementary Materials
Author Contributions
Funding
Institutional Review Board Statement
Informed Consent Statement
Data Availability Statement
Acknowledgments
Conflicts of Interest
References
- Sharma, S. Development and use of FFQ among adults in diverse settings across the globe. Proc. Nutr. Soc. 2011, 70, 232–251. [Google Scholar] [CrossRef] [PubMed]
- Athanasiadou, E.; Kyrkou, C.; Fotiou, M.; Tsakoumaki, F.; Dimitropoulou, A.; Polychroniadou, E.; Menexes, G.; Athanasiadis, A.P.; Biliaderis, C.G.; Michaelidou, A.-M. Development and Validation of a Mediterranean Oriented Culture-Specific Semi-Quantitative Food Frequency Questionnaire. Nutrients 2016, 8, 522. [Google Scholar] [CrossRef] [PubMed]
- El Sayed Ahmad, R.; Baroudi, M.; Shatila, H.; Nasreddine, L.; Chokor, F.A.Z.; Chehab, R.F.; Forman, M.R.; Naja, F. Validity and Reproducibility of a Culture-Specific Food Frequency Questionnaire in Lebanon. Nutrients 2020, 12, 3316. [Google Scholar] [CrossRef] [PubMed]
- Shim, J.S.; Oh, K.; Kim, H.C. Dietary assessment methods in epidemiologic studies. Epidemiol. Health 2014, 36, e2014009. [Google Scholar] [CrossRef] [PubMed]
- Naska, A.; Lagiou, A.; Lagiou, P. Dietary assessment methods in epidemiological research: Current state of the art and future prospects. F1000Research 2017, 6, 926. [Google Scholar] [CrossRef] [PubMed]
- Cui, Q.; Xia, Y.; Wu, Q.; Chang, Q.; Niu, K.; Zhao, Y. A meta-analysis of the reproducibility of food frequency questionnaires in nutritional epidemiological studies. Int. J. Behav. Nutr. Phys. Act. 2021, 18, 12. [Google Scholar] [CrossRef]
- Whitton, C.; Ho, J.; Tay, Z.; Rebello, S.A.; Lu, Y.; Ong, C.N.; van Dam, R.M. Relative Validity and Reproducibility of a Food Frequency Questionnaire for Assessing Dietary Intakes in a Multi-Ethnic Asian Population Using 24-h Dietary Recalls and Biomarkers. Nutrients 2017, 9, 1059. [Google Scholar] [CrossRef]
- Sierra-Ruelas, É.; Bernal-Orozco, M.F.; Macedo-Ojeda, G.; Márquez-Sandoval, Y.F.; Altamirano-Martínez, M.B.; Vizmanos, B. Validation of semiquantitative FFQ administered to adults: A systematic review. Public Health Nutr. 2020, 24, 3399–3418. [Google Scholar] [CrossRef]
- Cade, J.; Thompson, R.; Burley, V.; Warm, D. Development, validation and utilisation of food-frequency questionnaires—A review. Public Health Nutr. 2002, 5, 567–587. [Google Scholar] [CrossRef]
- Willett, W.; Lenart, E. Reproducibility and validity of food frequency questionnaires. In Nutritional Epidemiology, 3rd ed.; Willett, W., Ed.; Oxford University Press: Oxford, UK; New York, NY, USA, 2012; Volume 6, pp. 96–141. [Google Scholar]
- Tabacchi, G.; Amodio, E.; Di Pasquale, M.; Bianco, A.; Jemni, M.; Mammina, C. Validation and reproducibility of dietary assessment methods in adolescents: A systematic literature review. Public Health Nutr. 2014, 17, 2700–2714. [Google Scholar] [CrossRef]
- Notario-Barandiaran, L.; Freire, C.; García-de-la-Hera, M.; Compañ-Gabucio, M.M.; Torres-Collado, L.; González-Palacios, S.; Mundo, A.; Molina, M.; Fernandez, M.F.; Vioque, J. Reproducibility and validity of a food frequency questionnaire for dietary assessment in adolescents in a self-reported way. Nutrients 2020, 12, 2081. [Google Scholar] [CrossRef]
- Suliga, E.; Sobaś, K.; Bryk, P.; Wawrzycka, I.; Głuszek, S. Assessment of eating habits of patients qualified for bariatric surgery—Preliminary research. Med. Stud./Stud. Med. 2021, 37, 193–201. [Google Scholar] [CrossRef]
- Gawęcki, J. Dietary Habits and Nutrition Beliefs Questionnaire and the Manual for Developing Nutritional Data; Committee of Human Nutrition Science, Polish Academy of Sciences: Olsztyn, Poland, 2018; pp. 1–52. [Google Scholar]
- Kowalkowska, J.; Wadolowska, L.; Czarnocińska, J.; Czlapka-Matyasik, M.; Galiński, G. Jeżewska-Zychowicz, M.; Bronkowska, M.; Długosz, A.; Loboda, D.; Wyka, J. Reproducibility of a Questionnaire for Dietary Habits, Lifestyle and Nutrition Knowledge Assessment (KomPAN) in Polish Adolescents and Adults. Nutrients 2018, 10, 1845. [Google Scholar] [CrossRef]
- Jeżewska-Zychowicz, M.; Gębski, J.; Guzek, D.; Świątkowska, M.; Stangierska, D.; Plichta, M.; Wasilewska, M. The associations between dietary patterns and sedentary behaviors in Polish adults (lifestyle study). Nutrients 2018, 10, 1004. [Google Scholar] [CrossRef]
- McHugh, M.L. Interrater reliability: The kappa statistic. Biochem. Med. 2012, 22, 276–282. [Google Scholar] [CrossRef]
- Tavakol, M.; Dennick, R. Making sense of Cronbach’s alpha. Int. J. Med. Educ. 2011, 2, 53–55. [Google Scholar] [CrossRef]
- Cade, J.E.; Burley, V.J.; Warm, D.L.; Thompson, R.L.; Margetts, B.M. Food-frequency questionnaires: A review of their design, validation and utilisation. Nutr. Res. Rev. 2004, 17, 5–22. [Google Scholar] [CrossRef]
- Suliga, E.; Cieśla, E.; Michel, S.; Kadučáková, H.; Martin, T.; Śliwiński, G.; Braun, A.; Ižová, M.; Lehotská, M.; Kozieł, D.; et al. Diet Quality Compared to the Nutritional Knowledge of Polish, German, and Slovakian University Students—Preliminary Research. Int. J. Environ. Res. Public Heal. 2020, 17, 9062. [Google Scholar] [CrossRef]
- Wądołowska, L. Walidacja kwestionariusza częstotliwości spożycia żywności. Ocena powtarzalności [Validation of a food frequency questionnaire. Assessment of reproducibility]. Bromat. Chem. Toksykol 2005, XXXVIII, 27–33. [Google Scholar]
- Głąbska, D.; Książek, A.; Guzek, D. Development and validation of the Brief Folate-Specific Food Frequency Questionnaire for young women’s diet assessment. Int. J. Environ. Res. Public Health. 2017, 14, 1574. [Google Scholar] [CrossRef]
- Głąbska, D.; Staniec, A.; Guzek, D. Assessment of Validity and Reproducibility of the Zinc-Specific Dietary Intake Questionnaire Conducted for Young Polish Female Respondents. Nutrients 2018, 10, 104. [Google Scholar] [CrossRef] [PubMed]
- Cui, Q.; Xia, Y.; Wu, Q.; Chang, Q.; Niu, K.; Zhao, J. Validity of the food frequency questionnaire for adults in nutritional epidemiological studies: A systematic review and meta-analysis. Crit. Rev. Sci. Nutr. 2021, 14, 14–19. [Google Scholar] [CrossRef] [PubMed]
- Dehghan, M.; Ilow, R.; Zatonska, K.; Szuba, A.; Zhang, X.; Mente, A.; Regulska-Ilow, B. Development, reproducibility and validity of the food frequency questionnaire in the Poland arm of the Prospective Urban and Rural Epidemiological (PURE) study. J. Hum. Nutr. Diet. 2012, 25, 225–232. [Google Scholar] [CrossRef] [PubMed]
- Alsaffar, A.A. Validation of a general nutrition knowledge questionnaire in a Turkish student sample. Public Health Nutr. 2012, 15, 2074–2085. [Google Scholar] [CrossRef] [PubMed]
- Kliemann, N.; Wardle, J.; Johnson, F.; Crocer, H. Reliability and validity of a revised version of the General Nutrition Knowledge Questionnaire. Eur. J. Clin. Nutr. 2016, 70, 1174–1180. [Google Scholar] [CrossRef]
- Rosi, A.; Martini, D.; Grosso, G.; Bonaccio, M.L.; Scazzina, F.; Angelino, D. Validation of a nutrition knowledge questionnaire in Italian students attending the University of Parma. Public Health Nutr. 2020, 23, 1527–1531. [Google Scholar] [CrossRef]
- Zainuddin, L.R.M.; Taha, C.S.C.; Shahril, M.R. Design and validation of web-based or online food frequency questionnaire for adults: A scoping review. Malays. J. Med. Health Sci. 2021, 17, 320–331. [Google Scholar]
- Thompson, C.; Vidgen, H.; Gallegos, D.; Hannan-Jonnes, M. Validation of a revised General Nutrition Knowledge Questionnaire for Australia. Public Health Nutr. 2021, 24, 1608–1618. [Google Scholar] [CrossRef]
- Hendrie, G.A.; Cox, D.N.; Coveney, J. Validation of the General Nutrition Knowledge Questionnaire in an Australian community sample. Nutr. Diet. 2008, 65, 72–77. [Google Scholar] [CrossRef]
- Masson, L.F.; McNeill, G.; Tomany, J.O.; Simpson, J.A.; Peace, H.S.; Wei, L.; Grubb, D.A.; Bolton-Smith, C. Statistical approaches for assessing the relative validity of a food-frequency questionnaire: Use of correlation coefficients and the kappa statistic. Public Health Nutr. 2003, 6, 313–321. [Google Scholar] [CrossRef]
- Yaghi, N.; Boulos, C.; Baddoura, R.; Abifadel, M.; Yaghi, C. Validity and reliability of a food frequency questionnaire for community dwelling older adults in a Mediterranean country: Lebanon. Nutr. J. 2022, 21, 40. [Google Scholar] [CrossRef]
- Serban, C.L.; Banu, A.M.; Putnoky, S.; Butica, S.I.; Niculescu, S.D.; Putnoky, S. Relative validation of a four weeks retrospective food frequency questionnaire versus 7-day paper-based food records in estimating the intake of energy and nutrients in adults. Nutr. Diet 2021, 13, 113–125. [Google Scholar] [CrossRef]
- Hilger-Kolb, J.; Diehl, K. ‘Oh God, I have to eat something, but where can I get something quickly?’—A qualitative interview study on barriers to healthy eating among university students in Germany. Nutrients 2019, 11, 2440. [Google Scholar] [CrossRef]
- Bjørnarå, H.B.; Hillesund, E.R.; Torstveit, M.K.; Stea, T.H.; Øverby, N.C.; Bere, E. An assessment of the test-retest reliability of the New Nordic Diet score. Food Nutr. Res. 2015, 59, 28397. [Google Scholar] [CrossRef]
- Rei, M.; Severo, M.; Rodrigues, S. Reproducibility and validity of the Mediterranean Diet Quality Index (KIDMED Index) in a sample of Portuguese adolescents. Br. J. Nutr. 2021, 126, 1737–1748. [Google Scholar] [CrossRef]
- Bradette-Laplante, M.; Carbonneau, É.; Provencher, V.; Bégin, C.; Robitaille, J.; Desroches, S.; Vohl, M.C.; Corneau, L.; Lemieux, S. Development and validation of a nutrition knowledge questionnaire for a Canadian population. Public Health Nutr. 2017, 20, 1184–1192. [Google Scholar] [CrossRef]
- Knudsen, V.K.; Hatch, E.E.; Cueto, H.; Tucker, K.L.; Wise, L.; Christensen, T.; Mikkelsen, E.M. Relative validity of a semi-quantitative, web-based FFQ used in the ‘Snart Forældre’ cohort—A Danish study of diet and fertility. Public Health Nutr. 2016, 19, 1027–1034. [Google Scholar] [CrossRef]
- Fallaize, R.; Forster, H.; Macready, A.L.; Walsh, M.C.; Mathers, J.C.; Brennan, L.; Gibney, E.R.; Gibney, M.J.; Lovegrove, J.A. Online dietary intake estimation: Reproducibility and validity of the Food4Me food frequency questionnaire against a 4-day weighed food record. J. Med. Internet Res. 2014, 16, e190. [Google Scholar] [CrossRef]
- Di Lorio, C.K. Measurement In Health Behavior: Methods For Research And Evaluation; Jossey-Bass: San Francisco, CA, USA, 2021; Volume 10–11, pp. 176–236. [Google Scholar]
- Fraser, G.E.; Yan, R.; Butler, T.L.; Jaceldo-Siegl, K.; Beeson, W.L.; Chan, J. Missing data in a long food frequency questionnaire: Are imputed zeroes correct? Epidemiology 2009, 20, 289–294, Erratum in Epidemiology 2009, 20, 630. [Google Scholar] [CrossRef]
- Meike, J.; Chang, B.P.I.; Hristov, H.; Pravnst, I.; Profeta, A.; Millard, J. Changes in food consumption during the COVID-19 pandemic: Analysis of consumer survey data from the first lockdown period in Denmark, Germany, and Slovenia. Front. Nutr. 2021, 8, 635859. [Google Scholar]
- Habánik, J.; Grenčiková, A.; Krajčo, K. The impact of industry 4.0 on the selected macroekonomic indicators in Slovak Republic, Germany, The USA and Japan. J. Int. Stud. 2021, 14, 26–37. [Google Scholar] [CrossRef]
- Niedźwiedzka, E.; Wądołowska, L.; Kowalkowska, J. Reproducibility of a non-quantitative food frequency questionnaire (62-item FFQ-6) and PCA-driven dietary pattern identification in 13–21-year-old females. Nutrients 2019, 11, 2183. [Google Scholar] [CrossRef] [PubMed]
- Lombard, M.J.; Steyn, N.P.; Charlton, K.E.; Senekal, M. Application and interpretation of multiple statistical tests to evaluate validity of dietary intake assessment methods. Nutr. J. 2015, 14, 40. [Google Scholar] [CrossRef] [PubMed]
- Wądołowska, L. Walidacja metod i mierniki statystyczne [Validation of methods and statistical indicators]. In Przewodnik Metodyczny Badań Sposobu Żywienia [A Guidebook for the Methodology of Dietary Assessments]; Gronowska-Senger, A., Ed.; Committee of Human Nutrition Science, Polish Academy of Sciences: Warsaw, Poland, 2013; Volume 3, pp. 17–38. [Google Scholar]
- Yun, T.C.; Ahmad, S.R.; Quee, D.K.S. Dietary habits and lifestyle practices among university students in Universiti Brunei Darussalam. Malays. J. Med. Sci. 2018, 25, 56–66. [Google Scholar] [PubMed]


| Variable | Germany (N = 225) | Slovakia (N = 197) | p | ||
|---|---|---|---|---|---|
| n | % | n | % | ||
| Sex | |||||
| Women | 166 | 73.8 | 153 | 77.7 | ns |
| Men | 59 | 26.2 | 44 | 22.3 | |
| Age M (SD) | 21.6 | 4.0 | 21.0 | 3.9 | ns |
| Place of residence | |||||
| Village | 62 | 27.6 | 122 | 61.9 | <0.001 |
| Small town (<20,000 inhabitants) | 61 | 27.1 | 32 | 16.2 | |
| Town (20,000–100,000 inhabitants) | 66 | 29.3 | 35 | 17.8 | |
| City (>100,000 inhabitants) | 36 | 16.0 | 8 | 4.1 | |
| Economic situation of the family | |||||
| Below average | 61 | 27.1 | 25 | 12.7 | <0.001 |
| Average | 150 | 66.7 | 166 | 84.3 | |
| Above average | 13 | 5.8 | 6 | 3.0 | |
| Economic situation of the household | |||||
| We live modestly or very modestly | 15 | 6.7 | 1 | 0.5 | <0.001 |
| We live normally | 114 | 50.7 | 8 | 4.1 | |
| We live relatively affluently | 77 | 34.2 | 81 | 41.1 | |
| We live very affluently | 18 | 8.0 | 96 | 48.7 | |
| Number of persons in the family: Me(IQR) | 2(3) | 5(2) | <0.001 | ||
| Lifestyle | |||||
| Physical activity during school or work 1 | |||||
| Low | 122 | 54.2 | 51 | 25.9 | <0.001 |
| Average | 95 | 42.2 | 128 | 65.0 | |
| High | 8 | 3.6 | 18 | 9.1 | |
| Physical activity during leisure time 2 | |||||
| Low | 16 | 7.1 | 42 | 21.3 | <0.001 |
| Average | 106 | 47.1 | 129 | 65.5 | |
| High | 103 | 45.8 | 26 | 13.2 | |
| Screen time | |||||
| Less than 2 h | 16 | 7.11 | 63 | 32.0 | <0.001 |
| From 2 to almost 4 h | 59 | 26.2 | 74 | 37.6 | |
| From 4 to almost 6 h | 80 | 35.6 | 41 | 20.8 | |
| From 6 to almost 8 h | 55 | 24.4 | 16 | 8.1 | |
| From 8 to almost 10 h | 8 | 3.6 | 1 | 0.5 | |
| More than 10 h | 7 | 3.1 | 2 | 1.0 | |
| Sleep time—weekdays | |||||
| 6 or less hours/day | 44 | 19.6 | 72 | 36.5 | <0.001 |
| More than 6 but less than 9 h/day | 174 | 77.3 | 117 | 59.4 | |
| 9 or more hours/day | 7 | 3.1 | 8 | 4.1 | |
| Sleep time—weekends | |||||
| 6 or less hours/day | 10 | 4.4 | 24 | 12.2 | 0.05 |
| More than 6 but less than 9 h/day | 129 | 57.3 | 105 | 53.3 | |
| 9 or more hours/day | 86 | 38.2 | 68 | 34.5 | |
| Currently smoking cigarettes, pipe, or tobacco | |||||
| No | 179 | 79.6 | 153 | 77.7 | ns |
| Yes | 49 | 20.4 | 44 | 22.3 | |
| Smoked cigarettes in the past | |||||
| No | 142 | 63.1 | 125 | 63.5 | ns |
| Yes | 83 | 36.9 | 72 | 36.5 | |
| Health status in comparison to other people your age | |||||
| Worse than others | 21 | 9.3 | 27 | 13.7 | ns |
| The same as others | 164 | 72.9 | 140 | 71.1 | |
| Better than others | 40 | 17.8 | 30 | 15.2 | |
| Question | Products | Germany | p | Slovakia | p | ||||||
|---|---|---|---|---|---|---|---|---|---|---|---|
| Test | Retest | Test | Retest | ||||||||
| M(SD) | Me(IQR) | M(SD) | Me(IQR) | M(SD) | Me(IQR) | M(SD) | Me(IQR) | ||||
| 23 | Wholemeal (brown) bread/bread rolls | 0.5 (0.4) | 0.5 (0.4) | 0.4 (0.4) | 0.5 (0.4) | ns | 0.3 (0.4) | 0.1 (0.4) | 0.3 (0.4) | 0.1 (0.4) | ns |
| 25 | Buckwheat, oats, wholegrain pasta, or other coarse-ground groats | 0.3 (0.4) | 0.1 (0.4) | 0.3 (0.4) | 0.1 (0.4) | ns | 0.3 (0.4) | 0.1 (0.4) | 0.3 (0.4) | 0.1 (0.4) | ns |
| 31 | Milk (including flavoured milk, hot chocolate, and lattes) | 0.5 (0.5) | 0.5 (0.4) | 0.4 (0.5) | 0.1 (0.4) | 0.05 | 0.6 (0.6) | 0.5 (0.9) | 0.6 (0.6) | 0.5 (0.4) | ns |
| 32 | Fermented milk beverages, e.g., yoghurts, kefir (natural or flavoured) | 0.3 (0.3) | 0.1 (0.4) | 0.3 (0.4) | 0.1 (0.4) | ns | 0.5 (0.4) | 0.5 (0.4) | 0.4 (0.4) | 0.5 (0.4) | ns |
| 33 | Fresh cheese curd products, e.g., cottage cheese, homogenised cheese, fromage frais | 0.2 (0.3) | 0.1 (0.0) | 0.2 (0.3) | 0.1 (0.0) | ns | 0.2 (0.3) | 0.1 (0.0) | 0.2 (0.2) | 0.1 (0.4) | ns |
| 37 | White meat, e.g., chicken, turkey, rabbit | 0.3 (0.2) | 0.1 (0.4) | 0.2 (0.2) | 0.1 (0.4) | ns | 0.4 (0.4) | 0.5 (0.4) | 0.4 (0.4) | 0.5 (0.4) | ns |
| 38 | Fish | 0.2 (0.2) | 0.1 (0.1) | 0.1 (0.20) | 0.1 (0.0) | ns | 0.1 (0.1) | 0.1 (0.0) | 0.1 (0.2) | 0.1 (0.04) | ns |
| 40 | Pulse-based foods, e.g., foods made from beans, peas, soybeans, and lentils | 0.2 (0.3) | 0.1 (0.4) | 0.2 (0.3) | 0.1 (0.4) | ns | 0.1 (0.14) | 0.1 (0.08) | 0.1 (0.13) | 0.1 (0.0) | ns |
| 42 | Fruits | 1.0 (0.7) | 1.00 (1.5) | 1.01 (0.63) | 1.00 (0.5) | ns | 0.87 (0.62) | 0.5 (0.5) | 0.9 (0.6) | 0.5 (0.5) | ns |
| 43 | Vegetables | 1.0 (0.63) | 1.0 (0.5) | 1.0 (0.6) | 1.00 (0.5) | ns | 0.8 (0.6) | 0.5 (0.5) | 0.8 (0.6) | 0.5 (0.5) | ns |
| 22 | Wheat bread, rye bread, wheat/rye bread, toast bread, and bread rolls | 0.5 (0.5) | 0.5 (0.4) | 0.4 (0.35) | 0.5 (0.4) | ns | 0.7 (0.6) | 0.5 (0.9) | 06 (0.5) | 0.5 (0.9) | 0.01 |
| 24 | White rice, white pasta, and fine-ground groats, e.g., semolina, couscous | 0.4 (0.3) | 0.5 (0.4) | 0.4 (0.30) | 0.5 (0.4) | ns | 0.3 (0.3) | 0.1 (0.4) | 0.3 (0.3) | 0.1 (0.4) | ns |
| 26 | Fast foods, e.g., potato chips, hamburgers, pizza, hot dogs | 0.1 (0.1) | 0.1 (0.0) | 0.1 (0.1) | 0.1 (0.0) | ns | 0.1 (0.23) | 0.1 (0.0) | 0.1 (0.20) | 0.1 (0.0) | ns |
| 27 | Fried foods (e.g., meat or flour-based foods such as dumplings and pancakes) | 0.3 (0.3) | 0.1 (0.4) | 0.3 (0.2) | 0.1 (0.4) | ns | 0.2 (0.26) | 0.1 (0.2) | 0.2 (0.2) | 0.1 (0.0) | 0.01 |
| 28 | Butter as a bread spread or as an addition to your meals (for frying, baking, etc). | 0.2 (0.3) | 0.1 (0.4) | 0.2 (0.35) | 0.1 (0.0) | ns | 0.4 (0.5) | 0.5 (0.4) | 0.4 (0.45) | 0.5 (0.4) | ns |
| 29 | Lard as a bread spread or as an addition to your meals (for frying, baking, etc). | 0.02 (0.10) | 0.0 (0.0) | 0.02 (0.09) | 0.0 (0.0) | ns | 0.1 (0.2) | 0.1 (0.1) | 0.1 (0.3) | 0.1 (0.1) | ns |
| 34 | Cheese (including processed cheese and blue cheese) | 0.5 (0.4) | 0.5 (0.4) | 0.5 (0.4) | 0.5 (0.4) | ns | 0.2 (0.3) | 0.1 (0.1) | 0.2 (0.34) | 0.1 (0.4) | ns |
| 35 | Cold meats, smoked sausages, and hot dogs | 0.4 (0.4) | 0.5 (0.4) | 0.4 (0.4) | 0.5 (0.4) | ns | 0.2 (0.2) | 0.1 (0.1) | 0.2 (0.21) | 0.1 (0.0) | ns |
| 36 | Red meats, e.g., pork, beef, veal, mutton, lamb, game | 0.2 (0.2) | 0.1 (0.1) | 0.2 (0.20) | 0.1 (0.1) | ns | 0.2 (0.3) | 0.1 (0.4) | 0.2 (0.2) | 0.1 (0.4) | ns |
| 44 | Sweets, e.g., confectionary, biscuits, cakes, chocolate bars, cereal bars | 0.6 (0.5) | 0.5 (0.4) | 0.6 (0.50) | 0.5 (0.4) | ns | 0.7 (0.6) | 0.5 (0.7) | 0.6 (0.7) | 0.5 (0.9) | ns |
| 46 | Tinned (jar) meats | 0.02 (0.1) | 0.0 (0.0) | 0.02 (0.1) | 0.0 (0.0) | ns | 0.0 (0.11) | 0.0 (0.1) | 0.1 (0.14) | 0.0 (0.1) | ns |
| 51 | Sweetened carbonated or still beverages, such as Coca-Cola, Pepsi, Sprite, Fanta, and lemonade | 0.2 (0.3) | 0.1 (0.0) | 0.2 (0.25) | 0.1 (0.0) | ns | 0.2 (0.37) | 0.1 (0.0) | 0.2 (0.4) | 0.1 (0.2) | ns |
| 52 | Energy drinks, such as Red Bull, Monster, Rockstar, or others | 0.1 (0.2) | 0.0 (0.1) | 0.1 (0.2) | 0.0 (0.1) | ns | 0.1 (0.19) | 0.0 (0.1) | 0.05 (0.13) | 0.00 (0.1) | ns |
| 54 | Alcoholic beverages | 0.2 (0.2) | 0.1 (0.0) | 0.1 (0.17) | 0.1 (0.0) | ns | 0.1 (0.20) | 0.1 (0.0) | 0.1 (0.2) | 0.1 (0.0) | ns |
| Pro-Healthy Diet Index (PHDI) (sum of frequency/day) | 4.4 (1.9) | 4.2 (2.5) | 4.2 (1.89) | 3.9 (2.5) | ns | 4.1 (1.94) | 3.9 (2.5) | 4.0 (2.0) | 3.7 (13.0) | ns | |
| Intensity of the characteristics N; % | Low | 223 | 99.1 | 224 | 99.6 | ns | 223 | 99.1 | 224 | 99.6 | ns |
| Moderate | 2 | 0.9 | 1 | 0.4 | 2 | 0.9 | 1 | 0.4 | |||
| Non-Healthy Diet Index (NHDI) (sum of frequency/day) | 3.6 (1.8) | 3.2 (2.1) | 3.4 (1.6) | 3.2 (2.1) | ns | 3.7 (1.5) | 3.3 (2.4) | 3.4 (1.77) | 3.2 (2.5) | ns | |
| Intensity of the characteristics N; % | Low | 198 | 88.0 | 204 | 90.7 | ns | 67 | 34.01 | 67 | 34.01 | ns |
| Moderate | 27 | 12.0 | 21 | 9.3 | 92 | 46.69 | 104 | 52.8 | |||
| High | 0 | 0.0 | 0 | 0.0 | 38 | 19.30 | 26 | 13.20 | |||
| Total-Diet Quality Index (points) | 9.2 (10.59) | 8.5 (13.1) | 8.8 (9.81) | 7.2 (13.2) | ns | 7.4 (10.98) | 6.0 (13.4) | 7.7 (11.19) | 6.4 (13.0) | ns | |
| Intensity of the characteristics N; % | Low intensity of non-healthy and healthy characteristics | 211 | 93.8 | 216 | 96.0 | ns | 9 | 4.6 | 13 | 6.61 | ns |
| High intensity of healthy characteristics | 14 | 6.2 | 9 | 4.0 | 188 | 95.4 | 184 | 93.4 | |||
| Question | Knowledge | Germany | p | Slovakia | p | ||||||
|---|---|---|---|---|---|---|---|---|---|---|---|
| Test | Retest | Test | Retest | ||||||||
| Correct | False | Correct | False | Correct | False | Correct | False | ||||
| 55 | It is enough to eat wholegrains/cereals once a day. | 8.7 | 91.3 | 12.0 | 88.0 | ns | 16.2 | 83.8 | 19.8 | 80.2 | ns |
| 56 | Only children and adolescents should drink milk. | 71.0 | 29.0 | 72.1 | 27.9 | ns | 81.2 | 18.8 | 83.2 | 16.8 | ns |
| 57 | Fruits and/or vegetables should be consumed with every meal. | 80.9 | 19.1 | 82.0 | 18.0 | ns | 66.5 | 66 33.5 | 138 70.1 | 59 29.9 | ns |
| 58 | Consumption of mouldy bread can result in food poisoning caused by Salmonella. | 49.7 | 50.3 | 48.6 | 51.4 | ns | 40.6 | 59.4 | 39.6 | 60.4 | ns |
| 59 | A high intake of salt protects against hypertension. | 82.0 | 18.0 | 76.0 | 24.0 | ns | 89.3 | 13.7 | 81.2 | 18.8 | ns |
| 60 | Limiting high-fat foods in everyday diet is protective against cardiovascular diseases. | 89.6 | 10.4 | 89.1 | 10.9 | ns | 88.3 | 11.7 | 84.3 | 15.7 | ns |
| 61 | Frequent consumption of oily fish contributes to atherosclerosis. | 16.9 | 83.1 | 21.9 | 78.1 | ns | 34.5 | 65.5 | 36.0 | 64.0 | ns |
| 62 | Frequent consumption of grilled meats contributes to the onset of cancer. | 46.4 | 53.6 | 50.3 | 78.1 | ns | 23.9 | 76.1 | 30.5 | 69.5 | 0.05 |
| 63 | A vegetarian diet increases the risk of anaemia. | 16.9 | 83.1 | 18.0 | 82.0 | ns | 66.0 | 34.0 | 71.1 | 28.9 | ns |
| 64 | Bio-yoghurts contain beneficial gut bacteria. | 57.4 | 42.6 | 61.2 | 38.8 | ns | 61.9 | 38.1 | 64.5 | 35.5 | ns |
| 65 | Vegetable oils and olive oil contain a high amount of cholesterol. | 26.8 | 73.2 | 22.4 | 77.6 | ns | 34.0 | 66.0 | 28.9 | 71.1 | ns |
| 66 | Wholemeal bread has more fibre than white bread. | 84.7 | 15.3 | 80.3 | 19.7 | ns | 77.7 | 22.3 | 72.6 | 27.4 | ns |
| 67 | Fruits and vegetables are a source of ‘empty calories’. | 55.2 | 44.8 | 43.7 | 56.3 | 0.01 | 37.6 | 62.4 | 28.9 | 71.1 | 0.05 |
| 68 | Butter and fortified margarines have a high content of vitamins A and D. | 16.4 | 83.6 | 19.7 | 80.3 | ns | 29.9 | 70.1 | 34.0 | 66.0 | ns |
| 69 | Cheese is a better source of calcium than cottage cheese. | 25.7 | 74.3 | 24.6 | 75.4 | ns | 13.7 | 86.3 | 17.8 | 82.2 | ns |
| 70 | Offal has high amounts of ‘bad’ cholesterol—LDL. | 12.6 | 87.4 | 10.9 | 89.1 | ns | 18.3 | 86.7 | 20.3 | 79.7 | ns |
| 71 | In a healthy diet, complex carbohydrates should be replaced with simple sugars. | 61.7 | 38.3 | 54.6 | 45.4 | ns | 23.4 | 76.6 | 15.7 | 84.3 | 0.01 |
| 72 | In a balanced diet, proteins should be the main source of energy. | 26.2 | 73.8 | 27.3 | 72.7 | ns | 14.2 | 85.8 | 16.8 | 83.2 | ns |
| 73 | Inadequate intakes of vitamin PP can cause skin inflammation and diarrhoea. | 25.1 | 74.9 | 28.4 | 71.6 | ns | 25.9 | 71.1 | 27.9 | 72.1 | ns |
| 74 | Sun exposure increases the synthesis of vitamin D in the human body. | 95.1 | 4.9 | 88.0 | 12.0 | 0.001 | 90.4 | 9.6 | 83.2 | 16.8 | 0.01 |
| 75 | Phosphorus is a component of the neural tissue. | 28.4 | 71.6 | 37.2 | 62.8 | 0.05 | 31.0 | 69.0 | 35.0 | 65.0 | ns |
| 76 | The ratio of calcium to phosphorus in a healthy diet should be 1:1. | 8.2 | 91.8 | 8.7 | 91.3 | ns | 42.6 | 57.4 | 35.5 | 64.5 | 0.01 |
| 77 | Consumption of fruits with a high content of vitamin C increases the bioavailability of iron. | 58.5 | 41.5 | 57.9 | 42.1 | ns | 49.7 | 50.3 | 50.3 | 49.7 | ns |
| 78 | Starting the cooking of vegetables in cold water helps to preserve the nutrients. | 32.2 | 67.8 | 25.7 | 74.3 | ns | 24.9 | 79.7 | 16.8 | 83.2 | ns |
| 79 | Sweets and animal fats are particularly high nutrient-dense foods. | 47.0 | 53.0 | 43.2 | 56.8 | ns | 24.9 | 75.1 | 22.3 | 77.7 | ns |
| Sum of nutritional knowledge: M(SD) and Me(IQR) | 11.23 (3.18) | 11.0 (4.0) | 11.04 (3.52) | 11.0 (4.0) | ns | 10.99 (3.24) | 11.0 (4.0) | 10.86 (3.52) | 11.0 (5.0) | ns | |
| Question | No. of Categories | Slovakia | Germany | ||
|---|---|---|---|---|---|
| Consistency (%) (the Same Category) | Kappa | Consistency (%) (the Same Category) | Kappa | ||
| Dietary habits | |||||
| Number of meals | 5 | 80.31 | 0.72 | 72.97 | 0.53 |
| Consume meals at regular times | 3 | 78.87 | 0.61 | 72.65 | 0.53 |
| Snacking between meals | 6 | 58.55 | 0.47 | 48.89 | 0.32 |
| Fruits | 2 | 85.57 | 0.58 | 86.67 | 0.51 |
| Vegetables | 2 | 74.74 | 0.50 | 73.78 | 0.48 |
| Unsweetened dairy beverages and desserts | 2 | 80.93 | 0.58 | 71.56 | 0.37 |
| Sweetened dairy beverages and desserts | 2 | 78.87 | 0.45 | 82.67 | 0.43 |
| Sweet snacks | 2 | 85.05 | 0.60 | 78.22 | 0.51 |
| Savoury snacks | 2 | 88.66 | 0.66 | 79.11 | 0.58 |
| Nuts, almonds, and seeds | 2 | 89.18 | 0.73 | 73.78 | 0.48 |
| Type of milk | 3 | 89.01 | 0.78 | 89.53 | 0.80 |
| Prepared meat: boiled | 2 | 89.19 | 0.69 | 80.27 | 0.54 |
| Prepared meat: stewed | 2 | 86.53 | 0.70 | 92.83 | 0.46 |
| Prepared meat: grilled | 2 | 88.14 | 0.74 | 77.58 | 0.54 |
| Prepared meat: roasted | 2 | 91.75 | 0.81 | 76.58 | 0.44 |
| Prepared meat: fried | 2 | 89.18 | 0.77 | 89.19 | 0.68 |
| I don’t eat meat | 2 | 98.45 | 0.66 | 97.31 | 0.90 |
| Fat for spreading | 7 | 89.64 | 0.75 | 63.94 | 0.50 |
| Fat for frying | 6 | 89.12 | 0.77 | 77.00 | 0.57 |
| Sweetened hot beverages | 4 | 93.88 | 0.91 | 86.61 | 0.66 |
| Adding salt to ready meals | 3 | 88.72 | 0.80 | 79.91 | 0.56 |
| Type of water usually drink: I don’t drink water | 2 | 99.45 | 0.80 | 89.78 | 0.50 |
| Type of water usually drink: still water | 2 | 93.88 | 0.86 | 92.89 | 0.79 |
| Type of water usually drink: sparkling water | 2 | 88.27 | 0.73 | 89.78 | 0.78 |
| Type of water usually drink: flavoured water | 2 | 88.76 | 0.72 | 92.00 | 0.63 |
| Food frequency—items not included in the nutritional indexes | |||||
| Vegetable oils, margarines, or mixes of butter and margarine as a bread spread | 6 | 55.84 | 0.41 | 46.67 | 0.27 |
| Eggs | 6 | 71.07 | 0.61 | 60.89 | 0.47 |
| Potato | 6 | 70.56 | 0.52 | 57.78 | 0.40 |
| Instant soups or ready-made soups | 6 | 68.02 | 0.56 | 65.33 | 0.45 |
| Tinned (jar) vegetables | 6 | 66.50 | 0.46 | 57.33 | 0.34 |
| Fruit juices | 6 | 64.47 | 0.52 | 57.78 | 0.41 |
| Vegetable juices or fruit and vegetable juices | 6 | 60.91 | 0.46 | 60.44 | 0.37 |
| Sweetened hot beverages | 6 | 52.79 | 0.41 | 46.22 | 0.31 |
| Water | 6 | 73.10 | 0.53 | 88.00 | 0.48 |
| Lifestyle | |||||
| Eating out | 6 | 73.80 | 0.63 | 62.39 | 0.41 |
| Type of alcohol usually drink | 5 | 96.82 | 0.94 | 83.14 | 0.76 |
| Currently smoke | 2 | 97.44 | 0.93 | 91.44 | 0.73 |
| Smoke in the past | 2 | 94.30 | 0.88 | 87.89 | 0.74 |
| Sleep a day during weekdays | 3 | 90.10 | 0.83 | 82.88 | 0.55 |
| Sleep a day during weekends | 3 | 87.11 | 0.78 | 79.37 | 0.61 |
| Screen time | 5 | 76.41 | 0.68 | 51.35 | 0.34 |
| Physical activity in school/work | 4 | 85.42 | 0.71 | 68.02 | 0.40 |
| Physical activity in leisure time | 3 | 85.94 | 0.71 | 72.65 | 0.52 |
| Health status in comparison to other people your age | 3 | 89.64 | 0.77 | 78.03 | 0.49 |
| Knowledge about nutrition | 4 | 79.17 | 0.68 | 71.75 | 0.57 |
| Description of diet | 4 | 91.19 | 0.82 | 82.35 | 0.61 |
| Differences between diet during weekdays compared to weekends | 3 | 72.77 | 0.56 | 63.34 | 0.31 |
| Food frequencies—items included in the nutritional indexes | |||||
| Wholemeal (brown) bread/bread rolls | 6 | 62.76 | 0.53 | 55.11 | 0.71 |
| Buckwheat, oats, and wholegrain pasta | 6 | 69.90 | 0.61 | 56.44 | 0.44 |
| Milk | 6 | 64.80 | 0.54 | 58.67 | 0.69 |
| Fermented milk beverages | 6 | 58.67 | 0.45 | 50.22 | 0.69 |
| Fresh cheese curd products | 6 | 70.92 | 0.58 | 56.00 | 0.41 |
| White meat | 6 | 70.92 | 0.56 | 62.67 | 0.50 |
| Fish | 6 | 76.02 | 0.63 | 72.00 | 0.51 |
| Pulse-based foods | 6 | 75.00 | 0.60 | 51.56 | 0.32 |
| Fruits | 6 | 66.33 | 0.54 | 58.22 | 0.42 |
| Vegetables | 6 | 66.84 | 0.54 | 56.89 | 0.40 |
| White bread and bakery products | 6 | 64.28 | 0.54 | 49.78 | 0.32 |
| White rice, white pasta, and fine-ground groats | 6 | 67.34 | 0.54 | 56.44 | 0.59 |
| Fast foods | 6 | 73.98 | 0.53 | 66.22 | 0.28 |
| Fried foods | 6 | 68.37 | 0.54 | 51.11 | 0.27 |
| Butter | 6 | 58.16 | 0.46 | 45.33 | 0.28 |
| Lard | 6 | 62.24 | 0.46 | 82.22 | 0.37 |
| Cheese | 6 | 60.20 | 0.47 | 52.44 | 0.60 |
| Cold meats, smoked sausages, and hot dogs | 6 | 67.35 | 0.53 | 64.44 | 0.53 |
| Red meat | 6 | 68.88 | 0.57 | 64.00 | 0.52 |
| Sweets | 6 | 67.86 | 0.57 | 51.11 | 0.51 |
| Tinned (jar) meats | 6 | 81.12 | 0.59 | 80.44 | 0.42 |
| Sweetened carbonated or still beverages | 6 | 67.35 | 0.56 | 65.33 | 0.51 |
| Energy drinks | 6 | 89.80 | 0.80 | 77.33 | 0.66 |
| Alcohol | 6 | 83.16 | 0.71 | 68.00 | 0.53 |
| PHDI 1 | 3 | 91.33 | 0.60 | 88.45 | 0.41 |
| NHDI 2 | 3 | 95.45 | 0.59 | 99.55 | 0.66 |
| DQI 3 | 3 | 95.92 | 0.62 | 94.22 | 0.41 |
| Nutritional beliefs | |||||
| Only children and adolescents should drink milk. | 3 | 70.05 | 0.42 | 67.21 | 0.31 |
| Fruits and/or vegetables should be consumed with every meal. | 3 | 94.42 | 0.82 | 74.86 | 0.44 |
| Consumption of mouldy bread can result in food poisoning caused by Salmonella. | 3 | 79.70 | 0.59 | 80.33 | 0.38 |
| A high intake of salt protects against hypertension. | 3 | 77.66 | 0.66 | 66.12 | 0.46 |
| Limiting high-fat foods in everyday diet is protective against cardiovascular diseases. | 3 | 84.26 | 0.50 | 77.60 | 0.36 |
| Frequent consumption of oily fish contributes to atherosclerosis. | 3 | 84.71 | 0.38 | 84.70 | 0.21 |
| Frequent consumption of grilled meats contributes to the onset of cancer. | 3 | 69.54 | 0.51 | 66.67 | 0.42 |
| A vegetarian diet increases the risk of anaemia. | 3 | 68.53 | 0.52 | 69.40 | 0.51 |
| Bio-yoghurts contain beneficial gut bacteria. | 3 | 82.23 | 0.63 | 63.93 | 0.41 |
| Vegetable oils and olive oil contain a high amount of cholesterol. | 3 | 73.60 | 0.50 | 67.21 | 0.40 |
| Wholemeal bread has more fibre than white bread. | 3 | 67.00 | 0.50 | 57.38 | 0.29 |
| Fruits and vegetables are a source of ‘empty calories’. | 3 | 77.66 | 0.44 | 78.69 | 0.30 |
| Butter and fortified margarines have a high content of vitamins A and D. | 3 | 71.57 | 0.57 | 56.28 | 0.31 |
| Cheese is a better source of calcium than cottage cheese. | 3 | 86.80 | 0.80 | 55.74 | 0.28 |
| Offal has high amounts of ‘bad’ cholesterol—LDL. | 3 | 72.59 | 0.50 | 60.11 | 0.36 |
| In a healthy diet, complex carbohydrates should be replaced with simple sugars. | 3 | 72.59 | 0.55 | 73.22 | 0.42 |
| In a balanced diet, proteins should be the main source of energy. | 3 | 72.08 | 0.56 | 68.85 | 0.45 |
| Inadequate intakes of vitamin PP can cause skin inflammation and diarrhoea. | 3 | 82.74 | 0.61 | 60.11 | 0.36 |
| Sun exposure increases the synthesis of vitamin D in the human body. | 3 | 77.66 | 0.61 | 68.85 | 0.38 |
| Phosphorus is a component of the neural tissue. | 3 | 87.82 | 0.49 | 89.07 | 0.34 |
| The ratio of calcium to phosphorus in a healthy diet should be 1:1. | 3 | 73.09 | 0.54 | 63.39 | 0.38 |
| Consumption of fruits with a high content of vitamin C increases the bioavailability of iron. | 3 | 73.60 | 0.53 | 79.23 | 0.39 |
| Starting the cooking of vegetables in cold water helps to preserve the nutrients. | 3 | 70.56 | 0.50 | 63.39 | 0.32 |
| Only children and adolescents should drink milk. | 3 | 72.59 | 0.57 | 58.47 | 0.37 |
| Sweets and animal fats are particularly high nutrient dense foods. | 3 | 69.03 | 0.52 | 66.12 | 0.45 |
| Level of nutritional knowledge | 3 | 78.17 | 0.48 | 75.96 | 0.43 |
Publisher’s Note: MDPI stays neutral with regard to jurisdictional claims in published maps and institutional affiliations. |
© 2022 by the authors. Licensee MDPI, Basel, Switzerland. This article is an open access article distributed under the terms and conditions of the Creative Commons Attribution (CC BY) license (https://creativecommons.org/licenses/by/4.0/).
Share and Cite
Cieśla, E.; Suliga, E.; Kadučáková, H.; Michel, S.; Ižová, M.; Simočková, V.; Martin, T.; Braun, A.; Kozieł, D.; Głuszek, S. Reproducibility of the German and Slovakian Versions of the Dietary Habits and Nutrition Beliefs Questionnaire (KomPAN). Nutrients 2022, 14, 4893. https://doi.org/10.3390/nu14224893
Cieśla E, Suliga E, Kadučáková H, Michel S, Ižová M, Simočková V, Martin T, Braun A, Kozieł D, Głuszek S. Reproducibility of the German and Slovakian Versions of the Dietary Habits and Nutrition Beliefs Questionnaire (KomPAN). Nutrients. 2022; 14(22):4893. https://doi.org/10.3390/nu14224893
Chicago/Turabian StyleCieśla, Elżbieta, Edyta Suliga, Helena Kadučáková, Sven Michel, Marcela Ižová, Viera Simočková, Titus Martin, Alexander Braun, Dorota Kozieł, and Stanisław Głuszek. 2022. "Reproducibility of the German and Slovakian Versions of the Dietary Habits and Nutrition Beliefs Questionnaire (KomPAN)" Nutrients 14, no. 22: 4893. https://doi.org/10.3390/nu14224893
APA StyleCieśla, E., Suliga, E., Kadučáková, H., Michel, S., Ižová, M., Simočková, V., Martin, T., Braun, A., Kozieł, D., & Głuszek, S. (2022). Reproducibility of the German and Slovakian Versions of the Dietary Habits and Nutrition Beliefs Questionnaire (KomPAN). Nutrients, 14(22), 4893. https://doi.org/10.3390/nu14224893