
The Relationship between Alternative Healthy Diet Index and Cognitive Function in the Older Adults: The Mediating Effect of Depressive Symptoms


Abstract
:1. Introduction
2. Materials and Methods
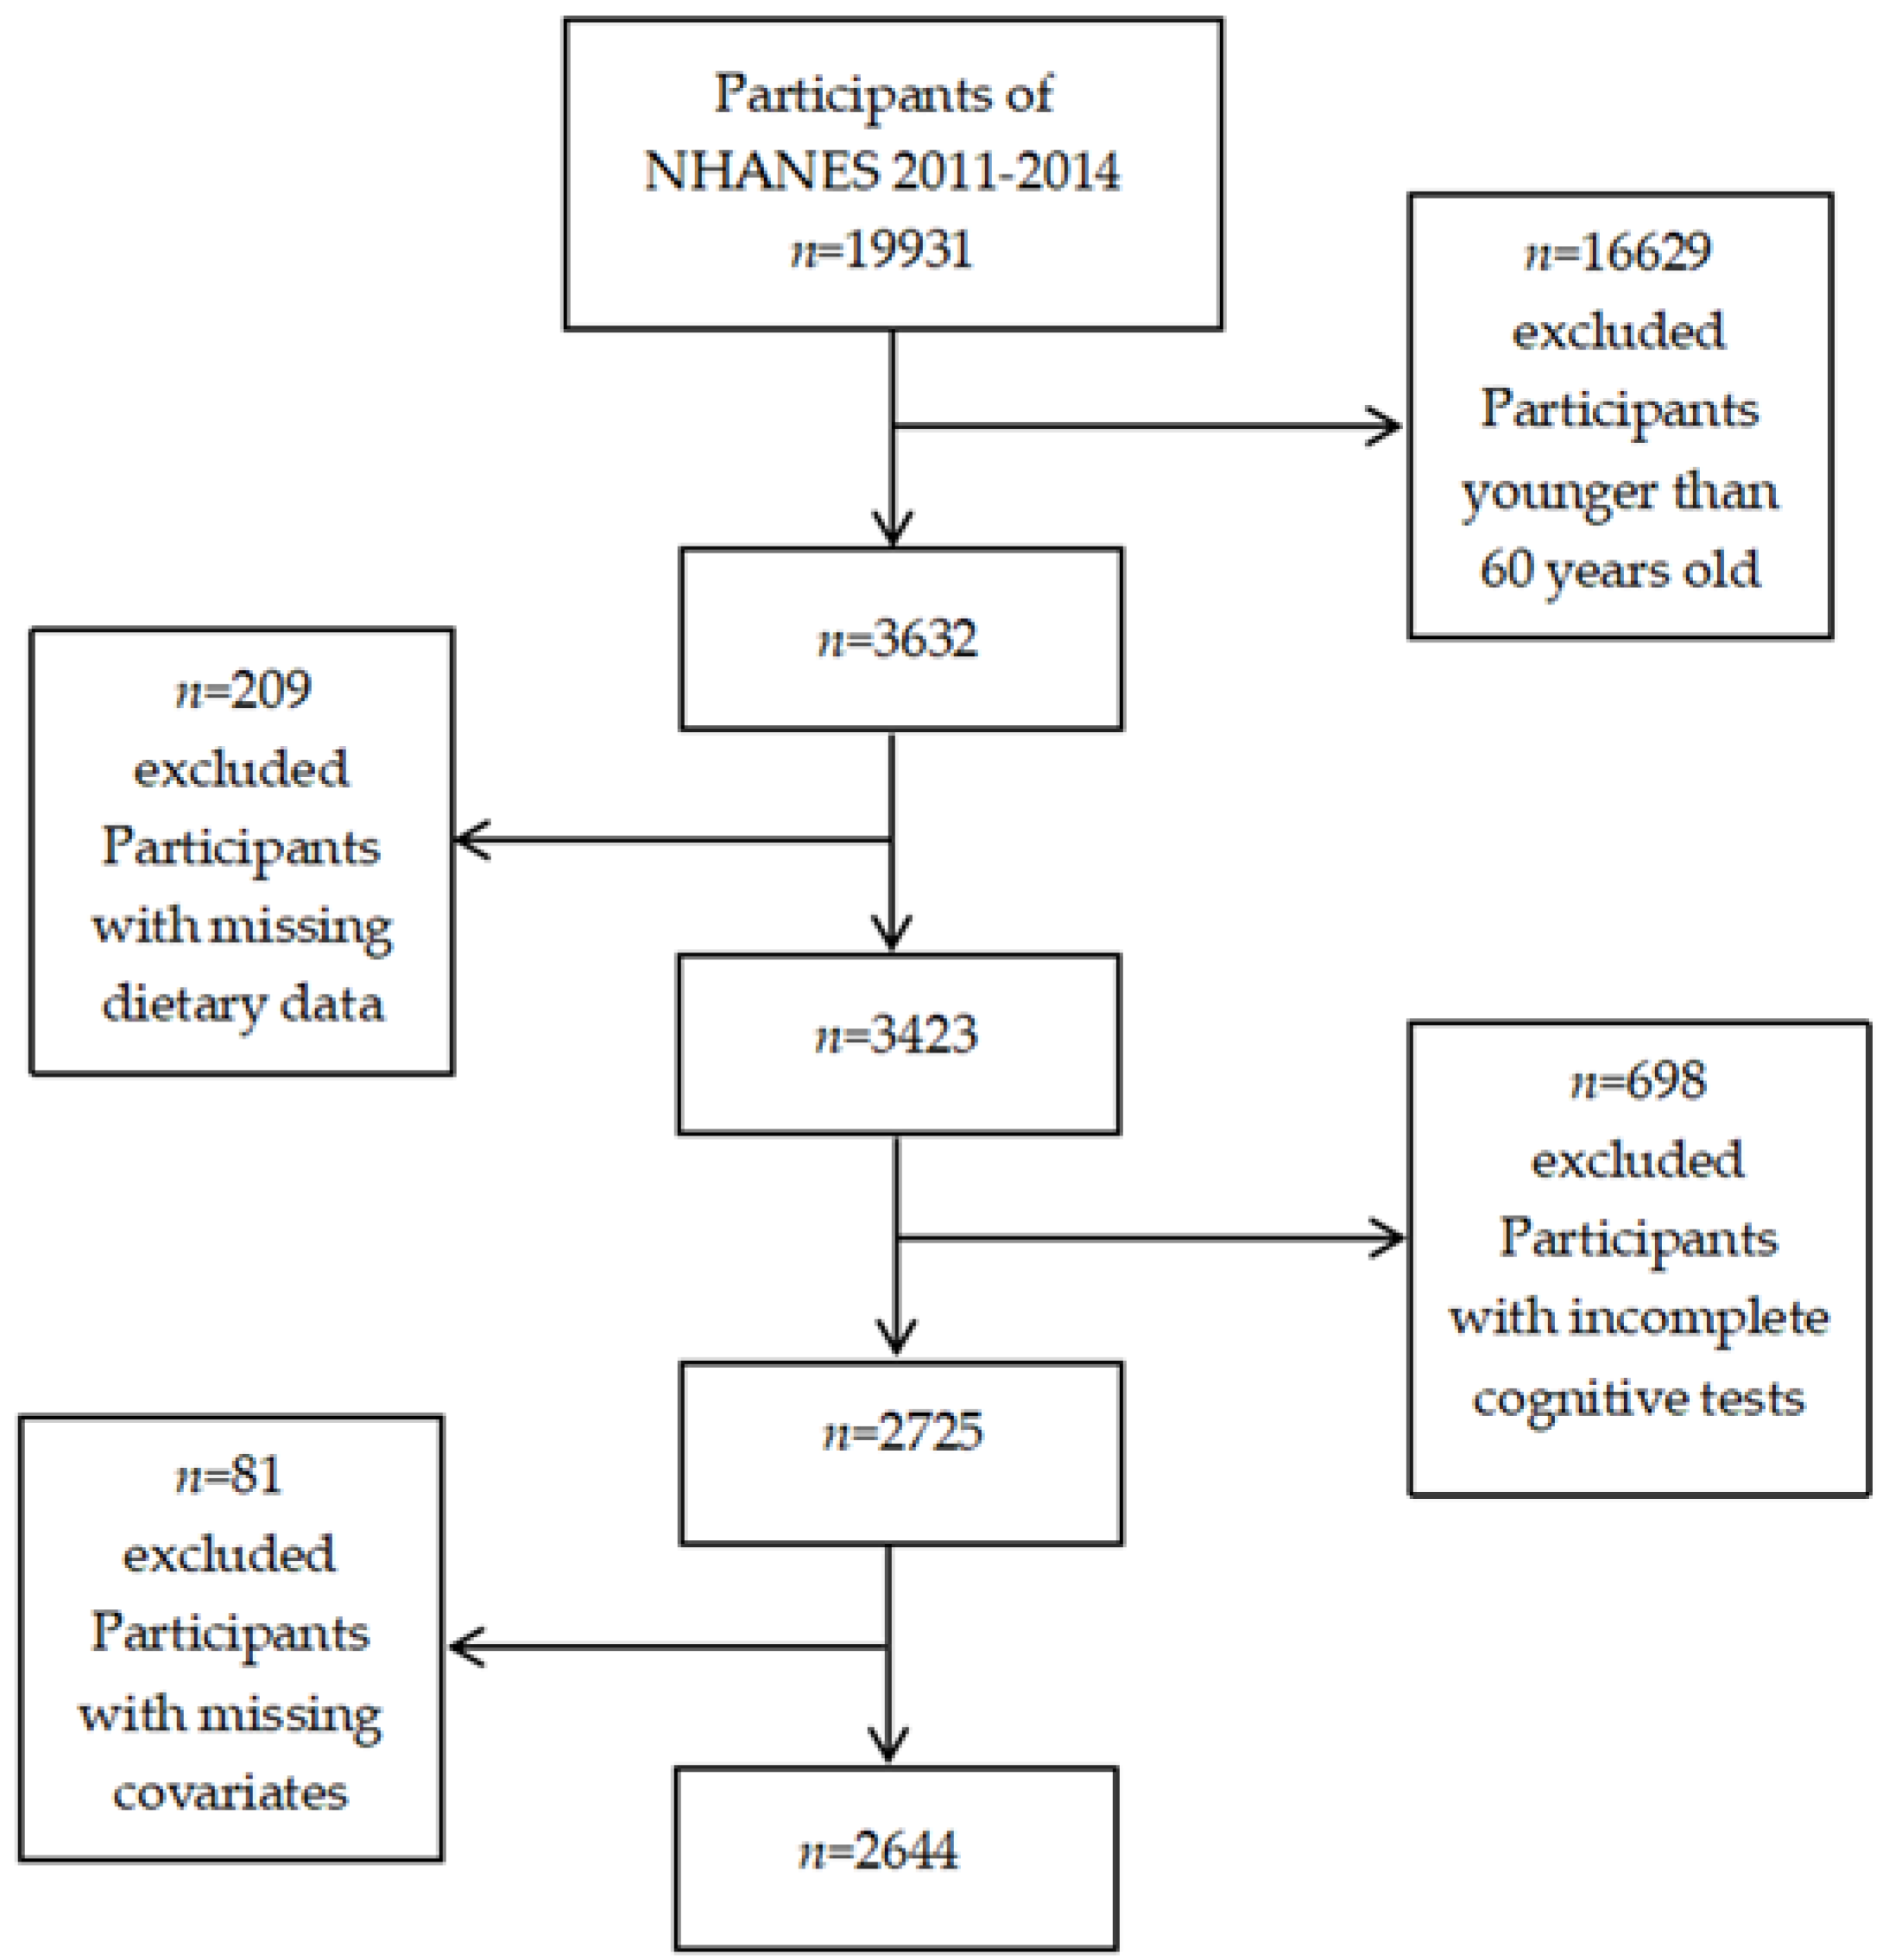
2.1. Study Population
2.2. AHEI-2010
2.3. Cognitive Function
2.4. Depressive Symptoms
2.5. Covariates
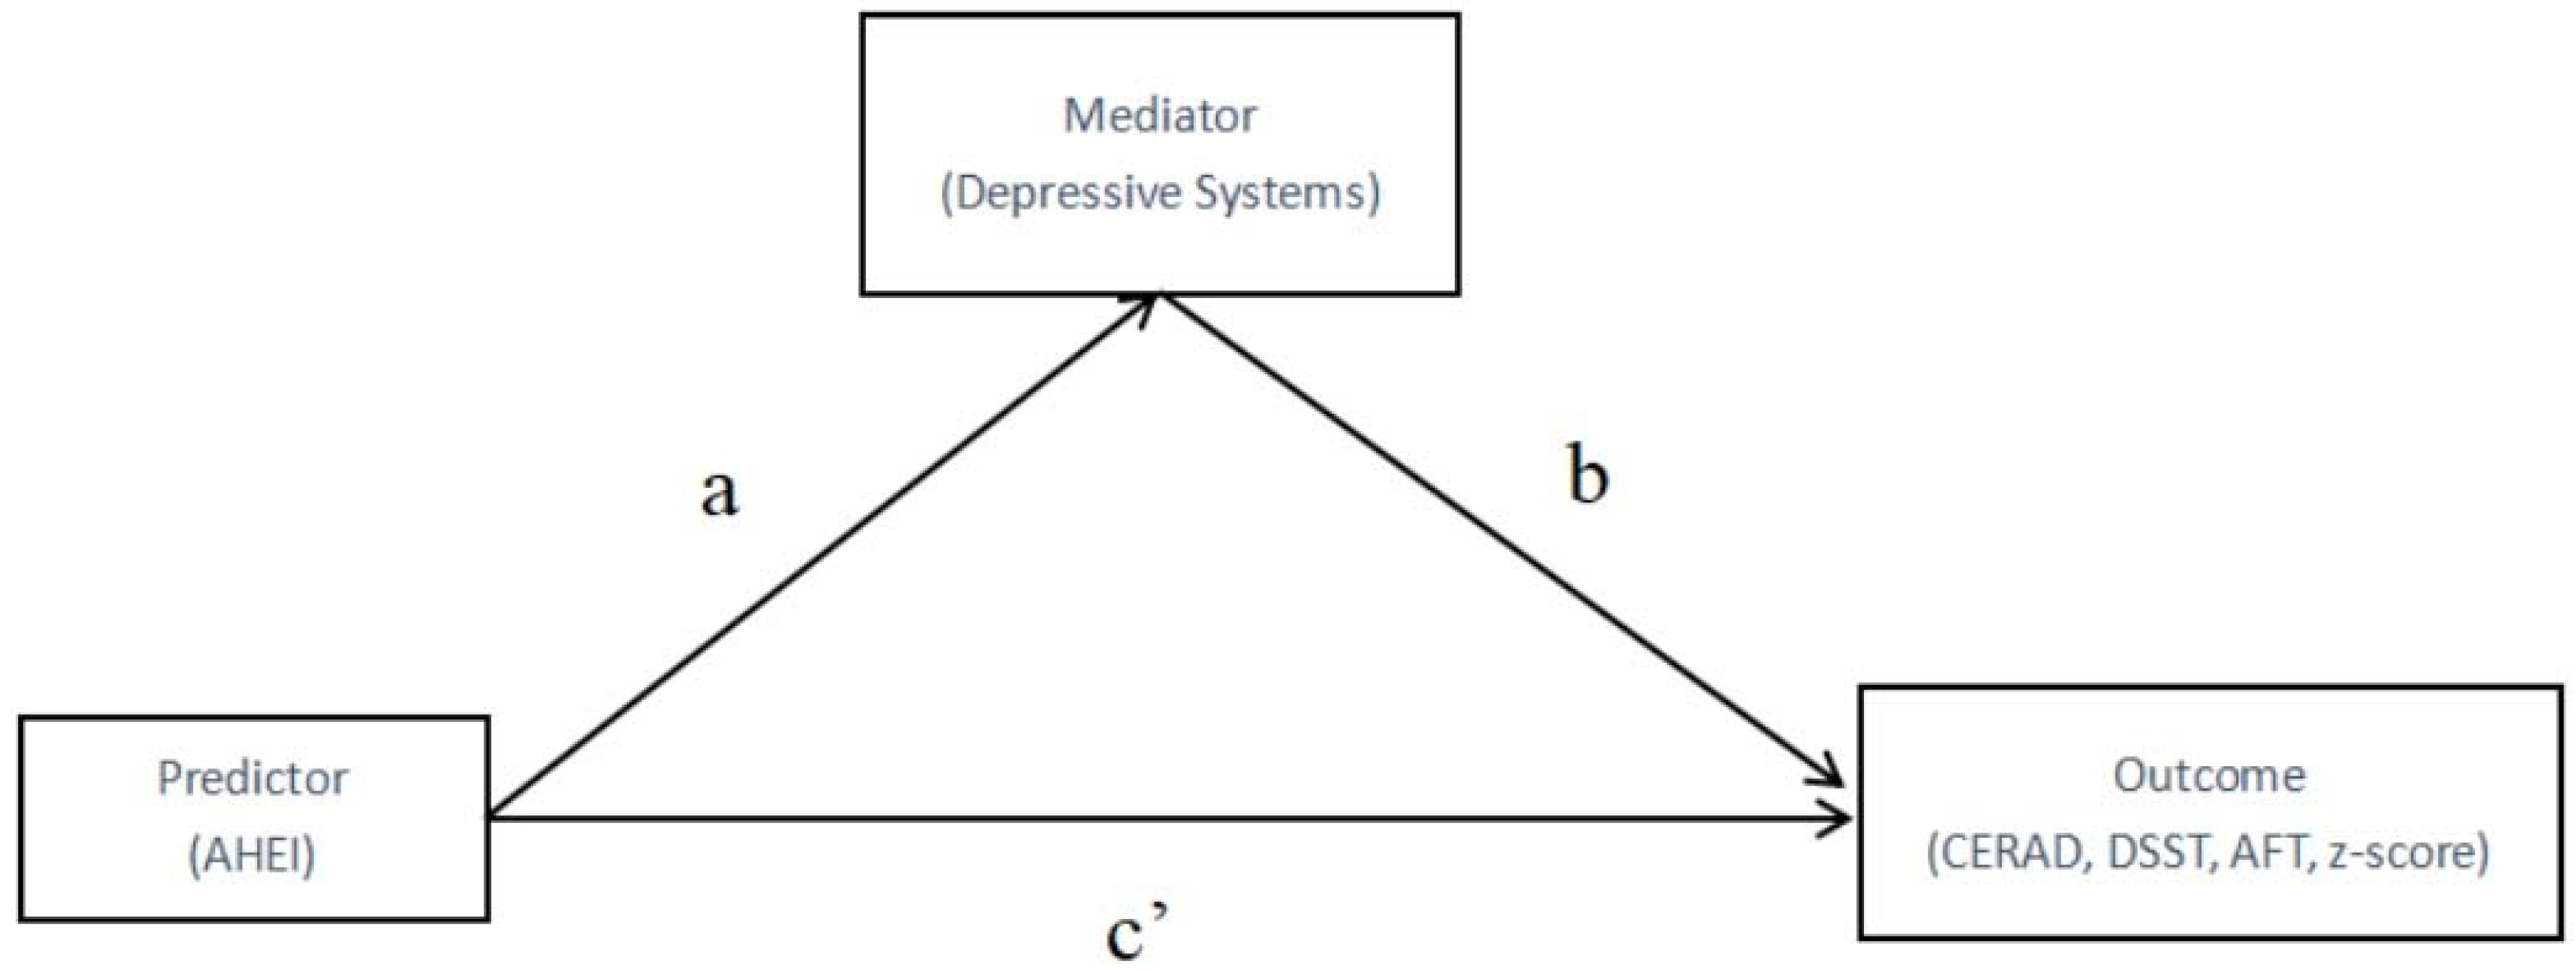
2.6. Statistical Analysis
3. Results
4. Discussion
5. Conclusions
Author Contributions
Funding
Institutional Review Board Statement
Informed Consent Statement
Data Availability Statement
Acknowledgments
Conflicts of Interest
References
- Davies, R. Cognitive decline: Can diet be a preventive or treatment option? Nurs. Older People 2019, 31, 26–30. [Google Scholar] [CrossRef] [PubMed]
- Ballard, C.; Gauthier, S.; Corbett, A.; Brayne, C.; Aarsland, D.; Jones, E. Alzheimer’s disease. Lancet 2011, 377, 1019–1031. [Google Scholar] [CrossRef]
- Querfurth, H.W.; LaFerla, F.M. Alzheimer’s disease. N. Engl. J. Med. 2010, 362, 329–344. [Google Scholar] [CrossRef] [Green Version]
- Mudher, A.; Lovestone, S. Alzheimer’s disease-do tauists and baptists finally shake hands? Trends Neurosci. 2002, 25, 22–26. [Google Scholar] [CrossRef]
- Alles, B.; Samieri, C.; Feart, C.; Jutand, M.A.; Laurin, D.; Barberger-Gateau, P. Dietary patterns: A novel approach to examine the link between nutrition and cognitive function in older individuals. Nutr. Res. Rev. 2012, 25, 207–222. [Google Scholar] [CrossRef] [Green Version]
- Hu, F.B. Dietary pattern analysis: A new direction in nutritional epidemiology. Curr. Opin. Lipidol. 2002, 13, 3–9. [Google Scholar] [CrossRef]
- van de Rest, O.; Berendsen, A.A.; Haveman-Nies, A.; de Groot, L.C. Dietary patterns, cognitive decline, and dementia: A systematic review. Adv. Nutr. 2015, 6, 154–168. [Google Scholar] [CrossRef]
- McCullough, M.L.; Feskanich, D.; Stampfer, M.J.; Giovannucci, E.L.; Rimm, E.B.; Hu, F.B.; Spiegelman, D.; Hunter, D.J.; Colditz, G.A.; Willett, W.C. Diet quality and major chronic disease risk in men and women: Moving toward improved dietary guidance. Am. J. Clin. Nutr. 2002, 76, 1261–1271. [Google Scholar] [CrossRef] [Green Version]
- Estrella, M.L.; Durazo-Arvizu, R.A.; Mattei, J.; Mossavar-Rahmani, Y.; Perreira, K.M.; Siega-Riz, A.M.; Sotres-Alvarez, D.; González, H.M.; Gallo, L.C.; Daviglus, M.L.; et al. Alternate Healthy Eating Index is Positively Associated with Cognitive Function Among Middle-Aged and Older Hispanics/Latinos in the HCHS/SOL. J. Nutr. 2020, 150, 1478–1487. [Google Scholar] [CrossRef]
- Wu, J.; Song, X.; Chen, G.C.; Neelakantan, N.; van Dam, R.M.; Feng, L.; Yuan, J.M.; Pan, A.; Koh, W.P. Dietary pattern in midlife and cognitive impairment in late life: A prospective study in Chinese adults. Am. J. Clin. Nutr. 2019, 110, 912–920. [Google Scholar] [CrossRef] [Green Version]
- Appelhans, B.M.; Whited, M.C.; Schneider, K.L.; Ma, Y.; Oleski, J.L.; Merriam, P.A.; Waring, M.E.; Olendzki, B.C.; Mann, D.M.; Ockene, I.S.; et al. Depression severity, diet quality, and physical activity in women with obesity and depression. J. Acad. Nutr. Diet. 2012, 112, 693–698. [Google Scholar] [CrossRef] [PubMed] [Green Version]
- Lai, J.S.; Hure, A.J.; Oldmeadow, C.; McEvoy, M.; Byles, J.; Attia, J. Prospective study on the association between diet quality and depression in mid-aged women over 9 years. Eur. J. Nutr. 2017, 56, 273–281. [Google Scholar] [CrossRef] [PubMed]
- Francis, H.M.; Stevenson, R.J.; Chambers, J.R.; Gupta, D.; Newey, B.; Lim, C.K. A brief diet intervention can reduce symptoms of depression in young adults—A randomised controlled trial. PLoS ONE 2019, 14, e222768. [Google Scholar] [CrossRef] [PubMed]
- Martinez-Gonazlez, M.A.; Sanchez-Villegas, A. Food patterns and the prevention of depression. Proc. Nutr. Soc. 2016, 75, 139–146. [Google Scholar] [CrossRef] [PubMed] [Green Version]
- Bunce, D.; Batterham, P.J.; Christensen, H.; Mackinnon, A.J. Causal associations between depression symptoms and cognition in a community-based cohort of older adults. Am. J. Geriatr. Psychiatry 2014, 22, 1583–1591. [Google Scholar] [CrossRef] [Green Version]
- Wu, Z.; Zhong, X.; Peng, Q.; Chen, B.; Zhang, M.; Zhou, H.; Mai, N.; Huang, X.; Ning, Y. Longitudinal Association Between Cognition and Depression in Patients With Late-Life Depression: A Cross-Lagged Design Study. Front. Psychiatry 2021, 12, 577058. [Google Scholar] [CrossRef]
- Desai, R.; Charlesworth, G.M.; Brooker, H.J.; Potts, H.W.; Corbett, A.; Aarsland, D.; Ballard, C.G. Temporal Relationship between Depressive Symptoms and Cognition in Mid and Late Life: A Longitudinal Cohort Study. J. Am. Med. Dir. Assoc. 2020, 21, 1108–1113. [Google Scholar] [CrossRef]
- Jorm, A.F. Is depression a risk factor for dementia or cognitive decline? A review. Gerontology 2000, 46, 219–227. [Google Scholar] [CrossRef]
- Chiuve, S.E.; Fung, T.T.; Rimm, E.B.; Hu, F.B.; McCullough, M.L.; Wang, M.; Stampfer, M.J.; Willett, W.C. Alternative Dietary Indices Both Strongly Predict Risk of Chronic Disease. J. Nutr. 2012, 142, 1009–1018. [Google Scholar] [CrossRef] [Green Version]
- WHO. Obesity: Preventing and managing the global epidemic. In Report of a WHO Consultation; WHO: Geneva, Switzerland, 2000; Volume 1, p. 253. [Google Scholar]
- Breen, R.; Karlson, K.B.; Holm, A. Total, Direct, and Indirect Effects in Logit and Probit Models. Sociol. Method Res. 2013, 42, 164–191. [Google Scholar] [CrossRef]
- Smyth, A.; Dehghan, M.; O’Donnell, M.; Anderson, C.; Teo, K.; Gao, P.; Sleight, P.; Dagenais, G.; Probstfield, J.L.; Mente, A.; et al. Healthy eating and reduced risk of cognitive decline: A cohort from 40 countries. Neurology 2015, 84, 2258–2265. [Google Scholar] [CrossRef] [PubMed] [Green Version]
- Munoz-Garcia, M.I.; Toledo, E.; Razquin, C.; Dominguez, L.J.; Maragarone, D.; Martinez-Gonzalez, J.; Martinez-Gonzalez, M.A. “A priori” Dietary Patterns and Cognitive Function in the SUN Project. Neuroepidemiology 2020, 54, 45–57. [Google Scholar] [CrossRef] [PubMed]
- Hu, D.; Cheng, L.; Jiang, W. Sugar-sweetened beverages consumption and the risk of depression: A meta-analysis of observational studies. J. Affect. Disord. 2019, 245, 348–355. [Google Scholar] [CrossRef]
- Nucci, D.; Fatigoni, C.; Amerio, A.; Odone, A.; Gianfredi, V. Red and Processed Meat Consumption and Risk of Depression: A Systematic Review and Meta-Analysis. Int. J. Environ. Res. Public Health 2020, 17, 6686. [Google Scholar] [CrossRef]
- Bear, T.L.K.; Dalziel, J.E.; Coad, J.; Roy, N.C.; Butts, C.A.; Gopal, P.K. The Role of the Gut Microbiota in Dietary Interventions for Depression and Anxiety. Adv. Nutr. 2020, 11, 890–907. [Google Scholar] [CrossRef] [Green Version]
- Filippini, T.; Malavolti, M.; Whelton, P.K.; Vinceti, M. Sodium Intake and Risk of Hypertension: A Systematic Review and Dose-Response Meta-analysis of Observational Cohort Studies. Curr. Hypertens. Rep. 2022, 24, 133–144. [Google Scholar] [CrossRef]
- Ginty, A.T.; Carroll, D.; Roseboom, T.J.; Phillips, A.C.; de Rooij, S.R. Depression and anxiety are associated with a diagnosis of hypertension 5 years later in a cohort of late middle-aged men and women. J. Hum. Hypertens. 2013, 27, 187–190. [Google Scholar] [CrossRef] [PubMed]
- Abildgaard, A.; Lund, S.; Hougaard, K.S. Chronic high-fat diet increases acute neuroendocrine stress response independently of prenatal dexamethasone treatment in male rats. Acta Neuropsychiatr 2014, 26, 8–18. [Google Scholar] [CrossRef]
- Dash, S.; Clarke, G.; Berk, M.; Jacka, F.N. The gut microbiome and diet in psychiatry: Focus on depression. Curr. Opin. Psychiatry 2015, 28, 1–6. [Google Scholar] [CrossRef]
- Fuhrmann, D.; Knoll, L.J.; Blakemore, S. Adolescence as a Sensitive Period of Brain Development. Trends Cogn. Sci. 2015, 19, 558–566. [Google Scholar] [CrossRef] [Green Version]
- Molendijk, M.; Molero, P.; Ortuno, S.F.; Van der Does, W.; Angel, M.M. Diet quality and depression risk: A systematic review and dose-response meta-analysis of prospective studies. J. Affect. Disord. 2018, 226, 346–354. [Google Scholar] [CrossRef] [PubMed] [Green Version]
- Glabska, D.; Guzek, D.; Groele, B.; Gutkowska, K. Fruit and Vegetable Intake and Mental Health in Adults: A Systematic Review. Nutrients 2020, 12, 115. [Google Scholar] [CrossRef] [Green Version]
- Liu, X.; Yan, Y.; Li, F.; Zhang, D. Fruit and vegetable consumption and the risk of depression: A meta-analysis. Nutrition 2016, 32, 296–302. [Google Scholar] [CrossRef] [PubMed]
- Betteridge, D.J. What is oxidative stress? Metabolism 2000, 49 (Suppl. 1), 3–8. [Google Scholar] [CrossRef]
- Birben, E.; Sahiner, U.M.; Sackesen, C.; Erzurum, S.; Kalayci, O. Oxidative stress and antioxidant defense. World Allergy Organ. J. 2012, 5, 9–19. [Google Scholar] [CrossRef] [PubMed] [Green Version]
- Burton, G.J.; Jauniaux, E. Oxidative stress. Best Pract. Res. Clin. Obstet. Gynaecol. 2011, 25, 287–299. [Google Scholar] [CrossRef] [Green Version]
- Saghafian, F.; Malmir, H.; Saneei, P.; Milajerdi, A.; Larijani, B.; Esmaillzadeh, A. Fruit and vegetable consumption and risk of depression: Accumulative evidence from an updated systematic review and meta-analysis of epidemiological studies. Br. J. Nutr. 2018, 119, 1087–1101. [Google Scholar] [CrossRef] [Green Version]
- Kim, J.M.; Stewart, R.; Kim, S.W.; Yang, S.J.; Shin, I.S.; Yoon, J.S. Predictive value of folate, vitamin B12 and homocysteine levels in late-life depression. Br. J. Psychiatry 2008, 192, 268–274. [Google Scholar] [CrossRef] [Green Version]
- Comai, S.; Bertazzo, A.; Bailoni, L.; Zancato, M.; Costa, C.V.L.; Allegri, G. Protein and non-protein (free and protein-bound) tryptophan in legume seeds. Food Chem. 2007, 103, 657–661. [Google Scholar] [CrossRef]
- Gibson, E.L. Tryptophan supplementation and serotonin function: Genetic variations in behavioural effects. Proc. Nutr. Soc. 2018, 77, 174–188. [Google Scholar] [CrossRef] [Green Version]
- Gould, E.; Tanapat, P.; McEwen, B.S.; Flugge, G.; Fuchs, E. Proliferation of granule cell precursors in the dentate gyrus of adult monkeys is diminished by stress. Proc. Natl. Acad. Sci. USA 1998, 95, 3168–3171. [Google Scholar] [CrossRef] [PubMed] [Green Version]
- Sapolsky, R.M.; Krey, L.C.; McEwen, B.S. The neuroendocrinology of stress and aging: The glucocorticoid cascade hypothesis. Endocr. Rev. 1986, 7, 284–301. [Google Scholar] [CrossRef] [PubMed]
- Byers, A.L.; Yaffe, K. Depression and risk of developing dementia. Nat. Rev. Neurol. 2011, 7, 323–331. [Google Scholar] [CrossRef] [PubMed] [Green Version]

| Characteristics | All Participants | Quartile of AHEI-2010 | ||||
|---|---|---|---|---|---|---|
| Q1 (0–40.04) | Q2 (40.04–46.46) | Q3 (46.46–53.64) | Q4 (53.64–100) | p-Value | ||
| No. of participants | 2644 | 661 | 661 | 661 | 661 | |
| Age, mean (SD) a | 69.43 (6.77) | 69.41 (6.81) | 69.60 (7.01) | 69.38 (6.80) | 69.34 (6.46) | 0.907 |
| Gender, n (%) b | <0.001 | |||||
| Male | 1321 (49.96) | 137 (20.73) | 324 (49.02) | 386 (58.40) | 474 (71.71) | |
| Female | 1323 (50.04) | 524 (79.27) | 337 (50.98) | 275 (41.60) | 187 (28.29) | |
| Race, n (%) b | <0001 | |||||
| Mexican American | 221 (8.36) | 43 (6.51) | 58 (8.77) | 58 (8.77) | 62 (9.38) | |
| Other Hispanic | 258 (9.76) | 59 (8.93) | 63 (9.53) | 70 (10.59) | 66 (9.98) | |
| Non-Hispanic White | 1309 (49.51) | 320 (48.41) | 336 (50.83) | 332 (50.23) | 321 (48.56) | |
| Non-Hispanic Black | 629 (23.79) | 204 (30.86) | 165 (24.96) | 137 (20.73) | 123 (18.61) | |
| Other | 227 (8.59) | 35 (5.30) | 39 (5.90) | 64 (9.68) | 89 (13.46) | |
| Marital status, n (%) b | <0.001 | |||||
| Marry | 1470 (55.60) | 315 (47.66) | 328 (49.62) | 402 (60.82) | 425 (64.30) | |
| Widowed | 499 (18.87) | 161 (24.36) | 133 (20.12) | 111 (16.79) | 94 (14.22) | |
| Divorced | 386 (14.60) | 106 (16.04) | 125 (18.91) | 82 (12.41) | 73 (11.04) | |
| Other | 289 (10.93) | 79 (11.95) | 75 (11.35) | 66 (9.98) | 69 (10.44) | |
| BMI status, n (%) b | 0.104 | |||||
| <18.5 | 37 (1.40) | 13 (1.97) | 11 (1.66) | 8 (1.21) | 5 (0.76) | |
| 18.5–25 | 776 (29.35) | 201 (30.41) | 169 (25.57) | 196 (29.65) | 210 (31.77) | |
| >25 | 1831 (69.25) | 447 (67.62) | 481 (72.77) | 457 (69.14) | 446 (67.47) | |
| Education, n (%) b | <0.001 | |||||
| <High school | 647 (24.47) | 164 (24.81) | 192 (29.05) | 155 (23.45) | 136 (20.57) | |
| High school | 625 (23.64) | 195 (29.50) | 153 (23.15) | 147 (22.24) | 130 (19.67) | |
| >High school | 1372 (51.89) | 302 (45.69) | 316 (47.81) | 359 (54.31) | 395 (59.76) | |
| Smoking status, n (%) b | <0.001 | |||||
| Nonsmokers | 1280 (48.41) | 366 (55.37) | 321 (48.56) | 307 (46.44) | 286 (43.27) | |
| Ex-smokers | 1028 (38.88) | 202 (30.56) | 243 (36.76) | 265 (40.09) | 318 (48.11) | |
| Current smokers | 334 (12.63) | 92 (13.92) | 96 (14.52) | 89 (13.46) | 57 (8.62) | |
| Alcohol drinking, n (%) b | 1818 (68.76) | 390 (59.00) | 450 (68.08) | 471 (71.26) | 507 (76.60) | <0.001 |
| Diabetes, n (%) b | 121 (4.58) | 28 (4.24) | 32 (4.84) | 26 (3.93) | 35 (5.30) | 0.639 |
| Heart attack, n (%) b | 236 (8.93) | 48 (7.26) | 75 (11.35) | 56 (8.47) | 57 (8.62) | 0.064 |
| Stroke, n (%) b | 186 (7.03) | 53 (8.02) | 62 (9.38) | 34 (5.14) | 37 (5.60) | 0.007 |
| Hypertension, n (%) b | 751 (28.40) | 162 (24.51) | 177 (26.78) | 203 (30.71) | 209 (31.61) | 0.012 |
| CERAD, mean (SD) c | 24.98 (6.49) | 25.49 (6.46) | 24.70 (6.64) | 24.74 (6.57) | 25.01 (6.26) | 0.098 |
| DSST, mean (SD) c | 46.31 (17.13) | 45.38 (17.36) | 45.37 (17.31) | 46.24 (17.06) | 48.24 (16.67) | 0.006 |
| AFT, mean (SD) c | 16.72 (5.47) | 16.10 (5.30) | 16.67 (5.61) | 16.79 (5.41) | 17.32 (5.51) | 0.001 |
| Z-score, mean (SD) c | 0.02 (0.78) | 0.01 (0.77) | −0.02 (0.83) | 0.01 (0.79) | 0.08 (0.73) | 0.107 |
| CERAD c | p-Value | DSST d | p-Value | AFT e | p-Value | Z-score f | p-Value | |
|---|---|---|---|---|---|---|---|---|
| β (95% CI) | β (95% CI) | β (95% CI) | β (95% CI) | |||||
| Crude model a | ||||||||
| Depressive symptoms | −0.12(−0.22, −0.03) | 0.011 | −0.70 (−0.94, −0.46) | <0.001 | −0.16 (−0.23, −0.10) | <0.011 | −0.03 (−0.04, −0.02) | <0.001 |
| Quartile of AHEI-2010 | ||||||||
| Q1(0–40.04) | 0.00 (Ref) | 0.00 (Ref) | 0.00 (Ref) | 0.00 (Ref) | ||||
| Q2(40.04–46.46) | −0.18 (−1.09, 0.74) | 0.697 | 1.47 (−0.72, 3.67) | 0.182 | 1.05 (0.07, 2.04) | 0.037 | 0.06 (−0.07, 0.18) | 0.38 |
| Q3(46.46–53.64) | −0.50 (−1.35, 0.36) | 0.246 | 1.51 (−0.36, 3.39) | 0.11 | 0.85 (0.12, 1.57) | 0.023 | 0.02 (−0.07, 0.11) | 0.596 |
| Q4(53.64–100) | 0.03 (−0.77, 0.83) | 0.942 | 3.38 (1.61, 5.15) | 0.001 | 1.83 (0.92, 2.74) | 0.001 | 0.14 (0.04, 0.23) | 0.006 |
| p trend | 0.809 | 0.001 | <0.011 | 0.004 | ||||
| Adjusted model b | ||||||||
| Depressive symptoms | −0.11 (−0.20, −0.03) | 0.012 | −0.53 (−0.73, −0.33) | <0.001 | −0.11 (−0.18, −0.05) | 0.001 | −0.02 (−0.03, −0.01) | <0.001 |
| Quartile of AHEI-2010 | ||||||||
| Q1 (0–40.04) | 0.00 (Ref) | 0.00 (Ref) | 0.00 (Ref) | 0.00 (Ref) | ||||
| Q2 (40.04–46.46) | 0.31 (−0.61, 1.24) | 0.495 | 2.25 (0.61, 3.90) | 0.009 | 0.82 (−0.05, 1.69) | 0.063 | 0.09 (−0.02, 0.20) | 0.115 |
| Q3 (46.46–53.64) | −0.04 (−0.99, 0.91) | 0.929 | 1.52 (−0.27, 3.31) | 0.093 | 0.36 (−0.30, 1.01) | 0.277 | 0.03 (−0.05, 0.12) | 0.44 |
| Q4 (53.64–100) | 0.60 (−0.27, 1.47) | 0.169 | 3.37 (2.03, 4.71) | 0.001 | 1.14 (0.25, 2.04) | 0.014 | 0.14 (0.06, 0.23) | 0.002 |
| p trend | 0.054 | <0.001 | 0.011 | <0.001 | ||||
| Depressive Symptoms | ||||
|---|---|---|---|---|
| Crude Model a | Adjusted Model b | |||
| β (95% CI) | p-Value | β (95% CI) | p-Value | |
| Quartile of AHEI-2010 | ||||
| Q1 (0–40.04) | 0.00 (Ref) | 0.00 (Ref) | ||
| Q2 (40.04–46.46) | −0.14 (−0.63, 0.34) | 0.552 | −0.2 (−0.73, 0.32) | 0.438 |
| Q3 (46.46–53.64) | −0.09 (−0.60, 0.41) | 0.707 | −0.46 (−1.02, 0.11) | 0.109 |
| Q4 (53.64–100) | −0.80 (−1.24, −0.35) | 0.001 | −1.27 (−1.80, −0.75) | <0.001 |
| CERAD c β (95% CI) | p-Value | DSST d β (95% CI) | p-Value | AFT e β (95% CI) | p-Value | Z-Score f β (95% CI) | p-Value | |
|---|---|---|---|---|---|---|---|---|
| Crude model a | ||||||||
| Vegetables | 0.44 (0.29, 0.58) | <0.001 | 1.13 (0.75, 1.51) | <0.001 | 0.48 (0.32, 0.63) | <0.001 | 0.07 (0.05, 0.08) | <0.001 |
| Whole fruit | 0.20 (0.03, 0.37) | 0.021 | 0.94 (0.62, 1.27) | <0.001 | 0.15 (−0.004, 0.30) | 0.056 | 0.03 (0.02, 0.05) | 0.001 |
| Whole grains | −0.62 (−0.94, −0.31) | <0.001 | −0.84 (−1.50, −0.18) | 0.014 | 0.25 (−0.14, 0.65) | 0.204 | −0.05 (−0.08, −0.01) | 0.012 |
| Sugar fruit juice | −0.08 (−0.15, −0.01) | 0.032 | −0.01 (−0.17, 0.14) | 0.867 | −0.05 (−0.13, 0.02) | 0.142 | −0.01 (−0.02, 0.001) | 0.079 |
| Nuts and legumes | 0.18 (0.11, 0.26) | <0.001 | 0.51 (0.33, 0.69) | <0.001 | 0.19 (0.12, 0.26) | <0.001 | 0.03 (0.02, 0.04) | <0.001 |
| Red meat | 0.01 (−0.07, 0.08) | 0.873 | 0.10 (−0.12, 0.32) | 0.367 | 0.05 (−0.02, 0.12) | 0.194 | 0.004 (−0.01, 0.01) | 0.416 |
| ω-3 fatty acids | 0.20 (−0.70, 1.09) | 0.657 | 1.35 (−0.33, 3.04) | 0.112 | 0.60 (0.20, 1.00) | 0.004 | 0.06 (−0.02, 0.14) | 0.163 |
| PUFA | −0.02 (−0.12, 0.08) | 0.699 | 0.29 (0.10, 0.48) | 0.004 | 0.09 (−0.01, 0.19) | 0.083 | 0.01 (−0.005, 0.02) | 0.245 |
| Sodium | −0.17 (−0.38, 0.03) | 0.088 | −0.67 (−1.21, −0.12) | 0.019 | −0.45 (−0.68, −0.22) | <0.001 | −0.04 (−0.07, −0.02) | 0.001 |
| Alcohol | −0.25 (−0.34, −0.17) | <0.001 | −0.67 (−0.86, −0.48) | <0.001 | 0.001 (−0.08, 0.08) | 0.985 | −0.03 (−0.04, −0.02) | <0.001 |
| Adjusted model b | ||||||||
| Vegetables | 0.34 (0.19, 0.49) | <0.001 | 0.52 (0.22, 0.83) | 0.001 | 0.31 (0.19, 0.43) | <0.001 | 0.05 (0.03, 0.06) | <0.001 |
| Whole fruit | 0.13 (−0.02, 0.29) | 0.084 | 0.59 (0.35, 0.82) | <0.001 | 0.10 (−0.04, 0.24) | 0.167 | 0.02 (0.01, 0.04) | 0.007 |
| Whole grains | −0.13 (−0.43, 0.17) | 0.387 | −0.24 (−1.06, 0.59) | 0.565 | 0.004 (−0.44, 0.45) | 0.985 | −0.01 (−0.05, 0.02) | 0.413 |
| Sugar fruit juice | −0.07 (−0.14, −0.01) | 0.046 | 0.004 (−0.12, 0.13) | 0.951 | −0.05 (−0.11, 0.02) | 0.141 | −0.01 (−0.01, 0.001) | 0.083 |
| Nuts and legumes | 0.15 (0.08, 0.21) | <0.001 | 0.35 (0.21, 0.50) | <0.001 | 0.14 (0.09, 0.20) | <0.001 | 0.02 (0.02, 0.03) | <0.001 |
| Red meat | 0.002 (−0.06, 0.07) | 0.947 | 0.01 (−0.13, 0.015) | 0.919 | −0.01 (−0.08, 0.05) | 0.672 | −0.001 (−0.01, 0.01) | 0.986 |
| ω-3 fatty acids | 0.23 (−0.55, 1.01) | 0.551 | 1.21 (0.09, 2.34) | 0.036 | 0.57 (0.27, 0.87) | <0.001 | 0.06 (−0.01, 0.12) | 0.095 |
| PUFA | −0.07 (−0.15, 0.008) | 0.076 | 0.08 (−0.10, 0.26) | 0.381 | 0.05 (−0.04, 0.14) | 0.278 | −0.001 (−0.01, 0.01) | 0.766 |
| Sodium | −0.25 (−0.49, −0.01) | 0.038 | −0.30 (−0.81, 0.20) | 0.228 | −0.16 (−0.37, 0.05) | 0.136 | −0.03 (−0.06, −0.02) | 0.036 |
| Alcohol | 0.05 (−0.10, 0.20) | 0.522 | −0.19 (−0.49, 0.10) | 0.198 | −0.02 (−0.16, 0.12) | 0.786 | −0.001 (−0.02, 0.02) | 0.873 |
| Direct Effect β (95%CI) | p- Value | Indirect Effect β (95%CI) | p- Value | Total Effect β (95%CI) | p- Value | Proporation Mediated (%) | |
|---|---|---|---|---|---|---|---|
| CERAD a | 0.0219 (−0.0029, 0.0467) | 0.083 | 0.0036 (0.0009, 0.0064) | 0.043 | 0.0255 (0.0008, 0.0503) | 0.010 | 14.14 |
| DSST b | 0.1298 (0.0754, 0.1842) | <0.001 | 0.0130 (0.0041, 0.0219) | <0.001 | 0.1428 (0.0885, 0.1971) | 0.004 | 9.1 |
| AFT c | 0.0298 (0.0087, 0.0508) | 0.006 | 0.0030 (0.0007, 0.0053) | 0.002 | 0.0328 (0.0118, 0.0538) | 0.010 | 9.15 |
| Z-score d | 0.0049 (0.0023, 0.0076) | <0.001 | 0.0006 (0.0002, 0.0010) | <0.001 | 0.0055 (0.0028, 0.0082) | 0.005 | 10.47 |
Publisher’s Note: MDPI stays neutral with regard to jurisdictional claims in published maps and institutional affiliations. |
© 2022 by the authors. Licensee MDPI, Basel, Switzerland. This article is an open access article distributed under the terms and conditions of the Creative Commons Attribution (CC BY) license (https://creativecommons.org/licenses/by/4.0/).
Share and Cite
Lu, Z.; Chen, C.; Zhang, J.; Wang, X.; Zhang, D.; Li, S. The Relationship between Alternative Healthy Diet Index and Cognitive Function in the Older Adults: The Mediating Effect of Depressive Symptoms. Nutrients 2022, 14, 2856. https://doi.org/10.3390/nu14142856
Lu Z, Chen C, Zhang J, Wang X, Zhang D, Li S. The Relationship between Alternative Healthy Diet Index and Cognitive Function in the Older Adults: The Mediating Effect of Depressive Symptoms. Nutrients. 2022; 14(14):2856. https://doi.org/10.3390/nu14142856
Chicago/Turabian StyleLu, Zhonghai, Chen Chen, Jiesong Zhang, Xueyan Wang, Dongfeng Zhang, and Suyun Li. 2022. "The Relationship between Alternative Healthy Diet Index and Cognitive Function in the Older Adults: The Mediating Effect of Depressive Symptoms" Nutrients 14, no. 14: 2856. https://doi.org/10.3390/nu14142856
APA StyleLu, Z., Chen, C., Zhang, J., Wang, X., Zhang, D., & Li, S. (2022). The Relationship between Alternative Healthy Diet Index and Cognitive Function in the Older Adults: The Mediating Effect of Depressive Symptoms. Nutrients, 14(14), 2856. https://doi.org/10.3390/nu14142856