A Slight Adjustment of the Nutri-Score Nutrient Profiling System Could Help to Better Reflect the European Dietary Guidelines Regarding Nuts
Abstract
:1. Introduction
| Nut Type | Energy (KJ) | Protein (g) | Fibre (g) | Fat (g) | SFA (g) | MUFA (g) | PUFA (g) | LA (g) | ALA (g) | Plant Sterols (mg) | Poly Phenols (mg) | Folate (µg) | Calcium (mg) | Magnesium (mg) | Sodium (mg) | Potassium (mg) |
|---|---|---|---|---|---|---|---|---|---|---|---|---|---|---|---|---|
| Almond | 2469 | 22.6 | 12.5 | 51.3 | 4.1 | 31.5 | 12.2 | 12.2 | 0.00 | 162 | 287 | 44 | 269 | 270 | 2.6 | 733 |
| Brazil nut | 2874 | 16.9 | 6.4 | 66.1 | 16 | 24.5 | 24.4 | 20.5 | 0.05 | 72 | 244 | 22 | 160 | 376 | 3 | 659 |
| Cashew | 2610 | 20.5 | 5.7 | 49 | 8.9 | 27.3 | 7.8 | 7.7 | 0.15 | 120 | 233 | 69 | 45 | 260 | 8 | 565 |
| Hazelnut | 2548 | 17 | 11.6 | 56.9 | 4.8 | 45.7 | 7.9 | 7.8 | 0.09 | 115 | 671 | 113 | 114 | 163 | 2.6 | 680 |
| Macadamia | 3096 | 9.3 | 8.6 | 75.8 | 11.8 | 58.9 | 1.4 | 1.3 | 0.21 | 119 | 126 | 10 | 70 | 118 | 5.2 | 363 |
| Peanut | 2536 | 26.1 | 8.6 | 49.1 | 8.4 | 24.4 | 15.6 | 15.6 | 0.00 | 126 | 406 | 240 | 92 | 168 | 8.8 | 705 |
| Pecan | 3012 | 11.3 | 8.3 | 72.6 | 6.6 | 40.8 | 21.6 | 20.6 | 1.00 | 113 | 1284 | 22 | 70 | 121 | 1 | 410 |
| Pine nut | 2905 | 16.2 | 10 | 65 | 5.5 | 18.8 | 34.1 | 33.2 | 0.16 | 120 | 58 | 34 | 16 | 251 | 9 | 597 |
| Pistachio | 2460 | 21.7 | 10.1 | 47.4 | 5.5 | 25.0 | 14.0 | 13.2 | 0.25 | 272 | 1420 | 49 | 104 | 106 | 6 | 977 |
| Walnut | 2912 | 15.7 | 6.7 | 67.3 | 6.5 | 8.9 | 47.2 | 38.1 | 9.08 | 143 | 1579 | 98 | 98 | 158 | 2.6 | 441 |
2. Materials and Methods
2.1. The Nutri-Score
2.2. Development of the Four Scenarios for Adjustment of the NPS of the Nutri-Score
- Retaining the fundamentals of the Nutri-Score,
- ○
- only nutrients labelled in the nutritional declaration,
- ○
- assessment per 100 g or 100 mL,
- ○
- applicable across all product categories
- Precedent adaptations by the creators of the system e.g., the double counting of dry fruit
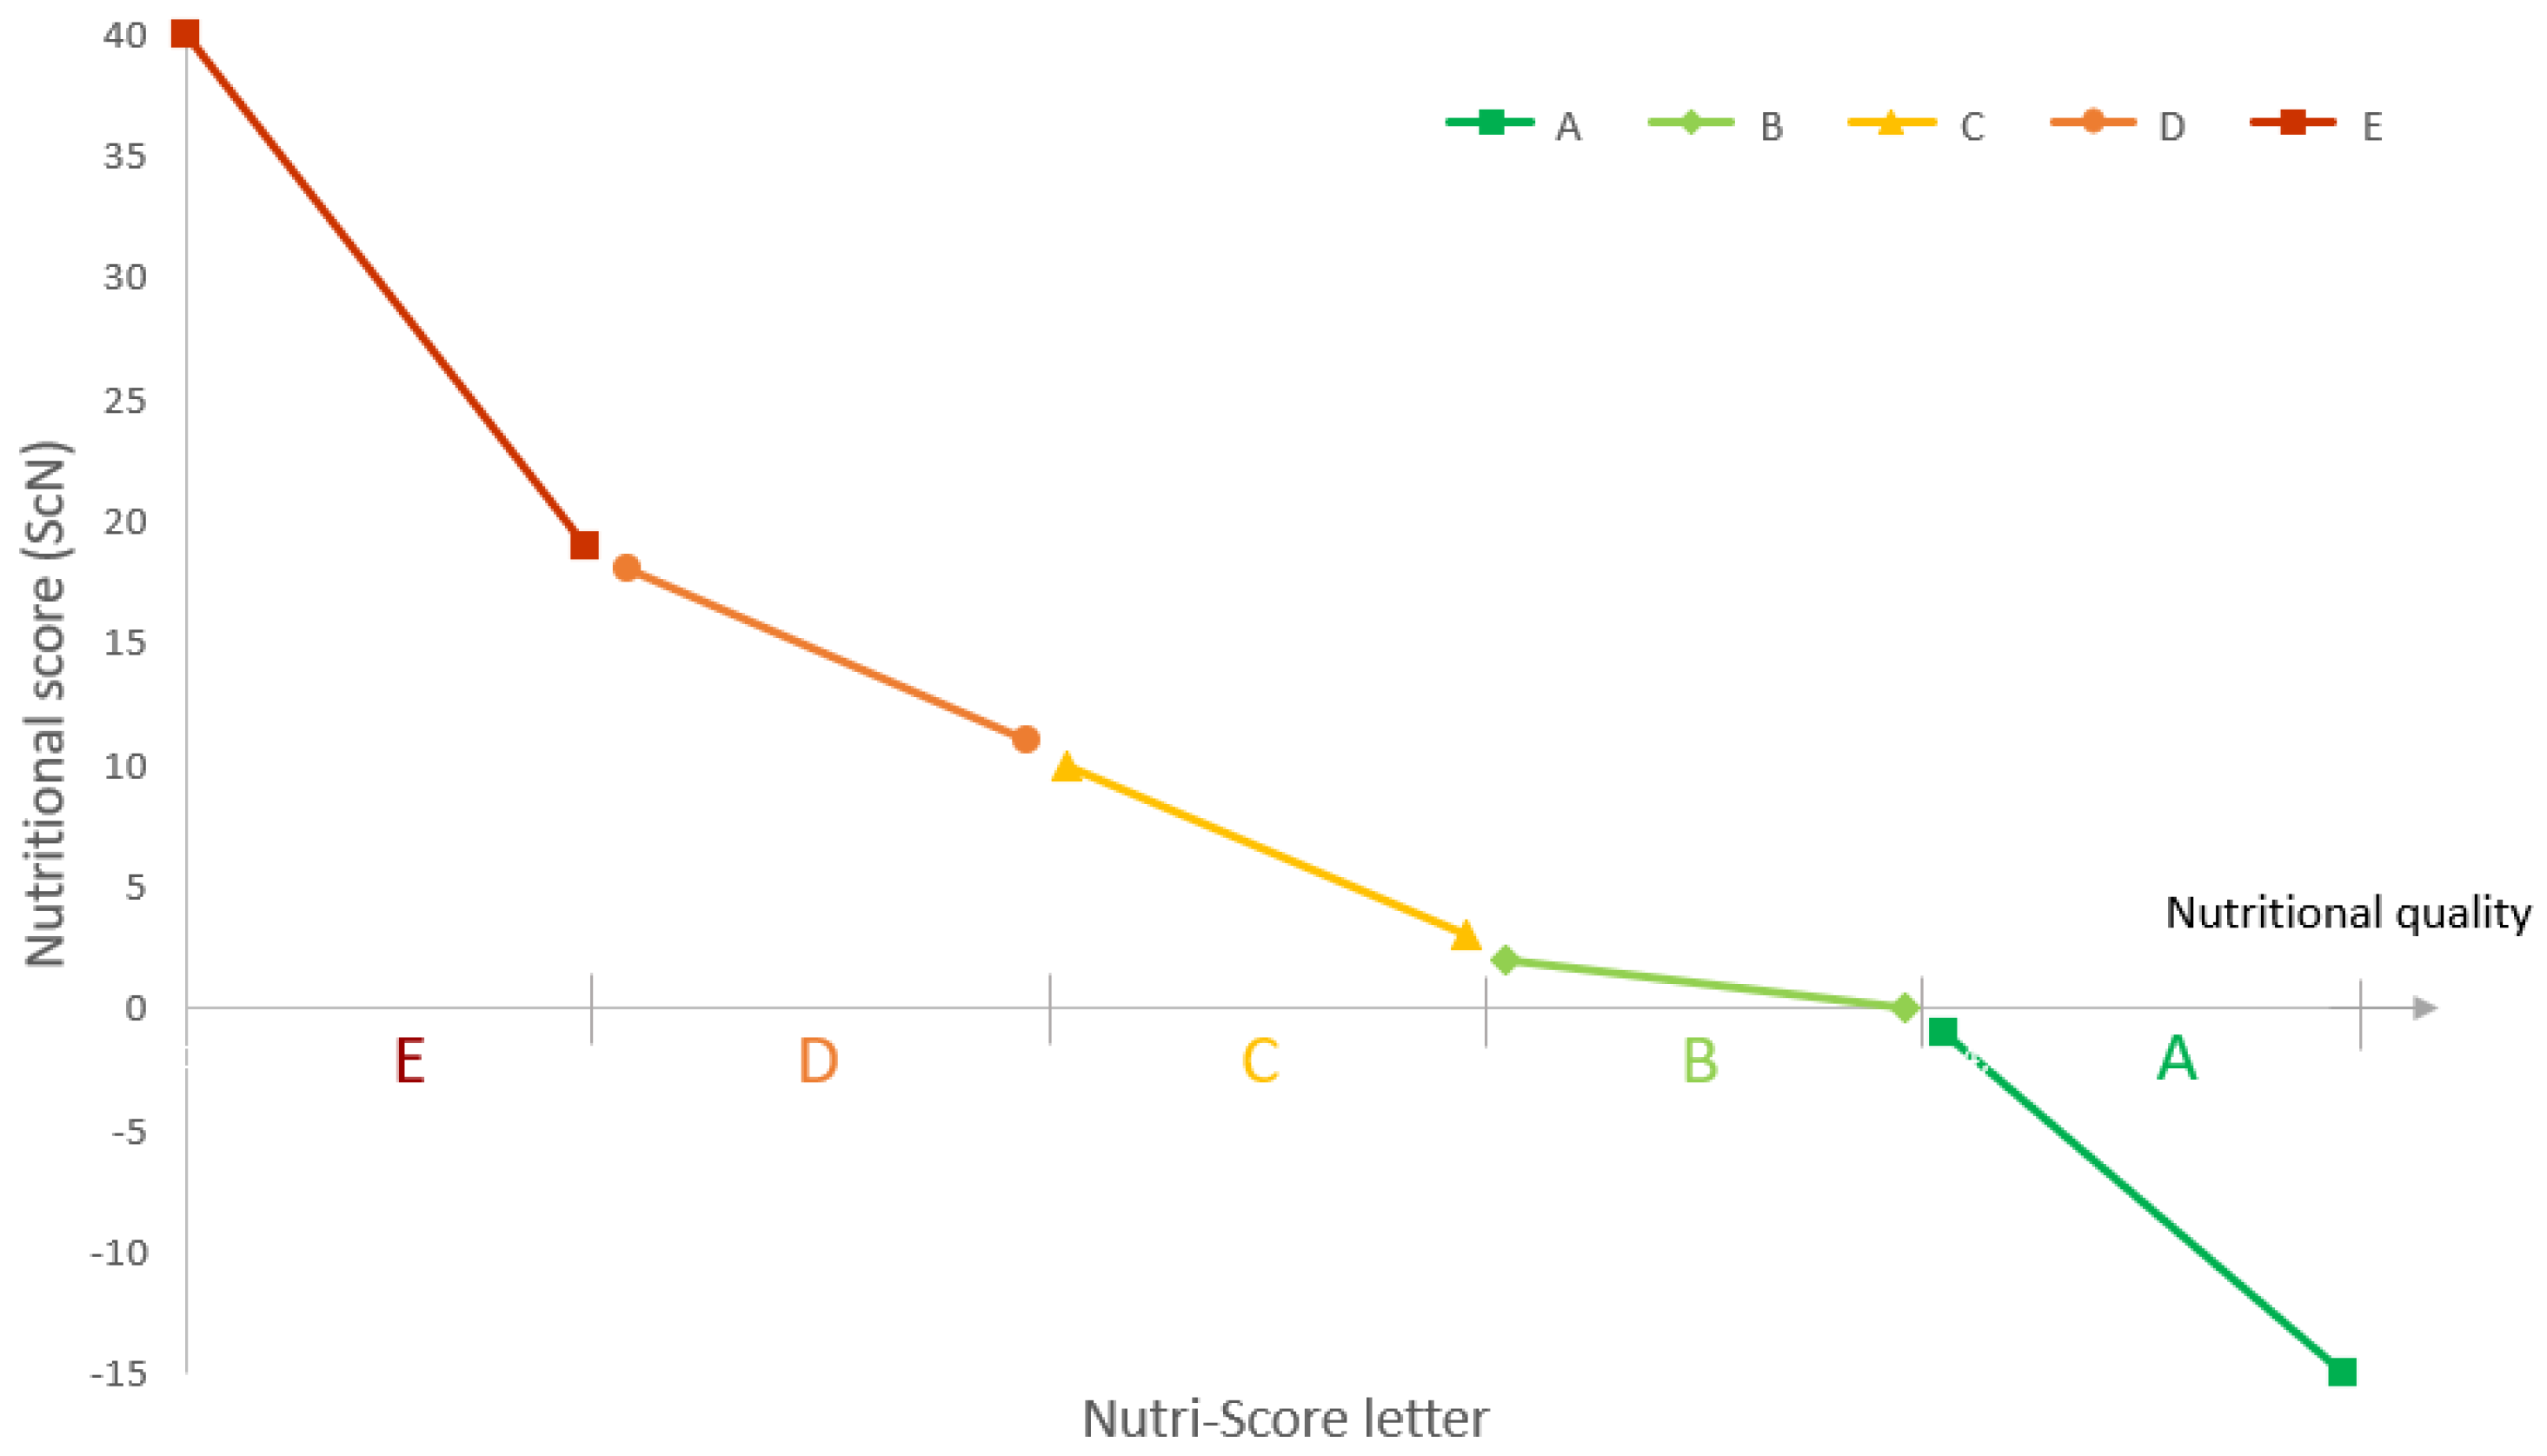
- Introduction of a single variation to the system, such that all other criteria, thresholds, and calculations remain identical to the original Nutri-Score
- Unlikely to affect the Nutri-Score of products that do not contain nuts.
- Practically achievable
- Has nutritional significance relative to the specificities of nutsThis resulted in four variations, as follows:
- ○
- Scenario 1 (S1) consists of multiplying the weight of nuts by 2 when calculating the amount of FVPNO in 100 g of food, as is currently done by the Nutri-Score algorithm for dried fruits, vegetables, and pulses [34]. This helps to better consider the nutritional density of dried fruits, vegetables, and pulses in spite of their higher energy density, so it seems logical to apply the same treatment to nuts. Thus, the calculation of nuts percentage in this scenario is the following:For each food, the %Nuts_S1 was then used to calculate the number of points in the FVPNO element of the nutritional score for S1. The corresponding ScN was identified as ScN_S1.
- ○
- Scenario 2 (S2) consists of discounting the SFA content of nuts in the SFA component of the Nutri-Score NPS. Indeed, SFAs in nuts are accompanied by large amounts of MUFA and PUFA and should not be considered as isolated SFA from other sources, which do not bring nutritional benefits. For each food, the value used to calculate the number of points in the SFA element of the ScN_S2 corresponded to the SFA content from nuts subtracted from the total SFA content. To calculate the SFA content of nuts in each product, the SFA content of each nut was collected from the French food composition table CIQUAL [26], as depicted in Table 1. The SFA content from nuts in a food product containing n different nuts was calculated using the following formulaThe corresponding ScN was identified as ScN_S2.
- ○
- Scenario 3 (S3) consists of discounting the energy content of nuts in the energy density element of the Nutri-Score NPS. The energy in nuts comes largely from fat, and discounting it is an alternative way of considering the overall favourable quality of fat in nuts; furthermore, there is consistent evidence that, unlike the energy from most foods, the metabolisable energy from nuts is less than that determined by food chemistry measurements and predicted by Atwater factors [35,36,37,38]. To discount energy density from nuts in the energy density element of the Nutri-Score NPS, the same method was applied as the one described above for (S2) but replacing SFA with energy density. The corresponding ScN was identified as ScN_S3.
- ○
- Scenario (S4) consists of replacing the SFA component of the Nutri-Score NPS by the ratio SFA/lipids, which is used in the initial algorithm adaptation for added fats [32]. This acknowledges that the composition of nuts in terms of fatty acid content is not limited to SFA, which make up only a minor part of the total fatty acids of nuts. One point is attributed for an SFA/lipids ratio of 10% and the number of points increases by one each time the ratio increases by 6% until a maximum of 10 points (for a SFA/lipids ratio of 64% or more) [34]. The corresponding ScN was identified as ScN_S4.
2.3. Selection of Food Products to Test the Four Scenarios
2.4. Calculations and Statistical Analyses
3. Results
3.1. Assessment of Nuts and Nut-Containing Products
3.2. Nuts and Nut-Containing Products in the Initial Nutri-Score Nutrient Profiling System
3.3. Application of the Four Scenarios to Nuts and Nut-Containing Products
3.4. Association between the Nut Content and Nutritional Score of the Nutri-Score following the Application of Each Scenario
3.5. Assessment of the Impact of the Application of Each Scenario on the Nutri-Score Letter of Core Food Products That Did Not Contain Nuts
4. Discussion
5. Conclusions
Supplementary Materials
Author Contributions
Funding
Data Availability Statement
Conflicts of Interest
References
- Ros, E.; Singh, A.; O’Keefe, J.H. Nuts: Natural Pleiotropic Nutraceuticals. Nutrients 2021, 13, 3296. [Google Scholar] [CrossRef] [PubMed]
- Becerra-Tomás, N.; Paz-Graniel, I.; Kendall, C.W.C.; Kahleova, H.; Rahelić, D.; Sievenpiper, J.L.; Salas-Salvadó, J. Nut consumption and incidence of cardiovascular diseases and cardiovascular disease mortality: A meta-analysis of prospective cohort studies. Nutr. Rev. 2019, 77, 691–709. [Google Scholar] [CrossRef] [PubMed]
- Liu, X.; Guasch-Ferré, M.; Drouin-Chartier, J.-P.; Tobias, D.K.; Bhupathiraju, S.N.; Rexrode, K.M.; Willett, W.C.; Sun, Q.; Li, Y. Changes in Nut Consumption and Subsequent Cardiovascular Disease Risk Among US Men and Women: 3 Large Prospective Cohort Studies. J. Am. Heart Assoc. 2020, 9, e013877. [Google Scholar] [CrossRef]
- Micha, R.; Peñalvo, J.L.; Cudhea, F.; Imamura, F.; Rehm, C.D.; Mozaffarian, D. Association Between Dietary Factors and Mortality From Heart Disease, Stroke, and Type 2 Diabetes in the United States. JAMA 2017, 317, 912. [Google Scholar] [CrossRef] [PubMed] [Green Version]
- Meier, T.; Gräfe, K.; Senn, F.; Sur, P.; Stangl, G.I.; Dawczynski, C.; März, W.; Kleber, M.E.; Lorkowski, S. Cardiovascular mortality attributable to dietary risk factors in 51 countries in the WHO European Region from 1990 to 2016: A systematic analysis of the Global Burden of Disease Study. Eur. J. Epidemiol. 2019, 34, 37–55. [Google Scholar] [CrossRef] [Green Version]
- Sisa, I.; Abeyá-Gilardon, E.; Fisberg, R.M.; Jackson, M.D.; Mangialavori, G.L.; Sichieri, R.; Cudhea, F.; Bannuru, R.R.; Ruthazer, R.; Mozaffarian, D.; et al. Impact of diet on CVD and diabetes mortality in Latin America and the Caribbean: A comparative risk assessment analysis. Public Health Nutr. 2021, 24, 2577–2591. [Google Scholar] [CrossRef]
- Estruch, R.; Ros, E.; Salas-Salvadó, J.; Covas, M.-I.; Corella, D.; Arós, F.; Gómez-Gracia, E.; Ruiz-Gutiérrez, V.; Fiol, M.; Lapetra, J.; et al. Primary Prevention of Cardiovascular Disease with a Mediterranean Diet Supplemented with Extra-Virgin Olive Oil or Nuts. N. Engl. J. Med. 2018, 378, e34. [Google Scholar] [CrossRef]
- Kim, Y.; Keogh, J.; Clifton, P. Nuts and Cardio-Metabolic Disease: A Review of Meta-Analyses. Nutrients 2018, 10, 1935. [Google Scholar] [CrossRef] [Green Version]
- Nishi, S.K.; Viguiliouk, E.; Blanco Mejia, S.; Kendall, C.W.C.; Bazinet, R.P.; Hanley, A.J.; Comelli, E.M.; Salas Salvadó, J.; Jenkins, D.J.A.; Sievenpiper, J.L. Are fatty nuts a weighty concern? A systematic review and meta-analysis and dose–response meta-regression of prospective cohorts and randomized controlled trials. Obes. Rev. 2021, 22, 13330. [Google Scholar] [CrossRef]
- Del Gobbo, L.C.; Falk, M.C.; Feldman, R.; Lewis, K.; Mozaffarian, D. Effects of tree nuts on blood lipids, apolipoproteins, and blood pressure: Systematic review, meta-analysis, and dose-response of 61 controlled intervention trials. Am. J. Clin. Nutr. 2015, 102, 1347–1356. [Google Scholar] [CrossRef] [Green Version]
- Domènech, M.; Serra-Mir, M.; Roth, I.; Freitas-Simoes, T.; Valls-Pedret, C.; Cofán, M.; López, A.; Sala-Vila, A.; Calvo, C.; Rajaram, S.; et al. Effect of a Walnut Diet on Office and 24-Hour Ambulatory Blood Pressure in Elderly Individuals. Hypertension 2019, 73, 1049–1057. [Google Scholar] [CrossRef] [PubMed]
- Naghshi, S.; Sadeghian, M.; Nasiri, M.; Mobarak, S.; Asadi, M.; Sadeghi, O. Association of Total Nut, Tree Nut, Peanut, and Peanut Butter Consumption with Cancer Incidence and Mortality: A Comprehensive Systematic Review and Dose-Response Meta-Analysis of Observational Studies. Adv. Nutr. 2021, 12, 793–808. [Google Scholar] [CrossRef] [PubMed]
- Theodore, L.E.; Kellow, N.J.; McNeil, E.A.; Close, E.O.; Coad, E.G.; Cardoso, B.R. Nut Consumption for Cognitive Performance: A Systematic Review. Adv. Nutr. 2020, 12, 777–792. [Google Scholar] [CrossRef] [PubMed]
- Chen, G.-C.; Zhang, R.; Martínez-González, M.A.; Zhang, Z.-L.; Bonaccio, M.; van Dam, R.M.; Qin, L.-Q. Nut consumption in relation to all-cause and cause-specific mortality: A meta-analysis 18 prospective studies. Food Funct. 2017, 8, 3893–3905. [Google Scholar] [CrossRef]
- Afshin, A.; Sur, P.J.; Fay, K.A.; Cornaby, L.; Ferrara, G.; Salama, J.S.; Mullany, E.C.; Abate, K.H.; Abbafati, C.; Abebe, Z.; et al. Health effects of dietary risks in 195 countries, 1990–2017: A systematic analysis for the Global Burden of Disease Study 2017. Lancet 2019, 393, 1958–1972. [Google Scholar] [CrossRef] [Green Version]
- Mertens, E.; Kuijsten, A.; Dofková, M.; Mistura, L.; D’Addezio, L.; Turrini, A.; Dubuisson, C.; Favret, S.; Havard, S.; Trolle, E.; et al. Geographic and socioeconomic diversity of food and nutrient intakes: A comparison of four European countries. Eur. J. Nutr. 2019, 58, 1475–1493. [Google Scholar] [CrossRef] [Green Version]
- Heuer, T.; Krems, C.; Moon, K.; Brombach, C.; Hoffmann, I. Food consumption of adults in Germany: Results of the German National Nutrition Survey II based on diet history interviews. Br. J. Nutr. 2015, 113, 1603–1614. [Google Scholar] [CrossRef]
- Development Initiatives. 2021 Global Nutrition Report. 2022. Available online: https://globalnutritionreport.org/reports/2021-global-nutrition-report/ (accessed on 14 March 2022).
- Storcksdieck genannt Bonsmann, S.; Marandola, G.; Ciriolo, E.; van Bavel, R.; Wollgast, J. Front-of-Pack Nutrition Labelling Schemes: A Comprehensive Review; Publications Office of the European Union: Luxembourg, 2020; ISBN 978-92-76-08971-1. [Google Scholar]
- WHO. Guiding Principles and Framework Manual for Front-of-Pack Labelling for Promoting Healthy Diets; Geneva, 2019. Available online: https://www.who.int/publications/m/item/guidingprinciples-labelling-promoting-healthydiet (accessed on 14 March 2022).
- Lockyer, S.; Cade, J.; Darmon, N.; Flynn, M.; Gatenby, S.; Govindji, A.; Quick, B.; Raats, M.; Rayner, M.; Sokolović, M.; et al. Proceedings of a roundtable event ‘Is communicating the concept of nutrient density important’? Nutr. Bull. 2020, 45, 74–97. [Google Scholar] [CrossRef] [Green Version]
- European Commission. Farm to Fork Strategy—For a Fair, Healthy and Environmentally-Friendly Food System. 2020. Available online: https://ec.europa.eu/food/horizontal-topics/farm-fork-strategy_fr (accessed on 14 March 2022).
- Talati, Z.; Egnell, M.; Hercberg, S.; Julia, C.; Pettigrew, S. Food Choice Under Five Front-of-Package Nutrition Label Conditions: An Experimental Study Across 12 Countries. Am. J. Public Health 2019, 109, 1770–1775. [Google Scholar] [CrossRef]
- Egnell, M.; Talati, Z.; Galan, P.; Andreeva, V.A.; Vandevijvere, S.; Gombaud, M.; Dréano-Trécant, L.; Hercberg, S.; Pettigrew, S.; Julia, C. Objective understanding of the Nutri-score front-of-pack label by European consumers and its effect on food choices: An online experimental study. Int. J. Behav. Nutr. Phys. Act. 2020, 17, 146. [Google Scholar] [CrossRef]
- Transnational Governance of the Nutri-Score. International Commitment of Participating Countries of Nutri-Score—General Agreement & Governance Structure. 2021. Available online: https://solidarites-sante.gouv.fr/IMG/pdf/nutri_score_general_agreement.pdf (accessed on 24 June 2022).
- ANSES. Ciqual French Food Composition Table. Available online: https://ciqual.anses.fr/# (accessed on 10 March 2022).
- Kornsteiner-Krenn, M.; Wagner, K.-H.; Elmadfa, I. Phytosterol content and fatty acid pattern of ten different nut types. Int. J. Vitam. Nutr. Res. 2013, 83, 263–270. [Google Scholar] [CrossRef] [PubMed]
- Neveu, V.; Perez-Jiménez, J.; Vos, F.; Crespy, V.; Du Chaffaut, L.; Mennen, L.; Knox, C.; Eisner, R.; Cruz, J.; Wishart, D.; et al. Phenol-Explorer: An online comprehensive database on polyphenol contents in foods. Database 2010, 2010, bap024. [Google Scholar] [CrossRef] [PubMed]
- US Department of Agriculture. ARS. FoodData Central. Available online: www.fdc.nal.usda.gov (accessed on 14 March 2022).
- Arrêté du 31 octobre 2017 fixant la forme de présentation complémentaire à la déclaration nutritionnelle recommandée par l’Etat en application des articles L. 3232-8 et R. 3232-7 du code de la santé publique. J. Off. De La République Française 2017. Available online: https://www.legifrance.gouv.fr/eli/arrete/2017/10/31/SSAP1730474A/jo/texte (accessed on 14 March 2022).
- Julia, C.; Kesse-Guyot, E.; Touvier, M.; Méjean, C.; Fezeu, L.; Hercberg, S. Application of the British Food Standards Agency nutrient profiling system in a French food composition database. Br. J. Nutr. 2014, 112, 1699–1705. [Google Scholar] [CrossRef] [Green Version]
- Santé Publique France. Conditions of Use of the « NUTRI-SCORE » LOGO: Version of 8 September 2021. Available online: https://www.google.com/url?sa=t&rct=j&q=&esrc=s&source=web&cd=&cad=rja&uact=8&ved=2ahUKEwiP-PThoM34AhXU0YUKHXTsCp8QFnoECAMQAQ&url=https%3A%2F%2Fwww.santepubliquefrance.fr%2Fcontent%2Fdownload%2F150258%2Ffile%2F20210908_RU_International_Users_regulation_ENG.pdf&usg=AOvVaw3yUQjNiXBi7c3r2Oci42Un (accessed on 14 March 2022).
- Rayner, M.; Scarborough, P.; Lobstein, T. The UK Ofcom Nutrient Profiling Model—Defining ‘healthy’ and ‘unhealthy’ foods and drinks for TV advertising to children. Available online: https://www.ndph.ox.ac.uk/cpnp/files/about/uk-ofcom-nutrient-profile-model.pdf (accessed on 14 March 2022).
- Santé Publique France. Nutri-Score—Frequently Asked Questions—Scientific and Technical: Version of July, 21st 2021. Available online: https://www.google.com/url?sa=t&rct=j&q=&esrc=s&source=web&cd=&cad=rja&uact=8&ved=2ahUKEwjSsLSuoM34AhWMhM4BHWLFDicQFnoECAMQAQ&url=https%3A%2F%2Fwww.santepubliquefrance.fr%2Fcontent%2Fdownload%2F150263%2Ffile%2FQR_scientifique%2520et%2520technique_EN_310322.pdf&usg=AOvVaw3QflNd66UwKBCrQRGZEozi (accessed on 24 June 2022).
- Novotny, J.A.; Gebauer, S.K.; Baer, D.J. Discrepancy between the Atwater factor predicted and empirically measured energy values of almonds in human diets. Am. J. Clin. Nutr. 2012, 96, 296–301. [Google Scholar] [CrossRef] [Green Version]
- Baer, D.J.; Gebauer, S.K.; Novotny, J.A. Walnuts Consumed by Healthy Adults Provide Less Available Energy than Predicted by the Atwater Factors. J. Nutr. 2016, 146, 9–13. [Google Scholar] [CrossRef]
- Baer, D.J.; Gebauer, S.K.; Novotny, J.A. Measured energy value of pistachios in the human diet. Br. J. Nutr. 2012, 107, 120–125. [Google Scholar] [CrossRef] [Green Version]
- Baer, D.J.; Novotny, J.A. Metabolizable Energy from Cashew Nuts is Less than that Predicted by Atwater Factors. Nutrients 2018, 11, 33. [Google Scholar] [CrossRef] [Green Version]
- Dubois, P.; Albuquerque, P.; Allais, O.; Bonnet, C.; Bertail, P.; Combris, P.; Lahlou, S.; Rigal, N.; Ruffieux, B.; Chandon, P. Effects of front-of-pack labels on the nutritional quality of supermarket food purchases: Evidence from a large-scale randomized controlled trial. J. Acad. Mark. Sci. 2021, 49, 119–138. [Google Scholar] [CrossRef] [Green Version]
- Crosetto, P.; Lacroix, A.; Muller, L.; Ruffieux, B. Nutritional and economic impact of five alternative front-of-pack nutritional labels: Experimental evidence. Eur. Rev. Agric. Econ. 2019, 47, 785–818. [Google Scholar] [CrossRef]
- Guarneiri, L.L.; Cooper, J.A. Intake of Nuts or Nut Products Does Not Lead to Weight Gain, Independent of Dietary Substitution Instructions: A Systematic Review and Meta-Analysis of Randomized Trials. Adv. Nutr. 2021, 12, 384–401. [Google Scholar] [CrossRef] [PubMed]
- Wang, D.; Sun, L.; Liu, X.; Niu, Z.; Chen, S.; Tang, L.; Zheng, H.; Chen, X.; Li, H.; Lu, L.; et al. Replacing white rice bars with peanuts as snacks in the habitual diet improves metabolic syndrome risk among Chinese adults: A randomized controlled trial. Am. J. Clin. Nutr. 2020, 113, 28–35. [Google Scholar] [CrossRef] [PubMed]
- Julibert, A.; Del Mar Bibiloni, M.; Gallardo-Alfaro, L.; Abbate, M.; Martínez-González, M.Á.; Salas-Salvadó, J.; Corella, D.; Fitó, M.; Martínez, J.A.; Alonso-Gómez, Á.M.; et al. Metabolic Syndrome Features and Excess Weight Were Inversely Associated with Nut Consumption after 1-Year Follow-Up in the PREDIMED-Plus Study. J. Nutr. 2020, 150, 3161–3170. [Google Scholar] [CrossRef]
- Freisling, H.; Noh, H.; Slimani, N.; Chajès, V.; May, A.M.; Peeters, P.H.; Weiderpass, E.; Cross, A.J.; Skeie, G.; Jenab, M.; et al. Nut intake and 5-year changes in body weight and obesity risk in adults: Results from the EPIC-PANACEA study. Eur. J. Nutr. 2018, 57, 2399–2408. [Google Scholar] [CrossRef] [PubMed] [Green Version]
- Guarneiri, L.L.; Paton, C.M.; Cooper, J.A. Changes in body weight in response to pecan-enriched diets with and without substitution instructions: A randomised, controlled trial. J. Nutr. Sci. 2022, 11, e16. [Google Scholar] [CrossRef] [PubMed]
- Jackson, C.L.; Hu, F.B. Long-term associations of nut consumption with body weight and obesity. Am. J. Clin. Nutr. 2014, 100 (Suppl. S1), 408S–411S. [Google Scholar] [CrossRef] [PubMed] [Green Version]
- Santé Publique France. International Scientific Committee in Charge of Coordinating the Scientific-Based Update of the Nutri-Score in the Context of its European Expansion—Mandate. 2021. Available online: https://www.santepubliquefrance.fr/media/files/02-determinants-de-sante/nutrition-et-activite-physique/nutri-score/mandat_eng_120221 (accessed on 24 June 2022).
- Transnational Governance of the Nutri-Score. Update of the Nutri-Score Algorithm—Yearly Report from the Scientific Committee of the Nutri-Score 2021. 2022. Available online: https://solidarites-sante.gouv.fr/prevention-en-sante/preserver-sa-sante/nutrition/nutri-score/article/une-coordination-europeenne-du-nutri-score-des-7-pays-eng (accessed on 24 June 2022).


| Food Category | Number of Products | % of Nuts (Mean ± SD) | ScN (Mean ± SD) | Nutri-Score Letter Range |
|---|---|---|---|---|
| Cereal bars | 16 | 31.2 ± 18.6 | 11.7 ± 5.0 | B–D |
| Breakfast cereals | 7 | 9.9 ± 4.1 | 2.3 ± 4.5 | A–C |
| Cakes and pastries | 2 | 13.1 ± 2.7 | 23.0 ± 0.0 | E |
| Sweet biscuits | 3 | 9.2 ± 4.1 | 19.0 ± 8.7 | C–E |
| Chocolate and chocolate-based products | 6 | 28.9 ± 26.1 | 20.0 ± 4.3 | D–E |
| Non-chocolate confectioneries | 2 | 29.5 ± 0.7 | 14.5 ± 2.1 | D |
| Ice creams | 4 | 13.8 ± 5.9 | 17.2 ± 1.3 | D–E |
| Crackers | 2 | 34.0 ± 5.6 | 15.5 ± 5.0 | D–E |
| Plant-based alternatives to dairy | 2 | 41.8 ± 38.6 | 5.5 ± 9.2 | A–D |
| Cheese and related products | 1 | 5 | 13 | D |
| Plain nuts | 9 | 100 ± 0.0 | −0.22 ± 5.0 | A–C |
| Salted nuts | 7 | 96.4 ± 1.5 | 4.0 ± 5.0 | A–D |
| Spreads (nut “butters”) | 2 | 100 ± 0.0 | −1.5 ± 3.5 | A–B |
| Coated nuts | 3 | 62.0 ± 2.6 | 12.0 ± 2.0 | C–D |
| Nut mix | 2 | 100 ± 0.0 | 0.0 ± 2.8 | A–B |
| 68 | 47.2 ± 37.7 | 9.4 ± 8.4 | A–E |
| S1 | S2 | S3 | S4 | |
|---|---|---|---|---|
| ScN variation (points) Mean ± SD (range) | −0.4 ± 1.4 (−8–0) | −3.3 ± 3.1 (−10–0) | −3.8 ± 3.0 (−9–0) | −3.4 ± 2.3 (−9–0) |
| Number (and percentage) of products that obtained an ScN corresponding to a better nutritional quality by a decrease of at least 1 point | 11 (16%) | 52 (76%) | 62 (91%) | 60 (88%) |
| Variation in ScN of products that obtained an ScN corresponding to a better nutritional quality (points) Mean ± SD | −2.3 ± 2.8 | −4.3 ± 2.9 | −4.1 ± 2.9 | −3.9 ± 2.0 |
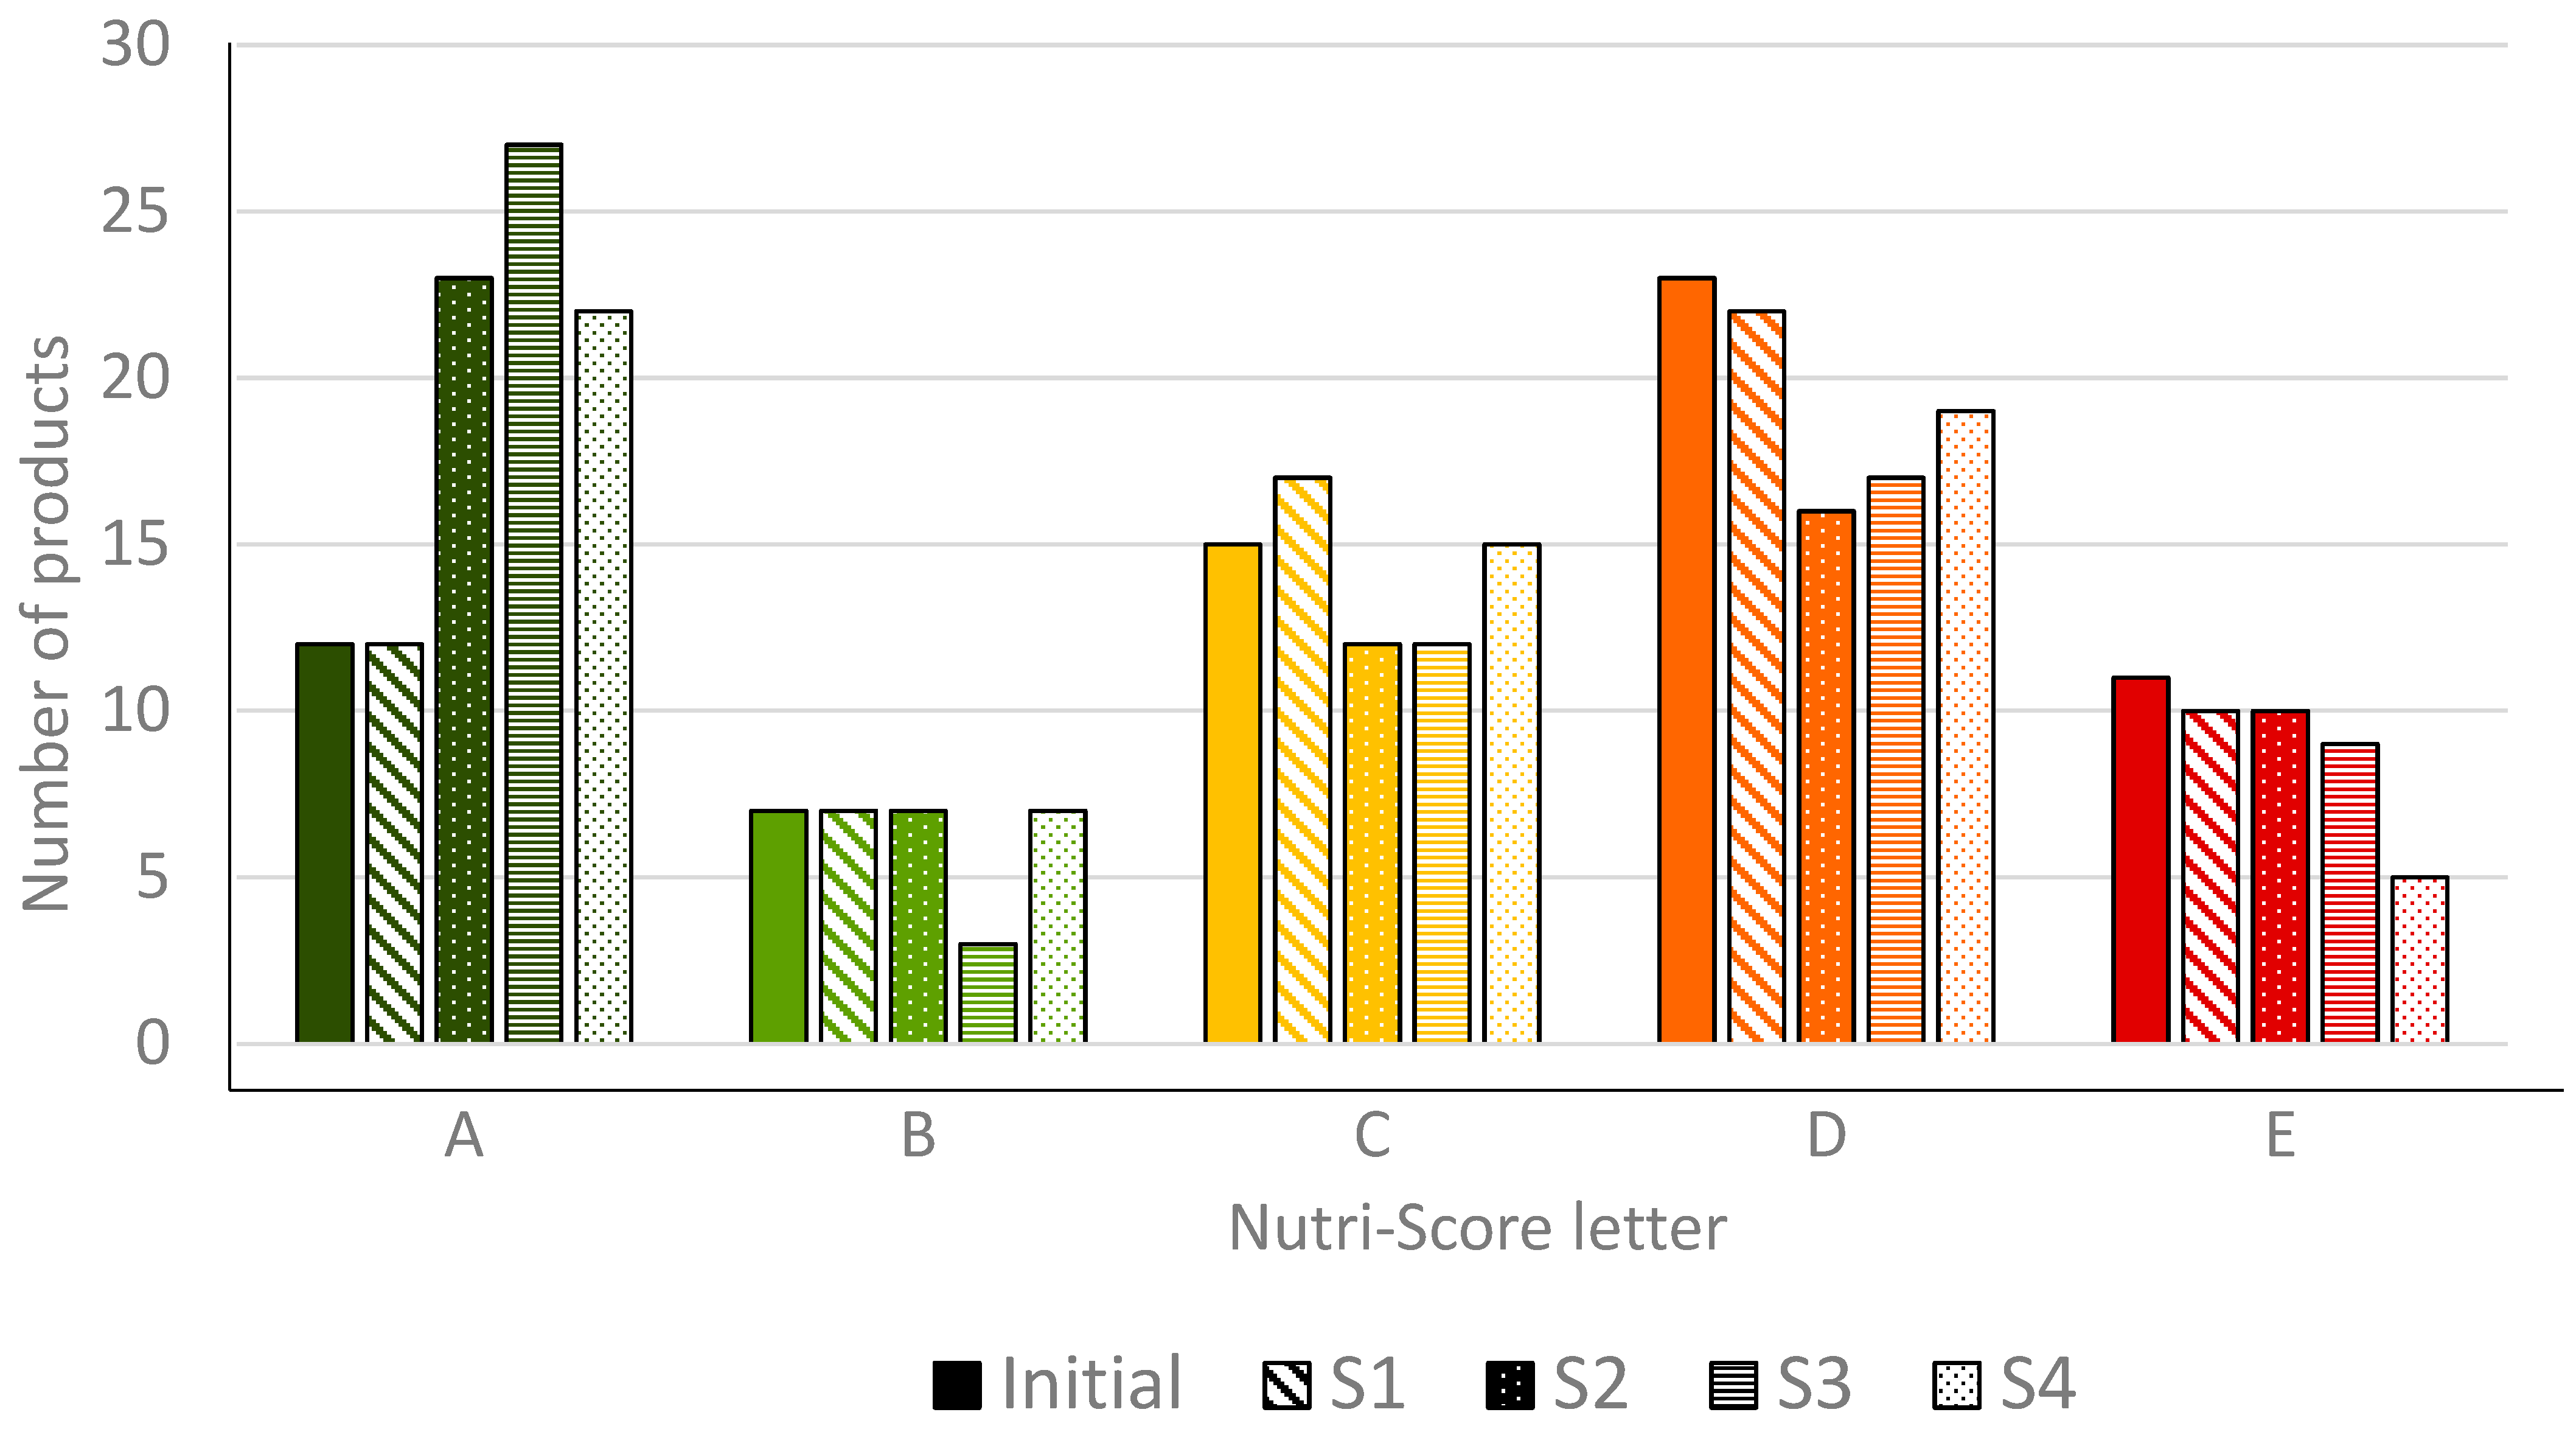
| Number (and percentage) of products that obtained a better Nutri-Score letter | 3 (4%) | 25 (37%) | 27 (40%) | 31 (46%) |
| Initial | S1 | S2 | S3 | S4 | |
|---|---|---|---|---|---|
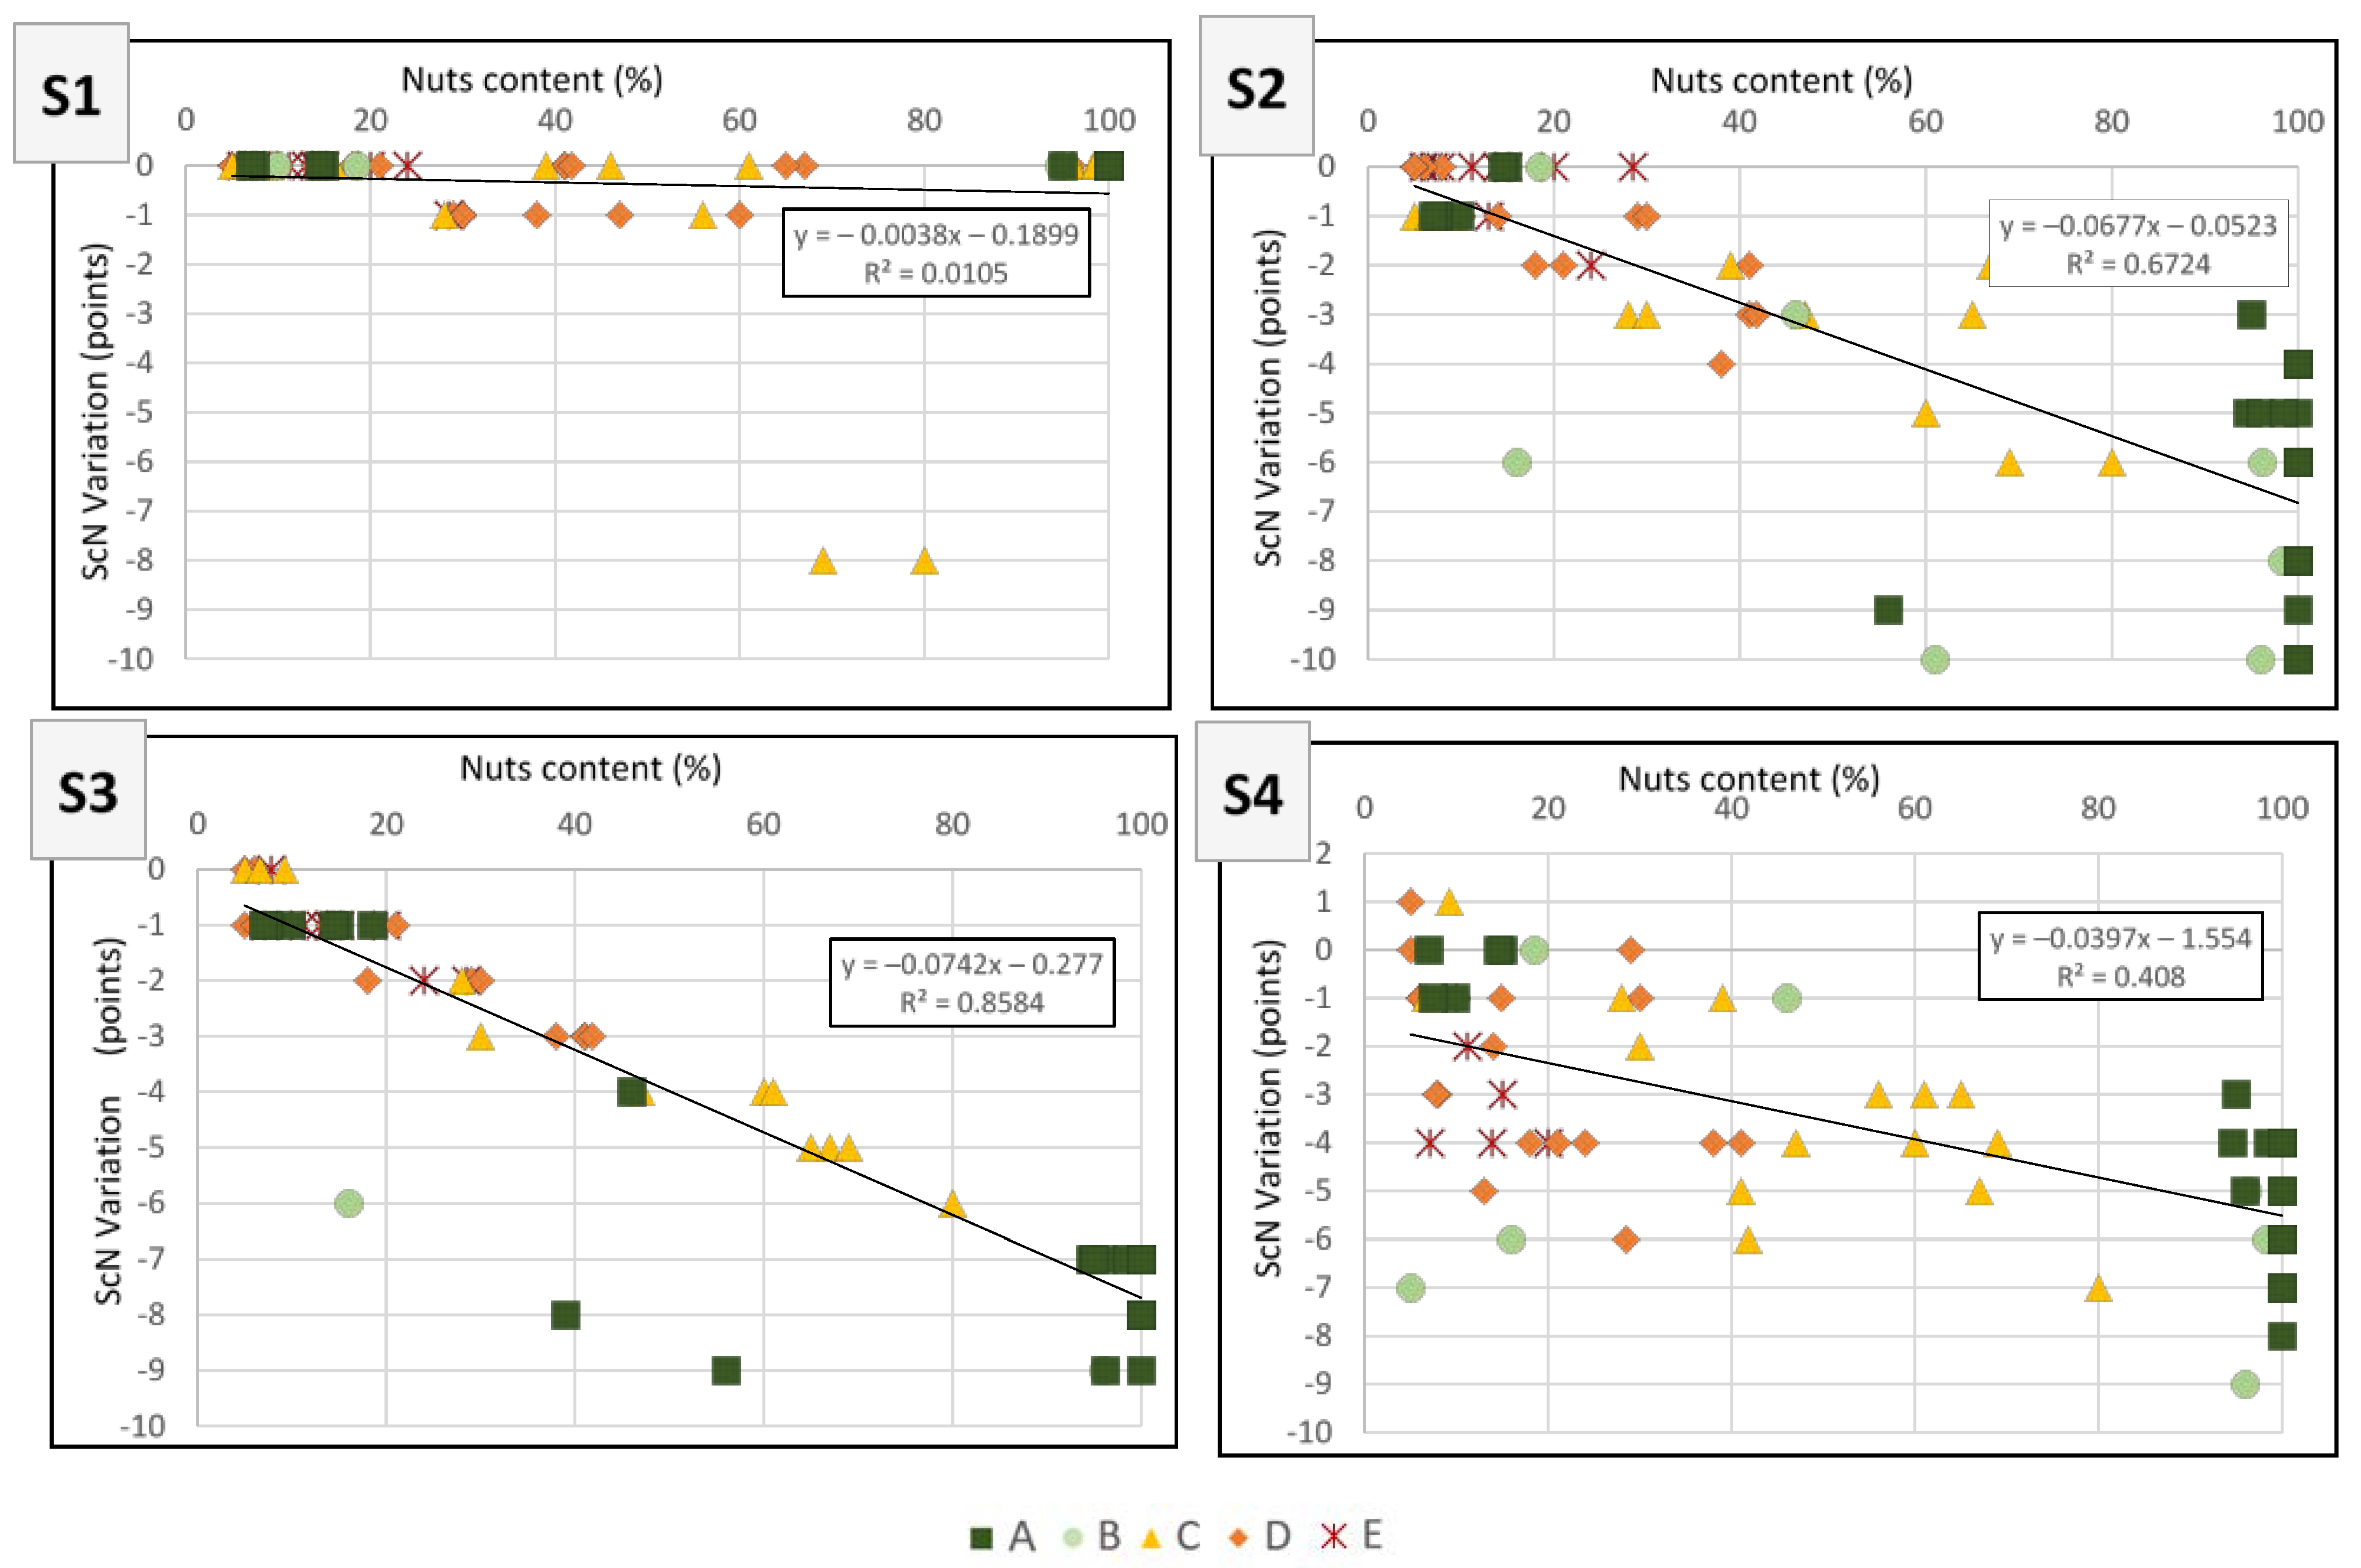
| Correlation between nut content and variation in the ScN (R2) | / | 0.01 | 0.67 | 0.86 | 0.41 |
| Regression coefficient between nut content and variation in the ScN | / | −0.0038 | −0.068 | −0.074 | −0.040 |
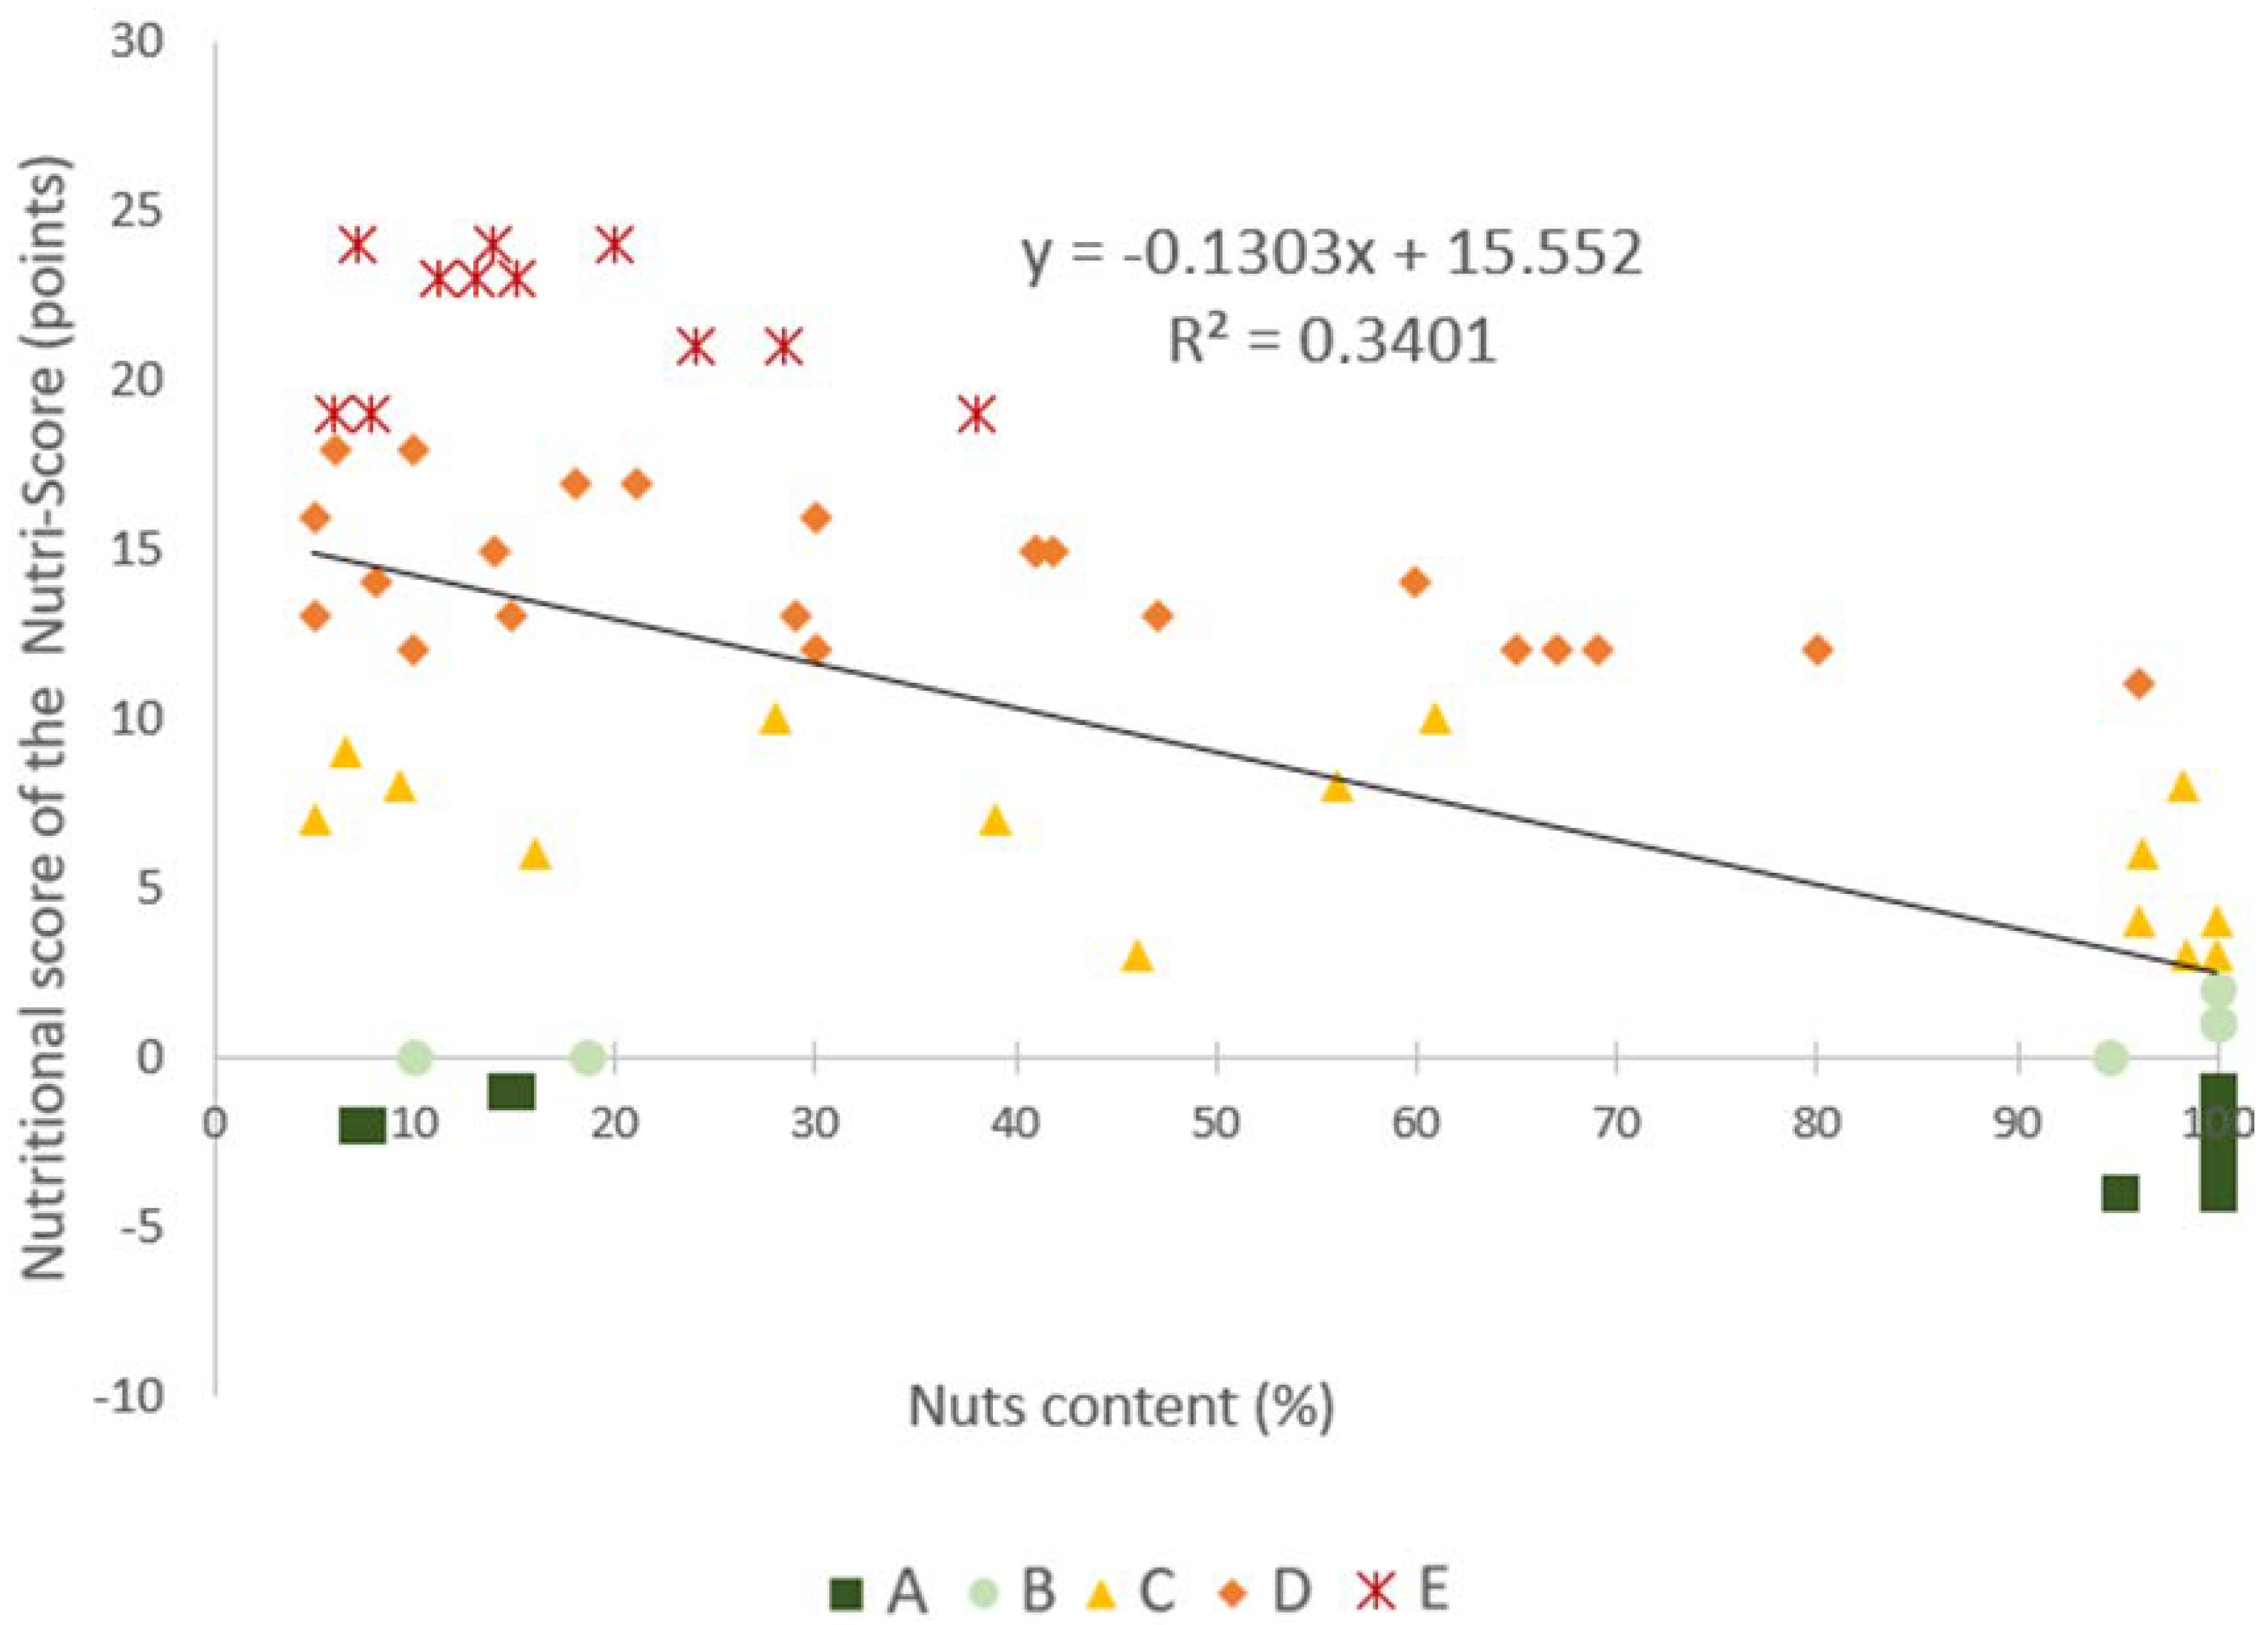
| Correlation between nut content and ScN (R2) | 0.34 | 0.36 | 0.54 | 0.55 | 0.52 |
| S1 | S2 | S3 | S4 | |||||
|---|---|---|---|---|---|---|---|---|
| Less than 40% Nuts | More than 40% Nuts | Less than 40% Nuts | More than 40% Nuts | Less than 40% Nuts | More than 40% Nuts | Less than 40% Nuts | More than 40% Nuts | |
| R2 between nut content and variation in the ScN | 0.51 | 0.60 | 0.23 | 0.20 | 0.46 | 0.68 | 0.023 | 0.20 |
| R2 between nut content and ScN | 0.0043 | 0.026 | 0.00036 | 0.73 | 0.00095 | 0.72 | 0.0043 | 0.76 |
Publisher’s Note: MDPI stays neutral with regard to jurisdictional claims in published maps and institutional affiliations. |
© 2022 by the authors. Licensee MDPI, Basel, Switzerland. This article is an open access article distributed under the terms and conditions of the Creative Commons Attribution (CC BY) license (https://creativecommons.org/licenses/by/4.0/).
Share and Cite
Braesco, V.; Ros, E.; Govindji, A.; Bianchi, C.; Becqueriaux, L.; Quick, B. A Slight Adjustment of the Nutri-Score Nutrient Profiling System Could Help to Better Reflect the European Dietary Guidelines Regarding Nuts. Nutrients 2022, 14, 2668. https://doi.org/10.3390/nu14132668
Braesco V, Ros E, Govindji A, Bianchi C, Becqueriaux L, Quick B. A Slight Adjustment of the Nutri-Score Nutrient Profiling System Could Help to Better Reflect the European Dietary Guidelines Regarding Nuts. Nutrients. 2022; 14(13):2668. https://doi.org/10.3390/nu14132668
Chicago/Turabian StyleBraesco, Véronique, Emilio Ros, Azmina Govindji, Clélia Bianchi, Lise Becqueriaux, and Belinda Quick. 2022. "A Slight Adjustment of the Nutri-Score Nutrient Profiling System Could Help to Better Reflect the European Dietary Guidelines Regarding Nuts" Nutrients 14, no. 13: 2668. https://doi.org/10.3390/nu14132668
APA StyleBraesco, V., Ros, E., Govindji, A., Bianchi, C., Becqueriaux, L., & Quick, B. (2022). A Slight Adjustment of the Nutri-Score Nutrient Profiling System Could Help to Better Reflect the European Dietary Guidelines Regarding Nuts. Nutrients, 14(13), 2668. https://doi.org/10.3390/nu14132668


