Abstract
Weight loss is a factor that affects prognosis in patients with chronic obstructive pulmonary disease (COPD) independent of lung function. One of the major factors for weight loss is energy malnutrition. There have been no reports on the factors related to energy malnutrition in COPD patients. This retrospective observational study aimed to investigate these factors. We included 163 male subjects with COPD. Respiratory quotient (RQ), an index of energy malnutrition, was calculated by expiratory gas analysis using an indirect calorimeter. RQ < 0.85 was defined as the energy-malnutrition group and RQ ≥ 0.85 as the no energy-malnutrition group. Factors related to energy malnutrition were examined by multivariate and decision-tree analysis. We finally analyzed data from 56 selected subjects (median age: 74 years, BMI: 22.5 kg/m2). Energy malnutrition was observed in 43%. The independent factors associated with energy malnutrition were tidal volume (VT) (OR 0.99; 95% CI 0.985–0.998; p = 0.015) and Th12 erector spinae muscle cross-sectional area SMI (Th12ESMSMI) (OR 0.71; 95% CI 0.535–0.946; p = 0.019). In decision-tree profiling of energy malnutrition, VT was extracted as the first distinguishable factor, and Th12ESMSMI as the second. In ROC analysis, VT < 647 mL (AUC, 0.72) or Th12ESMSMI < 10.1 (AUC, 0.70) was the cutoff value for energy malnutrition. Energy malnutrition may be an early warning sign of nutritional disorders.
1. Introduction
In Japan, about 70% of patients with chronic obstructive pulmonary disease (COPD) have a %ideal body weight (%IBW) of less than 90%, and the frequency of nutritional disorders is higher than in Europe and the United States [1,2,3,4]. Malnutrition in COPD patients is associated with cachexia, sarcopenia, and weight loss and may increase the risk of decreased lung function and decreased exercise capacity [5]. Weight loss is a prognostic factor for COPD patients independent of lung function [6,7]. The cause of weight loss is increased muscle protein catabolism due to energy shortage caused by decreased energy intake and increased resting energy expenditure caused by effortful breathing and inflammatory cytokines [8]. It has been reported that nutritional therapy is indicated when %IBW < 90% [9], and aggressive nutritional support therapy is necessary when %IBW < 80% [10]. Thus, weight loss is a significant risk factor in COPD patients.
In general, one of the major factors for weight loss is starvation or energy malnutrition. It was reported that weight loss in COPD was mainly due to inadequate nutritional intake [11]. Among malnutrition, the state in which the body lacks the energy to move is called energy malnutrition and is generally referred to as starvation [12]. In a state of starvation, hepatic glycogen is broken down to supply glucose, but the amount of glucose stored is small and is depleted within a few hours [13]. In addition, skeletal muscle mass decreases from 3 to 4 days after starvation because energy is produced by freeing protein and fat from muscles [14]. Therefore, patients who have a long fasting time at night may suffer from short-term starvation due to glycogen depletion, resulting in a reduction in skeletal muscle mass.
In elderly COPD patients, in addition to decreased energy intake and increased resting energy expenditure due to effortful breathing and inflammatory cytokines, there is often a long fasting time between dinner and breakfast. This means that there is a possibility of starvation, or energy malnutrition, in the early morning. Determination of early morning starvation or energy malnutrition and examination of its associated factors will contribute to the early detection and prevention of malnutrition and weight loss. However, there have been no reports on factors related to energy malnutrition in COPD patients. In this study, we used an indirect calorimeter to measure metabolism during early morning fasting. We calculated the respiratory quotient (RQ), which is an index of energy malnutrition, and investigated the actual state of energy malnutrition in patients with stable COPD. Furthermore, we examined the relationship between respiratory function, biochemical blood tests, muscle mass, and physical function.
2. Methods
2.1. Study Design and Subjects
This study was a retrospective observational study designed to investigate the factors associated with energy malnutrition in male outpatients with COPD. From October 2020 to March 2021, a total of 163 male outpatients with COPD attended Japan Community Health Care Organization Saga Central Hospital. Inclusion criteria: male outpatients with COPD who (1) were 60 years of age or older, (2) able to perform all physical function tests, and (3) had undergone a biochemical examination and CT scans for Th12 level.
2.2. Measurement of Energy Metabolism
Energy metabolism was measured with the use of an indirect calorimeter (Aeromonitor AE-300S; Minato Medical Science, Tokyo, Japan). Subjects were not to eat or drink anything after 9:00 p.m. on the day before the measurement, except for the consumption of calorie-free water or tea. In addition, the amount of food eaten on the day before the measurement was questioned to confirm. There were no subjects who had insufficient food intake. All measurements were taken at 9:30 a.m. in a fasted state after bed rest for at least 30 min as in previous studies [15]. Oxygen consumption (VO2) and carbon dioxide production (VCO2) were measured for 15 min, and the average of the last 10 min was used for analysis [16]. The measured VO2 and VCO2 were then used to calculate the RQ for each patient (RQ = VCO2/VO2). The RQ is a dimensionless number used in calculations of basal metabolic rate (BMR) when estimated from carbon dioxide production. It is calculated from the ratio of carbon dioxide produced by the body to oxygen consumed by the body. The respiratory quotient value indicates which macronutrients are being metabolized, as different energy pathways are used for fats, carbohydrates, and proteins [17]. In addition, resting energy expenditure (REE), respiratory rate (RR), tidal volume (VT), minute ventilation (VE), carbohydrate oxidation rate, and fat oxidation rate were measured. The carbohydrate oxidation rate and fat oxidation rate were calculated using Elwyn’s energy calculation formula [18]. Basal energy expenditure (BEE) was predicted with the Harris–Benedict equation.
2.3. Diagnosis of Energy Malnutrition
In general, the turning point for the substrate of thermogenesis from carbohydrate dominant (npRQ ≥ 0.85) towards fat dominant (npRQ < 0.85) is 0.85 of non-protein RQ (npRQ) [19]. In addition, McClave SA et al. defined RQ lower than 0.85 as underfeeding and higher than 1.0 as overfeeding in the measured RQ [20]. Furthermore, liver disease indicates starvation when RQ is less than 0.85 due to insufficient glycogen accumulation in the liver; it has been reported that npRQ < 0.85 is the best cutoff value for energy malnutrition [21]. With these references, we defined RQ < 0.85 as energy malnutrition (underfeeding) and RQ ≥ 0.85 as no energy malnutrition in this study.
2.4. Anthropometry
Before measuring energy metabolism, anthropometry measurement was performed to determine body weight, body mass index (BMI), body fat, and skeletal muscle mass using bioelectrical impedance analysis (MC-780MA-N; Tanita; Tokyo, Japan). Skeletal muscle mass was normalized by the square of height, and the data were expressed as skeletal muscle mass index (SMI).
2.5. Lung Function
Spirometry was performed by three well-trained pulmonary technologists according to the manual of the American Thoracic Society/European Respiratory Society Task Force, using the same spirometer (Autospiro AS-507, Minato Medical Science, Osaka, Japan) for all participants [22]. The forced expiratory volume in 1 s (FEV1), forced vital capacity (FVC), and FEV1/FVC ratio was obtained.
2.6. Laboratory Determinations
Venous blood was collected in the morning after 12 h of fasting. To examine liver function, lipid metabolism, glucose metabolism, and muscle metabolism, which may affect starvation, before measuring energy metabolism, blood samples were taken and analyzed for these parameters: albumin (Alb), transthyretin (TTR), C-reactive protein (CRP), aspartate aminotransferase (AST), alanine aminotransferase (ALT), gamma-glutamyl transpeptidase (GGT), total cholesterol (T-Cho), HDL cholesterol (HDL-C), LDL cholesterol (LDL-C), triglyceride (TG), creatinine (Cre), and blood glucose (BG).
2.7. Evaluation of Skeletal Muscle Mass
Skeletal muscle mass was calculated by normalization with a CT scan (Revolution EVO; GE Healthcare, Madison, WI, USA) at the level of the 12th thoracic vertebra (Th12). In this study, the cross-sectional area of total skeletal muscle and erector spinae muscle (ESM) at the Th12 level were selected [23]. This analysis was performed using a SYNAPSE VINCENT volume analyzer (FUJIFILM Medical, Tokyo, Japan). The cross-sectional muscle area was normalized by the squared height and represented as SMI.
2.8. Evaluation of Physical Function, Activities of Daily Living (ADL), and Nutrition Status
Grip strength was measured using a hand dynamometer (Digital Grip Dynamometer, Takei Scientific Instruments, Niigata, Japan). Maximum grip strength was measured three times with the dominant hand, and the maximum value was used as the measurement value. Knee extension strength was determined using a hand-held dynamometer (μTas MT-1; Anima, Tokyo, Japan). Subjects were instructed to press the dynamometer to straighten their knees. They then maintained their max efforts for an extra 5 s. Gait speed (m/s) was calculated by the 10 m walking test (10MWT) [24]. The 10MWT was performed twice, and the faster one was used for analysis. The Timed Up and Go Test (TUG) is to measure the time required for a patient to rise from an armless chair, walk a three-meter distance, turn around, return to the chair, and take a seat [25]. The test was performed twice at maximum speed, and the fastest result was selected for analysis. The 5-time chair stand test (CS-5) was performed according to the Asian Working Group for Sarcopenia protocol. The test was evaluated by the time required to stand 5 times from a sitting position while arms were folded across the chest [26]. The test was performed once at maximum effort. The 6 min walk test (6MWT) was measured as described in the American Thoracic Society (ATS) guidelines [27]. The maximum walking distance was used for analysis. The Nagasaki University Respiratory ADL questionnaire (NRADL) was used to assess activities of daily living [28]. The Mini Nutritional Assessment®-short form (MNA-SF) assessed nutritional status. Subjects whose total score < 12 were categorized as at risk for malnutrition, while those whose total score ≥ 12 were categorized as having normal nutrition status [29].
2.9. Statistical Analysis
Data were represented as median (interquartile range (IQR)), range, or number. Values for differences between the energy malnutrition and non-energy malnutrition groups were analyzed by use of Wilcoxon rank-sum tests. In addition, logistic regression analysis was used to analyze the independent factors related to energy malnutrition. For the selection of candidates for logistic regression analysis, we used the single factor regression analysis (Spearman’s tests). Factors associated with energy malnutrition were profiled using decision tree analysis. A decision-tree algorithm is a data-mining technique that reveals a series of classification rules by identifying priorities and therefore allows clinicians to choose an option that maximizes the benefit for the patient [30]. Decision trees are a popular modeling technique in economics and clinical practice and have proved their usefulness in human medicine [31,32,33]. Finally, the Receiver Operating Characteristic (ROC) curve using the Youden index was used to determine the best cutoff value of independent factors to discriminate RQ < 0.85. All statistical analyses were conducted using Statistical Analysis Software (JMP Pro version 15.0; SAS Institute, Cary, NC, USA). The statistical significance level was set at p < 0.05.
3. Results
We finally analyzed data from 56 selected subjects who fulfilled the criteria for exclusion as follows: outpatients with COPD who (1) had severe liver malfunction; (2) had severe diabetes; (3) suffered from inflammatory, endocrine, or gastrointestinal diseases; (4) had other malignancies, malabsorption, or motor disorders; (5) were using home oxygen (because the RQ cannot be accurately measured) (Figure 1).
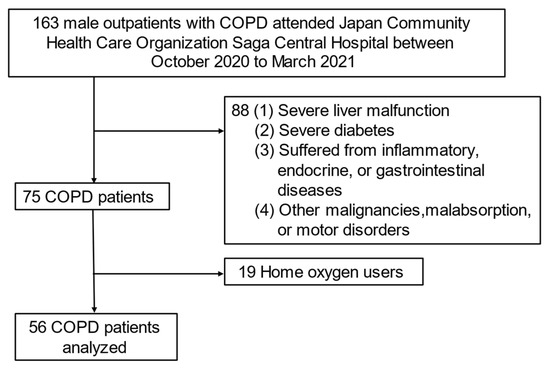
Figure 1.
Flowchart of subject recruitment in this study. Abbreviation: COPD—chronic obstructive pulmonary disease.
3.1. Subjects’ Characteristics
The characteristics of the subjects are listed in Table 1. The subjects had a median age of 74 years, 100% of whom were male, and a median BMI of 22.5 kg/m2. Subjects with GOLD stage I, II, III, and IV were 21.4%, 41.0%, 32.1%, and 5.3%, respectively. Subjects with mMRC dyspnea scale score 0, 1, 2, 3 and 4 were 25.0%, 46.4%, 14.2%, 10.7% and 3.5%, respectively. The median MNA-SF was 12 points, and the nutritional status was comparably normal. The median NRADL score was 95, and the median patient was almost independent in ADL. The median Alb, total TTR, and CRP were 4.2 g/dL, 28.3 mg/dL, and 0.09 mg/dL, respectively. The median T-Cho, Cre and BG were 197.5 mg/dL, 0.87 mg/dL and 103.0 mg/dL, respectively. The median RQ was 0.85, and the median energy oxidation rate was 50.8% for carbohydrates and 49.2% for fats (Table 1).

Table 1.
Subject characteristics.
3.2. Comparison of Baseline, Energy Metabolism, Biochemical Tests, Body Composition, Physical Function, and Muscle Mass between Subjects with and without Energy Malnutrition (RQ < 0.85 and RQ ≥ 0.85)
In univariate analysis, no significant difference was found in age, BMI, %IBW, GOLD stage, the severity of dyspnea, and lung function between the with and without energy malnutrition groups. Subjects in the energy malnutrition (RQ < 0.85) group had significantly lower carbohydrate oxidation rate, had significantly higher fat oxidation rate, and had significantly lower VT than subjects in the non-energy malnutrition group (RQ ≥ 0.85). However, there was not any significant difference in REE, RR, or VE between the two groups. Subjects in the energy malnutrition (RQ < 0.85) group had significantly lower MNA-SF scores and had significantly lower Th12 muscle mass, Th12ESM mass, and Th12ESMSMI than subjects in the non-energy malnutrition group (RQ ≥ 0.85). Otherwise, there were no significant differences in biochemical tests, body composition, or physical function between the two groups (Table 2).
Table 2.
Comparison of baseline, energy metabolism, biochemical tests, body composition, physical function, and muscle mass in subjects with and without energy malnutrition (with RQ < 0.85 and RQ ≥ 0.85).
3.3. Logistic Regression Analysis and Decision-Tree Analysis for Energy Malnutrition
The results of single regression analysis (spearman’s tests) between RQ and other parameters showed that VT (r = 0.349, p = 0.0084), Th12ESMSMI (r = 0.390, p = 0.0035) and MNA-SF (r = 0.360, p = 0.0063) were significantly correlated. In a logistic regression analysis with VT, Th12ESMSMI, and MNA-SF as explanatory variables and energy malnutrition as an objective variable, the independent negative risk factors for energy malnutrition were both VT (OR 0.99; 95% CI 0.984–0.998; p = 0.010) and Th12ESMSMI (OR 0.73; 95% CI 0.517–0.978; p = 0.034) (Table 3). The decision-tree analysis revealed that the following three profiles were related to energy malnutrition: Profile 1) VT < 701 mL, Profile 2) Th12ESMSMI < 9.59, and Profile 3) BMI < 22.6 and %FEV1 < 58.2% (Figure 2).
Table 3.
Logistic regression analysis for energy malnutrition (RQ < 0.85).
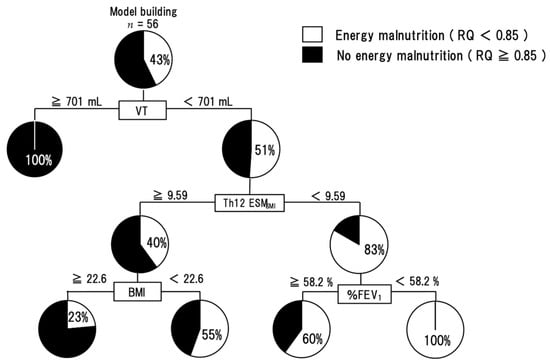
Figure 2.
A decision-tree analysis for energy malnutrition. The pie graphs indicate the proportion of subjects with RQ < 0.85 (white) and subjects with RQ ≥ 0.85 (black). Abbreviation: RQ—respiratory quotient; Th12 ESMSMI—skeletal muscle index of Th12 Erector Spinae muscles; VT—tidal volume; BMI—body mass index; %FEV1—FEV1 predicted.
3.4. VT and Th12 ESMSMI for Discrimination of Energy Malnutrition
The ROC curve was analyzed to establish the optimal cutoff value for VT or Th12ESMSMI for distinguishing energy malnutrition. When the VT cutoff value was set at 647 mL, the area under the curve (AUC) was 0.72, and the sensitivity and specificity were 87% and 50%, respectively. Furthermore, when the cutoff value of Th12ESMSMI was set at 10.1, the AUC was 0.70, with a sensitivity of 65% and specificity of 74% (Figure 3).
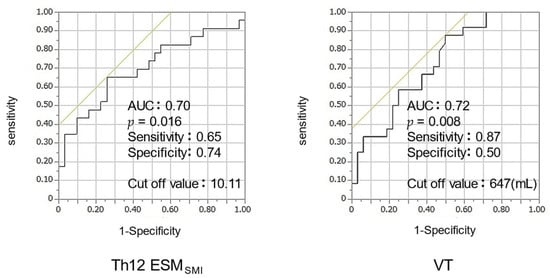
Figure 3.
ROC analysis of Th12 ESMSMI, VT for energy malnutrition. Abbreviation: ROC—receiver operating characteristic, Th12 ESMSMI—skeletal muscle index of Th12 Erector Spinae muscles; VT—tidal volume.
4. Discussion
This study is the first to investigate the factors related to energy malnutrition in stable COPD subjects by calculating the RQ through exhaled gas analysis using an indirect calorimeter. We have shown that energy malnutrition was seen in 43% of subjects with stable COPD. The independent factors associated with energy malnutrition were VT and Th12ESMSMI.
In the patient background, 43% had energy malnutrition. This indicates that 43% of the subjects metabolize fat significantly more than carbohydrates, which may indicate a shift toward weight loss. It was reported that weight loss with a BMI of less than 20 kg/m2 was seen in about 30% of patients, even though patients with mild to moderate disease accounted for about 70% [34]. In addition, it has been reported that a decrease in fat mass can be observed in mild weight loss (80% ≤ %IBW < 90%), and a decrease in lean mass can be observed in moderate or greater weight loss (%IBW < 80%) [4]. In the current study, 43% of the subjects had energy malnutrition, although the severity of the disease was about the same, and the %IBW was greater than in previous reports. This may suggest that the signs of weight loss may have been caught early.
In a logistic regression analysis, VT was identified to be a risk factor for energy malnutrition (RQ < 0.85). Regarding the relationship between VT and malnutrition, Arora NS et al. reported that malnutrition decreases both respiratory muscle strength and maximal spontaneous ventilation, possibly impairing respiratory muscle strength to cope with the increased ventilatory load in thoraco-pulmonary disease [35]. In addition, Yoneda T et al. reported that the degree of airway obstruction and respiratory muscle function was associated with malnutrition characterized by the reduction of the Fischer ratio [36]. Taken together, although we did not measure respiratory muscle strength in this study, we hypothesize that the decrease in VT was due to the decrease in respiratory muscle strength caused by energy malnutrition. However, lung hyperinflation may also be a factor in the decline in VT. Although no index of lung hyperinflation has been measured in this study, lung hyperinflation is highly dependent on the degree of breathlessness [37]. In this study, there was no significant difference in the mMRC dyspnea scale score between the energy malnutrition and no energy malnutrition groups. Therefore, we hypothesized that the effect of lung hyperinflation may be small. We also discussed the association between VT and RQ. There was no significant increase in RR in the energy malnutrition group. However, the decrease in VT may cause inadequate expiration, and RR may compensate for this condition.
In addition, logistic regression analysis identified Th12ESMSMI as a risk factor for energy malnutrition. Nutritional impairment in COPD patients has been reported to cause a high rate of lean body mass loss [1]. However, in this study, there was no significant difference in lean body mass measured by the BIA and a significant difference in ESM muscle mass on CT in the energy malnutrition group compared to the non-energy malnutrition group, and there was. It has been reported that ESM cross-sectional area by chest CT correlates with COPD clinical parameters and is a strong risk factor for overall mortality in COPD patients [23,38,39,40]. The relationship between ESM muscle mass and nutritional status is still unclear. However, in our study, ESM muscle mass was associated with energy malnutrition, suggesting that a decrease in ESM muscle mass may be associated with the early state of nutritional disorders.
As a result of the profiling of energy malnutrition by decision tree analysis, the group with VT less than 701 mL, Th12ESMSMI less than 9.59, and %FEV1 less than 58.2% had 100% energy malnutrition (Figure 2). All of these factors are informed by daily clinical practice and may indicate the need for early nutritional intervention in patients who match the previously described criteria. These indices may be useful as indicators of the risk of energy malnutrition during pulmonary function tests and chest computed tomography in clinical practice.
In the ROC analysis, the cutoff values for energy malnutrition were VT < 647 mL (AUC, 0.72) or Th12 ESMSMI < 10.1 (AUC, 0.70) (Figure 3). Both VT and Th12 ESMSMI showed AUC ≥ 0.7, indicating moderate accuracy. These indices may be useful as indicators of the risk of energy malnutrition during pulmonary function tests and chest computed tomography in clinical practice.
This retrospective observational study has several limitations. First, the number of subjects was too small to allow for sufficient multivariate analysis. Second, the study was conducted at a single center, which may have led to various selection biases. Third, subjects on home oxygen were excluded from the study because of metabolic measurements by indirect calorimetry, and subjects with severe disease were not included. Therefore, further studies designed as prospective, multicenter studies in COPD patients with various conditions are required to explore the impact of energy malnutrition on skeletal muscle and physical functional performance in COPD patients. Moreover, as for metabolic measurements, we could not measure non-protein RQ because of the lack of 24-h urine storage in outpatients. Therefore, we could not take into account the energy metabolism of protein.
5. Conclusions
In conclusion, we have shown that 43% of the subjects with stable COPD had energy malnutrition, suggesting the possibility of early nutritional impairment and the need for early nutritional intervention. Furthermore, the factors associated with energy malnutrition were VT and Th12ESMSMI. Energy malnutrition may be an early warning sign of nutritional disorders. Taken together, it is beneficial to be able to predict energy malnutrition using clinical indicators.
Author Contributions
M.T.: conceptualization; data curation; formal analysis; investigation; methodology; visualization; writing—original draft. M.U.: formal analysis; investigation; supervision; writing—original draft; writing—review and editing. Y.I.: investigation; writing—review and editing. M.M.: investigation; writing—review and editing. E.T.: investigation; writing—review and editing. M.K.: investigation; project administration; supervision; writing—review and editing. All authors have read and agreed to the published version of the manuscript.
Funding
This research received no external funding.
Institutional Review Board Statement
This study was performed in accordance with the Declaration of Helsinki. This human study was approved by the institutional review board of the Japan Community Health Care Organization Saga Central Hospital-approval: 310013. Trial registration number: UMIN, No. UMIN000045128. All adult participants provided written informed consent to participate in this study.
Informed Consent Statement
Informed consent was obtained from all subjects involved in the study.
Data Availability Statement
All data generated or analyzed during this study are included in this article. Further inquiries can be directed to the corresponding author.
Acknowledgments
We would like to thank Minato Medical Science (Tokyo, Japan) for the support of the equipment. We would also like to thank Yusuke Nanri of the Department of Rehabilitation, Japan Community Health Care Organization Saga Central Hospital, Associate Hiroo Matsuse, and Naoto Shiba of the Department of Orthopedics, Kurume University School of Medicine, for their help in writing this manuscript.
Conflicts of Interest
The authors declare no conflict of interest.
References
- Schols, A.M.; Soeters, P.B.; Dingemans, A.M.; Mostert, R.; Frantzen, P.J.; Wouters, E.F. Prevalence and characteristics of nutritional depletion in patients with stable COPD eligible for pulmonary rehabilitation. Am. Rev. Respir. Dis. 1993, 147, 1151–1156. [Google Scholar] [CrossRef]
- Engelen, M.P.; Schols, A.M.; Baken, W.C.; Wesseling, G.J.; Wouters, E.F. Nutritional depletion in relation to respiratory and peripheral skeletal muscle function in out-patients with COPD. Eur. Respir. J. 1994, 7, 1793–1797. [Google Scholar] [CrossRef]
- Wilson, D.O.; Rogers, R.M.; Wright, E.C.; Anthonisen, N.R. Body weight in chronic obstructive pulmonary disease. The National Institutes of Health Intermittent Positive-Pressure Breathing Trial. Am. Rev. Respir. Dis. 1989, 139, 1435–1438. [Google Scholar] [CrossRef]
- Yoshikawa, M.; Yoneda, T.; Fu, A.; Yamamoto, C.; Takenaka, H.; Nakaya, M.; Kobayashi, A.; Tokuyama, T.; Okamoto, Y.; Narita, N. Analysis of body composition by dual energy X-ray absorptiometry and its relation to pulmonary function in patients with pulmonary emphysema. Nihon Kyobu Shikkan Gakkai Zasshi 1996, 34, 953–958. [Google Scholar]
- Thomas, D.R. Loss of skeletal muscle mass in aging: Examining the relationship of starvation, sarcopenia and cachexia. Clin. Nutr. 2007, 26, 389–399. [Google Scholar] [CrossRef]
- Cao, C.; Wang, R.; Wang, J.; Bunjhoo, H.; Xu, Y.; Xiong, W. Body mass index and mortality in chronic obstructive pulmonary disease: A meta-analysis. PLoS ONE 2012, 7, e43892. [Google Scholar] [CrossRef]
- Kwan, H.Y.; Maddocks, M.; Nolan, C.M.; Jones, S.E.; Patel, S.; Barker, R.E.; Kon, S.S.C.; Polkey, M.I.; Cullinan, P.; Man, W.D. The prognostic significance of weight loss in chronic obstructive pulmonary disease-related cachexia: A prospective cohort study. J. Cachexia Sarcopenia Muscle 2019, 10, 1330–1338. [Google Scholar] [CrossRef]
- Yoneda, T.; Yoshikawa, M.; Fu, A.; Tsukaguchi, K.; Okamoto, Y.; Takenaka, H. Plasma levels of amino acids and hypermetabolism in patients with chronic obstructive pulmonary disease. Nutrition 2001, 17, 95–99. [Google Scholar] [CrossRef]
- Schols, A.M. Nutritional and metabolic modulation in chronic obstructive pulmonary disease management. Eur. Respir. J. 2003, 46, 81s–86s. [Google Scholar] [CrossRef]
- Yoneda, T.; Yoshikawa, M.; Fu, A.; Tsukaguchi, K.; Takenaka, H.; Narita, N. Nutritional care of patients with respiratory insufficiency. Nihon Naika Gakkai Zasshi 1999, 88, 94–99. [Google Scholar]
- Jung, J.W.; Yoon, S.W.; Lee, G.E.; Shin, H.G.; Kim, H.; Shin, J.W.; Park, I.W.; Choi, B.W.; Kim, J.Y. Poor nutritional intake is a dominant factor for weight loss in chronic obstructive pulmonary disease. Int. J. Tuberc. Lung Dis. 2019, 23, 631–637. [Google Scholar] [CrossRef]
- The State of Food Security and Nutrition in the World 2019, FAO: Food and Agriculture Organization of the United Nations. Available online: https://www.fao.org/3/ca5162en/ca5162en.pdf (accessed on 15 November 2021).
- Siobhan, A.C. Systemic response to injury and metabolic support. In Schwartz’s Principles of Surgery; Brunicardi, F.C., Ed.; McGraw-Hill Professional: New York, NY, USA, 2004; pp. 3–41. [Google Scholar]
- Nair, K.S.; Woolf, P.D.; Welle, S.L.; Matthews, D.E. Leucine, glucose, and energy metabolism after 3 days of fasting in healthy human subjects. Am. J. Clin. Nutr. 1987, 46, 557–562. [Google Scholar] [CrossRef]
- Kovarik, M.; Najpaverova, S.; Koblizek, V.; Zadak, Z.; Hronek, M. Association of resting energy expenditure and nutritional substrate oxidation with COPD stage and prediction indexes. Respir. Med. 2020, 174, 106174. [Google Scholar] [CrossRef]
- Yamanaka-Okumura, H.; Nakamura-Kutsuzawa, T.; Teramoto, A.; Urano, E.; Katayama, T.; Miyake, H.; Imura, S.; Utsunomiya, T.; Shimada, M.; Taketda, A. Non-esterified fatty acid is being validated as a substitute measure for non-protein respiratory quotient in patients with cirrhosis. e-SPEN J. 2013, 8, 90–94. [Google Scholar] [CrossRef]
- Widmaier, E.P.; Raff, H.; Strang, K.T.; Vander, A.J. Vander’s Human Physiology: The Mechanisms of Body Function, 14th ed.; McGraw-Hill: New York, NY, USA, 2016; pp. 622, 638, 691, 697. [Google Scholar]
- Bursztein, S.; Elwyn, D.H.; Askanazi, J.; Kinney, J.M. (Eds.) Energy Metabolism, Indirect Calorimetry, and Nutrition; William & Wilkins: Baltimore, MD, USA, 1989; pp. 17–21. [Google Scholar]
- Tajika, M.; Kato, M.; Mohri, H.; Miwa, Y.; Kato, T.; Ohnishi, H.; Moriwaki, H. Prognostic value of energy metabolism in patients with viral liver cirrhosis. Nutrition 2002, 18, 229–234. [Google Scholar] [CrossRef]
- McClave, S.A.; Lowen, C.C.; Kleber, M.J.; McConnell, J.W.; Jung, L.Y.; Goldsmith, L.J. Clinical use of the respiratory quotient obtained from indirect calorimetry. J. Parenter. Enter. Nutr. 2003, 27, 21–26. [Google Scholar] [CrossRef]
- Kotoh, Y.; Saeki, I.; Yamasaki, T.; Sasaki, R.; Tanabe, N.; Oono, T.; Maeda, M.; Hidaka, I.; Ishikawa, T.; Takami, T.; et al. Albumin-bilirubin score as a useful predictor of energy malnutrition in patients with hepatocellular carcinoma. Clin. Nutr. 2021, 40, 3585–3591. [Google Scholar] [CrossRef]
- Miller, M.R.; Hankinson, J.; Brusasco, V.; Burgos, F.; Casaburi, R.; Coates, A.; Crapo, R.; Enright, P.; van der Grinten, C.P.; Gustafsson, P.; et al. Standardisation of spirometry. Eur. Respir. J. 2005, 26, 319–338. [Google Scholar] [CrossRef]
- Tanimura, K.; Sato, S.; Fuseya, Y.; Hasegawa, K.; Uemasu, K.; Sato, A.; Oguma, T.; Hirai, T.; Mishima, M.; Muro, S. Quantitative Assessment of Erector Spinae Muscles in Patients with Chronic Obstructive Pulmonary Disease. Novel Chest Computed Tomography-derived Index for Prognosis. Ann. Am. Thorac. Soc. 2016, 13, 334–341. [Google Scholar] [CrossRef]
- Murray, M.P. Gait as a total pattern of movement. Am. J. Phys. Med. 1967, 46, 290–333. [Google Scholar]
- Podsiadlo, D.; Richardson, S. The timed “Up & Go”: A test of basic functional mobility for frail elderly persons. J. Am. Geriatr. Soc. 1991, 39, 142–148. [Google Scholar] [CrossRef]
- Chen, L.K.; Woo, J.; Assantachai, P.; Auyeung, T.W.; Chou, M.Y.; Iijima, K.; Jang, H.C.; Kang, L.; Kim, M.; Kim, S.; et al. Asian Working Group for Sarcopenia: 2019 Consensus Update on Sarcopenia Diagnosis and Treatment. J. Am. Med. Dir. Assoc. 2020, 21, 300–307.e302. [Google Scholar] [CrossRef]
- Robert, O.C.; Richard, C.; Allan, L.C.; Paul, L.E.; Neil, R.M.; Roy, T.M.; Douglas, J.; Jack, S.W.; Jorge, Z. ATS statement: Guidelines for the six-minute walk test. Am. J. Respir. Crit. Care Med. 2002, 166, 111–117. [Google Scholar] [CrossRef]
- Yoza, Y.; Ariyoshi, K.; Honda, S.; Taniguchi, H.; Senjyu, H. Development of an activity of daily living scale for patients with COPD: The Activity of Daily Living Dyspnoea scale. Respirology 2009, 14, 429–435. [Google Scholar] [CrossRef][Green Version]
- Rubenstein, L.Z.; Harker, J.O.; Salvà, A.; Guigoz, Y.; Vellas, B. Screening for undernutrition in geriatric practice: Developing the short-form mini-nutritional assessment (MNA-SF). J. Gerontol. A Biol. Sci. Med. Sci. 2001, 56, M366–M372. [Google Scholar] [CrossRef]
- Yamada, S.; Kawaguchi, A.; Kawaguchi, T.; Fukushima, N.; Kuromatsu, R.; Sumie, S.; Takata, A.; Nakano, M.; Satani, M.; Tonan, T.; et al. Serum albumin level is a notable profiling factor for non-B, non-C hepatitis virus-related hepatocellular carcinoma: A data-mining analysis. Hepatol. Res. 2014, 44, 837–845. [Google Scholar] [CrossRef]
- Esteban, C.; Arostegui, I.; Moraza, J.; Aburto, M.; Quintana, J.M.; Pérez-Izquierdo, J.; Aizpiri, S.; Capelastegui, A. Development of a decision tree to assess the severity and prognosis of stable COPD. Eur. Respir. J. 2011, 38, 1294–1300. [Google Scholar] [CrossRef]
- Metting, E.I.; In ’t Veen, J.C.; Dekhuijzen, P.N.; van Heijst, E.; Kocks, J.W.; Muilwijk-Kroes, J.B.; Chavannes, N.H.; van der Molen, T. Development of a diagnostic decision tree for obstructive pulmonary diseases based on real-life data. ERJ Open Res. 2016, 2, 00077-2015. [Google Scholar] [CrossRef]
- Zhang, S.; Zhang, K.; Yu, Y.; Tian, B.; Cui, W.; Zhang, G. A new prediction model for assessing the clinical outcomes of ICU patients with community-acquired pneumonia: A decision tree analysis. Ann. Med. 2019, 51, 41–50. [Google Scholar] [CrossRef]
- Yoshikawa, M.; Yamauchi, M.; Yamamoto, Y. Survey of nutritional status and comorbidity in chronic obstructive pulmonary disease (COPD). Ministry of Health, Labour and Welfare, Research and Study Group on Respiratory Failure, 2008. Res. Rep. 2009, 247–251. [Google Scholar]
- Arora, N.S.; Rochester, D.F. Respiratory muscle strength and maximal voluntary ventilation in undernourished patients. Am. Rev. Respir. Dis. 1982, 126, 5–8. [Google Scholar] [CrossRef] [PubMed]
- Yoneda, T.; Yoshikawa, M.; Tsukaguchi, K.; Egawa, S.; Morikawa, A.; Kasuga, H.; Narita, N.; Enoki, Y.; Mikami, R. Nutritional assessment of chronic pulmonary emphysema and the significant relation of malnutrition to pulmonary function and respiratory muscle function. Nihon Kyobu Shikkan Gakkai Zasshi 1990, 28, 465–472. [Google Scholar] [PubMed]
- O’Donnell, D.E.; Webb, K.A. Exertional breathlessness in patients with chronic airflow limitation. The role of lung hyperinflation. Am. Rev. Respir. Dis. 1993, 148, 1351–1357. [Google Scholar] [CrossRef] [PubMed]
- Ratnovsky, A.; Elad, D.; Halpern, P. Mechanics of respiratory muscles. Respir. Physiol. Neurobiol. 2008, 163, 82–89. [Google Scholar] [CrossRef]
- Tanimura, K.; Sato, S.; Sato, A.; Tanabe, N.; Hasegawa, K.; Uemasu, K.; Hamakawa, Y.; Oguma, T.; Muro, S.; Hirai, T. Accelerated Loss of Antigravity Muscles Is Associated with Mortality in Patients with COPD. Respiration 2020, 99, 298–306. [Google Scholar] [CrossRef]
- Higashimoto, Y.; Shiraishi, M.; Sugiya, R.; Mizusawa, H.; Nishiyama, O.; Ryo, Y.; Iwanaga, T.; Chiba, Y.; Tohda, Y.; Fukuda, K. Effect of Pulmonary Rehabilitation on Erector Spinae Muscles in Individuals With COPD. Respir. Care 2021, 66, 1458–1468. [Google Scholar] [CrossRef]
Publisher’s Note: MDPI stays neutral with regard to jurisdictional claims in published maps and institutional affiliations. |
© 2022 by the authors. Licensee MDPI, Basel, Switzerland. This article is an open access article distributed under the terms and conditions of the Creative Commons Attribution (CC BY) license (https://creativecommons.org/licenses/by/4.0/).