Abstract
The nutrition status of children is gaining more attention with a rapid nutrition transition. This study aimed to investigate trends and urban-rural differences in dietary energy and macronutrient composition among Chinese children. A total of 7565 participants aged 6 to 17 years were obtained from three rounds (1991, 2004 and 2015) of the Chinese Health and Nutrition Survey (CHNS). The individual diet was evaluated via three consecutive 24-hour dietary recalls and compared with the Chinese Dietary Reference Intakes (DRIs). From 1991 to 2015, there was a significant increase in children’s fat intake, the proportion of energy intake from fat, and the proportion of children with more than 30% of energy from fat and less than 50% of energy from carbohydrates (p < 0.001). Compared with the DRI, the proportion with higher fat and lower carbohydrate intakes were, respectively, 64.7% and 46.8% in 2015. The urban-rural disparities in fat and carbohydrate intake gradually narrowed, while the gap in protein intake increased notably over time (p < 0.001). Chinese children experienced a rapid transformation to a low-carbohydrate and high-fat diet. Urban-rural disparities persistently existed; further nutritional interventions and education were of great significance, so as to ensure a more balanced diet for Chinese children.
1. Introduction
Nutritional status during childhood is crucial for health, wellness and cognitive development, as well as the future of the whole population. Unhealthy childhood nutrition increases the risk of future non-communicable diseases (NCDs), such as cardiovascular diseases, type 2 diabetes and cancers, and result in high morbidity and mortality worldwide [1]. Nutrient intake is an important implication for the nutritional status of children. The Chinese Dietary Reference Intake standard (DRI) has been used as a standard to determine the recommended dietary intake levels for Chinese people [2]. According to the DRI (2013) for Chinese children, the adequate intake of fat, protein and carbohydrates should account for 20 to 30%, 15% and 55 to 65% of total energy, respectively [3]. Appropriate macronutrient intake such as dietary fat intake in children has been shown to reduce the risk of NCDs, while excessive fat intake in children is associated with the risk of cardiovascular disease in adults [4]. Meanwhile, insufficient energy and protein is one of the most proximal and immediate determinants of child protein-energy malnutrition, which affects not only physical growth but also impaired immune system function, susceptibility to illness and cognitive deficits. Moreover, paradoxically, co-existing with under-nutrition, a global epidemic of overweight and obesity in children is taking over many parts of the world, and China is no exception. With the rapid growth of China’s economy, overweight and obesity among children have increased rapidly in the past four decades, and the latest national prevalence estimates for 2015 to 2019, based on Chinese criteria, were 11.1% for overweight and 7.9% for obesity in children aged 6 to 17 years [5,6]. As the biggest developing country in the world, children in China make up 14.8% of the population. Therefore, nutrition and health of Chinese children form an indispensable and important aspect of national sustainable development [7].
Before the economic reform, a large urban-rural gap existed in China because of the existence of many policy tendencies that favored urban residents. Since 2002, the Chinese government has vigorously promoted rural economic development and construction to make people of different backgrounds have more equitable access to various foods [8]. Previous studies have documented the trends and gaps in health disparities of Chinese rural versus urban adults [9]. Nutrition was also found to be one of the most important factors contributing to health disparities between urban and rural areas. Since children were in the early and critical stage of their physical development, the impact of the nutrition gap between urban and rural areas on children was expected to be more serious [10]. Hence, it is important to provide evidence on the determinants of child health outcomes separately for urban and rural areas, so that fundamentally different nutrition education and interventions can be designed to optimally improve the nutritional status of children in their respective settings [11].
Previous studies have assessed trends in energy and macronutrient intakes and distribution among adults [12], the elderly [13] or young children aged two to six years in China [14]. These studies demonstrated that, despite significant improvements in overall nutritional status and dietary quality, Chinese adults, young children and the elderly are experiencing a rapid nutritional transition to a high-fat, low-carbohydrate diet. Researches on the urban-rural disparities in health and nutrition status have been conducted in central areas [15] or mainly focus on adults in China [8,16]. Meanwhile, a previous longitudinal study has investigated degrees of nutritional disparities between urban and rural children in China during the period 1989 to 2006 using height for-age z-score, weight-for-age z-score, and anthropometric measurements [10]. However, to our knowledge, limited studies have compared secular trends and urban-rural differences in energy intake and macronutrient composition in Chinese children aged 6 to 17 years, and how these disparities have changed over time.
In consideration of the above knowledge gaps, the main aims of this study are to: (i) examine secular trends in dietary energy and macronutrients intakes and macronutrient distribution in the diet of children in China during 1991 to 2015; (ii) explore secular trends on the urban-rural disparities of children’s nutrition and provide evidence and suggestions for child nutrition improvement in China.
2. Methods
2.1. Design and Participants
Using data from the CHNS, an ongoing prospective study aimed to investigate the impact of the social and economic transformation of Chinese society on the health and nutrition status of its population [17]. The CHNS survey has been conducted every two or three years. A multistage, random-cluster approach was used to draw households from urban and rural areas. Additional details regarding the CHNS are provided elsewhere [18]. In order to observe and compare the degree of transformation and trends at intervals of more than a decade, the present analysis was based on three rounds (1991, 2004 and 2015) of CHNS survey data. After excluding participants who were missing key variables (n = 76) and those with extreme values (n = 64), 7565 participants aged 6 to 17 years were recruited in a survey year.
2.2. Dietary Assessment
Individual diet was assessed via three consecutive 24-h dietary recalls (two weekdays and one weekend day) in each wave of the CHNS and were collected by trained investigators who weighed all the available foods in the participants’ homes [19,20]. The mean average energy intake (kcal/day), fat intake (g/day), carbohydrate intake (g/day), and protein intake (g/day) were derived from dietary survey data from CHNS and calculated based on the Chinese food composition tables (FCTS) [21].
2.3. Socio-Demographic Data Anthropometrics
For the present study, the age of children was divided into two stages (6 to 11 years and 12 to 17 years) according to the age period of entering primary school and middle/high school in China. The geographical region was assigned as rural or urban, covering all the corresponding provinces in the CHNS survey. Participants’ height (SecA 260) and weight (SecA 880) were measured by trained health workers and BMI was further calculated (weight (kg)/square of height (m2)) [22]. Participants reported all physical activities (PA), and we converted the time spent in each activity into a metabolic equivalent of task (MET) hours per week based on the Compendium of Physical Activities [23]. As for the households’ characteristic, the highest parent education attainment was classified as primary school (or illiterate), middle school, or high school (or above). By adjusting the consumer price index, the per capita annual income in each survey was inflated to the value in 2015. Smoking and drinking status were classified into nonsmokers/smokers and nondrinkers/drinkers, respectively.
2.4. Statistical Analyses
SAS 9.4 statistical software (SAS Institute, Cary, NC, USA) was used for all statistical analyses. Continuous variables were represented by adjusted mean and standard errors (SE) and categorical variables by percentage and SE of percentage. The chi-square test was used to assess the association between the different levels (below, meeting and above the recommendations) of DRI for macronutrient. Mixed effect models were developed to calculate the adjusted intake of dietary energy, macronutrient and macronutrient-energy percentages, and to estimate the temporal trends after adjusting for intra-class correlation within clusters and covariates. The energy and macronutrient composition were treated as continuous variables and as the dependent variable, respectively, in each model. A two-tailed p < 0.05 was considered statistically significant.
3. Results
3.1. Social-Demographic Profile
The social-demographic profile of participants in three rounds of CHNS (1991, 2004, 2015) is shown in Table 1. The sample size was 2887 in 1991, 1979 in 2004 and 2699 in 2015, respectively. From 1991 to 2015, the proportion of children aged 6 to 11 years increased from 51.2% to 57.4%, the proportion of girls increased from 49.3% to 52.3%, and the proportion of urban participants increased from 26.3% to 34.5%. Meanwhile, the average BMI of children increased from 17.1 kg/m2 to 18.5 kg/m2, while the PA decreased from 85.0 MET/s to 70.2 MET/s. In addition, healthier lifestyle choice, greater than primary school education and higher household income became more prevalent over time in the household members (p < 0.001).

Table 1.
Sociodemographic characteristics of participants by CHNS rounds, 1991 to 2015 1–3.
3.2. Secular Trends in Energy Intake and Macronutrient Composition
As shown in Table 2 and Table 3, the dietary energy, protein and carbohydrate intakes of Chinese children showed a downward trend in all age groups, gender and geographical regions (p < 0.001). Specifically, the average dietary energy, protein and carbohydrate intake decreased from 2205.3 kcal/day, 63.5 g/day and 369.8 g/day in 1991 to 1671.6 kcal/day, 51.1 g/day and 247.6 g/day in 2015, respectively. However, the average dietary fat intake increased notably from 55.6 g/day in 1991 to 66.2 g/day in 2015. In 2015, urban boys aged 12 to 17 years had the most dietary fat intake (80.1 g/day), and rural boys aged 6 to 11 years had the lowest intake of dietary protein (43.4 g/day) and carbohydrates (185.6 g/day). From 1991 to 2015, the % of energy from fat in Chinese children aged 6 to 17 years increased from 24.2% to 36.8%, whereas the % of energy from carbohydrates decreased from 63.4% to 51.4%. In 2015, urban children aged 6 to 11 years had the most % of energy from fat (36.7% in boys and 37.8 in girls) but the least % of energy (49.9% in boys and 48.9% in girls) from carbohydrates.
Table 2.
Trends of the daily energy and macronutrient composition of children aged 6 to 17 years by CHNS rounds, 1991 to 2015 1–4.
Table 3.
Trends in the daily energy and macronutrient composition by region, gender and age group from CHNS round, 1991–2015 1–4.
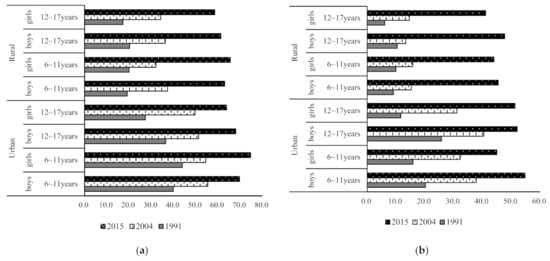
Figure 1.
Trends of the proportion of children aged 6 to 17 years with more than 30% of energy from fat and less than 50% of energy from carbohydrates. (a) The proportion of children with more than 30% of energy from fat; (b) the proportion of children with less than 50% of energy from carbohydrates.
3.3. Trends of Urban–Rural Disparities
As shown in Table 4, rural children had more dietary energy intake than that of urban children in 1991 (102.2 kcal/day), while urban children had more in 2004 (103.9 kcal/day), and this difference increased further in 2015 (113.2 kcal/day). The urban-rural disparities in dietary fat and carbohydrate intake decreased over time across all age groups and gender (p < 0.001). Generally, rural children tend to have more dietary fat intake than their urban counterparts, while the distribution of carbohydrate intake was reversed. In 2015, the average urban-rural disparities in dietary fat and carbohydrate intake were 7.0 g/day and −5.3 g/day in Chinese children, respectively. The largest urban-rural disparities of fat (8.3 g/day) and carbohydrate intake (−6.7 g/day) was observed in boys aged 12 to 17 years. It is worth noting that urban children consumed more protein than that of rural children, and the difference increased significantly over time (p < 0.001). In 2015, the average urban–rural disparity in dietary protein intake was 7.6 g/day in Chinese children.
Table 4.
Trends of the urban–rural disparities in the daily energy and macronutrient composition by gender and age group from CHNS round, 1991~2015 1–5.
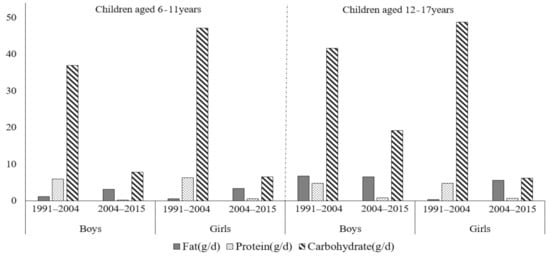
Figure 2.
Comparison of the change values of urban-rural differences in dietary fat, protein and carbohydrate intake in each of the two rounds of surveys.
4. Discussion
Using more than two decades of data from the CHNS, the present study sought to determine the nutritional status of Chinese children, which is concentrated in urban–rural differences, through a longitudinal study related to nutritional status. China has made considerable progress in the nutrition of children, and the trend of energy intake has been declining in each round of investigation. However, Chinese children experienced a fast nutritional transition to a low-carbohydrate and high-fat diet. Meanwhile, obvious urban–rural disparities persistently existed in the distribution of dietary macronutrients composition.
The analysis of CHNS data found an overall decrease in energy intakes among children at 6 to 17 years of age from 1991 to 2015, which is consistent with similar studies in other age groups (adults and elderly) in China [10,11]. Moreover, the current results are consistent with a previous study of children in the United States of America, which showed an estimated initial decline of 159 to 240 kcal/d at the median observed across all age groups [24], while another survey showed that the daily mean dietary energy intake exceeded the dietary recommendations across all gender-age groups of African American children in Baltimore city [25]. In our research, we found that the decrease in the energy intake may be due to the decrease in the energy consumption, as sedentary behaviors are common in the daily lives of modern Chinese children [26]. Findings from the Youth Study in China (2016) showed that approximately 70% of school-aged children did not meet the moderate-to-vigorous physical activity recommendations (60 min/day) [27]. There was also evidence that along with the dramatic changes occurring in China, there has been an increase in the physical inactivity of children in both urban and rural areas [28]. The present study also found that energy intake was higher in urban children in 1991, whereas the opposite was true in 2004 and thereafter. It is widely acknowledged that educational facilities are essential public service facilities in rural China [29]. Due to inadequate basic educational facilities in 1991, rural children living farther away from school needed to walk/cycle longer distances daily, which may have resulted in greater energy expenditure, requiring a higher energy intake [30].
The scientific evidence is clear that a high-fat diet relates to chronic health problems such as heart disease, cancer, diabetes, and obesity [31]. Findings from the current analysis reported an overall increase in fat intakes and the % of energy from fat among children. In 2015, the mean average % of energy from fat in Chinese children was 36.8%, which exceeded the proportion of 30% recommended in Chinese dietary guidelines. This result is in line with a previous cross-sectional study conducted in China, which reported that the % of energy from fat was 36.8% in children aged 4 to 17 years [32]. Moreover, we found a significant increase over time in the proportion of children who consumed more than 30% of their energy from fat and less than 50% of energy from carbohydrates. The findings are consistent with results from Chinese young children (aged two to six years), which showed nutritional transition to a low-carbohydrate and high-fat diet during 2000 to 2011 [12]. Similarly, findings form the Korea National Health and Examination Survey (2007 to 2017) reported that fat consumption has increased, whereas the carbohydrate intake has declined among Korean adolescents [33]. However, a previous study in German children reported that fat quantity and quality did not change substantially between 2000 and 2010 [34]. In addition, we found that urban children usually consume more fat than rural children, similar to other findings in China [31], Cambodia [35] and Thailand [36]. With the high pace of economic development, parents nowadays are more likely to buy high-fat food, which may lead to children’s rapid weight gain. Protein is considered a key nutritional component in a well-balanced diet because protein influences growth in early life. The average dietary protein intake of children in this study (51.1 g/day) was close to that of school-age children in seven cities of China (50.2 g/day). Moreover, we found a decreasing trend in dietary protein intake among Chinese children over time. The causes of the decrease in protein intake are difficult to determine and can only be conjectured. As the proportion of the protein intake contributed by plant food is 47.8% [37] and the top two foods among plant food are pulses and rice, a possible explanation was that the amount of food from plants, such as rice and beans, decreased significantly. More studies are needed to explore other possible causes. Moreover, it should be noted that urban-rural disparities in the dietary protein intake increased notably, regardless of age and gender. Considering the relatively higher education level of parents in the current study, urban children probably have more high-quality protein (animal foods, milk and eggs) intake. Therefore, the Chinese government needed to take effective measures to promote the healthy diet of Chinese children, taking into account the accelerated change of nutrition and epidemiology and the increase of the burden of NCDS.
China has made rapid economic growth and great urbanization progress over the past 24 years, and its residents are also undergoing a dramatic nutritional transformation. In 1992, the International Conference on Nutrition adopted the World Declaration and Plan of Action for Nutrition, which is a vital step in the direction of a truly global commitment to action by countries and the international community alike [38]. Since then, the Chinese government promulgated a series of policies to improve the nutritional status of children, including the Action Plan for the Improvement of Children’s Nutrition in China (1996 to 2000), the Program for the Development of Food and Nutrition in China (2001 to 2010), and the National Children’s Development Plan (2011 to 2020) [39,40]. Furthermore, the Chinese government has made tremendous contributions to poverty reduction, increasing the construction of transportation systems and increasing agricultural production, which have the potential to increase the equity of access to all kinds of food for people of different backgrounds. Especially in the latest round of surveys, the percentages of energy from fat and carbohydrates were becoming closer between urban and rural areas. To better address the challenges posed by the nutrition transition, we recommend that governments further develop and refine targets and policies to promote healthy diets for children in urban and rural areas. Meanwhile, relevant services and guidance should be provided to create an environment that promotes children’s nutritional status.
Although this study is novel in some respects, some limitations should be considered when interpreting the results. First, dietary data in the present study was obtained by three consecutive 24-hour dietary recalls. While it can be used to evaluate the average amount of a population’s diet, random errors caused by variations in individual diets could lead to over- or underestimation. Nevertheless, the average intake in three days can offer a relatively valid estimate of nutrients intakes, as shown in an earlier study using the CHNS. Second, while CHNS does describe the health and nutritional status in China, it is not a nationally representative study. Third, macronutrients are found in a wide variety of foods. This study did not analyze the diversity of food groups and the specific type of each food group consumption, which made us unable to consider which kind of food led to the above deficiency.
5. Conclusions
Chinese children have experienced a fast transformation of nutrition to a diet with high fat and low carbohydrate. Public health policymakers should pay more attention to the problem of the excessive intake of total fat and high proportion of energy from total fat. Moreover, the urban–rural disparities in energy and macronutrient composition have persistently existed. To ensure that Chinese children have a more balanced diet, further nutrition education and intervention measures still required.
Author Contributions
Conceptualization, H.W. and C.S.; formal analysis, J.Z.; writing—original draft preparation, J.Z.; writing—review and editing, H.W., L.Z. and J.S. All authors have read and agreed to the published version of the manuscript.
Funding
This research was funded by the National Key R&D Program of China (2017YFE0104600) and the National Institutes of Health, USA (R01-HD30880, DK056350, R24 HD050924, and R01-HD38700).
Institutional Review Board Statement
Ethical approval was approved by the ethics committee of the National Institute for Nutrition and Health at the Chinese Center for Disease Control and Prevention (No.201524).
Informed Consent Statement
Informed consent was obtained from the parents or guardians of the children prior to participation.
Data Availability Statement
The datasets generated and/or analyzed during the current study are not publicly available but are available from the corresponding author on reasonable request.
Conflicts of Interest
The authors declare no conflict of interest.
References
- Wang, D.; Stewart, D.; Chang, C.; Shi, Y. Effect of a school-based nutrition education program on adolescents’ nutrition-related knowledge, attitudes and behaviour in rural areas of China. Environ. Health Prev. Med. 2015, 20, 271–278. [Google Scholar] [CrossRef] [PubMed]
- Su, C.; Wang, H.; Wang, Z.; Zhang, J.; Du, W.; Zhang, J.; Zhai, F.; Zhang, B. Status and trend of fat and cholesterol intake among Chinese middle and old aged residents in 9 provinces from 1991 to 2009. J. Hyg. Res. 2013, 42, 72–77. [Google Scholar]
- Tian, X.; Wu, M.; Zang, J.; Zhu, Y.; Wang, H. Dietary diversity and adiposity in Chinese men and women: An analysis of four waves of cross-sectional survey data. Eur. J. Clin. Nutr. 2017, 71, 506–511. [Google Scholar] [CrossRef]
- Black, R.E.; Victora, C.; Walker, S.P.; Bhutta, Z.A.; Christian, P.; de Onis, M.; Ezzati, M.; Grantham-McGregor, S.; Katz, J.; Martorell, R.; et al. Maternal and child undernutrition and overweight in low-income and middle-income countries. Lancet 2013, 382, 427–451. [Google Scholar] [CrossRef]
- Pan, X.-F.; Wang, L.; Pan, A. Epidemiology and determinants of obesity in China. Lancet Diabetes Endocrinol. 2021, 9, 373–392. [Google Scholar] [CrossRef]
- Guo, Y.; Yin, X.; Wu, H.; Chai, X.; Yang, X. Trends in Overweight and Obesity Among Children and Adolescents in China from 1991 to 2015: A Meta-Analysis. Int. J. Environ. Res. Public Health 2019, 16, 4656. [Google Scholar] [CrossRef]
- Hwang, S.; Park, S.; Jin, G.-R.; Jung, J.; Park, H.; Lee, S.; Shin, S.; Lee, B.-H. Trends in Beverage Consumption and Related Demographic Factors and Obesity among Korean Children and Adolescents. Nutrients 2020, 12, 2651. [Google Scholar] [CrossRef] [PubMed]
- Zhu, Z.; Yang, X.; Fang, Y.; Zhang, J.; Yang, Z.; Wang, Z.; Liu, A.; He, L.; Sun, J.; Lian, Y.; et al. Trends and Disparities of Energy Intake and Macronutrient Composition in China: A Series of National Surveys, 1982–2012. Nutrients 2020, 12, 2168. [Google Scholar] [CrossRef]
- Li, J.; Shi, L.; Liang, H.; Ding, G.; Xu, L. Urban-rural disparities in health care utilization among Chinese adults from 1993 to 2011. BMC Health Serv. Res. 2018, 18, 1–9. [Google Scholar] [CrossRef]
- Liu, H.; Fang, H.; Zhao, Z. Urban–rural disparities of child health and nutritional status in China from 1989 to 2006. Econ. Hum. Biol. 2013, 11, 294–309. [Google Scholar] [CrossRef] [PubMed]
- Akram, R.; Sultana, M.; Ali, N.; Sheikh, N.; Sarker, A.R. Prevalence and Determinants of Stunting Among Preschool Children and Its Urban–Rural Disparities in Bangladesh. Food Nutr. Bull. 2018, 39, 521–535. [Google Scholar] [CrossRef] [PubMed]
- Zhao, J.; Su, C.; Wang, H.; Wang, Z.; Wang, Y.; Zhang, B. Secular Trends in Energy and Macronutrient Intakes and Distribution among Adult Females (1991–2015): Results from the China Health and Nutrition Survey. Nutrients 2018, 10, 115. [Google Scholar] [CrossRef] [PubMed]
- Wang, L.S.; Zhang, B.; Wang, H.; Du, W.W.; Zhang, G.G.; Wang, Z.H. Intakes of energy and macronutrient among the elderly in nine provinces (autonomous region), China during 1991–2015. J. Hyg. Res. 2019, 48, 700–705. [Google Scholar]
- Zhang, R. Current Status and Trends of Early Childhood Nutritional Status and Dietary Intake in China: Evidence from the Chinese Health and Nutrition Survey 2000–2011 and Stakeholder Interviews. Ph.D. Thesis, Duke University, Durham, UK, 2018. [Google Scholar]
- Wang, W.; Zhang, Y.; Lin, B.; Mei, Y.; Ping, Z.; Zhang, Z. The Urban-Rural Disparity in the Status and Risk Factors of Health Literacy: A Cross-Sectional Survey in Central China. Int. J. Environ. Res. Public Health 2020, 17, 3848. [Google Scholar] [CrossRef]
- Martin, J.C.; Moran, L.J.; Teede, H.J.; Ranasinha, S.; Lombard, C.B.; Harrison, C.L. Exploring Diet Quality between Urban and Rural Dwelling Women of Reproductive Age. Nutrients 2017, 9, 586. [Google Scholar] [CrossRef]
- Hu, P.J.; Ley, S.H.; Bhupathiraju, S.N.; Li, Y.; Wang, D.D. Associations of dietary, lifestyle, and sociodemographic factors with iron status in Chinese adults: A cross-sectional study in the China Health and Nutrition Survey. Am. J. Clin. Nutr. 2017, 105, 503–512. [Google Scholar] [CrossRef]
- Zhang, B.; Zhai, F.; Du, S.F.; Popkin, B.M. The China Health and Nutrition Survey, 1989–2011. Obes. Rev. 2014, 15, 2–7. [Google Scholar] [CrossRef]
- Popkin, B.M. Reducing Meat Consumption Has Multiple Benefits for the World’s Health. Arch. Intern. Med. 2009, 169, 543–545. [Google Scholar] [CrossRef]
- Cheng, Y.; Dibley, M.J.; Zhang, X.; Zeng, L.; Yan, H. Assessment of dietary intake among pregnant women in a rural area of western China. BMC Public Health 2009, 9, 222. [Google Scholar] [CrossRef]
- Qin, B.; Adair, L.S.; Plassman, B.L.; Batis, C.; Edwards, L.J.; Popkin, B.M.; Mendez, M.A. Dietary Patterns and Cognitive Decline Among Chinese Older Adults. Epidemiology 2015, 26, 758–768. [Google Scholar] [CrossRef] [PubMed]
- Chen, C.; Lu, F.C.; Department of Disease Control Ministry of Health. PR China the guidelines for prevention and control of overweight and obesity in Chinese adults. Biomed. Environ. Sci. 2004, 17, 1–36. [Google Scholar]
- Huang, L.; Wang, H.; Wang, Z.; Zhang, J.; Zhang, B.; Ding, G. Regional Disparities in the Association between Cereal Consumption and Metabolic Syndrome: Results from the China Health and Nutrition Survey. Nutrients 2019, 11, 764. [Google Scholar] [CrossRef] [PubMed]
- Mendez, M.A.; Sotres-Alvarez, D.; Miles, D.R.; Slining, M.M.; Popkin, B. Shifts in the Recent Distribution of Energy Intake among U.S. Children Aged 2–18 Years Reflect Potential Abatement of Earlier Declining Trends. J. Nutr. 2014, 144, 1291–1297. [Google Scholar] [CrossRef] [PubMed][Green Version]
- Kolahdooz, F.; Butler, J.L.; Christiansen, K.; Diette, G.B.; Breysse, P.N.; Hansel, N.N.; McCormack, M.C.; Sheehy, T.; Gittelsohn, J.; Sharma, S. Food and Nutrient Intake in African American Children and Adolescents Aged 5 to 16 Years in Baltimore City. J. Am. Coll. Nutr. 2015, 35, 205–216. [Google Scholar] [CrossRef] [PubMed]
- Wu, X.Y.; Han, L.H.; Zhang, J.H.; Luo, S.; Hu, J.W.; Sun, K. The influence of physical activity, sedentary behavior on health-related quality of life among the general population of children and adolescents: A systematic review. PLoS ONE 2017, 12, e0187668. [Google Scholar] [CrossRef] [PubMed]
- Zhu, Z.; Tang, Y.; Zhuang, J.; Liu, Y.; Wu, X.; Cai, Y.; Wang, L.; Cao, Z.-B.; Chen, P. Physical activity, screen viewing time, and overweight/obesity among Chinese children and adolescents: An update from the 2017 physical activity and fitness in China—the youth study. BMC Public Health 2019, 19, 1–8. [Google Scholar] [CrossRef] [PubMed]
- Ao, D.; Wu, F.; Yun, C.-F.; Zheng, X.-Y. Trends in Physical Fitness Among 12-Year-Old Children in Urban and Rural Areas During the Social Transformation Period in China. J. Adolesc. Health 2019, 64, 250–257. [Google Scholar] [CrossRef]
- Zhao, M.; Shao, L.; Li, W.; Fang, Q. Comparison of Elementary Educational Facility Allocation Patterns and the Planning Strategies in Rural Areas: Case Studies of Central and Eastern China. China City Plan. Rev. 2016, 25, 41–49. [Google Scholar]
- Gutiérrez-Zornoza, M.; Sánchez-López, M.; Garcia-Hermoso, A.; González-García, A.; Chillón, P.; Martínez-Vizcaíno, V. Active Commuting to School, Weight Status, and Cardiometabolic Risk in Children from Rural Areas. Health Educ. Behav. 2014, 42, 231–239. [Google Scholar] [CrossRef]
- Forouhi, N.G.; Krauss, R.M.; Taubes, G.; Willett, W. Dietary fat and cardiometabolic health: Evidence, controversies, and consensus for guidance. BMJ 2018, 361, k2139. [Google Scholar] [CrossRef] [PubMed]
- Zhang, J.; Wang, D.; Eldridge, A.L.; Huang, F.; Ouyang, Y.; Wang, H.; Zhang, B. Urban–Rural Disparities in Energy Intake and Contribution of Fat and Animal Source Foods in Chinese Children Aged 4–17 Years. Nutrients 2017, 9, 526. [Google Scholar] [CrossRef] [PubMed]
- Song, S.; Shim, J.E. Trends in Dietary Intake of Total Fat and Fatty Acids Among Korean Adolescents from 2007 to 2017. Nutrients 2019, 11, 3073. [Google Scholar] [CrossRef]
- Libuda, L.; Alexy, U.; Kersting, M. Time trends in dietary fat intake in a sample of German children and adolescents between 2000 and 2010: Not quantity, but quality is the issue. Br. J. Nutr. 2013, 111, 141–150. [Google Scholar] [CrossRef]
- Horiuchi, Y.; Kusama, K.; Kanha, S.; Yoshiike, N.; the FIDR Research Team. Urban-Rural Differences in Nutritional Status and Dietary Intakes of School-Aged Children in Cambodia. Nutrients 2018, 11, 14. [Google Scholar] [CrossRef]
- Kisuse, J.; La-Ongkham, O.; Nakphaichit, M.; Therdtatha, P.; Momoda, R.; Tanaka, M.; Fukuda, S.; Popluechai, S.; Kespechara, K.; Sonomoto, K.; et al. Urban Diets Linked to Gut Microbiome and Metabolome Alterations in Children: A Comparative Cross-Sectional Study in Thailand. Front. Microbiol. 2018, 9, 1345. [Google Scholar] [CrossRef] [PubMed]
- Wang, H.; Zhang, Y.R.; Wang, J.Z.; Wang, P.Y.; Zhang, Y.M. Protein Intake Among School-aged Children in 7 Cities in China. Food Nutr. China 2015, 6, 76–79. [Google Scholar] [CrossRef]
- World Health Organization. World Declaration and Plan of Action for Nutrition: Submitted to the Preparatory Committee; World Health Organization: Geneva, Switzerland, 1992; pp. 1–53. [Google Scholar]
- Dewey, K.G. Adu-Afarwuah, S. Systematic review of the efficacy and effectiveness of complementary feeding interventions in developing countries. Matern Child Nutr. 2008, 4 (Suppl. 1), 24–85. [Google Scholar] [CrossRef]
- Li, Y.Y. Discussion on the nutrition improvement plan for rural compulsory education students. World Latest Med. Inform. 2019, 19, 312–323. [Google Scholar] [CrossRef]


Publisher’s Note: MDPI stays neutral with regard to jurisdictional claims in published maps and institutional affiliations. |
© 2021 by the authors. Licensee MDPI, Basel, Switzerland. This article is an open access article distributed under the terms and conditions of the Creative Commons Attribution (CC BY) license (https://creativecommons.org/licenses/by/4.0/).