
Phase Angle as an Easy Diagnostic Tool of Meta-Inflammation for the Nutritionist

 ,
, 


Abstract
1. Introduction
2. Materials and Methods
2.1. Design and Setting
2.2. Population Study
- Patients with the following diseases: type 1 and type 2 diabetes, cancer, anxiety or depression, diagnosed anemia, or any other metabolic diseases requiring a special nutritional approach. We also excluded individuals with hepatic or renal insufficiency, chronic inflammatory diseases, alcohol abuse, or on pharmacological therapy that could influence body weight;
- Occasional or current use of any of the medications that could influence fluid balance, or carbohydrate or lipid metabolism, e.g., anticonvulsants and psychotropic agents, non-steroidal anti-inflammatory drugs, laxatives, metformin, statins, and fish oil;
- Patients with endocrine disorders; in particular, females who had used oral contraceptives or reproductive hormone therapy in the past 3 months;
- Subjects with a history of intolerance or allergy to food belonging to the MD (including nuts, fish, and others);
- Individuals that for any reason followed a specific dietary regimen (hypocaloric diet, ketogenic diet, vegetarian diet, and others);
- Supplementation with any vitamins/minerals or antioxidants;
- Subjects who were simultaneously participating in other studies;
- Due to the potential possibility of interference with the device activity because of the field of current induced by the impedance measurements, we excluded patients with implanted pacemakers or defibrillators;
- Subjects who had suffered skin damage in the area where the BIA electrodes were attached;
- Underweight patients (BMI < 18.5 kg/m2).
2.3. Physical Activity and Smoking Habits
2.4. Anthropometric Measurements
2.5. Inflammatory Marker
2.6. Nutritional Parameters
2.7. Body Composition and PhA
2.8. Statistical Analysis
3. Results
Correlation Analysis
4. Discussion
Limitations and Strengths of This Study
5. Conclusions
Author Contributions
Funding
Institutional Review Board Statement
Informed Consent Statement
Data Availability Statement
Conflicts of Interest
References
- Franceschi, C.; Campisi, J. Chronic inflammation (Inflammaging) and its potential contribution to age-associated diseases. J. Gerontol. Ser. A Biol. Sci. Med. Sci. 2014, 69 (Suppl. S1), 4–9. [Google Scholar] [CrossRef]
- Rea, I.M.; Gibson, D.S.; McGilligan, V.; McNerlan, S.E.; Denis Alexander, H.; Ross, O.A. Age and age-related diseases: Role of inflammation triggers and cytokines. Front. Immunol. 2018, 9, 586. [Google Scholar] [CrossRef]
- Ferrucci, L.; Fabbri, E. Inflammageing: Chronic inflammation in ageing, cardiovascular disease, and frailty. Nat. Rev. Cardiol. 2018, 15, 505–522. [Google Scholar] [CrossRef] [PubMed]
- Nimptsch, K.; Konigorski, S.; Pischon, T. Diagnosis of obesity and use of obesity biomarkers in science and clinical medicine. Metab. Clin. Exp. 2019, 92, 61–70. [Google Scholar] [CrossRef]
- Sproston, N.R.; Ashworth, J.J. Role of C-reactive protein at sites of inflammation and infection. Front. Immunol. 2018, 9, 754. [Google Scholar] [CrossRef]
- Imhof, A.; Fröhlich, M.; Loewel, H.; Helbecque, N.; Woodward, M.; Amouyel, P.; Lowe, G.D.O.; Koenig, W. Distributions of C-reactive protein measured by high-sensitivity assays in apparently healthy men and women from different populations in Europe. Clin. Chem. 2003, 49, 669–672. [Google Scholar] [CrossRef] [PubMed]
- Khera, A.; McGuire, D.K.; Murphy, S.A.; Stanek, H.G.; Das, S.R.; Vongpatanasin, W.; Wians, F.H.; Grundy, S.M.; De Lemos, J.A. Race and gender differences in C-reactive protein levels. J. Am. Coll. Cardiol. 2005, 46, 464–469. [Google Scholar] [CrossRef]
- Lakoski, S.G.; Cushman, M.; Criqui, M.; Rundek, T.; Blumenthal, R.S.; D’Agostino, R.B.; Herrington, D.M. Gender and C-reactive protein: Data from the Multiethnic Study of Atherosclerosis (MESA) cohort. Am. Heart J. 2006, 152, 593–598. [Google Scholar] [CrossRef]
- Lukaski, H.C.; Kyle, U.G.; Kondrup, J. Assessment of adult malnutrition and prognosis with bioelectrical impedance analysis: Phase angle and impedance ratio. Curr. Opin. Clin. Nutr. Metab. Care 2017, 20, 330–339. [Google Scholar] [CrossRef]
- Baumgartner, R.N.; Chumlea, W.C.; Roche, A.F. Bioelectric impedance phase angle and body composition. Am. J. Clin. Nutr. 1988, 48, 16–23. [Google Scholar] [CrossRef] [PubMed]
- Norman, K.; Stobäus, N.; Pirlich, M.; Bosy-Westphal, A. Bioelectrical phase angle and impedance vector analysis—Clinical relevance and applicability of impedance parameters. Clin. Nutr. 2012, 31, 854–861. [Google Scholar] [CrossRef]
- Gonzalez, M.C.; Barbosa-Silva, T.G.; Bielemann, R.M.; Gallagher, D.; Heymsfield, S.B. Phase angle and its determinants in healthy subjects: Influence of body composition. Am. J. Clin. Nutr. 2016, 103, 712–716. [Google Scholar] [CrossRef]
- Kyle, U.G.; Bosaeus, I.; De Lorenzo, A.D.; Deurenberg, P.; Elia, M.; Gómez, J.M.; Heitmann, B.L.; Kent-Smith, L.; Melchior, J.C.; Pirlich, M.; et al. Bioelectrical impedance analysis—Part II: Utilization in clinical practice. Clin. Nutr. 2004, 23, 1430–1453. [Google Scholar] [CrossRef]
- Kumar, S.; Dutt, A.; Hemraj, S.; Bhat, S.; Manipadybhima, B. Phase angle measurement in healthy human subjects through bio-impedance analysis. Iran. J. Basic Med. Sci. 2012, 15, 1180–1184. [Google Scholar] [CrossRef]
- Buffa, R.; Floris, G.; Marini, E. Migration of the bioelectrical impedance vector in healthy elderly subjects. Nutrition 2003, 19, 917–921. [Google Scholar] [CrossRef]
- Kyle, U.G.; Soundar, E.P.; Genton, L.; Pichard, C. Can phase angle determined by bioelectrical impedance analysis assess nutritional risk? A comparison between healthy and hospitalized subjects. Clin. Nutr. 2012, 31, 875–881. [Google Scholar] [CrossRef]
- Barrea, L.; Muscogiuri, G.; Macchia, P.E.; Di Somma, C.; Falco, A.; Savanelli, M.C.; Colao, A.; Savastano, S. Mediterranean diet and phase angle in a sample of adult population: Results of a pilot study. Nutrients 2017, 9, 151. [Google Scholar] [CrossRef]
- Stobäus, N.; Pirlich, M.; Valentini, L.; Schulzke, J.D.; Norman, K. Determinants of bioelectrical phase angle in disease. Br. J. Nutr. 2012, 107, 1217–1220. [Google Scholar] [CrossRef]
- Curvello-Silva, K.; Ramos, L.; Sousa, C.; Daltro, C. Phase angle and metabolic parameters in severely obese patients [Ángulo de fase y parámetros metabólicos en pacientes con obesidad severa]. Nutr. Hosp. 2020, 37, 1130–1134. [Google Scholar]
- Barrea, L.; Arnone, A.; Annunziata, G.; Muscogiuri, G.; Laudisio, D.; Salzano, C.; Pugliese, G.; Colao, A.; Savastano, S. Adherence to the mediterranean diet, dietary patterns and body composition in women with polycystic ovary syndrome (PCOS). Nutrients 2019, 11, 2278. [Google Scholar] [CrossRef] [PubMed]
- Barrea, L.; Muscogiuri, G.; Laudisio, D.; Di Somma, C.; Salzano, C.; Pugliese, G.; de Alteriis, G.; Colao, A.; Savastano, S. Phase angle: A possible biomarker to quantify inflammation in subjects with obesity and 25(OH)D deficiency. Nutrients 2019, 11, 1747. [Google Scholar] [CrossRef]
- Barrea, L.; Fabbrocini, G.; Annunziata, G.; Muscogiuri, G.; Donnarumma, M.; Marasca, C.; Colao, A.; Savastano, S. Role of nutrition and adherence to the mediterranean diet in the multidisciplinary approach of hidradenitis suppurativa: Evaluation of nutritional status and its association with severity of disease. Nutrients 2019, 11, 57. [Google Scholar] [CrossRef]
- Barrea, L.; Macchia, P.E.; Di Somma, C.; Napolitano, M.; Balato, A.; Falco, A.; Savanelli, M.C.; Balato, N.; Colao, A.; Savastano, S. Bioelectrical phase angle and psoriasis: A novel association with psoriasis severity, quality of life and metabolic syndrome. J. Transl. Med. 2016, 14, 1–12. [Google Scholar] [CrossRef]
- Barrea, L.; Altieri, B.; Muscogiuri, G.; Laudisio, D.; Annunziata, G.; Colao, A.; Faggiano, A.; Savastano, S. Impact of nutritional status on gastroenteropancreatic neuroendocrine tumors (GEP-NET) aggressiveness. Nutrients 2018, 10, 1854. [Google Scholar] [CrossRef]
- Hui, D.; Moore, J.; Park, M.; Liu, D.; Bruera, E. Phase Angle and the Diagnosis of Impending Death in Patients with Advanced Cancer: Preliminary Findings. Oncologist 2019, 24, e365. [Google Scholar] [CrossRef]
- Jun, M.H.; Kim, S.; Ku, B.; Cho, J.; Kim, K.; Yoo, H.R.; Kim, J.U. Glucose-independent segmental phase angles from multi-frequency bioimpedance analysis to discriminate diabetes mellitus. Sci. Rep. 2018, 8, 1–11. [Google Scholar] [CrossRef]
- Hirose, S.; Nakajima, T.; Nozawa, N.; Katayanagi, S.; Ishizaka, H.; Mizushima, Y.; Matsumoto, K.; Nishikawa, K.; Toyama, Y.; Takahashi, R.; et al. Phase Angle as an Indicator of Sarcopenia, Malnutrition, and Cachexia in Inpatients with Cardiovascular Diseases. J. Clin. Med. 2020, 9, 2554. [Google Scholar] [CrossRef]
- Garlini, L.M.; Alves, F.D.; Ceretta, L.B.; Perry, I.S.; Souza, G.C.; Clausell, N.O. Phase angle and mortality: A systematic review. Eur. J. Clin. Nutr. 2019, 73, 495–508. [Google Scholar] [CrossRef] [PubMed]
- Genton, L.; Herrmann, F.R.; Spörri, A.; Graf, C.E. Association of mortality and phase angle measured by different bioelectrical impedance analysis (BIA) devices. Clin. Nutr. 2018, 37, 1066–1069. [Google Scholar] [CrossRef]
- Tomeleri, C.M.; Cavaglieri, C.R.; de Souza, M.F.; Cavalcante, E.F.; Antunes, M.; Nabbuco, H.C.G.; Venturini, D.; Barbosa, D.S.; Silva, A.M.; Cyrino, E.S. Phase angle is related with inflammatory and oxidative stress biomarkers in older women. Exp. Gerontol. 2018, 102, 12–18. [Google Scholar] [CrossRef] [PubMed]
- Barrea, L.; Pugliese, G.; de Alteriis, G.; Colao, A.; Savastano, S.; Muscogiuri, G. Phase angle: Could be an easy tool to detect low-grade systemic inflammation in adults affected by prader–willi syndrome? Nutrients 2020, 12, 2065. [Google Scholar] [CrossRef] [PubMed]
- Muscogiuri, G.; Barrea, L.; Laudisio, D.; Pugliese, G.; Aprano, S.; Framondi, L.; Di Matteo, R.; Riccio, P.A.; Savastano, S.; Colao, A. The opera prevention project. Int. J. Food Sci. Nutr. 2020, 72, 1–3. [Google Scholar] [CrossRef]
- Barrea, L.; Muscogiuri, G.; Di Somma, C.; Annunziata, G.; Megna, M.; Falco, A.; Balato, A.; Colao, A.; Savastano, S. Coffee consumption, metabolic syndrome and clinical severity of psoriasis: Good or bad stuff? Arch. Toxicol. 2018, 92, 1831–1845. [Google Scholar] [CrossRef]
- Barrea, L.; Di Somma, C.; Macchia, P.E.; Falco, A.; Savanelli, M.C.; Orio, F.; Colao, A.; Savastano, S. Influence of nutrition on somatotropic axis: Milk consumption in adult individuals with moderate-severe obesity. Clin. Nutr. 2017, 36, 293–301. [Google Scholar] [CrossRef]
- Barrea, L.; Pugliese, G.; Framondi, L.; Di Matteo, R.; Laudisio, D.; Savastano, S.; Colao, A.; Muscogiuri, G. Does Sars-Cov-2 threaten our dreams? Effect of quarantine on sleep quality and body mass index. J. Transl. Med. 2020, 18, 1–11. [Google Scholar] [CrossRef]
- Muscogiuri, G.; Barrea, L.; Aprano, S.; Framondi, L.; Di Matteo, R.; Laudisio, D.; Pugliese, G.; Savastano, S.; Colao, A. Chronotype and adherence to the mediterranean diet in obesity: Results from the opera prevention project. Nutrients 2020, 12, 1354. [Google Scholar] [CrossRef]
- Savanelli, M.C.; Scarano, E.; Muscogiuri, G.; Barrea, L.; Vuolo, L.; Rubino, M.; Savastano, S.; Colao, A.; Di Somma, C. Cardiovascular risk in adult hypopituitaric patients with growth hormone deficiency: Is there a role for vitamin D? Endocrine 2016, 52, 111–119. [Google Scholar] [CrossRef] [PubMed]
- Barrea, L.; Muscogiuri, G.; Annunziata, G.; Laudisio, D.; Tenore, G.C.; Colao, A.; Savastano, S. A new light on vitamin d in obesity: A novel association with trimethylamine-n-oxide (tmao). Nutrients 2019, 11, 1310. [Google Scholar] [CrossRef]
- Savastano, S.; Di Somma, C.; Colao, A.; Barrea, L.; Orio, F.; Finelli, C.; Pasanisi, F.; Contaldo, F.; Tarantino, G. Preliminary data on the relationship between circulating levels of Sirtuin 4, anthropometric and metabolic parameters in obese subjects according to growth hormone/insulin-like growth factor-1 status. Growth Horm. IGF Res. 2015, 25, 28–33. [Google Scholar] [CrossRef]
- Nishida, C.; Ko, G.T.; Kumanyika, S. Body fat distribution and noncommunicable diseases in populations: Overview of the 2008 WHO Expert Consultation on Waist Circumference and Waist-Hip Ratio. Eur. J. Clin. Nutr. 2010, 64, 2–5. [Google Scholar] [CrossRef] [PubMed]
- National Center for Health Statistics. Available online: https://www.cdc.gov/nchs/data/nhanes/nhanes_11_12/Anthropometry_Procedures_Manual.pdf (accessed on 21 May 2020).
- Barrea, L.; Tarantino, G.; Di Somma, C.; Muscogiuri, G.; Macchia, P.E.; Falco, A.; Colao, A.; Savastano, S. Adherence to the Mediterranean Diet and Circulating Levels of Sirtuin 4 in Obese Patients: A Novel Association. Oxid. Med. Cell. Longev. 2017, 2017, 6101254. [Google Scholar] [CrossRef]
- Muscogiuri, G.; Barrea, L.; Aprano, S.; Framondi, L.; Di Matteo, R.; Laudisio, D.; Pugliese, G.; Savastano, S.; Colao, A. Sleep quality in obesity: Does adherence to the mediterranean diet matter? Nutrients 2020, 12, 1364. [Google Scholar] [CrossRef]
- Muscogiuri, G.; Barrea, L.; Di Somma, C.; Altieri, B.; Vecchiarini, M.; Orio, F.; Spinosa, T.; Colao, A.; Savastano, S. Patient empowerment and the Mediterranean diet as a possible tool to tackle prediabetes associated with overweight or obesity: A pilot study. Hormones 2019, 18, 75–84. [Google Scholar] [CrossRef]
- Martínez-González, M.A.; García-Arellano, A.; Toledo, E.; Salas-Salvadó, J.; Buil-Cosiales, P.; Corella, D.; Covas, M.I.; Schröder, H.; Arós, F.; Gómez-Gracia, E.; et al. A 14-item mediterranean diet assessment tool and obesity indexes among high-risk subjects: The PREDIMED trial. PLoS ONE 2012, 7, e43134. [Google Scholar] [CrossRef] [PubMed]
- Muscogiuri, G.; Barrea, L.; Di Somma, C.; Laudisio, D.; Salzano, C.; Pugliese, G.; de Alteriis, G.; Colao, A.; Savastano, S. Sex differences of vitamin D status across BMI classes: An observational prospective cohort study. Nutrients 2019, 11, 3034. [Google Scholar] [CrossRef]
- Muscogiuri, G.; Barrea, L.; Laudisio, D.; Di Somma, C.; Pugliese, G.; Salzano, C.; Colao, A.; Savastano, S. Somatotropic axis and obesity: Is there any role for the Mediterranean diet? Nutrients 2019, 11, 2228. [Google Scholar] [CrossRef] [PubMed]
- Savastano, S.; Barbato, A.; Di Somma, C.; Guida, B.; Pizza, G.; Barrea, L.; Avallone, S.; Schiano Di Cola, M.; Strazzullo, P.; Colao, A. Beyond waist circumference in an adultmale population of Southern Italy: Is there any role for subscapular skinfold thickness in the relationship between insulin-like growth factor-I systemand metabolic parameters? J. Endocrinol. Investig. 2012, 35, 925–929. [Google Scholar] [CrossRef]
- Barrea, L.; Muscogiuri, G.; Laudisio, D.; Pugliese, G.; de Alteriis, G.; Colao, A.; Savastano, S. Influence of the mediterranean diet on 25-hydroxyvitamin D levels in adults. Nutrients 2020, 12, 1439. [Google Scholar] [CrossRef] [PubMed]
- Yanovski, S.Z.; Hubbard, V.S.; Heymsfield, S.B.; Lukaski, H.C. Bioelectrical impedance analysis in body composition measurement: National Institutes of Health Technology Assessment Conference statement. Am. J. Clin. Nutr. 1996, 64, 524S–532S. [Google Scholar]
- Kushner, R.F. Bioelectrical impedance analysis: A review of principles and applications. J. Am. Coll. Nutr. 1992, 11, 199–209. [Google Scholar] [CrossRef]
- Barrea, L.; Gallo, M.; Ruggeri, R.M.; Di Giacinto, P.; Sesti, F.; Prinzi, N.; Adinolfi, V.; Barucca, V.; Renzelli, V.; Muscogiuri, G.; et al. Nutritional status and follicular-derived thyroid cancer: An update. Crit. Rev. Food Sci. Nutr. 2020, 61, 25–59. [Google Scholar] [CrossRef]
- De Almeida, C.; Penna, P.M.; Pereira, S.S.; Rosa, C.D.; Franceschini, S.D. Relationship between Phase Angle and Objective and Subjective Indicators of Nutritional Status in Cancer Patients: A Systematic Review. Nutr. Cancer 2020, 1–10. [Google Scholar] [CrossRef]
- Cornejo-Pareja, I.; Vegas-Aguilar, I.M.; García-Almeida, J.M.; Bellido-Guerrero, D.; Talluri, A.; Lukaski, H.; Tinahones, F.J. Phase angle and standardized phase angle from bioelectrical impedance measurements as a prognostic factor for mortality at 90 days in patients with COVID-19: A longitudinal cohort study. Clin. Nutr. 2021. [Google Scholar] [CrossRef]
- Petersen, K.S.; Smith, C. Ageing-associated oxidative stress and inflammation are alleviated by products from grapes. Oxid. Med. Cell. Longev. 2016, 2016, 6236309. [Google Scholar] [CrossRef]
- Cooke, A.A.; Connaughton, R.M.; Lyons, C.L.; McMorrow, A.M.; Roche, H.M. Fatty acids and chronic low grade inflammation associated with obesity and the metabolic syndrome. Eur. J. Pharmacol. 2016, 785, 207–214. [Google Scholar] [CrossRef]
- Barbosa-Silva, M.C.G.; Barros, A.J.D.; Wang, J.; Heymsfield, S.B.; Pierson, R.N. Bioelectrical impedance analysis: Population reference values for phase angle by age and sex. Am. J. Clin. Nutr. 2005, 82, 49–52. [Google Scholar] [CrossRef] [PubMed]
- Dittmar, M. Reliability and Variability of Bioimpedance Measures in Normal Adults: Effects of Age, Gender, and Body Mass. Am. J. Phys. Anthropol. 2003, 122, 361–370. [Google Scholar] [CrossRef]
- Nicklas, B.J.; Brinkley, T.E. Exercise training as a treatment for chronic inflammation in the elderly. Exerc. Sport Sci. Rev. 2009, 37, 165–170. [Google Scholar] [CrossRef]
- Mavros, Y.; Kay, S.; Simpson, K.A.; Baker, M.K.; Wang, Y.; Zhao, R.R.; Meiklejohn, J.; Climstein, M.; O’Sullivan, A.J.; de Vos, N.; et al. Reductions in C-reactive protein in older adults with type 2 diabetes are related to improvements in body composition following a randomized controlled trial of resistance training. J. Cachexia Sarcopenia Muscle 2014, 5, 111–120. [Google Scholar] [CrossRef]
- Nikseresht, M.; Sadeghifard, N.; Agha-Alinejad, H.; Ebrahim, K. Inflammatory markers and adipocytokine responses to exercise training and detraining in men who are obese. J. Strength Cond. Res. 2014, 28, 3399–3410. [Google Scholar] [CrossRef] [PubMed]
- Zanforlini, B.M.; Trevisan, C.; Bertocco, A.; Piovesan, F.; Dianin, M.; Mazzochin, M.; Alessi, A.; Zoccarato, F.; Manzato, E.; Sergi, G. Phase angle and metabolic equivalents as predictors of frailty transitions in advanced age. Exp. Gerontol. 2019, 122, 47–52. [Google Scholar] [CrossRef] [PubMed]
- Pereira, M.M.E.; Queiroz, M.D.S.C.; de Albuquerque, N.M.C.; Rodrigues, J.; Wiegert, E.V.M.; Calixto-Lima, L.; de Oliveira, L.C. The Prognostic Role of Phase Angle in Advanced Cancer Patients: A Systematic Review. Nutr. Clin. Pract. 2018, 33, 813–824. [Google Scholar] [CrossRef]
- Rinninella, E.; Ruggiero, A.; Maurizi, P.; Triarico, S.; Cintoni, M.; Mele, M.C. Clinical tools to assess nutritional risk and malnutrition in hospitalized children and adolescents. Eur. Rev. Med. Pharmacol. Sci. 2017, 21, 2690–2701. [Google Scholar]
- Cederholm, T.; Barazzoni, R.; Austin, P.; Ballmer, P.; Biolo, G.; Bischoff, S.C.; Compher, C.; Correia, I.; Higashiguchi, T.; Holst, M.; et al. ESPEN guidelines on definitions and terminology of clinical nutrition. Clin. Nutr. 2017, 36, 49–64. [Google Scholar] [CrossRef]
- Caccialanza, R.; Cereda, E.; Klersy, C.; Bonardi, C.; Cappello, S.; Quarleri, L.; Turri, A.; Montagna, E.; Iacona, I.; Valentino, F.; et al. Phase angle and handgrip strength are sensitive early markers of energy intake in hypophagic, non-surgical patients at nutritional risk, with contraindications to enteral nutrition. Nutrients 2015, 7, 1828–1840. [Google Scholar] [CrossRef] [PubMed]
- Barbosa-Silva, M.C.G.; Barros, A.J.D. Bioelectrical impedance analysis in clinical practice: A new perspective on its use beyond body composition equations. Curr. Opin. Clin. Nutr. Metab. Care 2005, 8, 311–317. [Google Scholar] [CrossRef]
- Planz, B.; Wolff, J.M.; Gutersohn, A.; Stampfer, D.S.; Jakse, G. C-reactive protein as a marker for tissue damage in patients undergoing eswl with or without retrograde stone manipulation. Urol. Int. 1997, 59, 174–176. [Google Scholar] [CrossRef] [PubMed]
- Braig, D.; Nero, T.L.; Koch, H.G.; Kaiser, B.; Wang, X.; Thiele, J.R.; Morton, C.J.; Zeller, J.; Kiefer, J.; Potempa, L.A.; et al. Transitional changes in the CRP structure lead to the exposure of proinflammatory binding sites. Nat. Commun. 2017, 8, 14188. [Google Scholar] [CrossRef]
- Scicchitano, P.; Ciccone, M.M.; Passantino, A.; Valle, R.; De Palo, M.; Sasanelli, P.; Sanasi, M.; Piscopo, A.; Guida, P.; Caldarola, P.; et al. Congestion and nutrition as determinants of bioelectrical phase angle in heart failure. Heart Lung 2020, 49, 724–728. [Google Scholar] [CrossRef]
- Reljic, D.; Zarafat, D.; Jensen, B.; Herrmann, H.J.; Neurath, M.F.; Konturek, P.C.; Zopf, Y. Phase angle and vector analysis from multifrequency segmental bioelectrical impedance analysis: New reference data for older adults. J. Physiol. Pharmacol. 2020, 71, 4. [Google Scholar] [CrossRef]
- Anja, B.W.; Danielzik, S.; Dörhöfer, R.P.; Later, W.; Wiese, S.; Müller, M.J. Phase angle from bioelectrical impedance analysis: Population reference values by age, sex, and body mass index. J. Parenter. Enter. Nutr. 2006, 30, 309–316. [Google Scholar] [CrossRef]
- Saitoh, M.; Ogawa, M.; Kondo, H.; Suga, K.; Takahashi, T.; Itoh, H.; Tabata, Y. Bioelectrical impedance analysis-derived phase angle as a determinant of protein-energy wasting and frailty in maintenance hemodialysis patients: Retrospective cohort study. BMC Nephrol. 2020, 21, 1–8. [Google Scholar] [CrossRef] [PubMed]


| Parameters | Males Subjects n 680 (36.7%) | Females Subjects n 1175 (63.3%) | * p-Value |
|---|---|---|---|
| Age (Years) | 34.8 ± 11.3 | 34.4 ± 11.2 | 0.511 |
| Lifestyle characteristics | |||
| Smoking (Yes) | 253 (37.2%) | 231 (19.7%) | χ2 = 67.86, p < 0.001 |
| Physical activity (Yes) | 225 (33.1%) | 439 (37.4%) | χ2 = 3.23, p = 0.071 |
| Anthropometric parameters | |||
| Weight (kg) | 104.8 ± 25.9 | 95.3 ± 24.7 | <0.001 |
| Height (m) | 1.76 ± 0.05 | 1.63 ± 0.07 | <0.001 |
| BMI (kg/m2) | 33.8 ± 8.1 | 35.6 ± 8.6 | <0.001 |
| Normal weight (n, %) | 107 (15.7%) | 174 (14.8%) | χ2 = 0.22, p = 0.638 |
| Overweight (n, %) | 161 (23.7%) | 161 (13.7%) | χ2 = 29.18, p < 0.001 |
| Grade I obesity (n, %) | 132 (19.4%) | 197 (16.8%) | χ2 = 1.88, p = 0.169 |
| Grade II obesity (n, %) | 133 (19.6%) | 272 (23.1%) | χ2 = 3.05, p = 0.081 |
| Grade III obesity (n, %) | 147 (21.6%) | 371 (31.6%) | χ2 = 20.73, p < 0.001 |
| WC (cm) | 111.1 ± 24.4 | 101.2 ± 24.0 | <0.001 |
| Inflammatory marker | |||
| hs-CRP levels (ng/mL) | 2.9 ± 2.3 | 2.5 ± 2.7 | 0.003 |
| Nutritional parameters | |||
| PREDIMED score | 6.6 ± 3.1 | 7.3 ± 3.0 | <0.001 |
| Low adherence to the MD | 318 (46.8%) | 406 (34.6%) | χ2 = 26.48, p < 0.001 |
| Average adherence to the MD | 264 (38.8%) | 453 (38.6%) | χ2 = 0.01, p = 0.947 |
| High adherence to the MD | 98 (14.4%) | 316 (26.9%) | χ2 = 37.99, p < 0.001 |
| Body composition parameters | |||
| R (Ω) | 471.5 ± 90.2 | 481.2 ± 85.7 | 0.022 |
| Xc (Ω) | 49.9 ± 10.3 | 46.5 ± 9.4 | <0.001 |
| PhA (°) | 6.1 ± 0.8 | 5.6 ± 0.7 | <0.001 |
| Parameters | PhA (°) | p-Value | |
|---|---|---|---|
| Smoking | Yes (n 484, 26.1%) | 5.7 ± 0.83 | 0.106 |
| No (n 1371, 73.9%) | 5.8 ± 0.81 | ||
| Physical activity | Yes (n 664, 35.8%) | 6.0 ± 0.77 | <0.001 |
| No (n 1191, 64.2%) | 5.6 ± 0.82 | ||
| BMI classes | Normal weight (n 281, 15.1%) | 6.1 ± 0.52 | <0.001 |
| Overweight (n 322, 17.4%) | 6.6 ± 0.59 | ||
| Grade I obesity (n 329, 17.7%) | 6.0 ± 0.68 | ||
| Grade II obesity (n 405, 21.8%) | 5.5 ± 0.75 | ||
| Grade III obesity (n 518, 27.9%) | 5.2 ± 0.61 | ||
| PREDIMED categories | Low adherence to the MD (n 724, 39.0%) | 5.2 ± 0.71 | <0.001 |
| Average adherence to the MD (n 717, 38.7%) | 6.0 ± 0.73 | ||
| High adherence to the MD (n 414, 22.3%) | 6.3 ± 0.55 |
| PhA (°) | ||
|---|---|---|
| Parameters | n 1855 | |
| r | p-Value | |
| Age (Years) | −0.114 | <0.001 |
| Anthropometric parameters | ||
| Weight (kg) | −0.469 | <0.001 |
| Height (m) | 0.190 | <0.001 |
| BMI (kg/m2) | −0.579 | <0.001 |
| WC (cm) | −0.421 | <0.001 |
| Inflammatory marker | ||
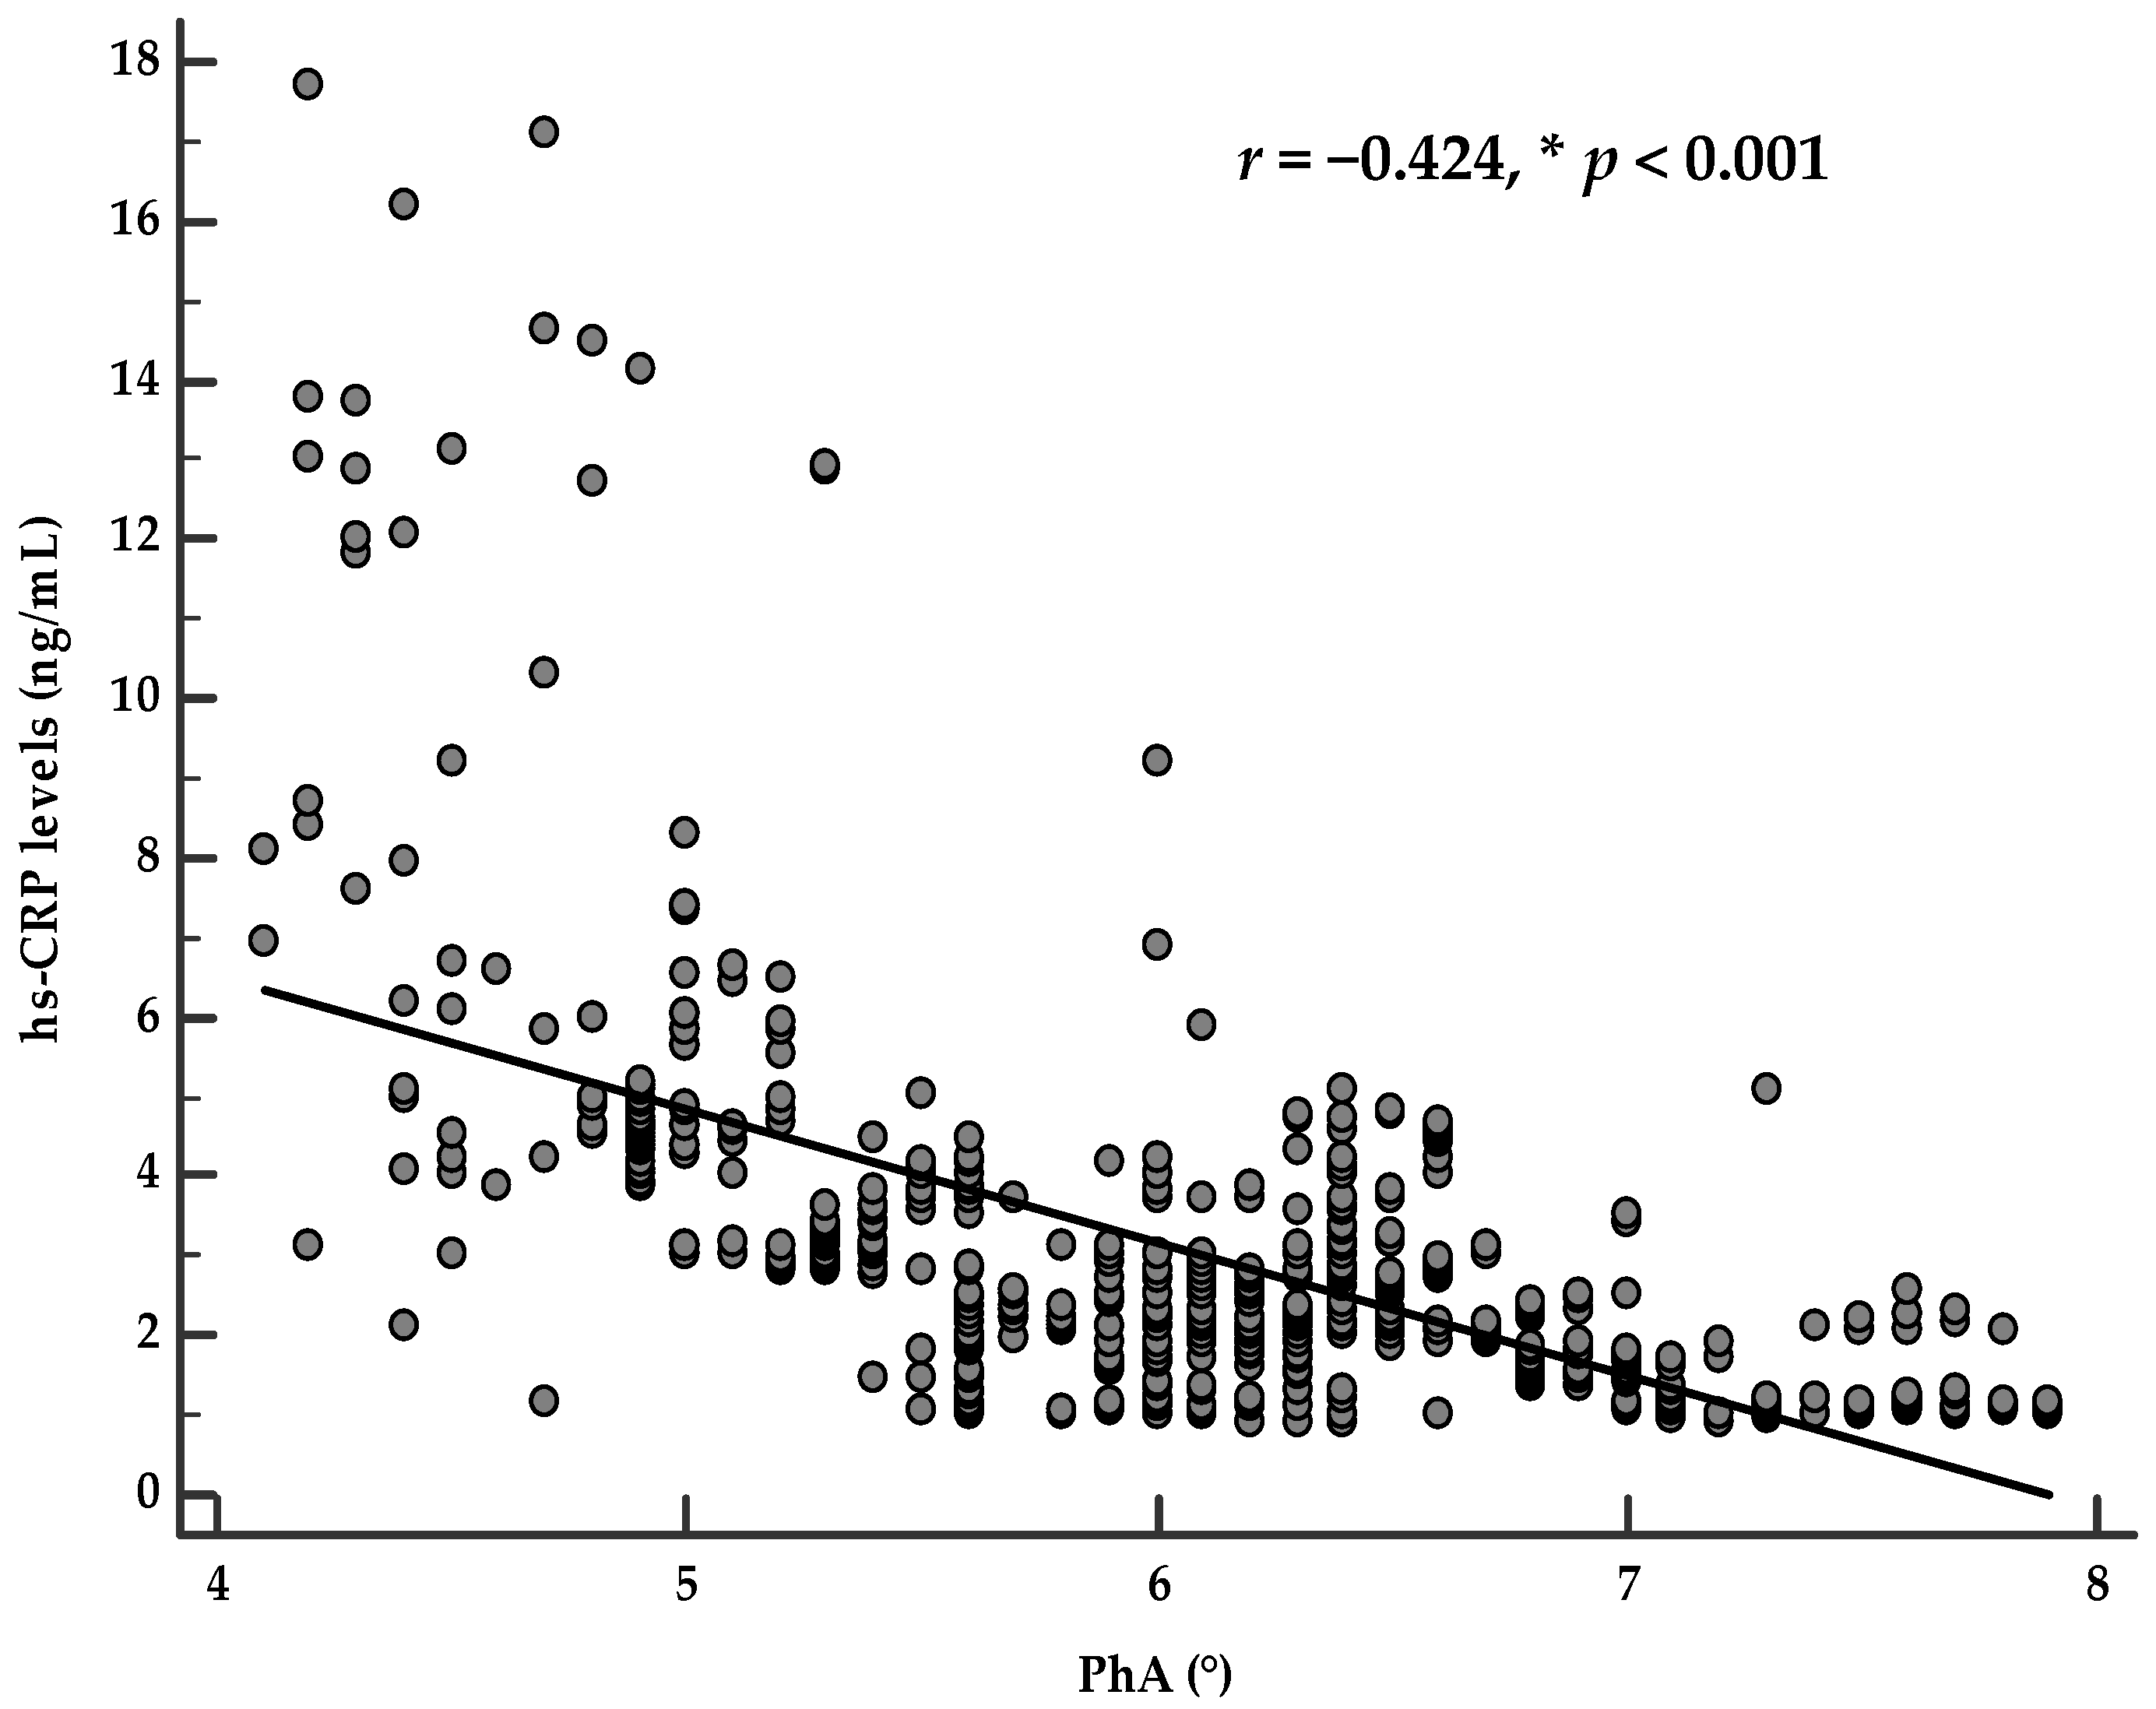
| hs-CRP levels (ng/mL) | −0.550 | <0.001 |
| Nutritional parameters | ||
| PREDIMED score | 0.593 | <0.001 |
| Body composition parameters | ||
| R (Ω) | −0.211 | <0.001 |
| Xc (Ω) | 0.501 | <0.001 |
| PhA (°) | −0.550 | <0.001 |
| Parameters | PhA (°) | |||
|---|---|---|---|---|
| OR | p-Value | 95% IC | R2 | |
| Sex (Male) | 0.41 | <0.001 | 0.36–0.47 | 0.10 |
| Smoking (Yes) | 0.90 | 0.106 | 0.79–1.02 | 0.01 |
| Physical activity (Yes) | 1.63 | <0.001 | 1.44–1.84 | 0.04 |
| BMI classes | ||||
| Normal weight (n, %) | 1.85 | <0.001 | 1.57–2.17 | 0.03 |
| Overweight (n, %) | 6.66 | <0.001 | 5.32–8.35 | 0.20 |
| Grade I obesity (n, %) | 1.49 | <0.001 | 1.29–1.74 | 0.02 |
| Grade II obesity (n, %) | 0.55 | <0.001 | 0.47–0.63 | 0.04 |
| Grade III obesity (n, %) | 0.21 | <0.001 | 0.18–0.25 | 0.20 |
| PREDIMED categories | ||||
| Low adherence to the MD | 0.18 | <0.001 | 0.15–0.21 | 0.27 |
| Average adherence to the MD | 1.76 | <0.001 | 1.56–1.99 | 0.05 |
| High adherence to the MD | 3.26 | <0.001 | 2.77–3.84 | 0.13 |
| Parameters | Regression Analysis | |||
|---|---|---|---|---|
| R2 | β | t | p Value | |
| PREDIMED score | 0.352 | 0.59 | 31.7 | <0.001 |
| Sex | 0.504 | −0.39 | −23.9 | <0.001 |
| hs-CRP levels (ng/mL) | 0.598 | −0.35 | −20.8 | <0.001 |
| BMI (kg/m2) | 0.613 | −0.17 | −8.7 | <0.001 |
| Age (Years) | 0.625 | −0.11 | −7.4 | <0.001 |
| Variables excluded: physical activity and WC | ||||
Publisher’s Note: MDPI stays neutral with regard to jurisdictional claims in published maps and institutional affiliations. |
© 2021 by the authors. Licensee MDPI, Basel, Switzerland. This article is an open access article distributed under the terms and conditions of the Creative Commons Attribution (CC BY) license (https://creativecommons.org/licenses/by/4.0/).
Share and Cite
Barrea, L.; Muscogiuri, G.; Pugliese, G.; Laudisio, D.; de Alteriis, G.; Graziadio, C.; Colao, A.; Savastano, S. Phase Angle as an Easy Diagnostic Tool of Meta-Inflammation for the Nutritionist. Nutrients 2021, 13, 1446. https://doi.org/10.3390/nu13051446
Barrea L, Muscogiuri G, Pugliese G, Laudisio D, de Alteriis G, Graziadio C, Colao A, Savastano S. Phase Angle as an Easy Diagnostic Tool of Meta-Inflammation for the Nutritionist. Nutrients. 2021; 13(5):1446. https://doi.org/10.3390/nu13051446
Chicago/Turabian StyleBarrea, Luigi, Giovanna Muscogiuri, Gabriella Pugliese, Daniela Laudisio, Giulia de Alteriis, Chiara Graziadio, Annamaria Colao, and Silvia Savastano. 2021. "Phase Angle as an Easy Diagnostic Tool of Meta-Inflammation for the Nutritionist" Nutrients 13, no. 5: 1446. https://doi.org/10.3390/nu13051446
APA StyleBarrea, L., Muscogiuri, G., Pugliese, G., Laudisio, D., de Alteriis, G., Graziadio, C., Colao, A., & Savastano, S. (2021). Phase Angle as an Easy Diagnostic Tool of Meta-Inflammation for the Nutritionist. Nutrients, 13(5), 1446. https://doi.org/10.3390/nu13051446