
Single Ingestion of Trehalose Enhances Prolonged Exercise Performance by Effective Use of Glucose and Lipid in Healthy Men

Abstract
1. Introduction
2. Materials and Method
2.1. Participants
2.2. Preliminary Testing
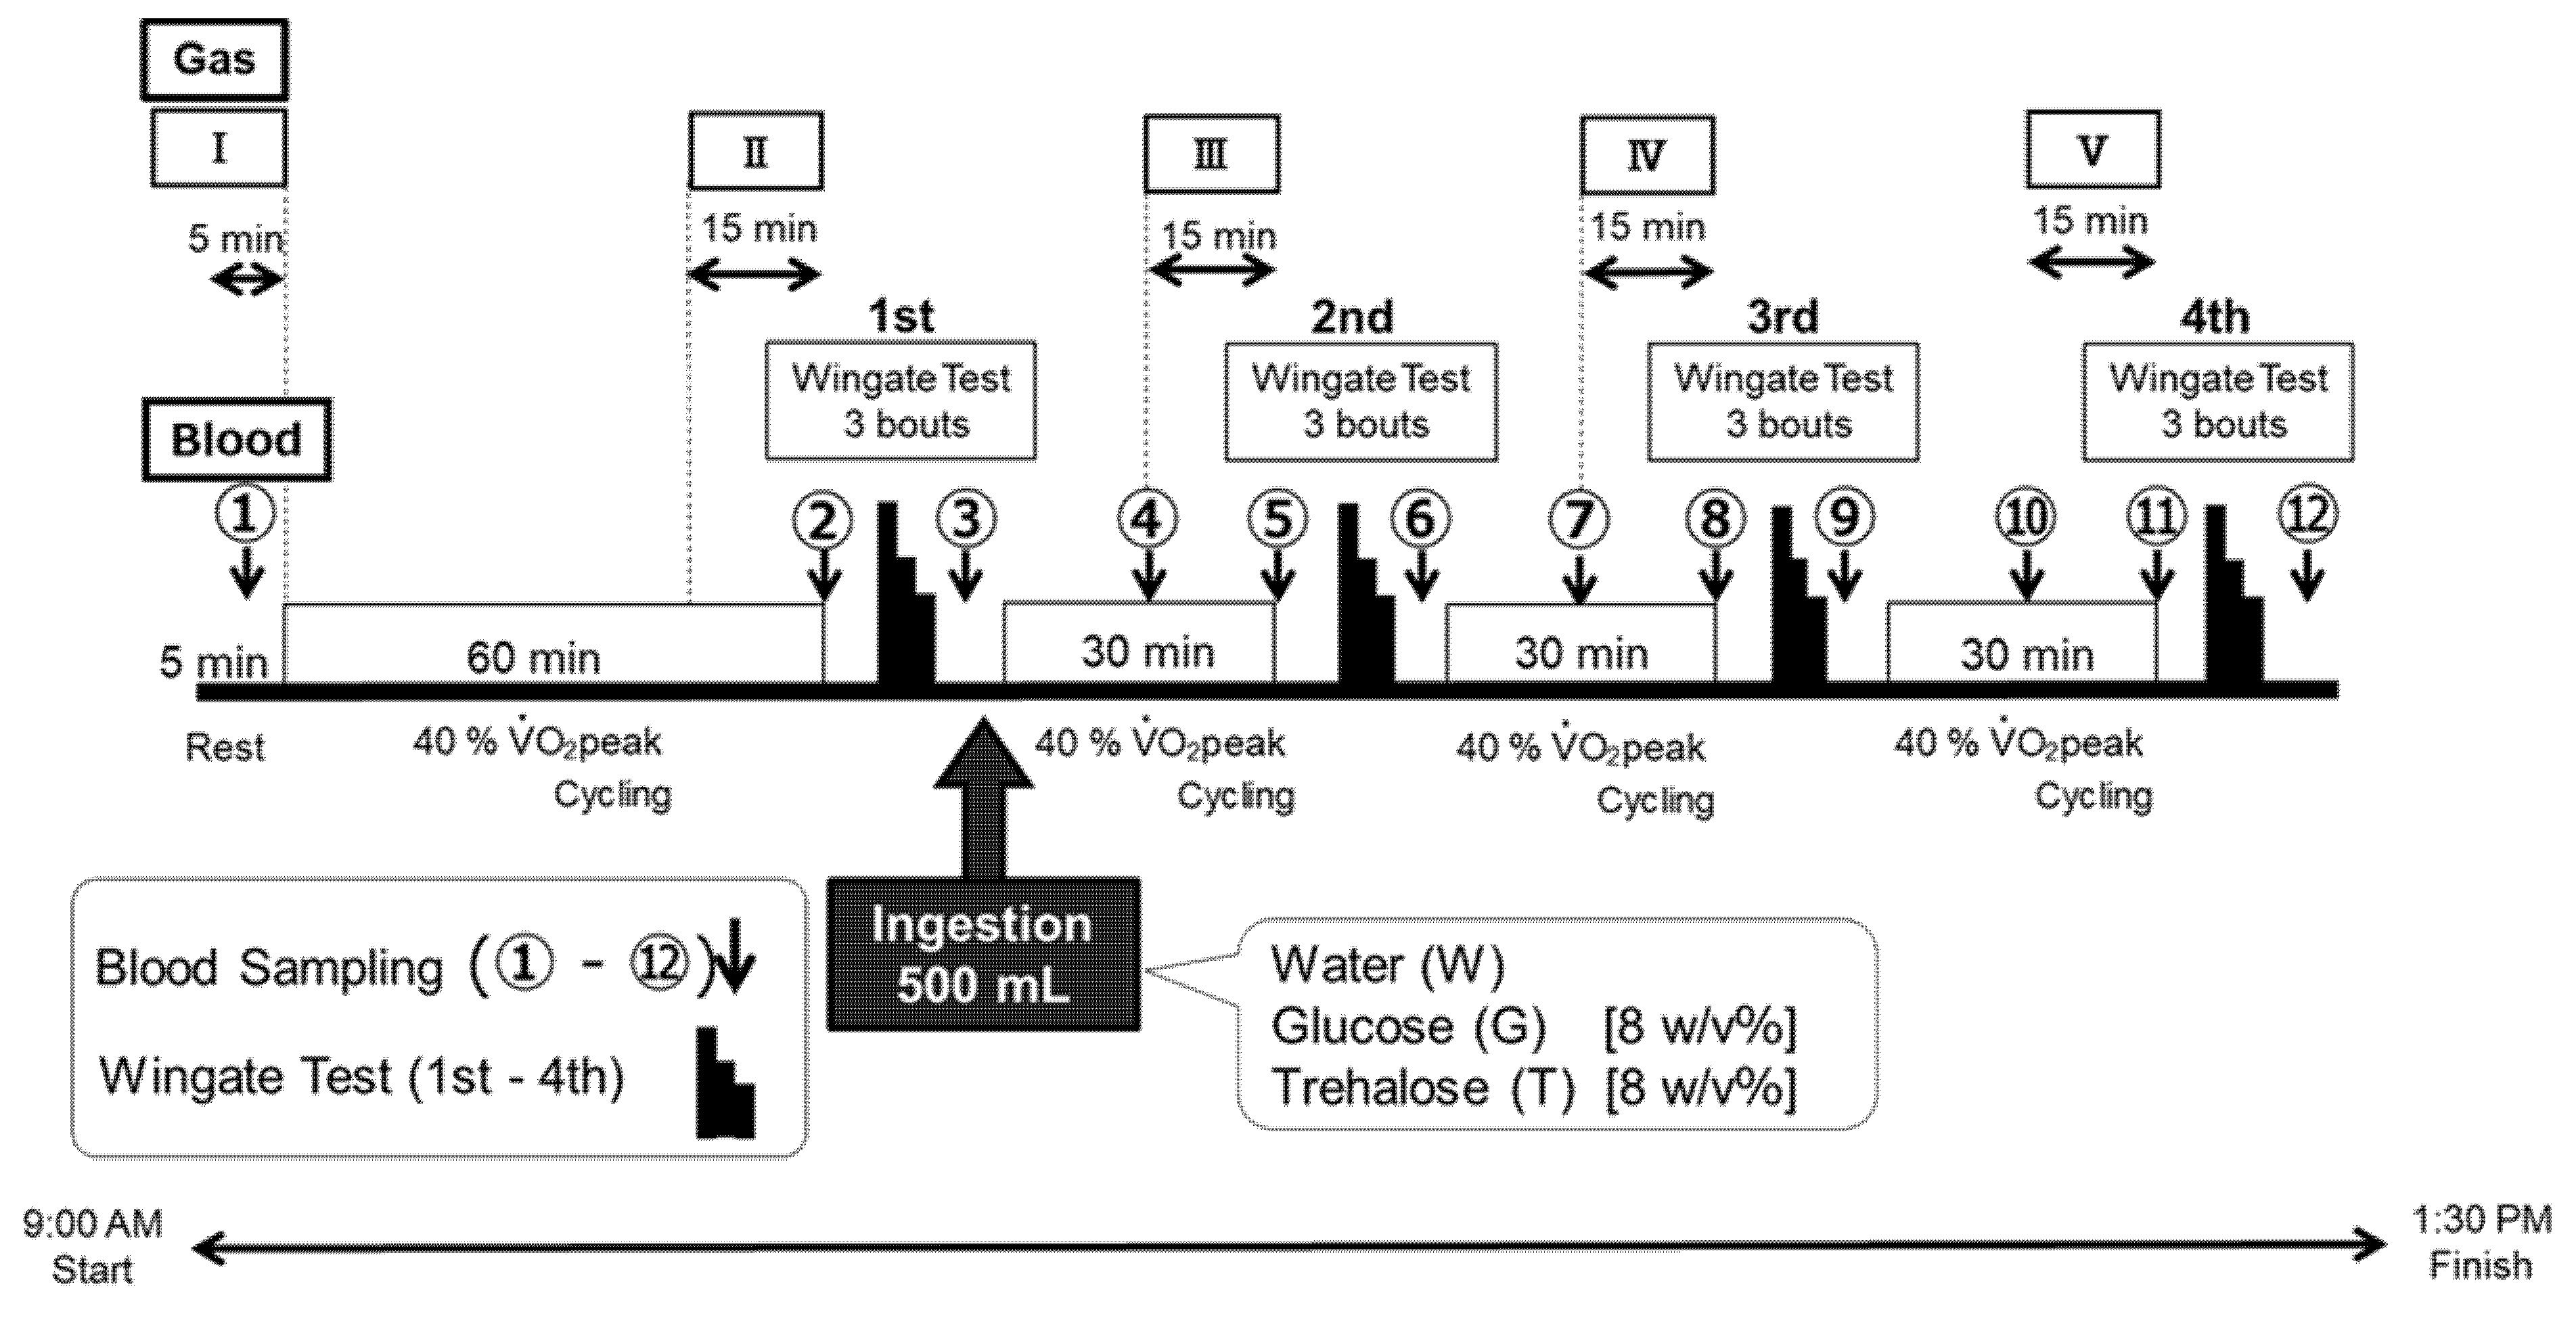
2.3. Experimental Design
2.3.1. Wadazumi Protocol
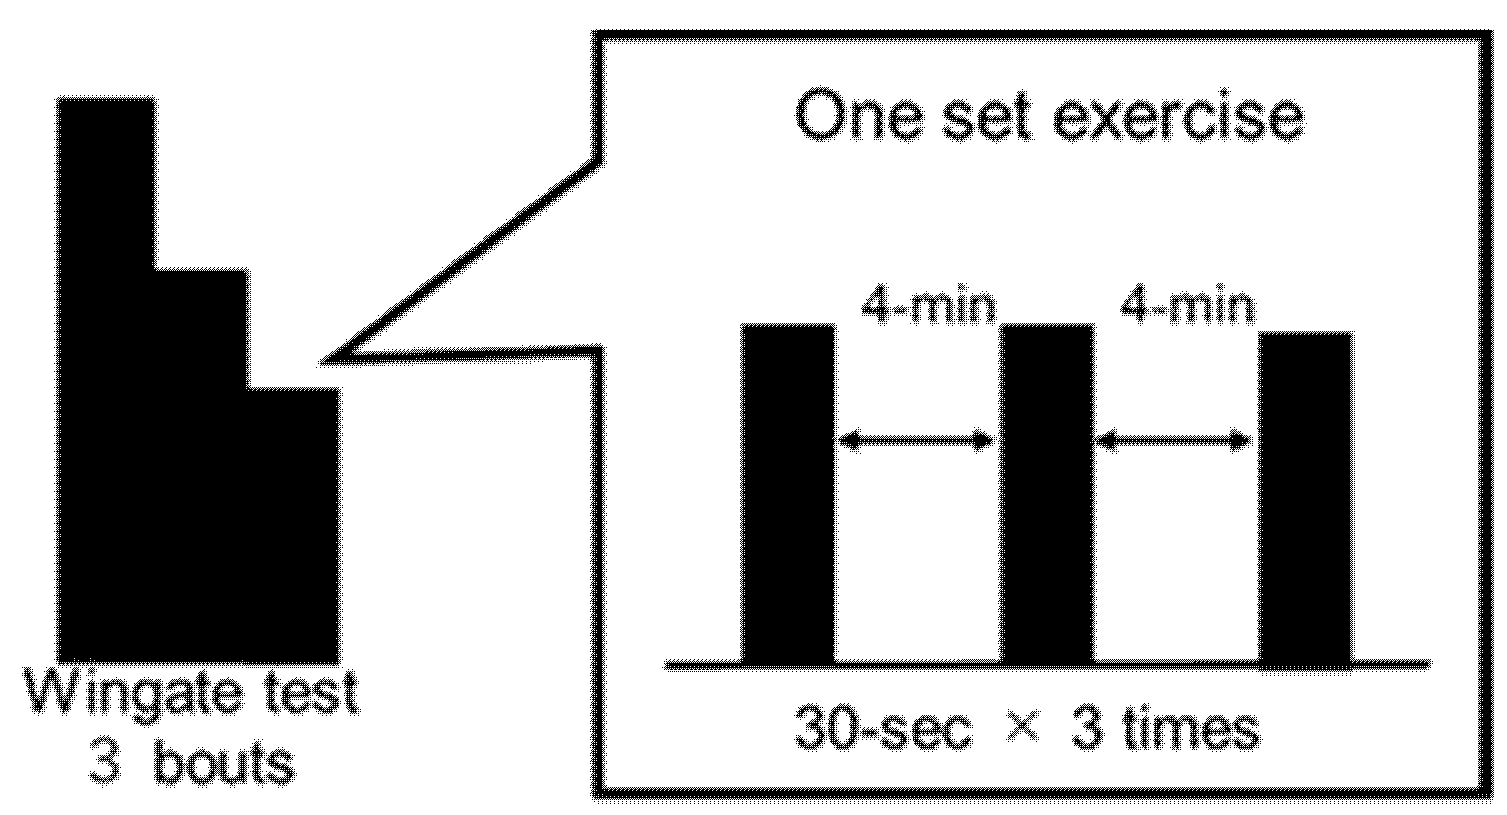
2.3.2. Wingate Test

2.4. Trial Drinks
2.5. Measurements
2.5.1. Exercise Performance
2.5.2. Blood Chemical Analysis
2.5.3. Expired Gas Analysis
2.5.4. Ratings of Perceived Exertion (RPE)
2.6. Statistical Analysis
2.7. Ethics
3. Results
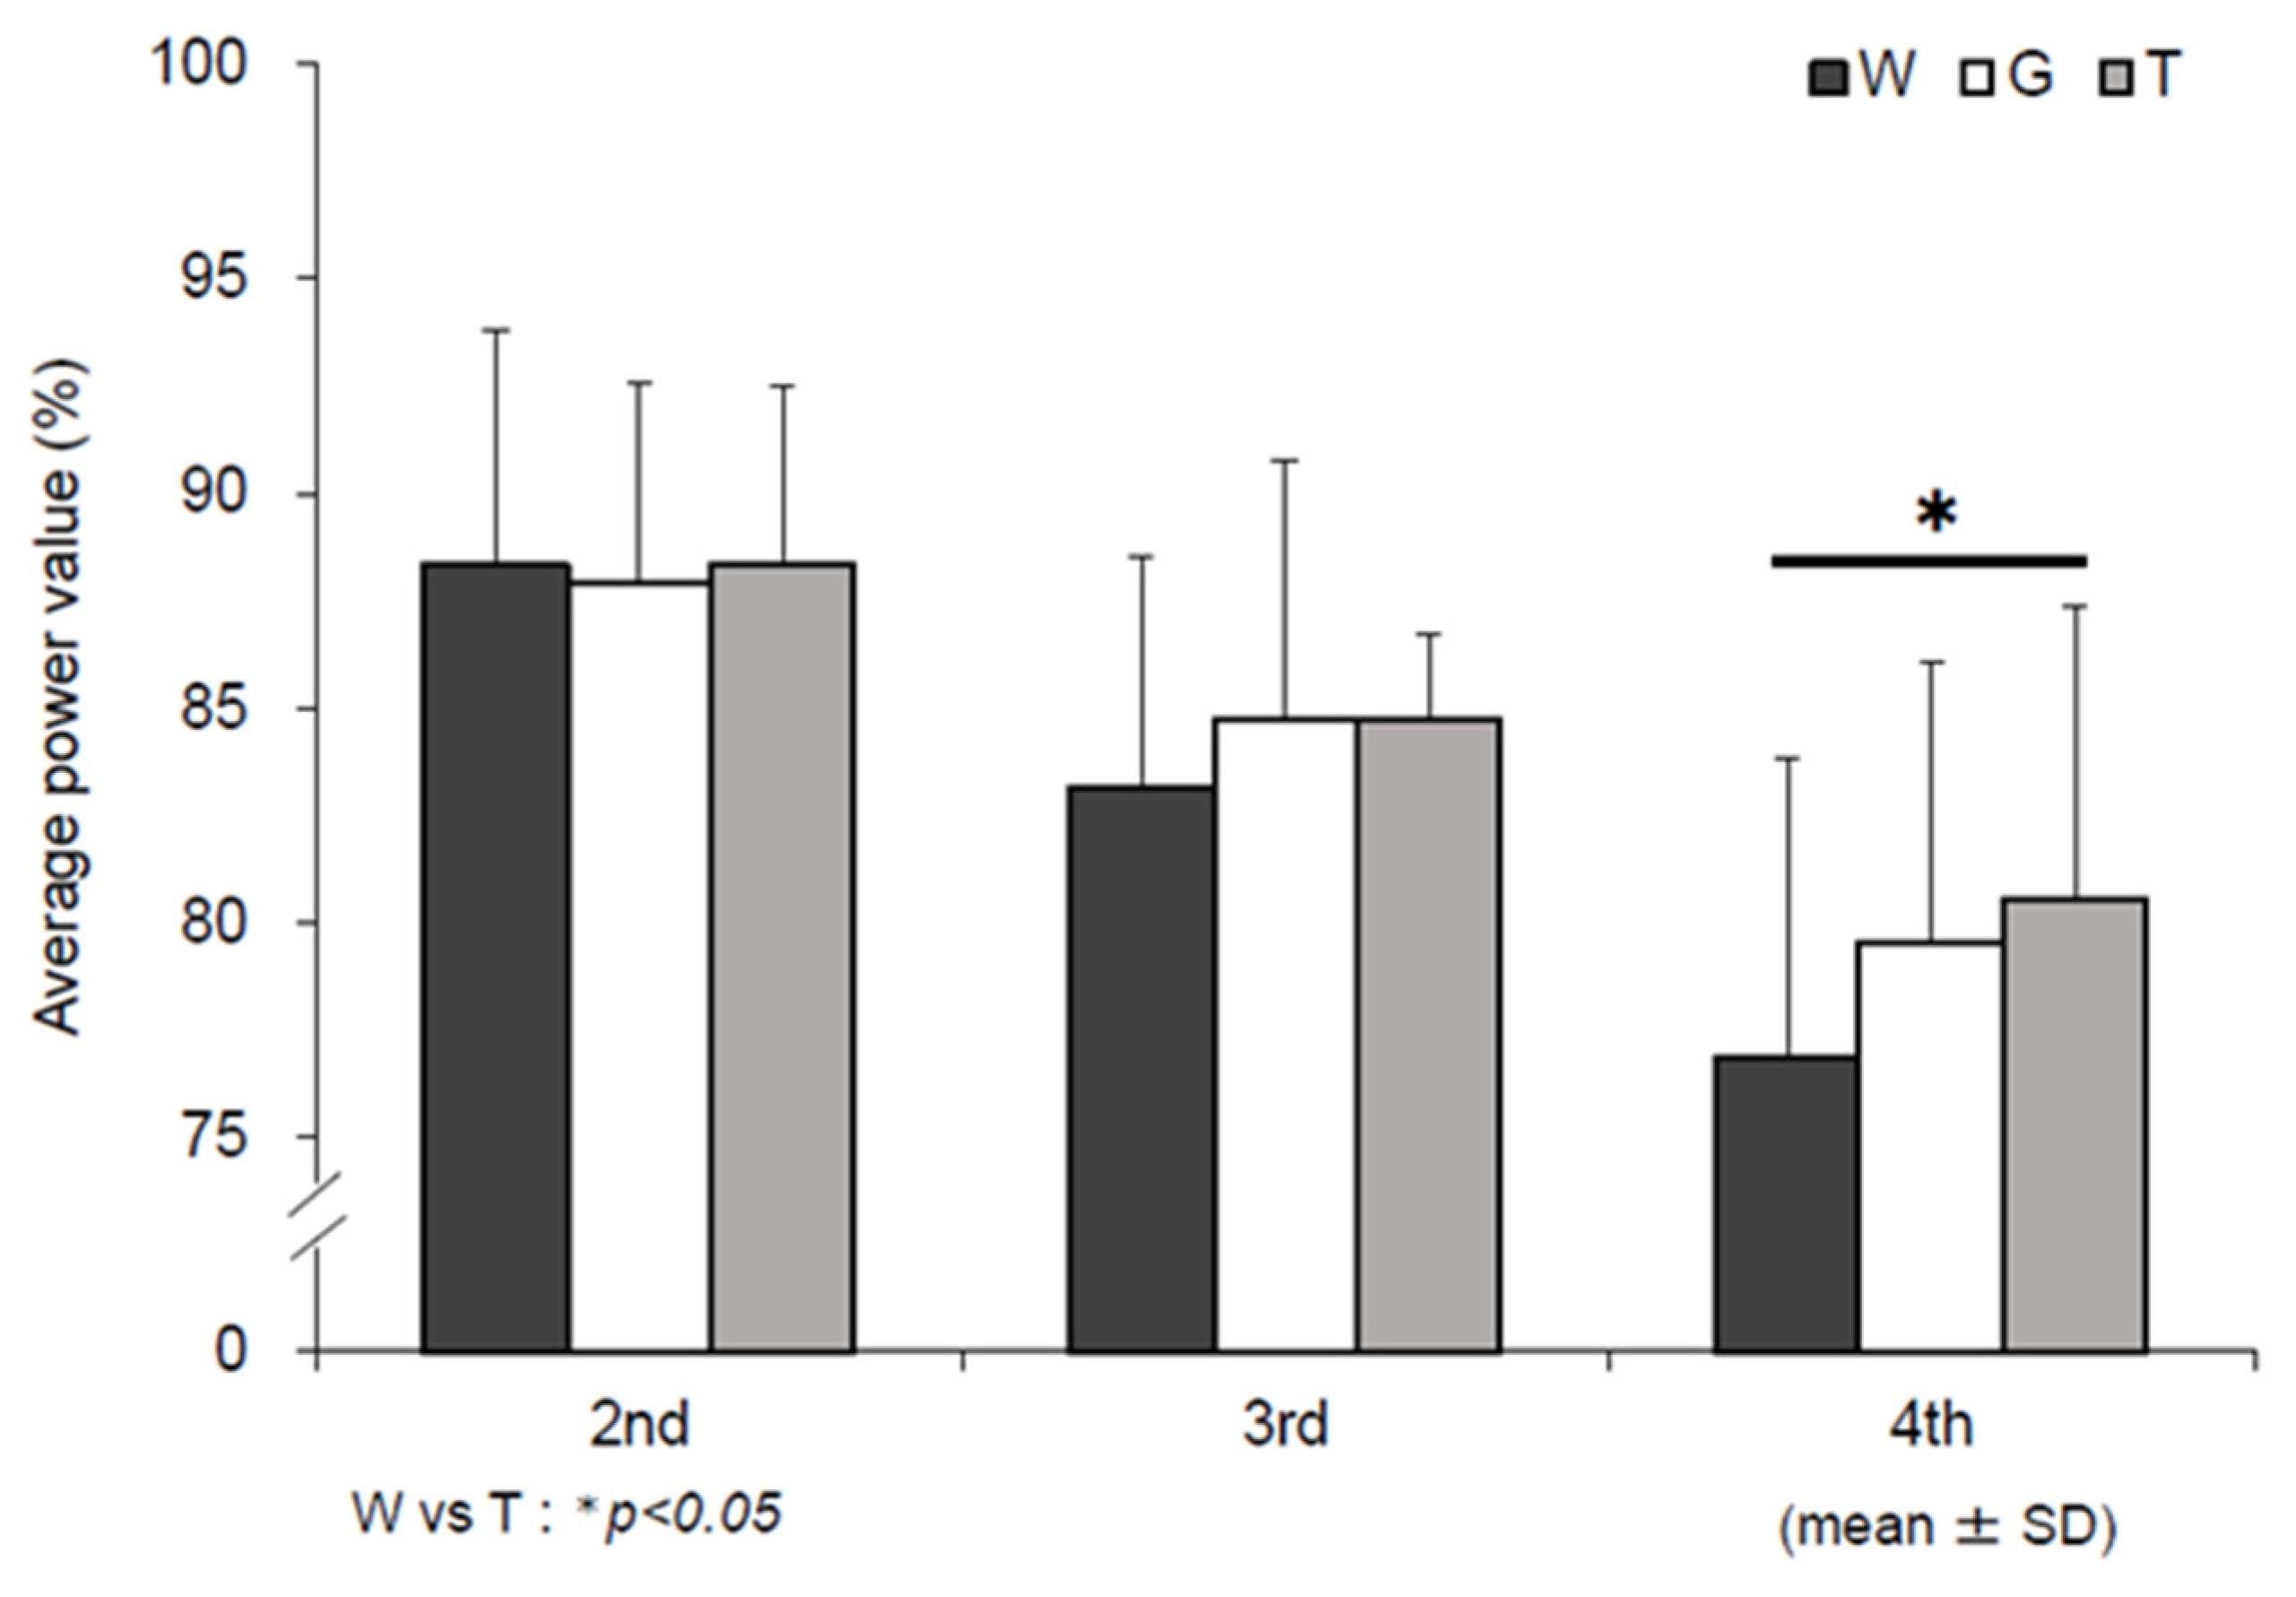
3.1. Mean Power Value
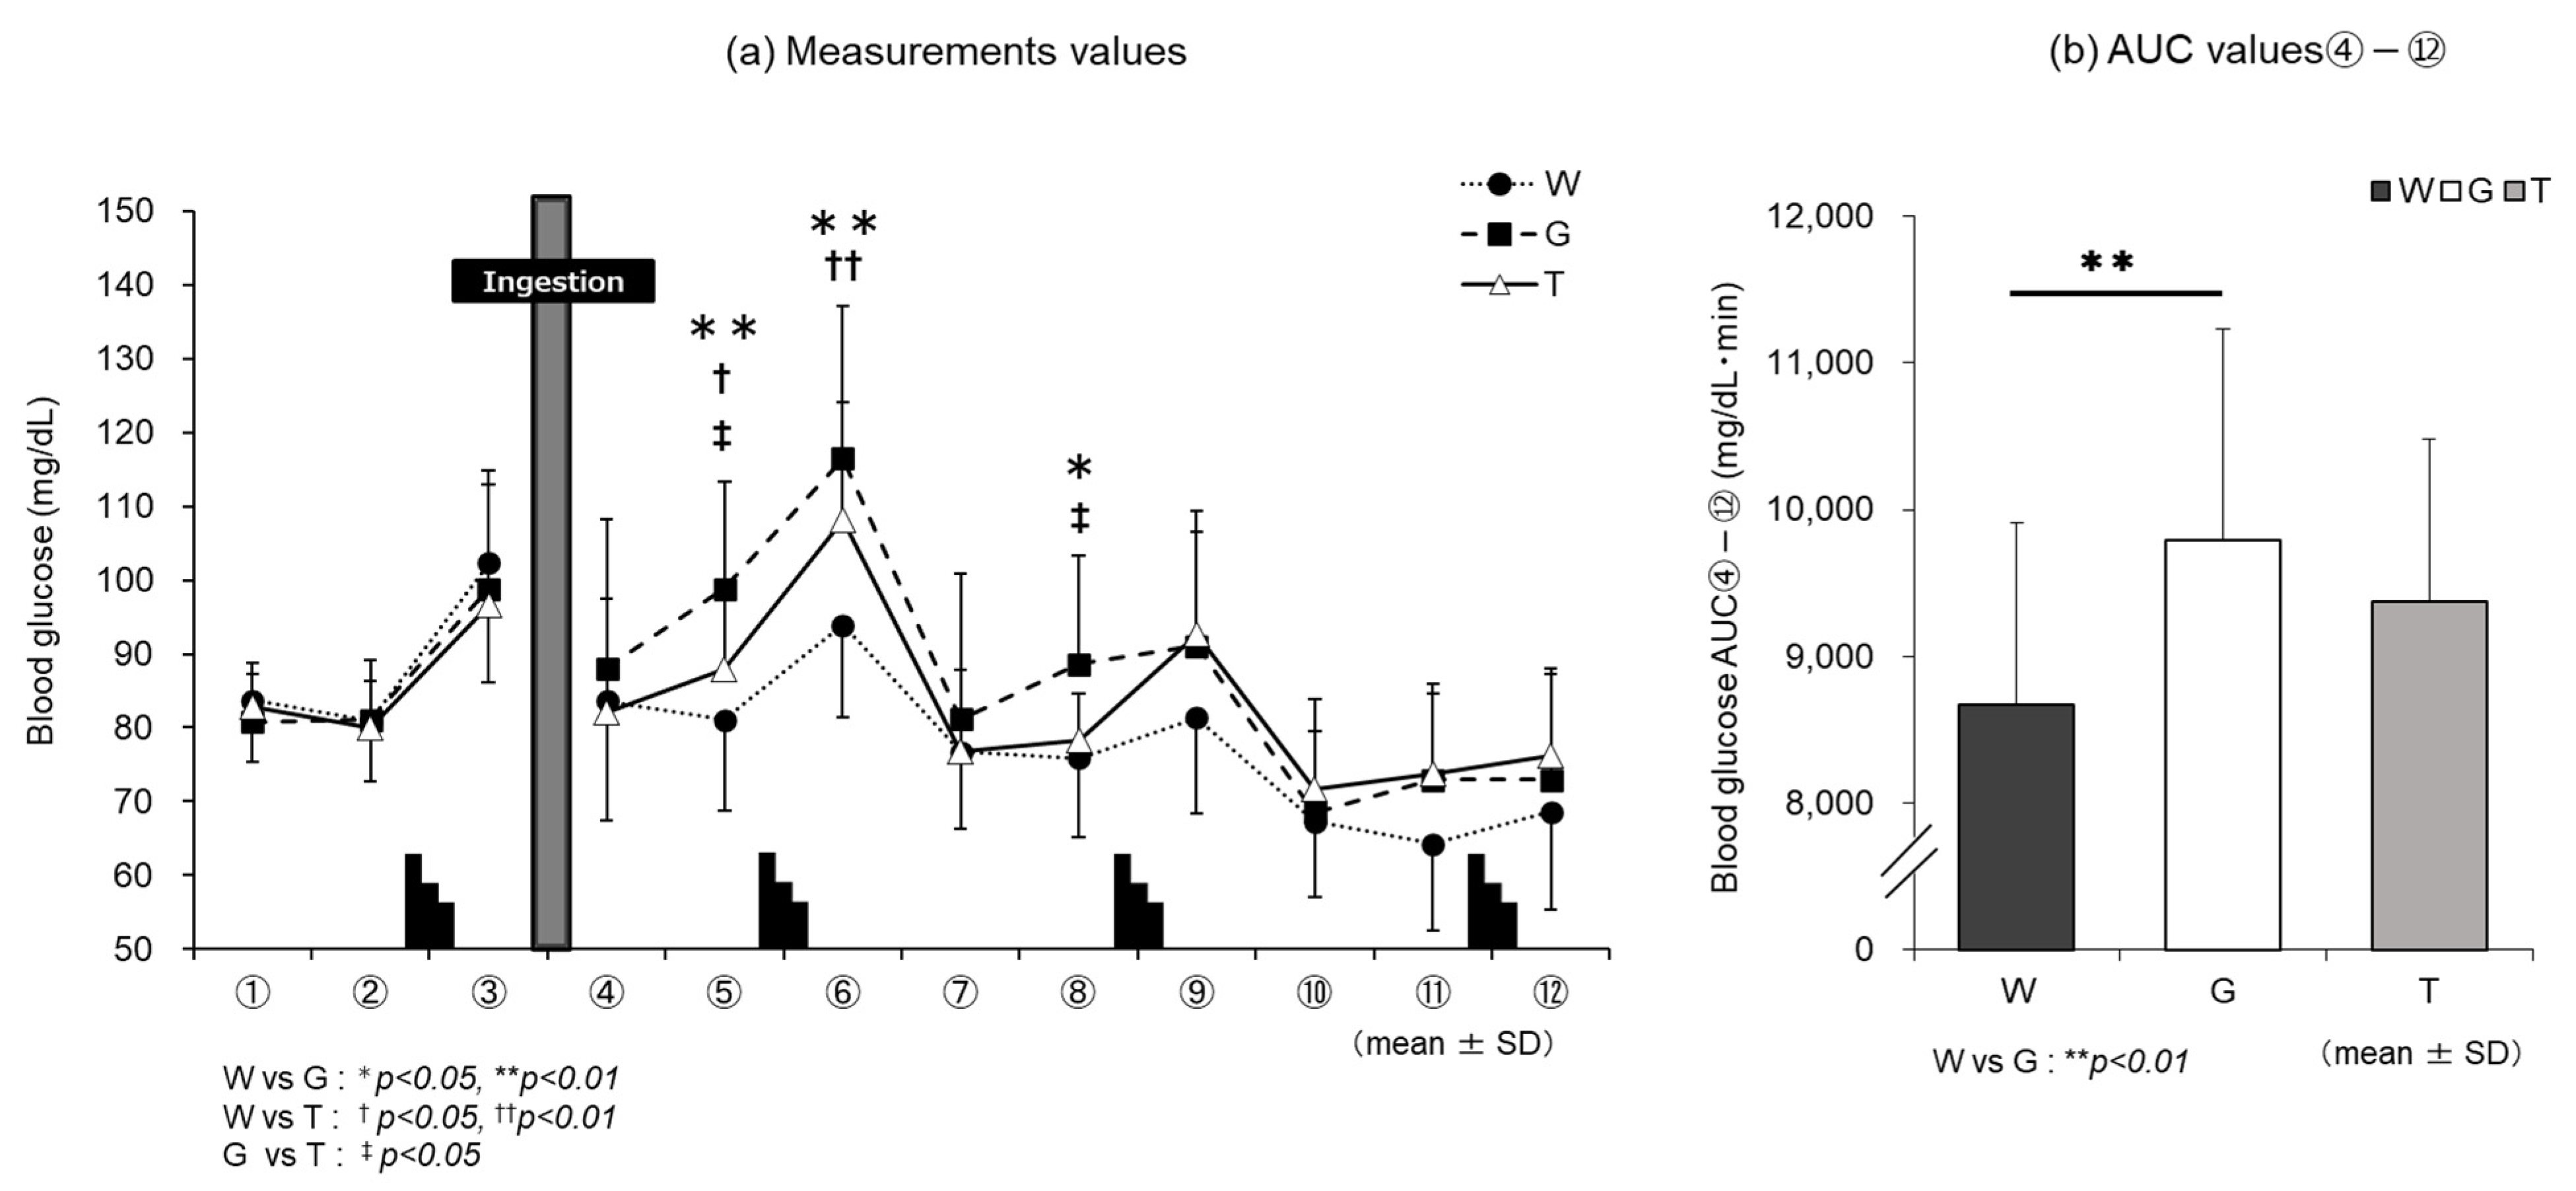
3.2. Blood Glucose Level
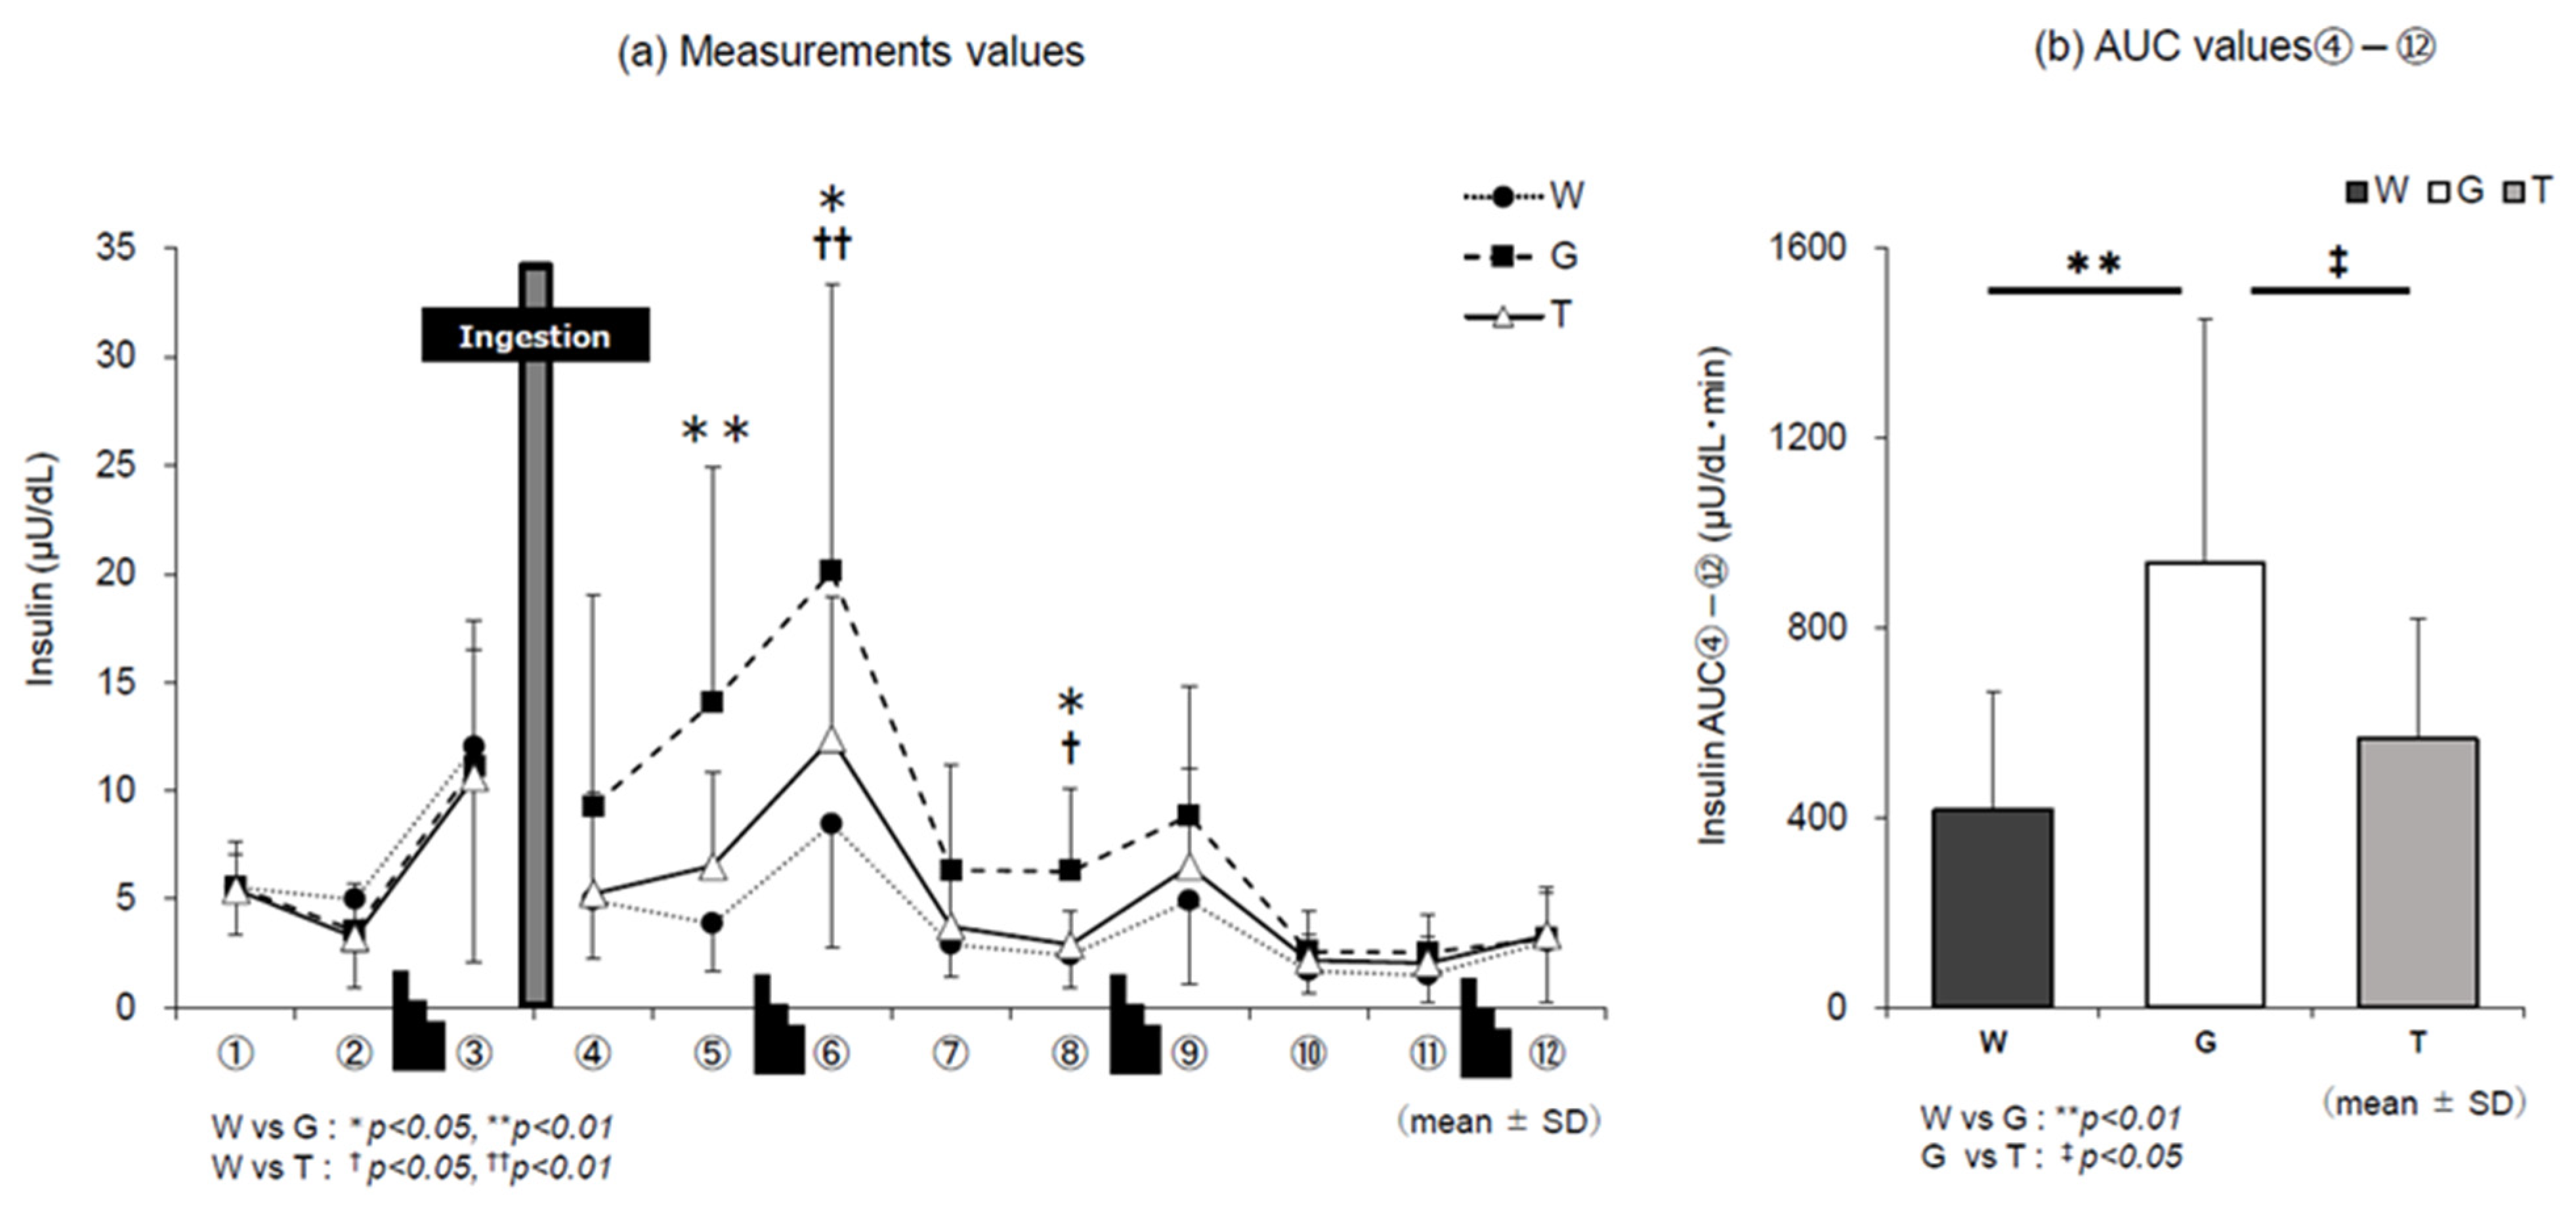
3.3. Insulin Level
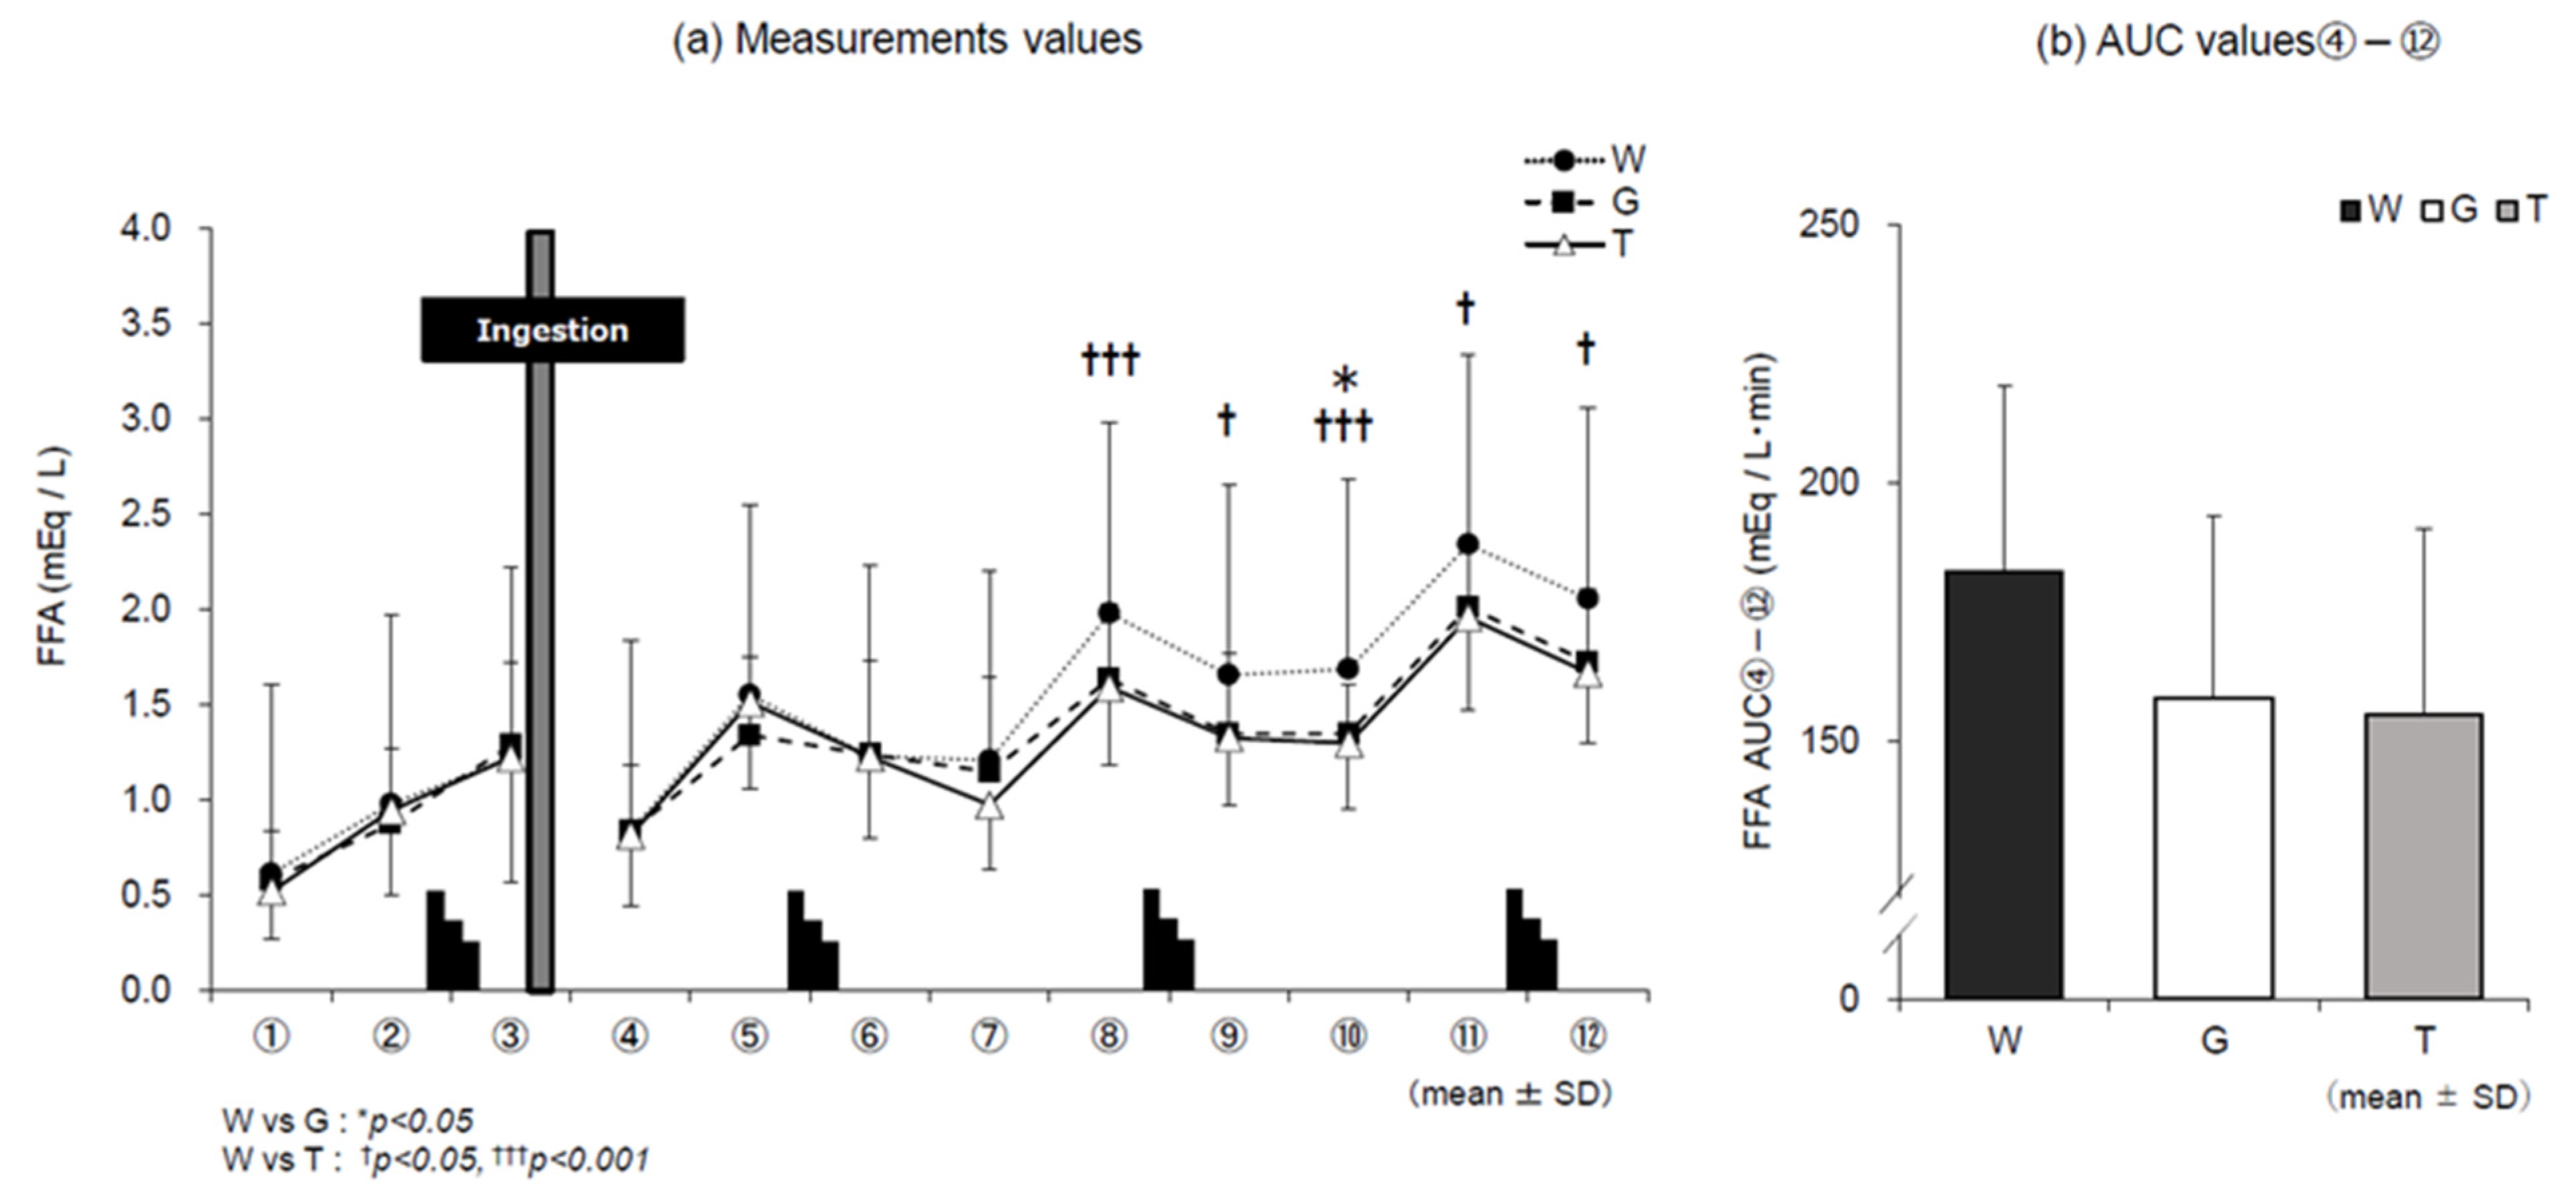
3.4. FFA
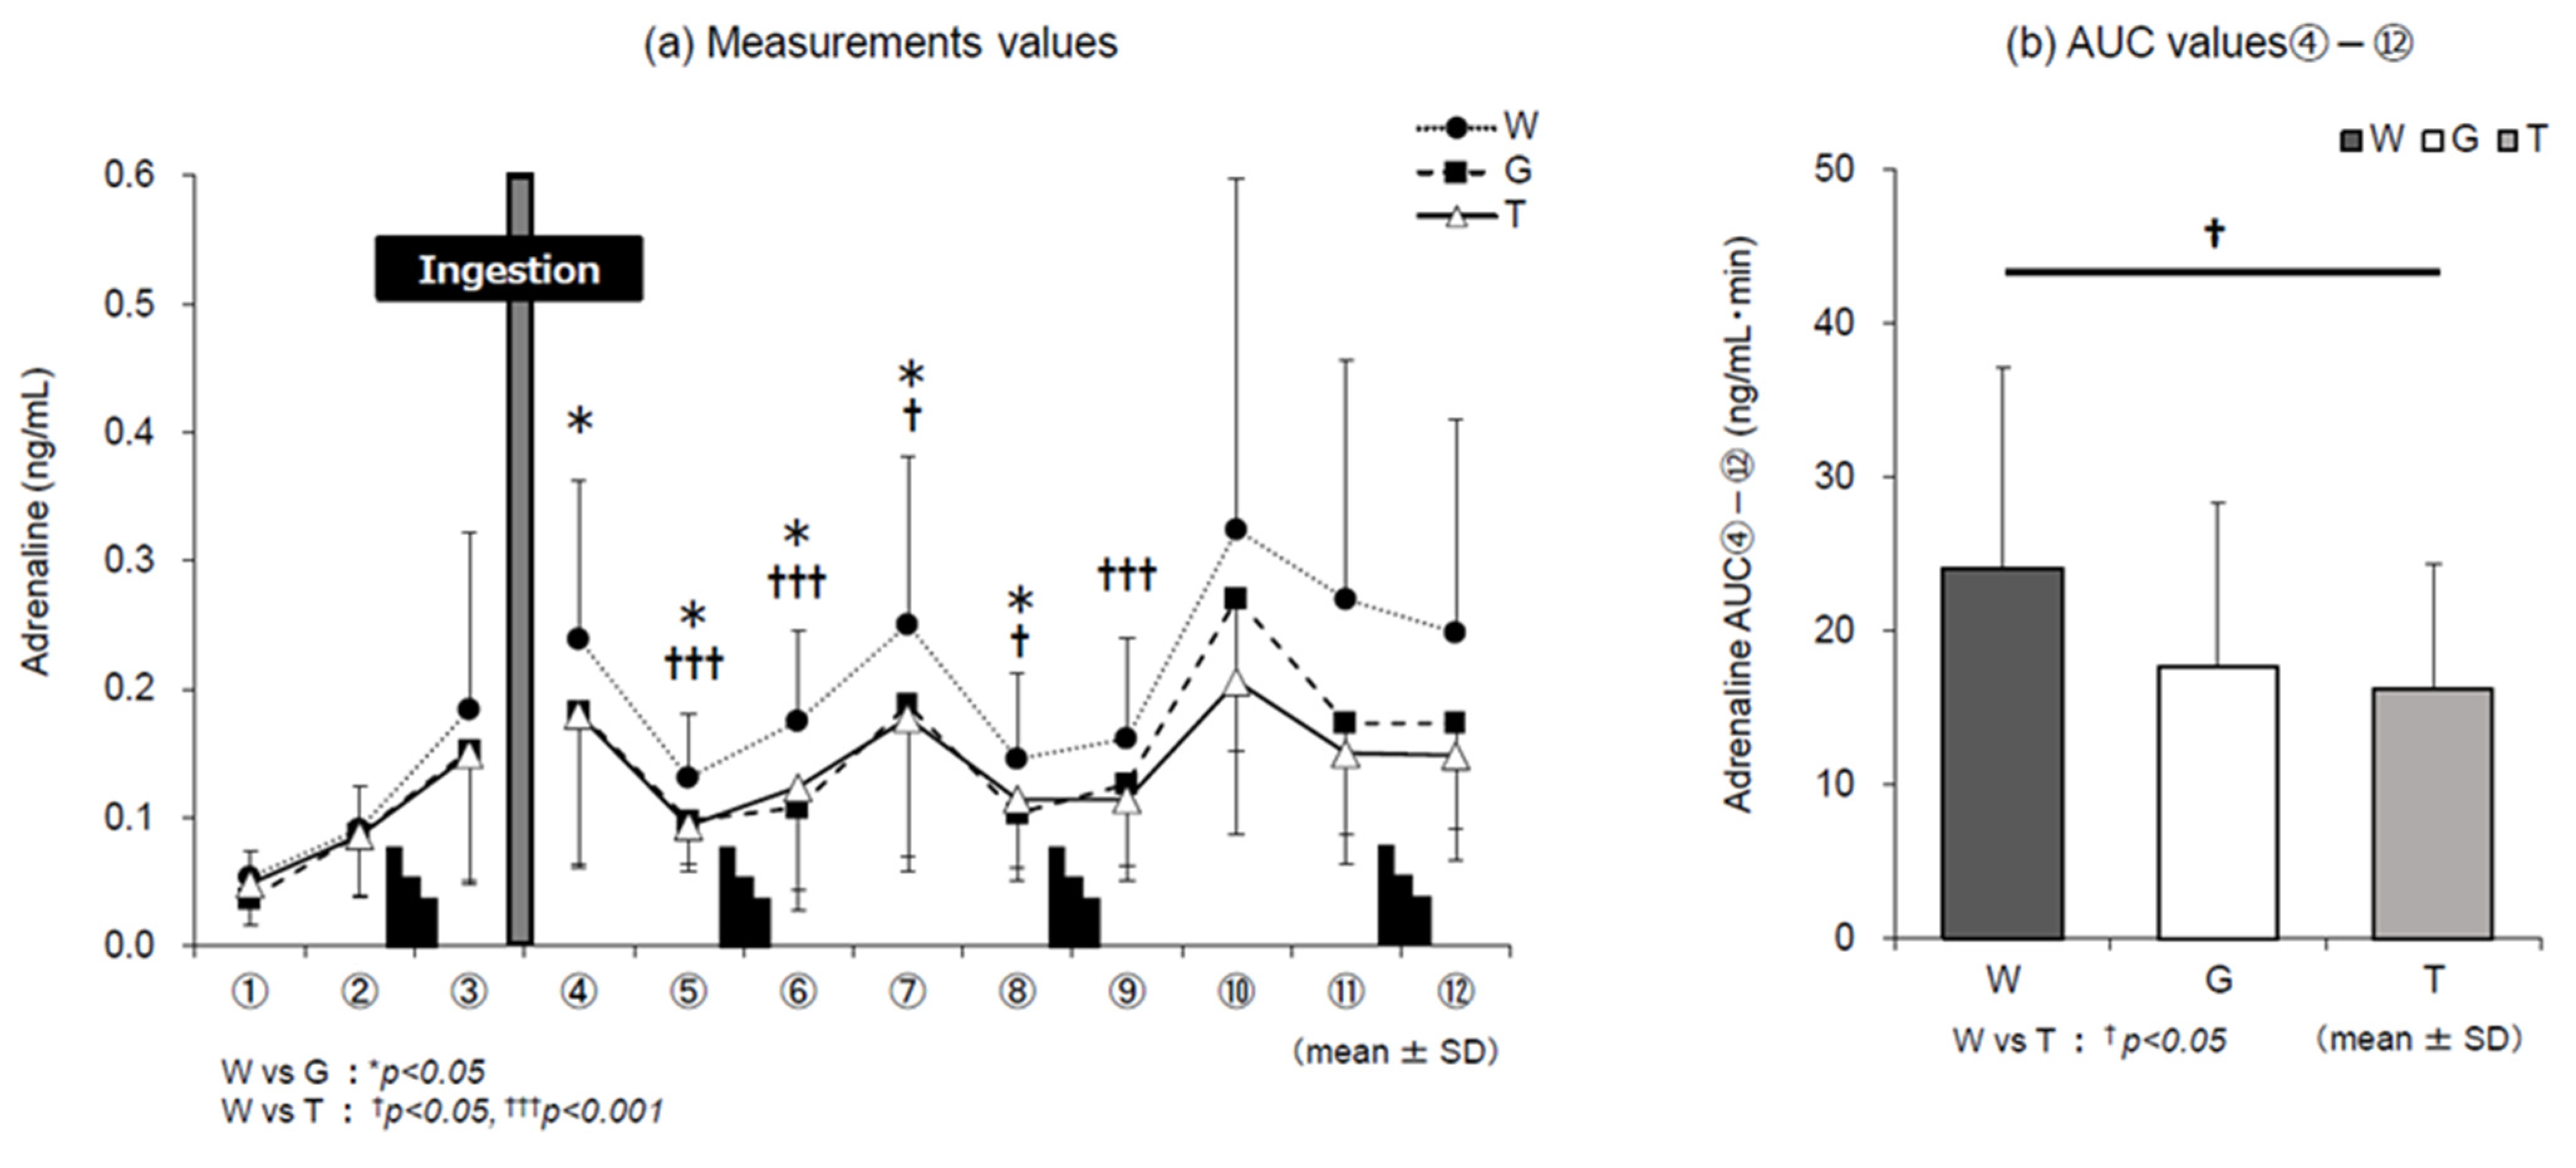
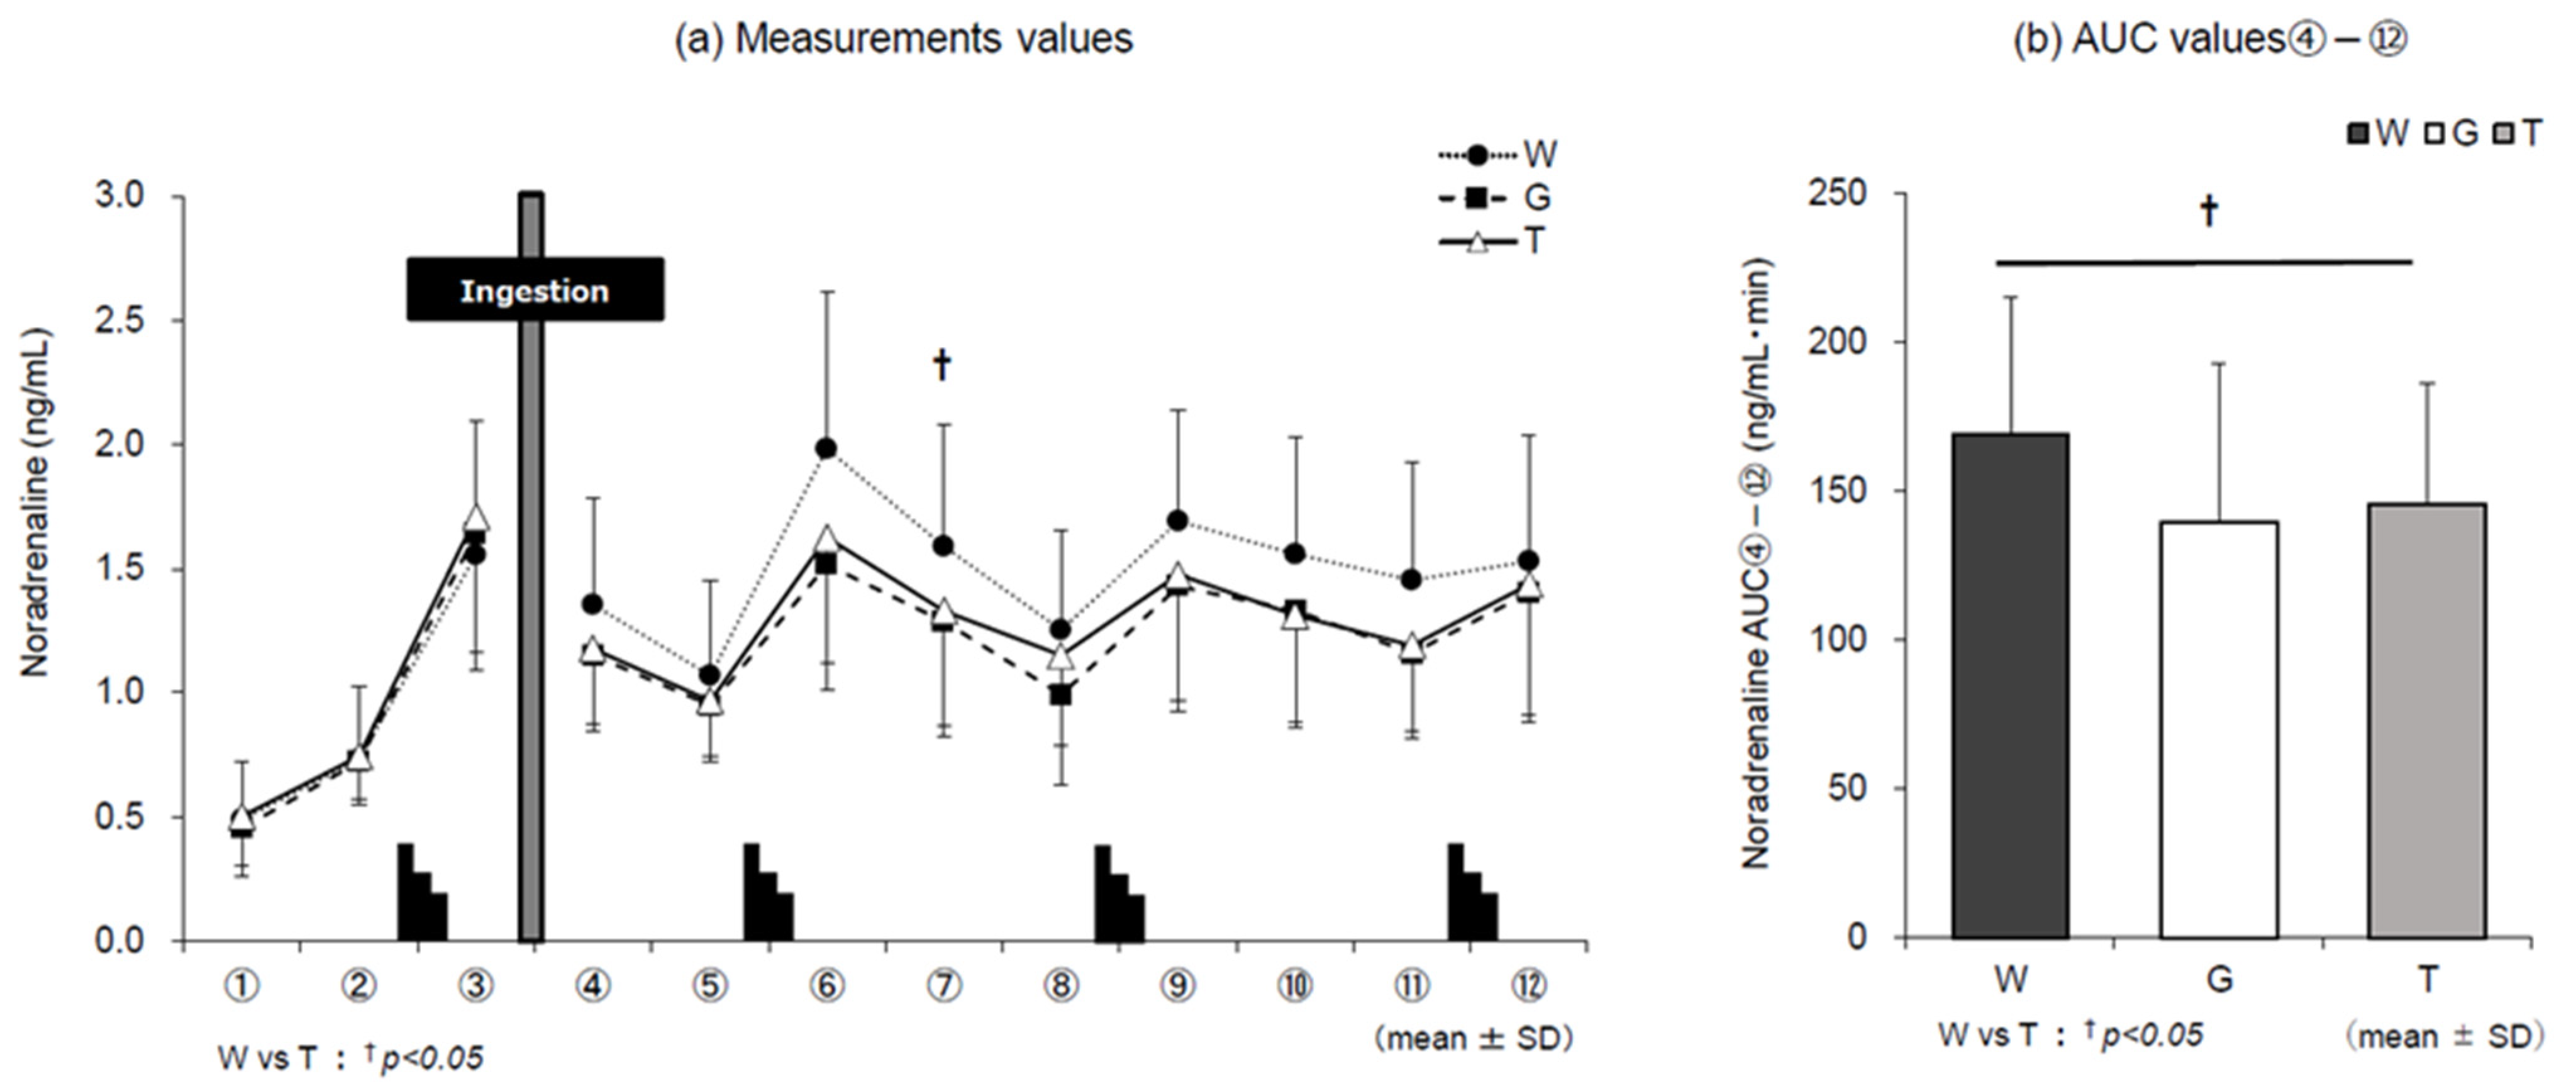
3.5. Catecholamines
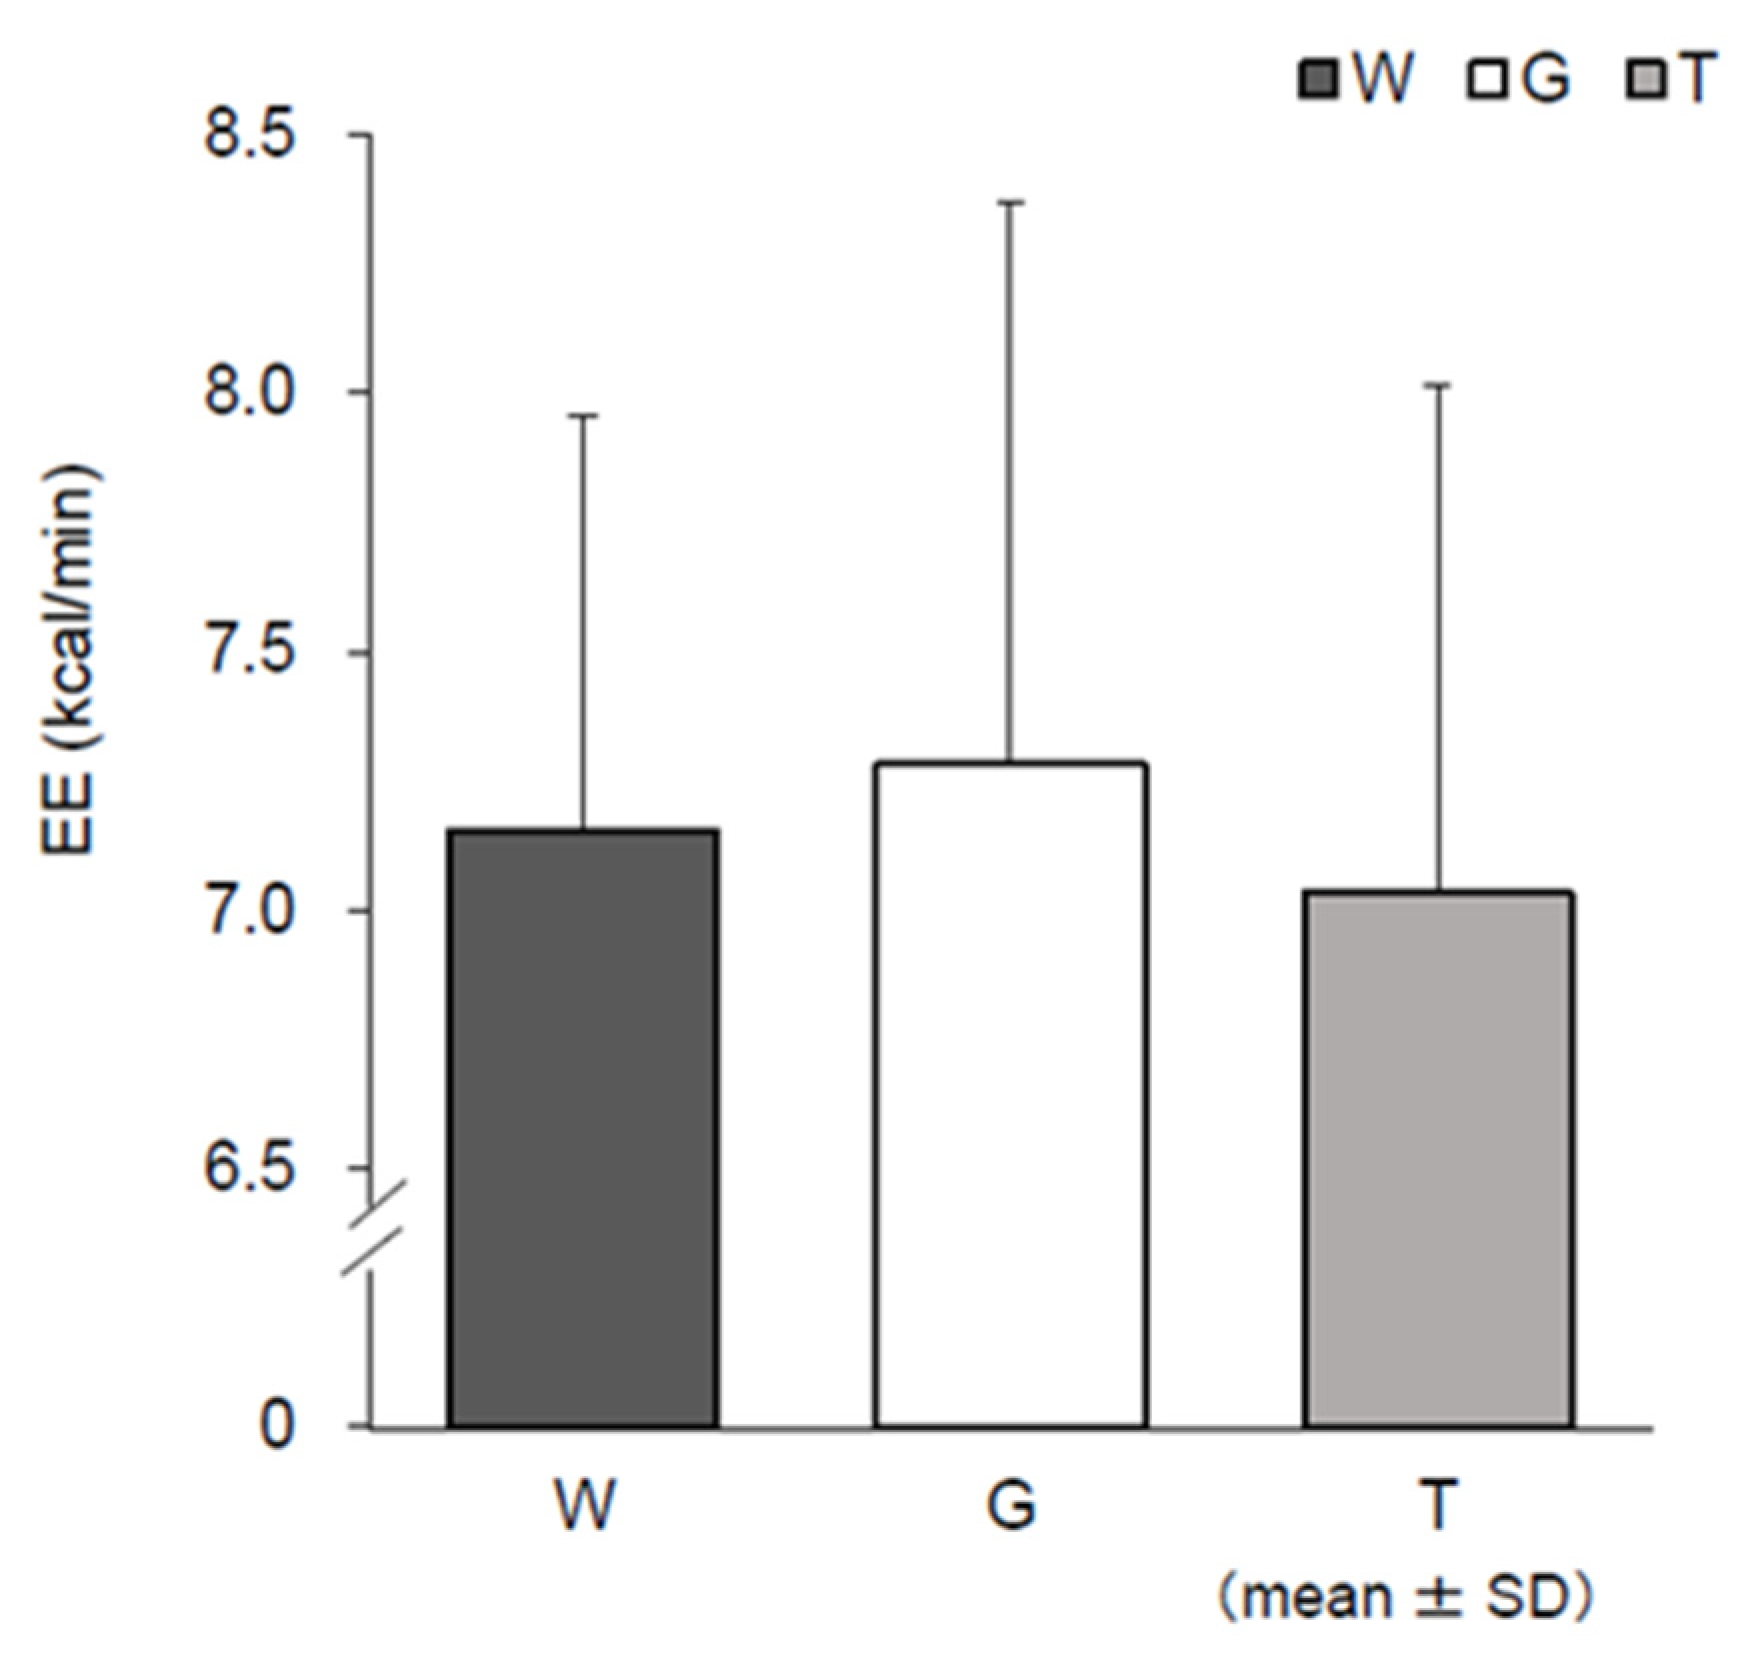
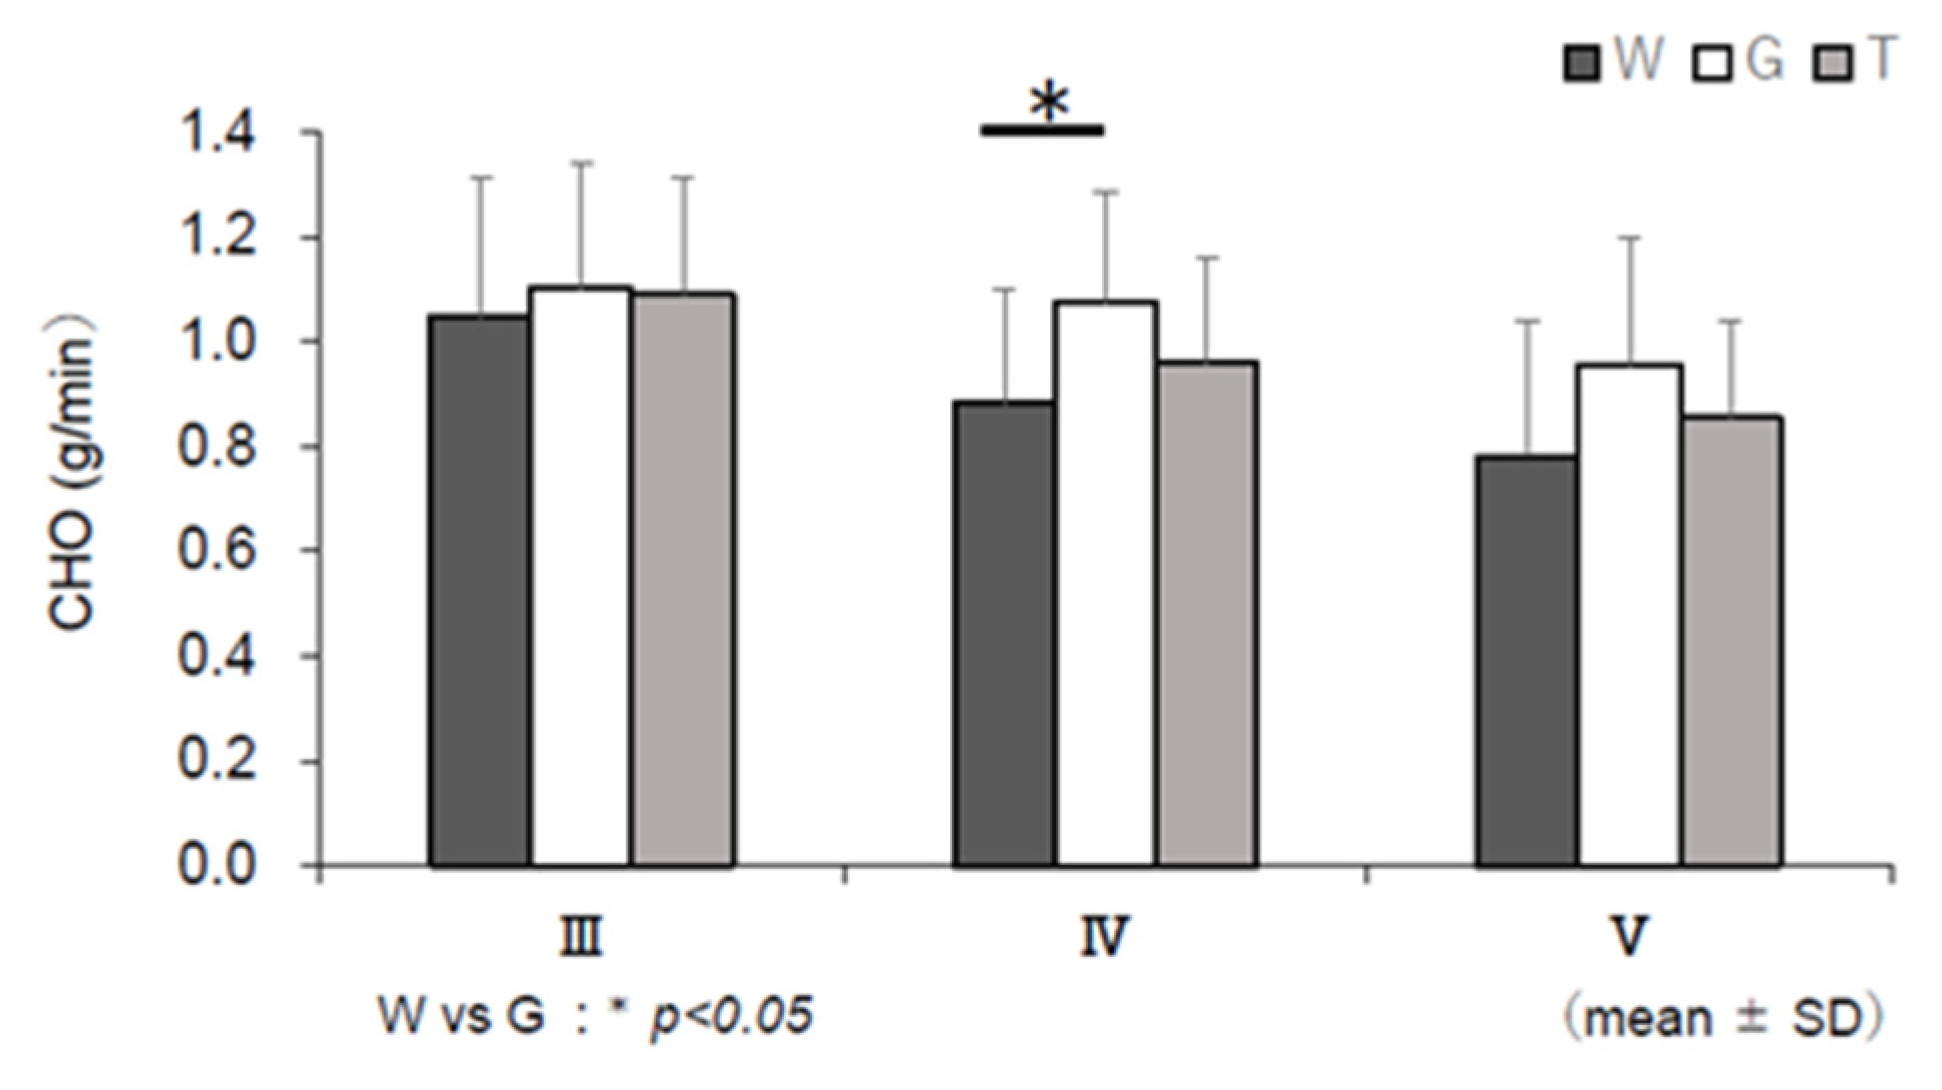
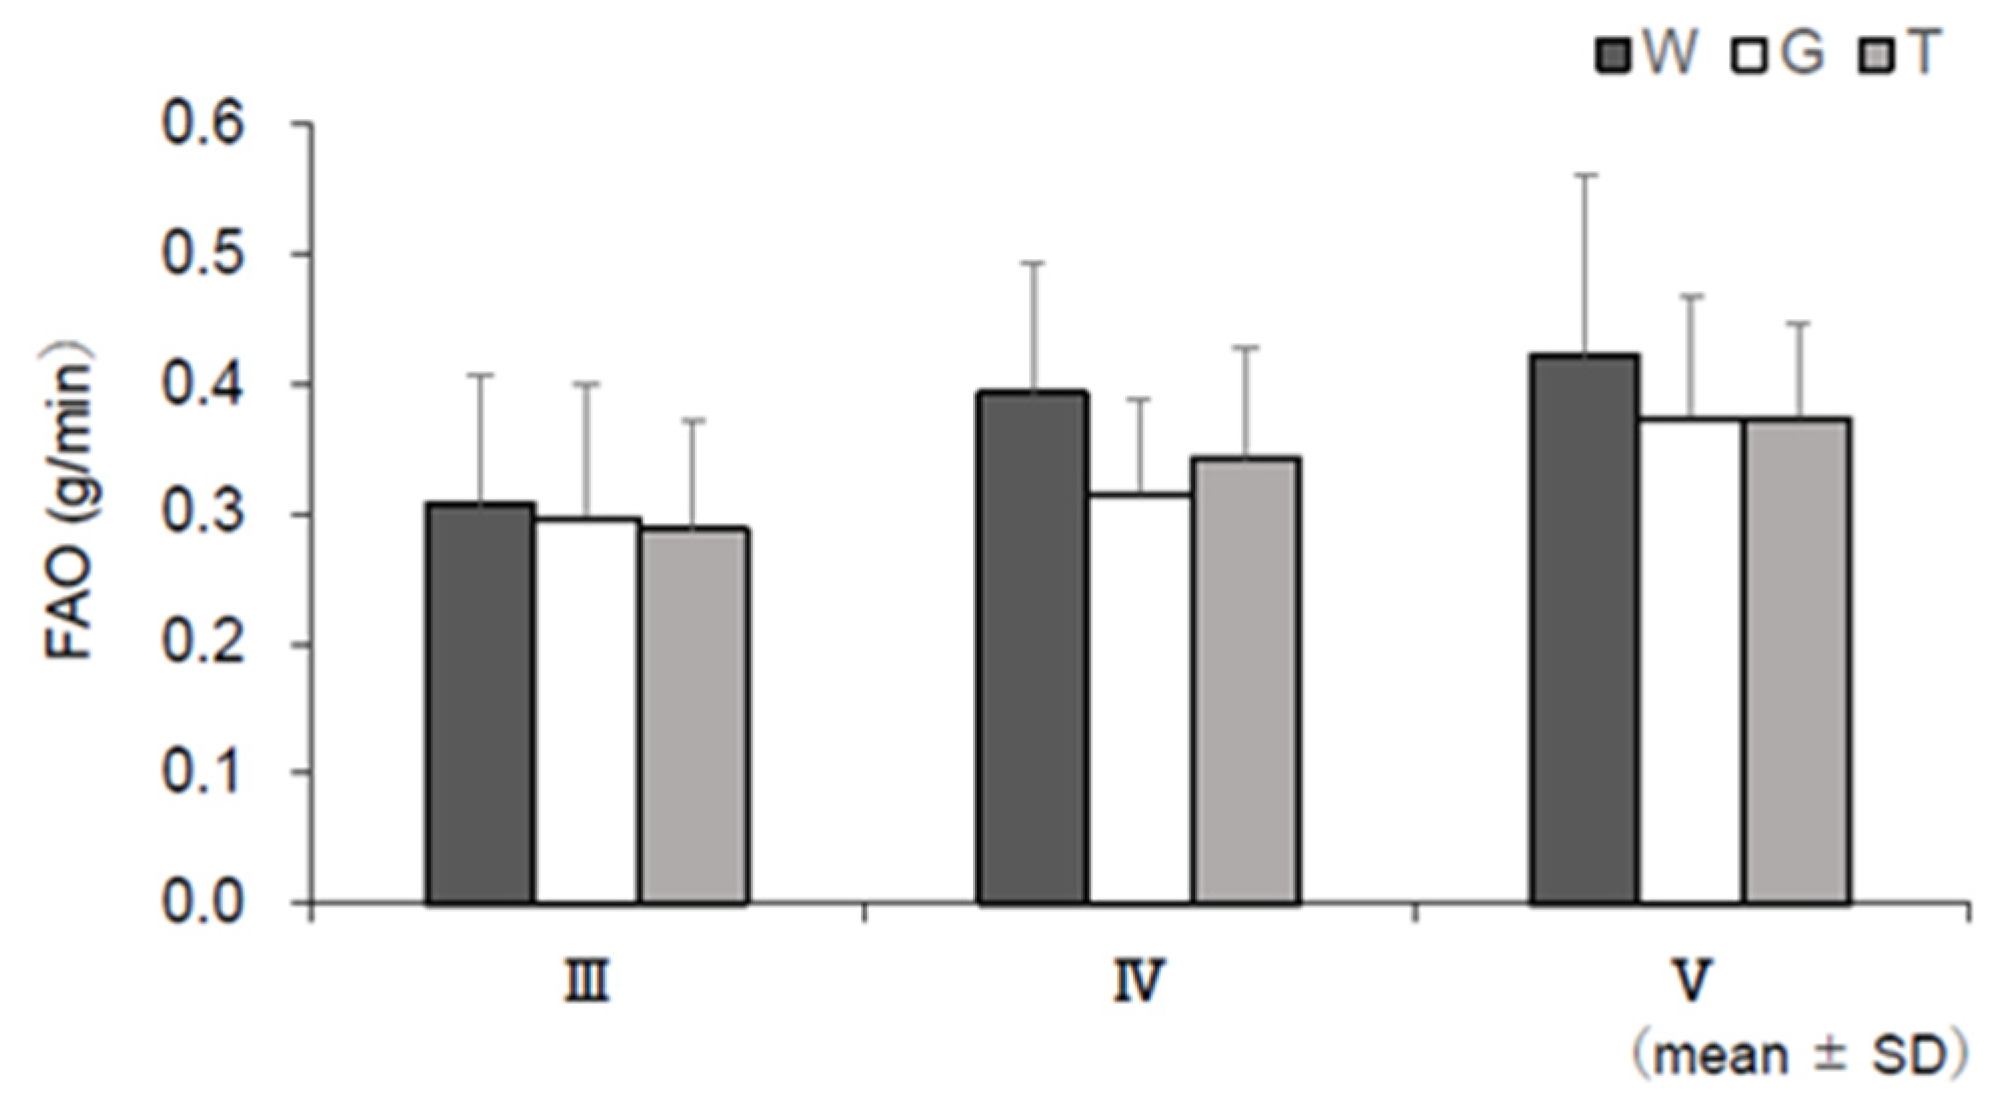
3.6. RER, EE, CHO, and FAO
3.7. Lactate, RPE, Amount of Free Water Intake
4. Discussion
4.1. Dynamics of Adrenaline
4.2. Use of Lipids
4.3. Use of Carbohydrate
4.4. Trend of Insulin
4.5. Applications and Future Research
5. Conclusions
Author Contributions
Funding
Institutional Review Board Statement
Informed Consent Statement
Data Availability Statement
Acknowledgments
Conflicts of Interest
References
- Gollnick, P.D.; Piehl, K.; Saltin, B. Selective glycogen depletion pattern in human muscle fibres after exercise of varying intensity and at varying pedalling rates. J. Physiol. 1974, 241, 45–57. [Google Scholar] [CrossRef] [PubMed]
- Gibala, M.J.; McGee, S.L.; Garnham, A.P.; Howlett, K.F.; Snow, R.J.; Hargreaves, M. Brief intense interval exercise activates AMPK and p38 MAPK signaling and increases the expression of PGC-1alpha in human skeletal muscle. J. Appl. Physiol. (1985) 2009, 106, 929–934. [Google Scholar] [CrossRef] [PubMed]
- Howlett, K.; Angus, D.; Proietto, J.; Hargreaves, M. Effect of increased blood glucose availability on glucose kineticsduring exercise. J. Appl. Physiol. (1985) 1998, 84, 1413–1417. [Google Scholar] [CrossRef]
- Thomas, D.T.; Erdman, K.A.; Burke, L.M. American College of Sports Medicine Joint Position Statement. Nutrition and Athletic Performance. Med. Sci. Sports Exerc. 2016, 48, 543–568. [Google Scholar] [CrossRef] [PubMed]
- McConell, G.; Kloot, K.; Hargreaves, M. Effect of timing of carbohydrate ingestion on endurance exercise performance. Med. Sci. Sports Exerc. 1996, 28, 1300–1304. [Google Scholar] [CrossRef]
- Mitchell, J.B.; Costill, D.L.; Houmard, J.A.; Flynn, M.G.; Fink, W.J.; Beltz, J.D. Effects of carbohydrate ingestion on gastric emptying and exercise performance. Med. Sci. Sports Exerc. 1988, 20, 110–115. [Google Scholar] [CrossRef]
- Murray, R.; Eddy, D.E.; Murray, T.W.; Seifert, J.G.; Paul, G.L.; Halaby, G.A. The effect of fluid and carbohydrate feedings during intermittent cycling exercise. Med. Sci. Sports Exerc. 1987, 19, 597–604. [Google Scholar] [CrossRef]
- Murray, R.; Paul, G.L.; Seifert, J.G.; Eddy, D.E.; Halaby, G.A. The effects of glucose, fructose, and sucrose ingestion during exercise. Med. Sci. Sports Exerc. 1989, 21, 275–282. [Google Scholar] [CrossRef] [PubMed]
- Murray, R.; Paul, G.L.; Seifert, J.G.; Eddy, D.E. Responses to varying rates of carbohydrate ingestion during exercise. Med. Sci. Sports Exerc. 1991, 23, 713–718. [Google Scholar] [CrossRef]
- Neufer, P.D.; Costill, D.L.; Flynn, M.G.; Kirwan, J.P.; Mitchell, J.B.; Houmard, J. Improvements in exercise performance: Effects of carbohydrate feedings and diet. J. Appl. Physiol. (1985) 1987, 62, 983–988. [Google Scholar] [CrossRef] [PubMed]
- Skein, M.; Duffield, R.; Kelly, B.T.; Marino, F.E. The effects of carbohydrate intake and muscle glycogen content on self-paced intermittent-sprint exercise despite no knowledge of carbohydrate manipulation. Eur. J. Appl. Physiol. 2012, 112, 2859–2870. [Google Scholar] [CrossRef]
- Higashiyama, T. Novel functions and applications of trehalose. Pure Appl. Chem. 2002, 74, 1263–1269. [Google Scholar] [CrossRef]
- Jentjens, R.L.; Jeukendrup, A.E. Effects of pre-exercise ingestion of trehalose, galactose and glucose on subsequent metabolism and cycling performance. Eur. J. Appl. Physiol. 2003, 88, 459–465. [Google Scholar] [CrossRef] [PubMed]
- Oku, T.; Nakamura, S. Estimation of intestinal trehalase activity from a laxative threshold of trehalose and lactulose on healthy female subjects. Eur. J. Clin. Nutr. 2000, 54, 783–788. [Google Scholar] [CrossRef] [PubMed]
- Maki, K.C.; Kanter, M.; Rains, T.M.; Hess, S.P.; Geohas, J. Acute effects of low insulinemic sweeteners on postprandial insulin and glucose concentrations in obese men. Int. J. Food Sci. Nutr. 2009, 60 (Suppl. 3), 48–55. [Google Scholar] [CrossRef] [PubMed]
- Yoshizane, C.; Mizote, A.; Yamada, M.; Arai, N.; Arai, S.; Maruta, K.; Mitsuzumi, H.; Ariyasu, T.; Ushio, S.; Fukuda, S. Glycemic, insulinemic and incretin responses after oral trehalose ingestion in healthy subjects. Nutr. J. 2017, 16, 9. [Google Scholar] [CrossRef] [PubMed]
- Wadazumi, T.; Watanabe, K.; Watanabe, H.; Yokoyama, H.; Hongu, N.; Arai, N. Effects of a Single Ingestion of Trehalose during Prolonged Exercise. Sports (Basel) 2019, 7, 100. [Google Scholar] [CrossRef]
- Weir, J.B. New methods for calculating metabolic rate with special reference to protein metabolism. J. Physiol. 1949, 109, 1–9. [Google Scholar] [CrossRef]
- Jeukendrup, A.E.; Wallis, G.A. Measurement of substrate oxidation during exercise by means of gas exchange measurements. Int. J. Sports Med. 2005, 26 (Suppl. 1), S28–S37. [Google Scholar] [CrossRef]
- Borg, G.A. Psychophysical bases of perceived exertion. Med. Sci. Sports Exerc. 1982, 14, 377–381. [Google Scholar] [CrossRef]
- Cohen, J. A power primer. Psychol. Bull. 1992, 112, 155–159. [Google Scholar] [CrossRef]
- Parolin, M.L.; Chesley, A.; Matsos, M.P.; Spriet, L.L.; Jones, N.L.; Heigenhauser, G.J. Regulation of skeletal muscle glycogen phosphorylase and PDH during maximal intermittent exercise. Am. J. Physiol. 1999, 277, E890–E900. [Google Scholar] [CrossRef]
- Spriet, L.L.; Lindinger, M.I.; McKelvie, R.S.; Heigenhauser, G.J.; Jones, N.L. Muscle glycogenolysis and H+ concentration during maximal intermittent cycling. J. Appl. Physiol. (1985) 1989, 66, 8–13. [Google Scholar] [CrossRef] [PubMed]
- Galbo, H.; Holst, J.J.; Christensen, N.J. Glucagon and plasma catecholamine responses to graded and prolonged exercise in man. J. Appl. Physiol. 1975, 38, 70–76. [Google Scholar] [CrossRef] [PubMed]
- Häggendal, J.; Hartley, L.; Saltin, B. Arterial noradrenaline concentration during exercise in relation to the relative work levels. Scand. J. Clin. Lab. Investig. 1970, 26, 337–342. [Google Scholar] [CrossRef]
- Mazzeo, R.S.; Marshall, P. Influence of plasma catecholamines on the lactate threshold during graded exercise. J. Appl. Physiol. (1985) 1989, 67, 1319–1322. [Google Scholar] [CrossRef] [PubMed]
- Brooks, S.; Nevill, M.E.; Meleagros, L.; Lakomy, H.K.; Hall, G.M.; Bloom, S.R.; Williams, C. The hormonal responses to repetitive brief maximal exercise in humans. Eur. J. Appl. Physiol. Occup. Physiol. 1990, 60, 144–148. [Google Scholar] [CrossRef] [PubMed]
- Gaitanos, G.C.; Williams, C.; Boobis, L.H.; Brooks, S. Human muscle metabolism during intermittent maximal exercise. J. Appl. Physiol. (1985) 1993, 75, 712–719. [Google Scholar] [CrossRef]
- Kim, W.; Egan, J.M. The role of incretins in glucose homeostasis and diabetes treatment. Pharmacol. Rev. 2008, 60, 470–512. [Google Scholar] [CrossRef]
- Lundborg, P.; Astrom, H.; Bengtsson, C.; Fellenius, E.; von Schenck, H.; Svensson, L.; Smith, U. Effect of beta-adrenoceptor blockade on exercise performance and metabolism. Clin. Sci. (Lond.) 1981, 61, 299–305. [Google Scholar] [CrossRef]
- Wojtaszewski, J.F.; MacDonald, C.; Nielsen, J.N.; Hellsten, Y.; Hardie, D.G.; Kemp, B.E.; Kiens, B.; Richter, E.A. Regulation of 5’AMP-activated protein kinase activity and substrate utilization in exercising human skeletal muscle. Am. J. Physiol. Endocrinol. Metab. 2003, 284, E813–E822. [Google Scholar] [CrossRef]
- Zouhal, H.; Jacob, C.; Delamarche, P.; Gratas-Delamarche, A. Catecholamines and the effects of exercise, training and gender. Sports Med. 2008, 38, 401–423. [Google Scholar] [CrossRef] [PubMed]
- Ader, M.; Pacini, G.; Yang, Y.J.; Bergman, R.N. Importance of glucose per se to intravenous glucose tolerance. Comparison of the minimal-model prediction with direct measurements. Diabetes 1985, 34, 1092–1103. [Google Scholar] [CrossRef]
- Best, J.D.; Kahn, S.E.; Ader, M.; Watanabe, R.M.; Ni, T.C.; Bergman, R.N. Role of glucose effectiveness in the determination of glucose tolerance. Diabetes Care 1996, 19, 1018–1030. [Google Scholar] [CrossRef] [PubMed]
- Romijn, J.A.; Coyle, E.F.; Sidossis, L.S.; Rosenblatt, J.; Wolfe, R.R. Substrate metabolism during different exercise intensities in endurance-trained women. J. Appl. Physiol. (1985) 2000, 88, 1707–1714. [Google Scholar] [CrossRef]
- Seino, Y.; Fukushima, M.; Yabe, D. GIP and GLP-1, the two incretin hormones: Similarities and differences. J. Diabetes Investig. 2010, 1, 8–23. [Google Scholar] [CrossRef]
- Getty-Kaushik, L.; Song, D.H.; Boylan, M.O.; Corkey, B.E.; Wolfe, M.M. Glucose-dependent insulinotropic polypeptide modulates adipocyte lipolysis and reesterification. Obesity (Silver Spring) 2006, 14, 1124–1131. [Google Scholar] [CrossRef] [PubMed]
- Hirshman, M.F.; Goodyear, L.J.; Wardzala, L.J.; Horton, E.D.; Horton, E.S. Identification of an intracellular pool of glucose transporters from basal and insulin-stimulated rat skeletal muscle. J. Biol. Chem. 1990, 265, 987–991. [Google Scholar] [CrossRef]


| n = 12 | Age | Height | Weight | %Fat | O2peak | Load (Peak) | 40%O2peak | Load (40%O2peak) |
|---|---|---|---|---|---|---|---|---|
| (years) | (cm) | (kg) | (%) | (mL/min) | (watts) | (mL/min) | (watts) | |
| Mean | 21.3 | 176.3 | 70.0 | 17.9 | 3193.4 | 278.0 | 1277.4 | 102.9 |
| SD | 0.9 | 5.6 | 8.5 | 1.9 | 649.5 | 38.0 | 259.8 | 16.1 |
| Participant No. | Trial 1 | Trial 2 | Trial 3 |
|---|---|---|---|
| 1 | T | G | W |
| 2 | T | W | G |
| 3 | G | T | W |
| 4 | W | G | T |
| 5 | G | W | T |
| 6 | W | T | G |
| 7 | T | W | G |
| 8 | G | W | T |
| 9 | W | G | T |
| 10 | G | T | W |
| 11 | W | T | G |
| 12 | T | G | W |
| a: One-Way Analysis of Variance with Repeated Measures ANOVA | p-Value | |||||
| W | G | T | ||||
| Adrenaline | 24.1 ± 13.1 | 17.7 ± 10.6 | 16.2 ± 8.1 | 0.005 ** | 0.382 | |
| Noradrenaline | 169.4 ± 45.6 | 139.8 ± 52.9 | 145.6 ± 40.9 | 0.024 * | 0.288 | |
| Dopamine | 4.9 ± 1.4 | 4.3 ± 1.4 | 4.4 ± 1.2 | 0.373 | 0.086 | |
| b: Bonferroni Multiple Comparison Test between Trial Drinks | ||||||
| W vs. G | W vs. T | G vs. T | ||||
| p-value | Cohen’s d | p-value | Cohen’s d | p-value | Cohen’s d | |
| Adrenaline | 0.112 | 0.54 | 0.010 * | 0.72 | 1.000 | 0.16 |
| Noradrenaline | 0.089 | 0.60 | 0.017 * | 0.55 | 1.000 | 0.12 |
| Dopamine | 0.574 | 0.41 | 0.847 | 0.35 | 1.000 | 0.09 |
Publisher’s Note: MDPI stays neutral with regard to jurisdictional claims in published maps and institutional affiliations. |
© 2021 by the authors. Licensee MDPI, Basel, Switzerland. This article is an open access article distributed under the terms and conditions of the Creative Commons Attribution (CC BY) license (https://creativecommons.org/licenses/by/4.0/).
Share and Cite
Hamada, N.; Wadazumi, T.; Hirata, Y.; Kuriyama, M.; Watanabe, K.; Watanabe, H.; Hongu, N.; Arai, N. Single Ingestion of Trehalose Enhances Prolonged Exercise Performance by Effective Use of Glucose and Lipid in Healthy Men. Nutrients 2021, 13, 1439. https://doi.org/10.3390/nu13051439
Hamada N, Wadazumi T, Hirata Y, Kuriyama M, Watanabe K, Watanabe H, Hongu N, Arai N. Single Ingestion of Trehalose Enhances Prolonged Exercise Performance by Effective Use of Glucose and Lipid in Healthy Men. Nutrients. 2021; 13(5):1439. https://doi.org/10.3390/nu13051439
Chicago/Turabian StyleHamada, Naomi, Tsuyoshi Wadazumi, Yoko Hirata, Mayumi Kuriyama, Kanji Watanabe, Hitoshi Watanabe, Nobuko Hongu, and Norie Arai. 2021. "Single Ingestion of Trehalose Enhances Prolonged Exercise Performance by Effective Use of Glucose and Lipid in Healthy Men" Nutrients 13, no. 5: 1439. https://doi.org/10.3390/nu13051439
APA StyleHamada, N., Wadazumi, T., Hirata, Y., Kuriyama, M., Watanabe, K., Watanabe, H., Hongu, N., & Arai, N. (2021). Single Ingestion of Trehalose Enhances Prolonged Exercise Performance by Effective Use of Glucose and Lipid in Healthy Men. Nutrients, 13(5), 1439. https://doi.org/10.3390/nu13051439