
Assessment of Factors Related to Diminished Appetite in Hemodialysis Patients with a New Adapted and Validated Questionnaire

 , , , and
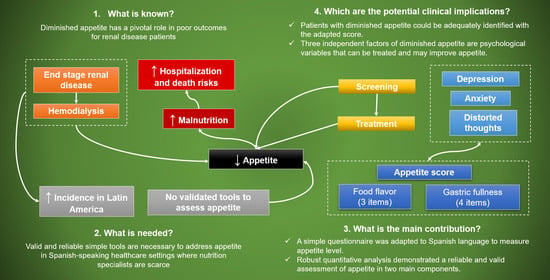
Abstract
1. Introduction
2. Materials and Methods
2.1. Patients and Study Protocol
2.2. Nutritional Status Evaluation
2.3. Appetite Assessment
2.4. Psychological Questionnaires
2.5. Statistical Analysis
3. Results
3.1. Appetite Score Validation
3.1.1. Exploratory Analysis
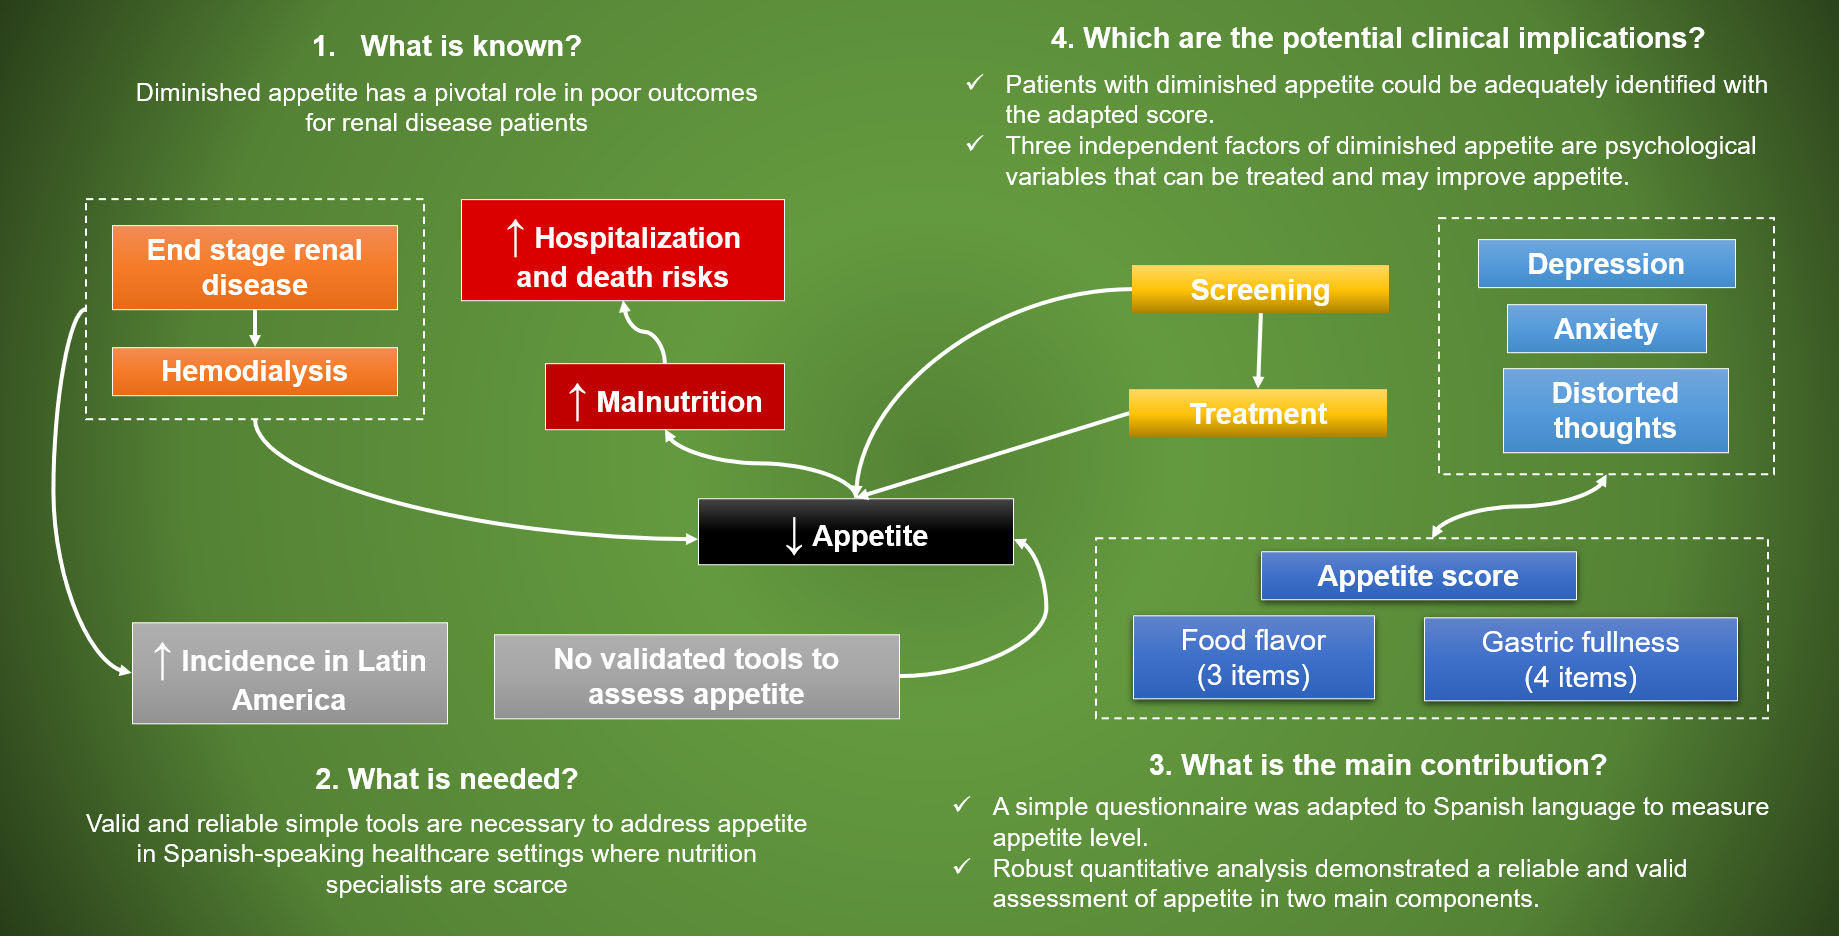
3.1.2. Confirmatory Analysis
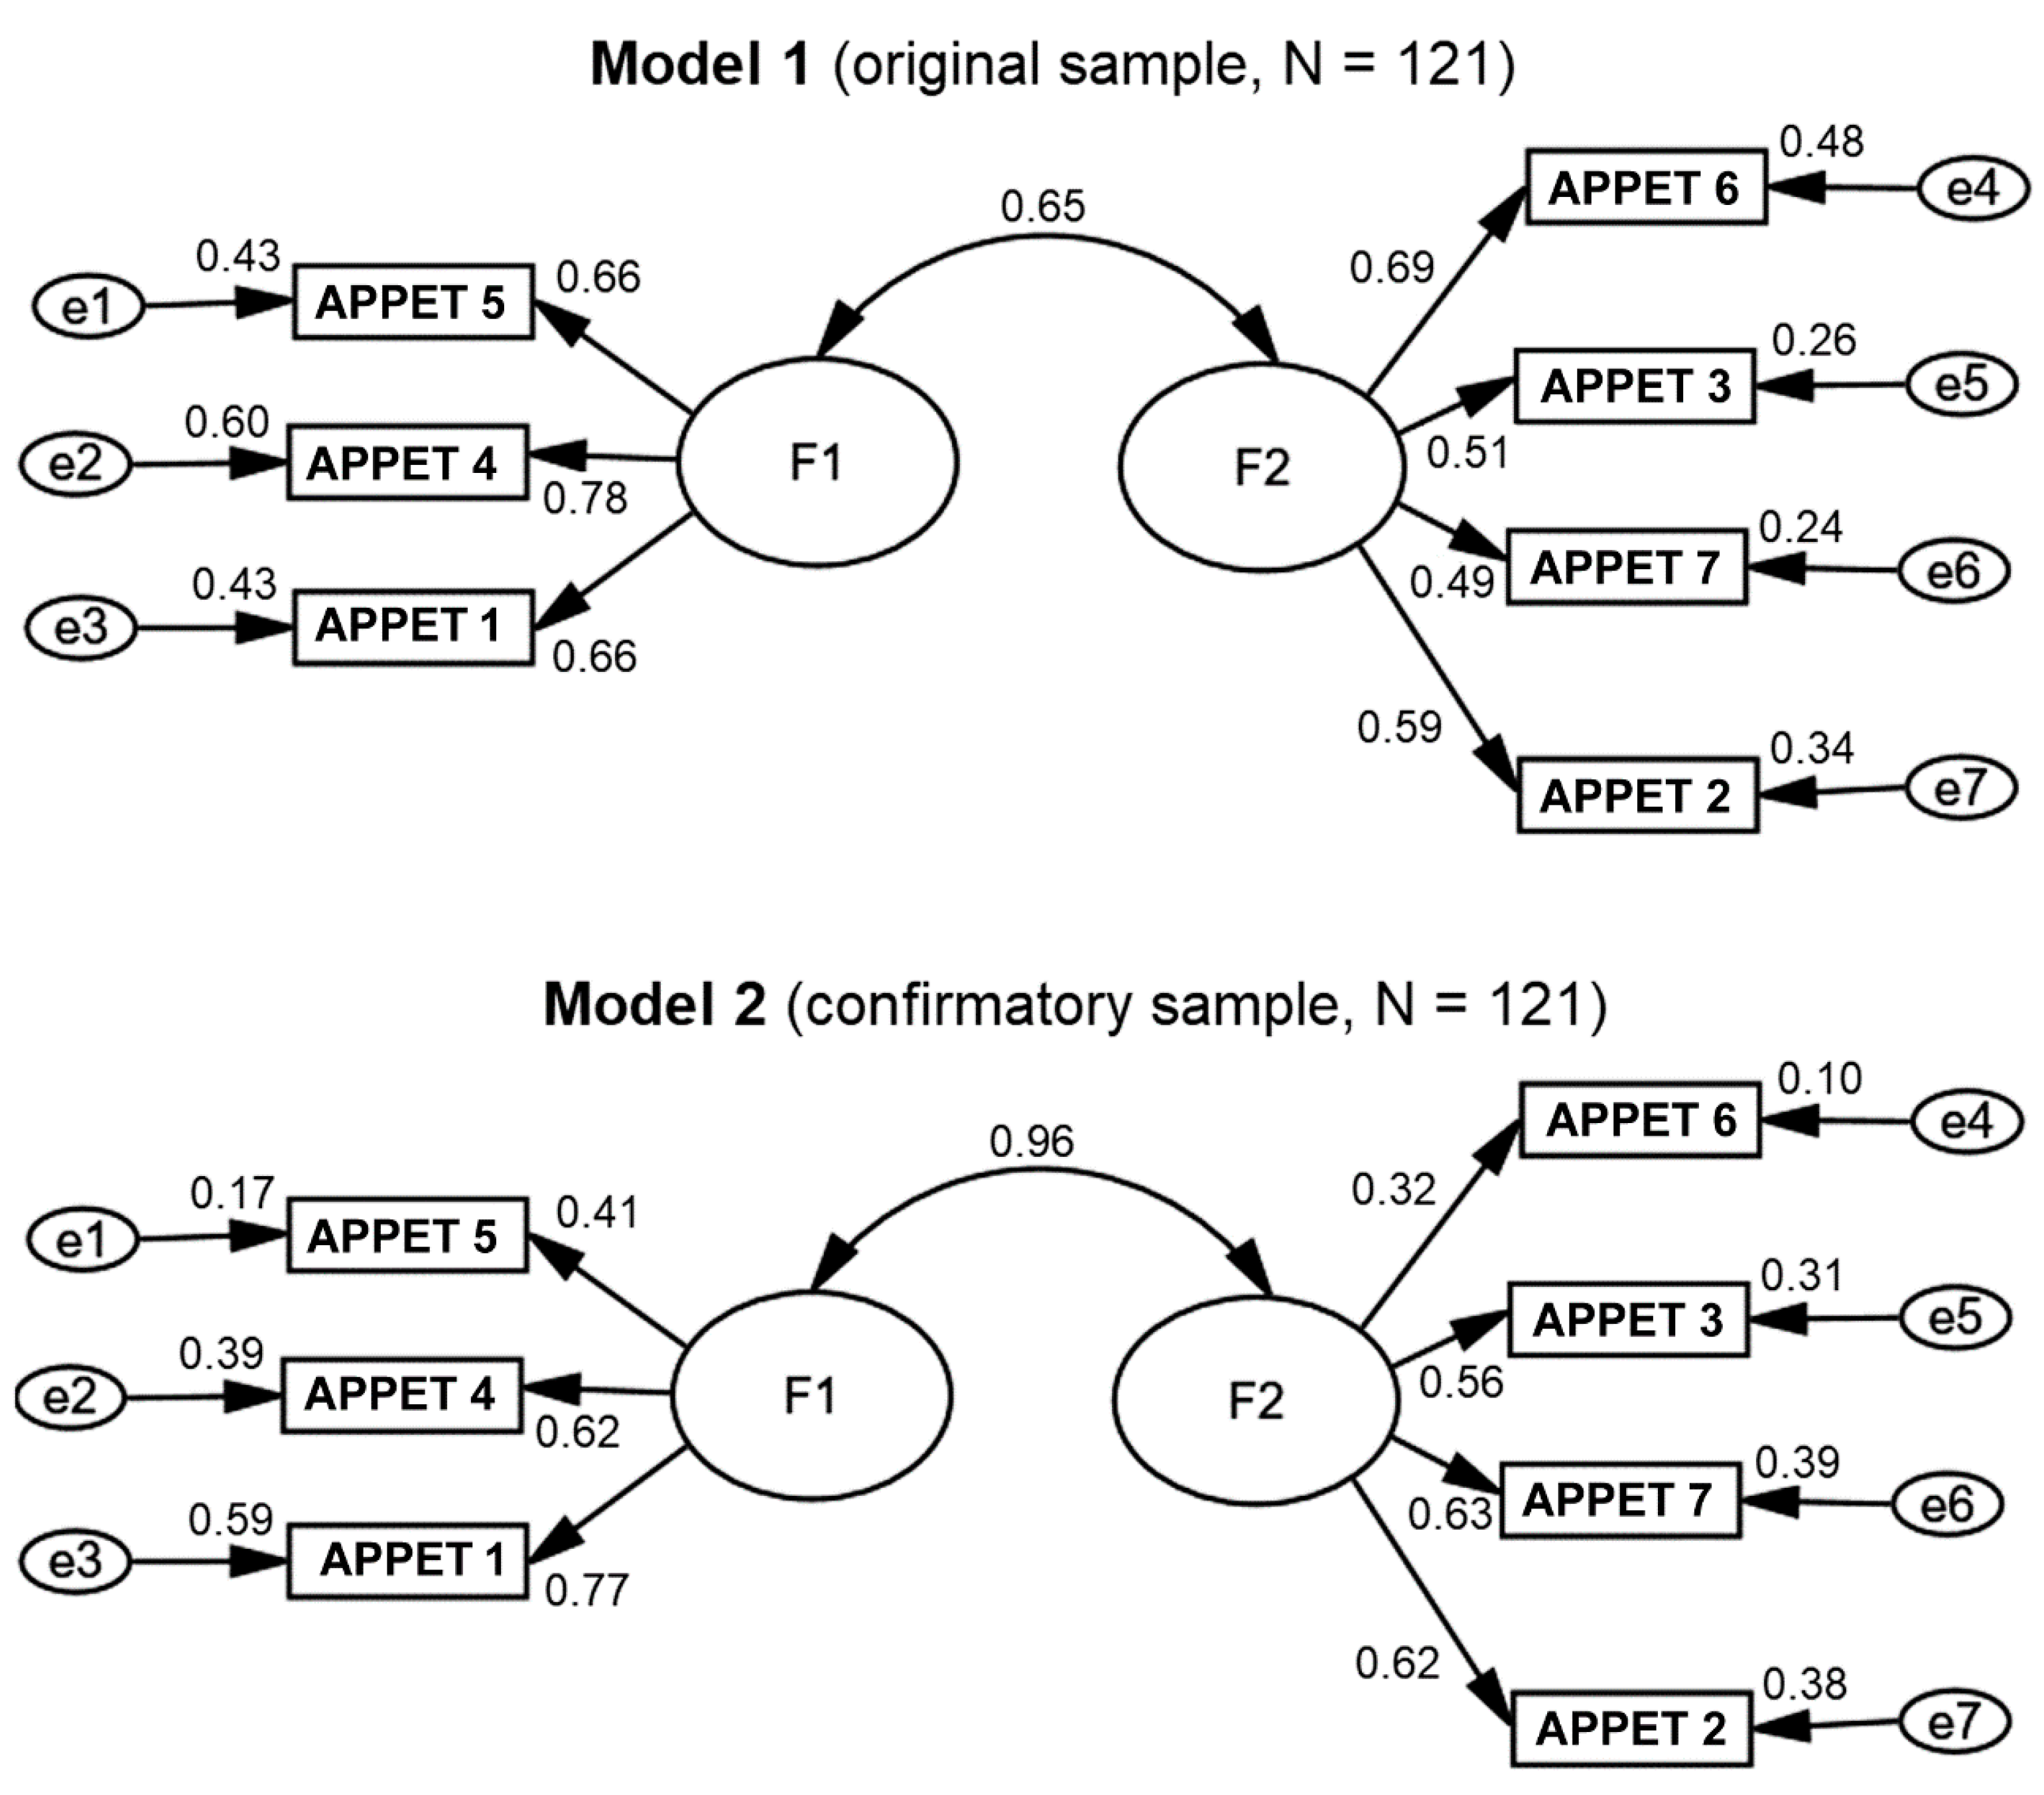
3.2. Factors Associated with Low Appetite
4. Discussion
5. Conclusions
Author Contributions
Funding
Institutional Review Board Statement
Informed Consent Statement
Data Availability Statement
Acknowledgments
Conflicts of Interest
Appendix A
- (a)
- Muy malo (very poor)
- (b)
- Malo (poor)
- (c)
- Normal (average)
- (d)
- Bueno (good)
- (e)
- Muy bueno (very good)
- (a)
- Me lleno después de unos bocados (I feel full after eating only a few mouthfuls)
- (b)
- Me lleno después de comer la tercera parte de la comida (I feel full after eating about 0ne-third of a meal)
- (c)
- Me lleno después de haber comido la mitad de la comida (I feel full after eating over half a meal)
- (d)
- Me lleno después de haber comido casi toda la comida (I feel full after eating most of the meal)
- (e)
- Nunca me lleno (I hardly ever feel full)
- (a)
- Casi nunca (rarely)
- (b)
- Ocasionalmente (occasionally)
- (c)
- Parte del tiempo (some of the time)
- (d)
- Casi todo el tiempo (most of the time)
- (e)
- Todo el tiempo (all of the time)
- (a)
- Muy malo (very bad)
- (b)
- Malo (bad)
- (c)
- Regular (average)
- (d)
- Bueno (good)
- (e)
- Muy bueno (very good)
- (a)
- Mucho peor (much worse)
- (b)
- Peor (worse)
- (c)
- Igual (just as good)
- (d)
- Mejor (better)
- (e)
- Mucho mejor (much better)
- (a)
- Menos de una comida al día (less than one meal a day)
- (b)
- Una comida al día (one meal a day)
- (c)
- Dos comidas al día (two meals a day)
- (d)
- Tres comidas al día (three meals a day)
- (e)
- Más de tres veces al día (more than three meals a day)
- (a)
- La mayoría de las veces (most times)
- (b)
- Frecuentemente (often)
- (c)
- Algunas veces (sometimes)
- (d)
- Casi nunca (rarely)
- (e)
- Nunca (never)
References
- Bossola, M.; Giungi, S.; Luciani, G.; Tazza, L. Appetite in Chronic Hemodialysis Patients: A Longitudinal Study. J. Ren. Nutr. 2009, 19, 372–379. [Google Scholar] [CrossRef]
- Bossola, M.; Tazza, L.; Giungi, S.; Luciani, G. Anorexia in hemodialysis patients: An update. Kidney Int. 2006, 70, 417–422. [Google Scholar] [CrossRef] [PubMed]
- Bossola, M.; Ciciarelli, C.; Di Stasio, E.; Panocchia, N.; Conte, G.L.; Rosa, F.; Tortorelli, A.; Luciani, G.; Tazza, L. Relationship Between Appetite and Symptoms of Depression and Anxiety in Patients on Chronic Hemodialysis. J. Ren. Nutr. 2012, 22, 27–33. [Google Scholar] [CrossRef] [PubMed]
- Kalantar-Zadeh, K.; Block, G.; McAllister, C.J.; Humphreys, M.H.; Kopple, J.D. Appetite and inflammation, nutrition, anemia, and clinical outcome in hemodialysis patients. Am. J. Clin. Nutr. 2004, 80, 299–307. [Google Scholar] [CrossRef] [PubMed]
- Carrero, J.J.; Qureshi, A.R.; Axelsson, J.; Avesani, C.M.; Suliman, M.E.; Kato, S.; Bárány, P.; Snaedal-Jonsdottir, S.; Alvestrand, A.; Heimbürger, O.; et al. Comparison of nutritional and inflammatory markers in dialysis patients with reduced appetite. Am. J. Clin. Nutr. 2007, 85, 695–701. [Google Scholar] [CrossRef]
- Burrowes, J.D.; Larive, B.; Chertow, G.M.; Cockram, D.B.; Dwyer, J.T.; Greene, T.; Kusek, J.W.; Leung, J.; Rocco, M.V. Self-reported appetite, hospitalization and death in haemodialysis patients: Findings from the Hemodialysis (HEMO) Study. Nephrol. Dial. Transplant. 2005, 20, 2765–2774. [Google Scholar] [CrossRef]
- Zabel, R.; Ash, S.; King, N.; Juffs, P.; Bauer, J. Relationships between appetite and quality of life in hemodialysis patients. Appetite 2012, 59, 194–199. [Google Scholar] [CrossRef][Green Version]
- Gama-Axelsson, T.; Lindholm, B.; Bárány, P.; Heimbürger, O.; Stenvinkel, P.; Qureshi, A.R. Self-Rated Appetite as a Predictor of Mortality in Patients With Stage 5 Chronic Kidney Disease. J. Ren. Nutr. 2013, 23, 106–113. [Google Scholar] [CrossRef] [PubMed]
- Buckner, S.; Dwyer, J. Do we need a nutrition-specific quality of life questionnaire for dialysis patients? J. Ren. Nutr. 2003, 13, 295–302. [Google Scholar] [CrossRef]
- Oliveira, C.M.C.; Kubrusly, M.; Lima, A.T.; Torres, D.M.; Cavalcante, N.M.R.; JerÔnimo, A.L.C.; Oliveira, T.C.B. Correlation between nutritional markers and appetite self-assessments in hemodialysis patients. J. Ren. Nutr. 2015, 25, 301–307. [Google Scholar] [CrossRef]
- Drapeau, V.; King, N.; Hetherington, M.; Doucet, E.; Blundell, J.; Tremblay, A. Appetite sensations and satiety quotient: Predictors of energy intake and weight loss. Appetite 2007, 48, 159–166. [Google Scholar] [CrossRef]
- Berthoud, H.-R.; Morrison, C. The Brain, Appetite, and Obesity. Annu. Rev. Psychol. 2008, 59, 55–92. [Google Scholar] [CrossRef]
- Bossola, M.; Muscaritoli, M.; Tazza, L.; Panocchia, N.; Liberatori, M.; Giungi, S.; Tortorelli, A.; Fanelli, F.R.; Luciani, G. Variables associated with reduced dietary intake in hemodialysis patients. J. Ren. Nutr. 2005, 15, 244–252. [Google Scholar] [CrossRef] [PubMed]
- Bossola, M.; Luciani, G.; Rosa, F.; Tazza, L. Appetite and Gastrointestinal Symptoms in Chronic Hemodialysis Patients. J. Ren. Nutr. 2011, 21, 448–454. [Google Scholar] [CrossRef]
- Lynch, K.E.; Lynch, R.; Curhan, G.C.; Brunelli, S.M. Altered Taste Perception and Nutritional Status Among Hemodialysis Patients. J. Ren. Nutr. 2013, 23, 288–295.e1. [Google Scholar] [CrossRef]
- Cheng, H.-T.; Ho, M.-C.; Hung, K.-Y. Affective and cognitive rather than somatic symptoms of depression predict 3-year mortality in patients on chronic hemodialysis. Sci. Rep. 2018, 8, 5868. [Google Scholar] [CrossRef]
- Simmons, W.K.; Burrows, K.; Avery, J.A.; Kerr, K.L.; Bodurka, J.; Savage, C.R.; Drevets, W.C. Depression-related increases and decreases in appetite: Dissociable patterns of aberrant activity in reward and interoceptive neurocircuitry. Am. J. Psychiatry 2016, 173, 418–428. [Google Scholar] [CrossRef] [PubMed]
- Lerma, A.; Salazar, E.; Perez-Grovas, H.; Bermúdez, L.; Gutiérrez, D.; Reyes Lagunes, I.; Bochiccio, T.; García, R.; Lerma, C. Desarrollo y validación de un instrumento para la evaluación de distorsiones cognitivas en pacientes con insuficiencia renal crónica terminal. Salud Ment. 2012, 35, 189–194. [Google Scholar]
- Lerma, A.; Perez-Grovas, H.; Bermudez, L.; Peralta-Pedrero, M.L.; Robles-García, R.; Lerma, C. Brief cognitive behavioural intervention for depression and anxiety symptoms improves quality of life in chronic haemodialysis patients. Psychol. Psychother. Theory Res. Pract. 2017, 90, 105–123. [Google Scholar] [CrossRef]
- Annual Data Report|USRDS. Available online: https://adr.usrds.org/2020/end-stage-renal-disease/11-international-comparisons (accessed on 7 March 2021).
- Wilson, M.M.G.; Thomas, D.R.; Rubenstein, L.Z.; Chibnall, J.T.; Anderson, S.; Baxi, A.; Diebold, M.R.; Morley, J.E. Appetite assessment: Simple appetite questionnaire predicts weight loss in community-dwelling adults and nursing home residents. Am. J. Clin. Nutr. 2005, 82, 1074–1081. [Google Scholar] [CrossRef]
- Fouque, D.; Kalantar-Zadeh, K.; Kopple, J.; Cano, N.; Chauveau, P.; Cuppari, L.; Franch, H.; Guarnieri, G.; Ikizler, T.A.; Kaysen, G.; et al. A proposed nomenclature and diagnostic criteria for protein-energy wasting in acute and chronic kidney disease. Kidney Int. 2008, 73, 391–398. [Google Scholar] [CrossRef]
- Noori, N.; Kopple, J.D.; Kovesdy, C.P.; Feroze, U.; Sim, J.J.; Murali, S.B.; Luna, A.; Gomez, M.; Luna, C.; Bross, R.; et al. Mid-arm muscle circumference and quality of life and survival in maintenance hemodialysis patients. Clin. J. Am. Soc. Nephrol. 2010, 5, 2258–2268. [Google Scholar] [CrossRef]
- Kalantar-Zadeh, K.; Kleiner, M.; Dunne, E.; Lee, G.H.; Luft, F.C. A modified quantitative subjective global assessment of nutrition for dialysis patients. Nephrol. Dial. Transplant. 1999, 14, 1732–1738. [Google Scholar] [CrossRef] [PubMed]
- Lerma, A.; Ordónez, G.; Mendoza, L.; Salazar-Robles, E.; Rivero, J.; Pérez-Granados, E.; Pérez-Grovas, H.; Ruiz-Palacios, P.; Ibarra, A.; Lerma, C. Psychometric properties of the resilience scale in Mexican patients with chronic hemodialysis. Salud Ment. 2019, 42, 121–129. [Google Scholar] [CrossRef]
- Burrowes, J.D.; Larive, B.; Cockram, D.B.; Dwyer, J.; Kusek, J.W.; McLeroy, S.; Poole, D.; Rocco, M.V. Effects of dietary intake, appetite, and eating habits on dialysis and non-dialysis treatment days in hemodialysis patients: Cross-sectional results from the HEMO study. J. Ren. Nutr. 2003, 13, 191–198. [Google Scholar] [CrossRef]
- Brekke, F.B.; Amro, A.; Osthus, T.B.H.; Dammen, T.; Waldum, B.; Os, I. Sleep complaints, depression and quality of life in Norwegian dialysis patients. Clin. Nephrol. 2013, 80, 88–97. [Google Scholar] [CrossRef] [PubMed]
- Cukor, D.; Ver Halen, N.; Asher, D.R.; Coplan, J.D.; Weedon, J.; Wyka, K.E.; Saggi, S.J.; Kimmel, P.L. Psychosocial intervention improves depression, quality of life, and fluid adherence in hemodialysis. J. Am. Soc. Nephrol. 2014, 25, 196–206. [Google Scholar] [CrossRef]
- McKercher, C.M.; Venn, A.J.; Blizzard, L.; Nelson, M.R.; Palmer, A.J.; Ashby, M.A.; Scott, J.L.; Jose, M.D. Psychosocial factors in adults with chronic kidney disease: Characteristics of pilot participants in the Tasmanian Chronic Kidney Disease study. BMC Nephrol. 2013, 14, 83. [Google Scholar] [CrossRef]
- Robles, R.; Varela, R.; Jurado, S.; Páez, F. Versión mexicana del inventario de ansiedad de Beck: Propiedades psicométricas. Rev. Mex. Psicol. 2001, 18, 211–218. [Google Scholar]
- Jurado, S.; Villegas, M.; Méndez, L.; Rodríguez, F.; Loperena, V.; Varela, R. The standardization of the Beck Depression Inventory for Mexico City inhabitants. Salud Ment. 1998, 21, 26–31. [Google Scholar]
- Furr, R.M. Scale Construction and Psychometrics for Social and Personality Psychology; SAGE Publications Ltd.: Thousand Oaks, CA, USA, 2011. [Google Scholar]
- Byrne, B.M. Structural Equation Modeling with AMOS: Basic Concepts, Applications, and Programming, 1st ed.; Routledge: New York, NY, USA, 2001; Volume 20. [Google Scholar]
- Ullman, J.B. Structural equation modeling: Reviewing the basics and moving forward. J. Personal. Assess. 2006, 87, 35–50. [Google Scholar] [CrossRef]
- Kline, R. Principles and Practice of Structural Equation Modeling; The Guilford Press: New York, NY, USA, 2010. [Google Scholar]
- George, D.; Mallery, P. Using SPSS for Windows Step-by-Step: A Simple Guide and Reference; Aliyn & Bacon: Boston, MA, USA, 2010. [Google Scholar]
- Tabachnick, B.G.; Fidell, L.S. Using Multivariate Statistics, 7th ed.; Pearson: Boston, MA, USA, 2019; ISBN 0134790545. [Google Scholar]
- Hu, L.T.; Bentler, P.M. Fit Indices in Covariance Structure Modeling: Sensitivity to Underparameterized Model Misspecification. Psychol. Methods 1998, 3, 424–453. [Google Scholar] [CrossRef]
- Sahathevan, S.; Se, C.H.; See, H.N.; Chinna, K.; Harvinder, G.S.; Chee, W.S.S.; Goh, B.L.; Gafor, H.A.; Bavanandan, S.; Ahmad, G.; et al. Assessing protein energy wasting in a Malaysian haemodialysis population using self-reported appetite rating: A cross-sectional study. BMC Nephrol. 2015, 16, 99. [Google Scholar] [CrossRef]
- Burrowes, J.D.; Powers, S.N.; Cockram, D.B.; McLeroy, S.L.; Dwyer, J.T.; Cunniff, P.J.; Paranandi, L.; Kusek, J.W. Use of an appetite and diet assessment tool in the pilot phase of a hemodialysis clinical trial: Mortality and morbidity in hemodialysis study. J. Ren. Nutr. 1996, 6, 229–232. [Google Scholar] [CrossRef]
- Cohen, S.D.; Norris, L.; Acquaviva, K.; Peterson, R.A.; Kimmel, P.L. Screening, diagnosis, and treatment of depression in patients with end-stage renal disease. Clin. J. Am. Soc. Nephrol. 2007, 2, 1332–1342. [Google Scholar] [CrossRef] [PubMed]
- Watnick, S.; Wang, P.L.; Demadura, T.; Ganzini, L. Validation of 2 depression screening tools in dialysis patients. Am. J. Kidney Dis. 2005, 46, 919–924. [Google Scholar] [CrossRef] [PubMed]
- Chilcot, J.; Wellsted, D.; Da Silva-Gane, M.; Farrington, K. Depression on Dialysis. Nephron Clin. Pract. 2008, 108, c256–c264. [Google Scholar] [CrossRef] [PubMed]
- Cukor, D.; Cohen, S.D.; Peterson, R.A.; Kimmel, P.L. Psychosocial Aspects of Chronic Disease: ESRD as a Paradigmatic Illness. J. Am. Soc. Nephrol. 2007, 18, 3042–3055. [Google Scholar] [CrossRef] [PubMed]
- Craske, M.G.; Stein, M.B. Anxiety. Lancet 2016, 388, 3048–3059. [Google Scholar] [CrossRef]
- Schouten, R.W.; Haverkamp, G.L.; Loosman, W.L.; Chandie Shaw, P.K.; van Ittersum, F.J.; Smets, Y.F.C.; Vleming, L.J.; Dekker, F.W.; Honig, A.; Siegert, C.E.H. Anxiety Symptoms, Mortality, and Hospitalization in Patients Receiving Maintenance Dialysis: A Cohort Study. Am. J. Kidney Dis. 2019, 74, 158–166. [Google Scholar] [CrossRef]
- Pigott, T.A. Anxiety disorders in women. Psychiatr. Clin. N. Am. 2003, 26, 621–672. [Google Scholar] [CrossRef]
- Cyranowski, J.M.; Frank, E.; Young, E.; Shear, M.K. Adolescent onset of the gender difference in lifetime rates of major depression. A theoretical model. Arch. Gen. Psychiatry 2000, 57, 21–27. [Google Scholar] [CrossRef] [PubMed]
- Albert, P.R. Why is depression more prevalent in women? J. Psychiatry Neurosci. 2015, 40, 219–221. [Google Scholar] [CrossRef]
- McLean, C.P.; Anderson, E.R. Brave men and timid women? A review of the gender differences in fear and anxiety. Clin. Psychol. Rev. 2009, 29, 496–505. [Google Scholar] [CrossRef]
- Mosleh, H.; Alenezi, M.; Al johani, S.; Alsani, A.; Fairaq, G.; Bedaiwi, R. Prevalence and Factors of Anxiety and Depression in Chronic Kidney Disease Patients Undergoing Hemodialysis: A Cross-sectional Single-Center Study in Saudi Arabia. Cureus 2020, 12. [Google Scholar] [CrossRef]
- Andréasson, A.; Arborelius, L.; Erlanson-Albertsson, C.; Lekander, M. A putative role for cytokines in the impaired appetite in depression. Brain. Behav. Immun. 2007, 21, 147–152. [Google Scholar] [CrossRef]
- Simmons, W.K.; Burrows, K.; Avery, J.A.; Kerr, K.L.; Taylor, A.; Bodurka, J.; Potter, W.; Teague, T.K.; Drevets, W.C. Appetite changes reveal depression subgroups with distinct endocrine, metabolic, and immune states. Mol. Psychiatry 2020, 25, 1457–1468. [Google Scholar] [CrossRef] [PubMed]
- Smith, T.W.; Peck, J.R.; Milano, R.A.; Ward, J.R. Cognitive Distortion in Rheumatoid Arthritis: Relation to Depression and Disability. J. Consult. Clin. Psychol. 1988, 56, 412–416. [Google Scholar] [CrossRef]
- Smith, T.W.; O’Keeffe, J.L.; Christensen, A.J. Cognitive Distortion and Depression in Chronic Pain: Association with Diagnosed Disorders. J. Consult. Clin. Psychol. 1994, 62, 195–198. [Google Scholar] [CrossRef]
- Yurica, C.L.; DiTomasso, R.A. Cognitive Distortions. In Encyclopedia of Cognitive Behavior Therapy; Springer: Boston, MA, USA, 2006; pp. 117–122. [Google Scholar]
- Jane Brooks, S.; Schiöth, H. Impulsivity and Compulsivity in Anorexia Nervosa: Cognitive Systems Underlying Variation in Appetite Restraint from an RDoC Perspective. In Anorexia and Bulimia Nervosa; IntechOpen: London, UK, 2019. [Google Scholar]
- Chamberlain, S.R.; Sakakian, B.J. The neuropsychology of mood disorders. Curr. Psychiatry Rep. 2006, 8, 458–463. [Google Scholar] [CrossRef]
- Evers, A.W.M.; Kraaimaat, F.W.; Van Lankveld, W.; Jongen, P.J.H.; Jacobs, J.W.G.; Bijlsma, J.W.J. Beyond unfavorable thinking: The illness cognition questionnaire for chronic diseases. J. Consult. Clin. Psychol. 2001, 69, 1026–1036. [Google Scholar] [CrossRef]
- Kara, B.; Caglar, K.; Kilic, S. Nonadherence with Diet and Fluid Restrictions and Perceived Social Support in Patients Receiving Hemodialysis. J. Nurs. Scholarsh. 2007, 39, 243–248. [Google Scholar] [CrossRef]
- Kugler, C.; Vlaminck, H.; Haverich, A.; Maes, B. Nonadherence with Diet and Fluid Restrictions Among Adults Having Hemodialysis. J. Nurs. Scholarsh. 2005, 37, 25–29. [Google Scholar] [CrossRef]
- Luis, D.; Zlatkis, K.; Comenge, B.; García, Z.; Navarro, J.F.; Lorenzo, V.; Carrero, J.J. Dietary Quality and Adherence to Dietary Recommendations in Patients Undergoing Hemodialysis. J. Ren. Nutr. 2016, 26, 190–195. [Google Scholar] [CrossRef]
- Clark-Cutaia, M.N.; Ren, D.; Hoffman, L.A.; Burke, L.E.; Sevick, M.A. Adherence to Hemodialysis Dietary Sodium Recommendations: Influence of Patient Characteristics, Self-Efficacy, and Perceived Barriers. J. Ren. Nutr. 2014, 24, 92–99. [Google Scholar] [CrossRef]
- Hofmann, S.G.; Asnaani, A.; Vonk, I.J.J.; Sawyer, A.T.; Fang, A. The efficacy of cognitive behavioral therapy: A review of meta-analyses. Cognit. Ther. Res. 2012, 36, 427–440. [Google Scholar] [CrossRef] [PubMed]
- Sharp, J.; Wild, M.R.; Gumley, A.I.; Deighan, C.J. A cognitive behavioral group approach to enhance adherence to hemodialysis fluid restrictions: A randomized controlled trial. Am. J. Kidney Dis. 2005, 45, 1046–1057. [Google Scholar] [CrossRef] [PubMed]
- Uribarri, J. Phosphorus metabolism and management in chronic kidney disease: Phosphorus Homeostasis in Normal Health and in Chronic Kidney Disease Patients with Special Emphasis on Dietary Phosphorus Intake. Semin. Dial. 2007, 20, 295–301. [Google Scholar] [CrossRef]
- Noori, N.; Kalantar-Zadeh, K.; Kovesdy, C.P.; Bross, R.; Benner, D.; Kopple, J.D. Association of dietary phosphorus intake and phosphorus to protein ratio with mortality in hemodialysis patients. Clin. J. Am. Soc. Nephrol. 2010, 5, 683–692. [Google Scholar] [CrossRef] [PubMed]
- Kalantar-Zadeh, K.; Gutekunst, L.; Mehrotra, R.; Kovesdy, C.P.; Bross, R.; Shinaberger, C.S.; Noori, N.; Hirschberg, R.; Benner, D.; Nissenson, A.R.; et al. Understanding sources of dietary phosphorus in the treatment of patients with chronic kidney disease. Clin. J. Am. Soc. Nephrol. 2010, 5, 519–530. [Google Scholar] [CrossRef]
- Kaysen, G.A.; Greene, T.; Daugirdas, J.T.; Kimmel, P.L.; Schulman, G.W.; Toto, R.D.; Levin, N.W.; Yan, G. Longitudinal and Cross-Sectional Effects of C-Reactive Protein, Equilibrated Normalized Protein Catabolic Rate, and Serum Bicarbonate on Creatinine and Albumin Levels in Dialysis Patients. Am. J. Kidney Dis. 2003, 42, 1200–1211. [Google Scholar] [CrossRef] [PubMed]


| Item | Factorial Load | Item Mean ± SD | |
|---|---|---|---|
| Factor 1 (3 Items) | Factor 2 (4 Items) | ||
| APPET 5 “Compared to when I was younger, food tastes…” | 0.885 | 2.83 ± 0.68 | |
| APPET 4 “Food tastes…” | 0.783 | 3.79 ± 0.84 | |
| APPET 1 “My appetite is…” | 0.667 | 3.59 ± 0.97 | |
| APPET 6 “Normally I eat…” | 0.737 | 3.66 ± 0.83 | |
| APPET 3 “I feel hungry…” | 0.704 | 2.96 ± 1.06 | |
| APPET 7 “I feel sick or nauseated when I eat…” | 0.681 | 4.20 ± 1.04 | |
| APPET 2 “When I eat…” | 0.558 | 3.59 ± 0.87 | |
| Alpha value of the factor | 0.739 | 0.656 | |
| Percentage of explained variance | 28.9 | 28.7 | |
| Mean | 10.20 | 14.40 | |
| Standard deviation | 2.01 | 2.66 | |
| Factor variance | 4.05 | 7.09 | |
| Intraclass factor correlation | 0.724 | 0.644 | |
| Lower value | 0.627 | 0.529 | |
| Higher value | 0.799 | 0.737 | |
| F value | 3.63 | 2.81 | |
| p value | ≤0.001 | ≤0.001 | |
| Statistics | Desirable Criterion | Model #1 (n = 122) | Model #2 (n = 122) | Interpretation |
|---|---|---|---|---|
| Absolute fit X2/df (CMIN/df) | Less than 2 or 3 | (CMIN/df) = 1.155 | (CMIN/df) = 1.239 | The errors of the model are null with the sample used and the absolute fit is excellent |
| Goodness of fit index (GFI) | >0.900 Preferential > 0.950 | GFI = 0.967 | GFI = 0.964 | Good fit |
| Comparative goodness of fit index (CFI) | >0.900, Preferential > 0.950 | CFI = 0.988 | CFI = 0.980 | Acceptable comparative fit |
| Root mean square residual (RMR) | Near zero | RMR = 0.040 | RMR = 0.036 | Model error close to zero, almost perfect fit of model to data |
| Root mean square error of approximation (RMSEA) | Less than 0.08, close to zero | RMSEA = 0.036 (0.000–0.101) | RMSEA = 0.045 (0.000–0.106) | Model error close to zero, almost perfect fit of model to data |
| Appetite Score | |||
|---|---|---|---|
| Variables | Total Score | Factor 1 | Factor 2 |
| Dialysis malnutrition score | −0.227 ** | −0.217 ** | 0.154 * |
| Albumin (g/dL) | 0.258 ** | 0.135 | 0.294 ** |
| Creatinine (mg/dL) | 0.116 | 0.121 | 0.082 |
| Hemoglobin (mg/dL) | 0.039 | 0.012 | 0.074 |
| Phosphorus (mg/dL) | 0.252 ** | 0.173 * | 0.217 ** |
| Calcium (mg/dL) | −0.040 | −0.066 | −0.008 |
| BUN (mg/dL) | 0.108 | 0.034 | 0.122 |
| Total depression score | −0.372 ** | −0.313 ** | −0.339 ** |
| Total anxiety score | −0.362 ** | −0.310 ** | −0.317 ** |
| Distorted thoughts score | −0.222 ** | −0.133 | −0.238 ** |
| Diminished Appetite Score (≤25 points) | |||
|---|---|---|---|
| Yes (N = 56) | No (N = 126) | p-Value | |
| Age (years) | 52 (40–62) | 48 (34–58) | 0.064 |
| Female sex | 31 (55%) | 42 (33%) | 0.008 |
| Educational level | 0.021 | ||
| Elementary | 48 (86%) | 89 (71%) | |
| High school or higher | 8 (14%) | 37 (29%) | |
| Marital status | 0.837 | ||
| Single | 18 (32%) | 39 (31%) | |
| Couple | 38 (68%) | 87 (69%) | |
| Remunerated work | 8 (14%) | 37 (29%) | 0.021 |
| Diabetes mellitus | 25 (45%) | 54 (43%) | 0.872 |
| HD vintage (months) | 24 (9–42) | 24 (9–48) | 0.780 |
| HD session time (hours) | 3.8 (3.0–4.0) | 3.5 (3.0–4.0) | 0.983 |
| Albumin (g/dL) | 3.7 (3.4–4.1) | 3.8 (3.4–4.3) | 0.496 |
| Creatinine (mg/dL) | 8.6 (6.8–10.4) | 9.9 (7.5–12) | 0.025 |
| Hemoglobin (mg/dL) | 9.4 (7.9–10.4) | 8.9 (7.7–10.4) | 0.443 |
| Phosphorus (mg/dL) | 4.6 (3.8–6.7) | 5.8 (4.5–7.5) | 0.019 |
| Calcium (mg/dL) | 8.9 (8.3–9.4) | 8.7 (8.1–9.4) | 0.554 |
| BUN (mg/dL) | 54 (47–69) | 64 (50–76) | 0.038 |
| Body mass index (Kg/m2) | 23.3 (21.6–27.9) | 24.2 (21.4–29.1) | 0.497 |
| Percentage of ideal weight | 101.6 (93.9–114.3) | 105.6 (93.3–121.4) | 0.408 |
| Mid-arm circumference (cm) | 25.5 (23.3–28.4) | 26.5 (24.0–29.5) | 0.252 |
| Tricipital skinfold (cm) | 1.3 (0.9–1.6) | 1.2 (0.9–1.6) | 0.977 |
| Mid-arm muscle circumference | 21.6 (19.5–23.7) | 22.8 (20.7–24.7) | 0.074 |
| nPNA (g/kg/day) | 1.12 (0.83–1.35) | 1.16 (0.87–1.48) | 0.412 |
| Dialysis malnutrition score | 16 (13–19) | 14 (12–17) | 0.032 |
| PEW (%) | 15 (27%) | 27 (21%) | 0.429 |
| Total depression score | 15 (7–23) | 7 (3–12) | <0.001 |
| Somatic symptoms | 11 (6–16) | 6 (2–9) | <0.001 |
| Cognitive symptoms | 3 (1–8) | 1 (0–4) | 0.001 |
| Total anxiety score | 15 (7–23) | 7 (3–12) | <0.001 |
| Somatic symptoms | 8 (3–15) | 4 (1–7) | <0.001 |
| Cognitive symptoms | 3 (1–5) | 0 (0–3) | <0.001 |
| Distorted thoughts score | 56 (48–72) | 44 (37–59) | <0.001 |
| Catastrophism | 23 (16–28) | 15 (12–25) | 0.001 |
| Dichotomous thinking | 16 (10–20) | 11 (9–25) | 0.046 |
| Negative self-labelling | 9 (7–13) | 7 (6–11) | 0.001 |
| Perfectionism | 8 (6–11) | 5 (5–7) | <0.001 |
| Univariate | Multivariate | |||
|---|---|---|---|---|
| O.R. (I.C.95%) | p | O.R. (I.C.95%) | p | |
| Age (years) | 1.02 (1.00–1.04) | 0.08 | 1.02 (1.00–1.05) * | 0.05 |
| Female sex | 2.48 (1.30–4.72) | <0.01 | 2.66 (1.36–5.17) * | <0.01 |
| Elementary education | 2.49 (1.08–5.78) | 0.03 | 1.97 (0.77–5.00) & | 0.15 |
| Remunerated work | 0.40 (0.17–0.93) | 0.03 | 0.50 (0.20–1.28) & | 0.15 |
| Dialysis malnutrition score | 1.07 (0.99–1.17) | 0.10 | 1.04 (0.95–1.13) & | 0.43 |
| Creatinine (mg/dL) | 0.92 (0.85–1.00) | 0.06 | 0.96 (0.88–1.06) & | 0.42 |
| Phosphorus (mg/dL) | 0.85 (0.72–0.99) | 0.05 | 0.86 (0.73–1.01) & | 0.07 |
| BUN (mg/dL) | 0.99 (0.98–1.00) | 0.09 | 0.99 (0.97–1.00) & | 0.10 |
| Total depression score | 1.09 (1.05–1.13) | <0.01 | 1.08 (1.04–1.13) & | <0.01 |
| Somatic symptoms | 1.15 (1.07–1.22) | <0.01 | 1.14 (1.06–1.22) & | <0.01 |
| Cognitive symptoms | 1.11 (1.08–1.23) | <0.01 | 1.16 (1.06–1.27) & | <0.01 |
| Total anxiety score | 1.11 (1.05–1.16) | <0.01 | 1.10 (1.04–1.15) & | <0.01 |
| Somatic symptoms | 1.14 (1.07–1.22) | <0.01 | 1.13 (1.06–1.21) & | <0.01 |
| Cognitive symptoms | 1.23 (1.09–1.38) | <0.01 | 1.20 (1.06–1.35) & | <0.01 |
| Distorted thoughts score | 1.03 (1.02–1.05) | <0.01 | 1.03 (1.02–1.06) & | <0.01 |
Publisher’s Note: MDPI stays neutral with regard to jurisdictional claims in published maps and institutional affiliations. |
© 2021 by the authors. Licensee MDPI, Basel, Switzerland. This article is an open access article distributed under the terms and conditions of the Creative Commons Attribution (CC BY) license (https://creativecommons.org/licenses/by/4.0/).
Share and Cite
Salazar-Robles, E.; Lerma, A.; Calderón-Juárez, M.; Ibarra, A.; Pérez-Grovas, H.; Bermúdez-Aceves, L.A.; Bosques-Brugada, L.E.; Lerma, C. Assessment of Factors Related to Diminished Appetite in Hemodialysis Patients with a New Adapted and Validated Questionnaire. Nutrients 2021, 13, 1371. https://doi.org/10.3390/nu13041371
Salazar-Robles E, Lerma A, Calderón-Juárez M, Ibarra A, Pérez-Grovas H, Bermúdez-Aceves LA, Bosques-Brugada LE, Lerma C. Assessment of Factors Related to Diminished Appetite in Hemodialysis Patients with a New Adapted and Validated Questionnaire. Nutrients. 2021; 13(4):1371. https://doi.org/10.3390/nu13041371
Chicago/Turabian StyleSalazar-Robles, Elihud, Abel Lerma, Martín Calderón-Juárez, Armando Ibarra, Héctor Pérez-Grovas, Luis A. Bermúdez-Aceves, Lilian E. Bosques-Brugada, and Claudia Lerma. 2021. "Assessment of Factors Related to Diminished Appetite in Hemodialysis Patients with a New Adapted and Validated Questionnaire" Nutrients 13, no. 4: 1371. https://doi.org/10.3390/nu13041371
APA StyleSalazar-Robles, E., Lerma, A., Calderón-Juárez, M., Ibarra, A., Pérez-Grovas, H., Bermúdez-Aceves, L. A., Bosques-Brugada, L. E., & Lerma, C. (2021). Assessment of Factors Related to Diminished Appetite in Hemodialysis Patients with a New Adapted and Validated Questionnaire. Nutrients, 13(4), 1371. https://doi.org/10.3390/nu13041371