
Unhealthy Diet Pattern Mediates the Disproportionate Prevalence of Obesity among Adults with Socio-Economic Disadvantage: An Australian Representative Cross-Sectional Study


Abstract
1. Introduction
2. Materials and Methods
2.1. Study Design, Setting, and Participants
2.2. Ethics
2.3. Data Sources/Measurement
2.4. Variables
2.5. Outcome
2.6. Predictors
2.7. Covariates
2.8. Bias
2.9. Statistical Methods
3. Results
4. Discussion
4.1. Main Finding
4.2. Study Strength and Limitation
5. Conclusions
Supplementary Materials
Author Contributions
Funding
Institutional Review Board Statement
Informed Consent Statement
Data Availability Statement
Acknowledgments
Conflicts of Interest
References
- Collaboration NCDRF. Worldwide trends in body-mass index, underweight, overweight, and obesity from 1975 to 2016: A pooled analysis of 2416 population-based measurement studies in 128.9 million children, adolescents, and adults. Lancet 2017, 390, 2627–2642. [Google Scholar] [CrossRef]
- The GBD 2015 Obesity Collaborators; Afshin, A.; Forouzanfar, M.H.; Reitsma, M.B.; Sur, P.; Estep, K.; Lee, A.; Marczak, L.; Mokdad, A.H.; Moradi-Lakeh, M.; et al. Health effects of overweight and obesity in 195 countries over 25 years. N. Engl. J. Med. 2017, 377, 13–27. [Google Scholar] [CrossRef] [PubMed]
- Lim, S.S.; Vos, T.; Flaxman, A.D.; Danaei, G.; Shibuya, K.; Adair-Rohani, H.; A AlMazroa, M.; Amann, M.; Anderson, H.R.; Andrews, K.G.; et al. A comparative risk assessment of burden of disease and injury attributable to 67 risk factors and risk factor clusters in 21 regions, 1990–2010: A systematic analysis for the Global Burden of Disease Study 2010. Lancet 2012, 380, 2224–2260. [Google Scholar] [CrossRef]
- Mackenbach, J.P.; Stirbu, I.; Roskam, A.J.; Schaap, M.M.; Menvielle, G.; Leinsalu, M.; Kunst, A.E. European Union Working Group on socioeconomic inequalities in H: Socioeconomic inequalities in health in 22 European countries. N. Engl. J. Med. 2008, 358, 2468–2481. [Google Scholar] [CrossRef]
- McLaren, L. Socioeconomic status and obesity. Epidemiol. Rev. 2007, 29, 29–48. [Google Scholar] [CrossRef] [PubMed]
- ABS. National Health Survey, 2017–2018; Customised Data Report; Australian Bureau of Statistics: Canberra, Australia, 2019.
- Nichols, M.S.; Reynolds, R.C.; Waters, E.; Gill, T.; King, L.; Swinburn, B.A.; Allender, S. Community-based efforts to prevent obesity: Australia-wide survey of projects. Health Promot. J. Aust. 2013, 24, 111–117. [Google Scholar] [CrossRef]
- Overweight and Obesity: An Interactive Insight. Available online: https://www.aihw.gov.au/reports/overweight-obesity/overweight-and-obesity-an-interactive-insight/contents/time-trends (accessed on 15 February 2021).
- Rodgers, A.; Woodward, A.; Swinburn, B.; Dietz, W.H. Prevalence trends tell us what did not precipitate the US obesity epidemic. Lancet Public Health 2018, 3, e162–e163. [Google Scholar] [CrossRef]
- Kearney, J. Food consumption trends and drivers. Philos. Trans. R. Soc. B Biol. Sci. 2010, 365, 2793–2807. [Google Scholar] [CrossRef] [PubMed]
- GBD 2017 Diet Collaborators. Health effects of dietary risks in 195 countries, 1990–2017: A systematic analysis for the Global Burden of Disease Study 2017. Lancet 2019, 393, 1958–1972. [Google Scholar] [CrossRef]
- Seifu, C.N.; Fahey, P.P.; Hailemariam, T.G.; Frost, S.A.; Atlantis, E. Dietary patterns associated with obesity outcomes in adults: An umbrella review of systematic reviews. Public Health Nutr. 2021, 1–49. [Google Scholar] [CrossRef]
- Buckland, G.; Bach, A.; Serra-Majem, L. Obesity and the Mediterranean diet: A systematic review of observational and intervention studies. Obes. Rev. 2008, 9, 582–593. [Google Scholar] [CrossRef] [PubMed]
- Franquesa, M.; Pujol-Busquets, G.; García-Fernández, E.; Rico, L.; Shamirian-Pulido, L.; Aguilar-Martínez, A.; Medina, F.-X.; Serra-Majem, L.; Bach-Faig, A. Mediterranean Diet and cardiodiabesity: A systematic review through evidence-based answers to key clinical questions. Nutrients 2019, 11, 655. [Google Scholar] [CrossRef] [PubMed]
- Kell, K.P.; Judd, S.E.; Pearson, K.E.; Shikany, J.M.; Fernandez, J.R. Associations between socio-economic status and dietary patterns in US black and white adults. Br. J. Nutr. 2015, 113, 1792–1799. [Google Scholar] [CrossRef]
- Marques-Vidal, P.; Waeber, G.; Vollenweider, P.; Bochud, M.; Stringhini, S.; Guessous, I. Sociodemographic and behavioural determinants of a healthy diet in Switzerland. Ann. Nutr. Metab. 2015, 67, 87–95. [Google Scholar] [CrossRef] [PubMed]
- Zhou, L.; Cao, D.; Si, Y.; Zhu, X.; Du, L.; Zhang, Y.; Zhou, Z. Income-related inequities of adult obesity and central obesity in China: Evidence from the China Health and Nutrition Survey 1997–2011. BMJ Open 2020, 10, e034288. [Google Scholar] [CrossRef] [PubMed]
- de Mestral, C.; Chatelan, A.; Marques-Vidal, P.; Stringhini, S.; Bochud, M. The contribution of diet quality to socioeconomic inequalities in obesity: A population-based study of Swiss adults. Nutrients 2019, 11, 1573. [Google Scholar] [CrossRef]
- Von Elm, E.; Altman, D.G.; Egger, M.; Pocock, S.J.; Gotzsche, P.C.; Vandenbroucke, J.P.; STROBE Initiative. The strengthening the reporting of observational studies in epidemiology (STROBE) statement: Guidelines for reporting observational studies. J. Clin. Epidemiol. 2008, 61, 344–349. [Google Scholar] [CrossRef] [PubMed]
- ABS. Australian Health Survey: Users’ Guide, 2011–2013; Australian Bureau of Statistics: Canberra, Australia, 2014.
- The Australian Health Survey. Available online: www.abs.gov.au/australianhealthsurvey (accessed on 16 February 2021).
- ABS. MicrodataDownload; Australian Bureau of Statistics: Canberra, Australia, 2021.
- ABS. National Nutrition and Physical Activity Survey 2011–2012: Questionnaire; Australian Bureau of Statistics: Canberra, Australia, 2013.
- Trichopoulou, A.; Costacou, T.; Bamia, C.; Trichopoulos, D. Adherence to a Mediterranean diet and survival in a Greek population. N. Engl. J. Med. 2003, 348, 2599–2608. [Google Scholar] [CrossRef] [PubMed]
- McNutt, L.-A.; Wu, C.; Xue, X.; Hafner, J.P. Estimating the relative risk in cohort studies and clinical trials of common outcomes. Am. J. Epidemiol. 2003, 157, 940–943. [Google Scholar] [CrossRef]
- Tingley, D.; Yamamoto, T.; Hirose, K.; Keele, L.; Imai, K. Mediation: R Package for Causal Mediation Analysis. J. Stat. Softw. 2014, 59. [Google Scholar] [CrossRef]
- Bentley, R.A.; Ormerod, P.; Ruck, D.J. Recent origin and evolution of obesity-income correlation across the United States. Palgrave Commun. 2018, 4. [Google Scholar] [CrossRef]
- Kim, T.J.; von dem Knesebeck, O. Income and obesity: What is the direction of the relationship? A systematic review and meta-analysis. BMJ Open 2018, 8, e019862. [Google Scholar] [PubMed]
- Ameye, H.; Swinnen, J. Obesity, income and gender: The changing global relationship. Glob. Food Secur. 2019, 23, 267–281. [Google Scholar] [CrossRef]
- Bray, G.A.; Frühbeck, G.; Ryan, D.H.; Wilding, J.P.H. Management of obesity. Lancet 2016, 387, 1947–1956. [Google Scholar] [CrossRef]
- PwC. Weighing the Cost of Obesity: A Case for Action; PwC: Barangaroo, Australia, 2015. [Google Scholar]
- Drewnowski, A. Obesity, diets, and social inequalities. Nutr. Rev. 2009, 67, S36–S39. [Google Scholar] [CrossRef]
- Giskes, K.; Avendano, M.; Brug, J.; Kunst, A.E. A systematic review of studies on socioeconomic inequalities in dietary intakes associated with weight gain and overweight/obesity conducted among European adults. Obes. Rev. 2010, 11, 413–429. [Google Scholar] [CrossRef]
- Rao, M.; Afshin, A.; Singh, G.; Mozaffarian, D. Do healthier foods and diet patterns cost more than less healthy options? A systematic review and meta-analysis. BMJ Open 2013, 3, e004277. [Google Scholar] [CrossRef]
- Hilmers, A.; Hilmers, D.C.; Dave, J. Neighborhood disparities in access to healthy foods and their effects on environmental justice. Am. J. Public Health 2012, 102, 1644–1654. [Google Scholar] [CrossRef]
- Lopez, C.N.; Martinez-Gonzalez, M.A.; Sanchez-Villegas, A.; Alonso, A.; Pimenta, A.M.; Bes-Rastrollo, M. Costs of Mediterranean and western dietary patterns in a Spanish cohort and their relationship with prospective weight change. J. Epidemiol. Community Health 2009, 63, 920–927. [Google Scholar] [CrossRef]
- Giskes, K.M.; Van Lenthe, F.J.; Avendano-Pabon, M.; Brug, J. A systematic review of environmental factors and obesogenic dietary intakes among adults: Are we getting closer to understanding obesogenic environments? Obes. Rev. 2010, 12, e95–e106. [Google Scholar] [CrossRef]
- Filomena, S.; Scanlin, K.; Morland, K.B. Brooklyn, New York foodscape 2007–2011: A five-year analysis of stability in food retail environments. Int. J. Behav. Nutr. Phys. Act. 2013, 10, 1–46. [Google Scholar] [CrossRef]
- Franck, C.; Grandi, S.M.; Eisenberg, M.J. Taxing junk food to counter obesity. Am. J. Public Health 2013, 103, 1949–1953. [Google Scholar] [CrossRef]
- Tamir, O.; Cohen-Yogev, T.; Furman-Assaf, S.; Endevelt, R. Taxation of sugar sweetened beverages and unhealthy foods: A qualitative study of key opinion leaders’ views. Isr. J. Health Policy Res. 2018, 7, 43. [Google Scholar] [CrossRef]
- Blakely, T.; Cleghorn, C.; Mizdrak, A.; Waterlander, W.; Nghiem, N.; Swinburn, B.; Wilson, N.; Ni Mhurchu, C. The effect of food taxes and subsidies on population health and health costs: A modelling study. Lancet Public Health 2020, 5, e404–e413. [Google Scholar] [CrossRef]
- Brambila-Macias, J.; Shankar, B.; Capacci, S.; Mazzocchi, M.; Perez-Cueto, F.J.; Verbeke, W.; Traill, W.B. Policy interventions to promote healthy eating: A review of what works, what does not, and what is promising. Food Nutr. Bull. 2011, 32, 365–375. [Google Scholar] [CrossRef]
- Fergus, L.; Seals, K.; Holston, D. Nutrition interventions in low-income rural and urban retail environments: A systematic review. J. Acad. Nutr. Diet. 2021. [Google Scholar] [CrossRef]
- Mozaffarian, D.; Hao, T.; Rimm, E.B.; Willett, W.C.; Hu, F.B. Changes in diet and lifestyle and long-term weight gain in women and men. N. Engl. J. Med. 2011, 364, 2392–2404. [Google Scholar] [CrossRef] [PubMed]
- Mu, M.; Xu, L.-F.; Hu, N.; Wu, J.; Bai, M.-J. Dietary patterns and overweight/obesity: A review article. Iran. J. Public Health 2017, 46, 869–876. [Google Scholar]
- Hawkes, C.; Smith, T.G.; Jewell, J.; Wardle, J.; A Hammond, R.; Friel, S.; Thow, A.M.; Kain, J. Smart food policies for obesity prevention. Lancet 2015, 385, 2410–2421. [Google Scholar] [CrossRef]
- Willett, W.C.; Sacks, F.; Trichopoulou, A.; Drescher, G.; Ferro-Luzzi, A.; Helsing, E.; Trichopoulos, D. Mediterranean diet pyramid: A cultural model for healthy eating. Am. J. Clin. Nutr. 1995, 61, 1402S–1406S. [Google Scholar] [CrossRef] [PubMed]
- Agnoli, C.; Sieri, S.; Ricceri, F.; Giraudo, M.T.; Masala, G.; Assedi, M.; Panico, S.; Mattiello, A.; Tumino, R.; Giurdanella, M.C.; et al. Adherence to a Mediterranean diet and long-term changes in weight and waist circumference in the EPIC-Italy cohort. Nutr. Diabetes 2018, 8, 22. [Google Scholar] [CrossRef] [PubMed]
- Martínez-González, M.A.; Gea, A.; Ruiz-Canela, M. The Mediterranean diet and cardiovascular health. Circ. Res. 2019, 124, 779–798. [Google Scholar] [CrossRef] [PubMed]
- Jaacks, L.M.; Sher, S.; De Staercke, C.; Porkert, M.; Alexander, W.R.; Jones, D.P.; Vaccarino, V.; Ziegler, T.R.; Quyyumi, A.A. Pilot randomized controlled trial of a Mediterranean diet or diet supplemented with fish oil, walnuts, and grape juice in overweight or obese US adults. BMC Nutr. 2018, 4, 1–8. [Google Scholar] [CrossRef]
- Dinu, M.; Pagliai, G.; Casini, A.; Sofi, F. Mediterranean diet and multiple health outcomes: An umbrella review of meta-analyses of observational studies and randomised trials. Eur. J. Clin. Nutr. 2018, 72, 30–43. [Google Scholar] [CrossRef] [PubMed]


| Obesity Status | p-Value | |||
|---|---|---|---|---|
| Number (Percent) | ||||
| Without Obesity BMI 18.5–29.9 kg/m2 n = 5559 | With Obesity BMI ≥ 30 kg/m2 n = 2185 | |||
| MDS 1 | 0–4 | 3535 (63.6) | 1549 (70.9) | <0.001 |
| 5–9 | 2024 (36.4) | 636 (29.1) | ||
| SEIFA 2 | Most disadvantaged | 970 (17.4) | 481 (22.0) | <0.001 |
| Second quintile | 1057 (19.0) | 523 (23.9) | ||
| Third quintile | 1134 (20.4) | 418 (19.1) | ||
| Fourth quintile | 1001 (18.0) | 370 (16.9) | ||
| Least disadvantaged | 1397 (25.1) | 393 (18.0) | ||
| Sex | Male | 2718 (48.9) | 1030 (47.1) | 0.1648 |
| Female | 2841 (51.1) | 1155 (52.9) | ||
| Country of birth | Australia | 3849 (69.2) | 1634 (74.8) | <0.001 |
| Other English-speaking countries | 700 (12.6) | 269 (12.3) | ||
| Other countries | 1010 (18.2) | 282 (12.9) | ||
| Marital status | Married/de facto | 2899 (52.1) | 1217 (55.7) | 0.005 |
| Not married | 2660 (47.9) | 968 (44.3) | ||
| Hours usually worked each week | Not in workforce/unemployed | 1834 (33.0) | 834 (38.2) | <0.001 |
| 1–24 h | 752 (13.5) | 247 (11.3) | ||
| 25–39 h | 1169 (21.0) | 434 (19.9) | ||
| 40 h and more | 1804 (32.5) | 670 (30.7) | ||
| Energy density 3 | First tertile | 1764 (31.7) | 817 (37.4) | <0.001 |
| Second tertile | 1885 (33.9) | 697 (31.9) | ||
| Third tertile | 1910 (34.4) | 671 (30.7) | ||
| Smoking status | Current smoker | 1084 (19.5) | 391 (17.9) | <0.001 |
| Ex-smoker | 1700 (30.6) | 844 (38.6) | ||
| Never smoked | 2775 (49.9) | 950 (43.5) | ||
| Whether exercise last week, met 150 min recommended guidelines | Met recommended guidelines | 3002 (54.0) | 935 (42.8) | <0.001 |
| Did not meet or do not know | 2557 (46.0) | 1250 (57.2) | ||
| Long-term conditions | No condition | 4413 (79.4) | 1377 (63.0) | <0.001 |
| One condition only | 773 (13.9) | 473 (21.6) | ||
| Multiple conditions | 373 (6.7) | 335 (15.3) | ||
| SEIFA 1 | Model 1 | Model 2 | Model 3 | Model 4 | Model 5 | Model 6 |
|---|---|---|---|---|---|---|
| PR (95%CI) | PR (95%CI) | PR (95%CI) | PR (95%CI) | PR (95%CI) | PR (95%CI) | |
| Most disadvantaged | 1.51(1.35, 1.69) *** | 1.51(1.35, 1.69) *** | 1.48(1.32, 1.66) *** | 1.46(1.30, 1.63) *** | 1.46(1.30, 1.63) *** | 1.40(1.25, 1.56) *** |
| Second quintile | 1.51(1.35, 1.69) *** | 1.51(1.35, 1.68) *** | 1.45(1.30, 1.62) *** | 1.43(1.28, 1.60) *** | 1.43(1.28, 1.59) *** | 1.38(1.24, 1.54) *** |
| Third quintile | 1.23(1.09, 1.38) ** | 1.22(1.09, 1.38) ** | 1.20(1.06, 1.35) ** | 1.19(1.05, 1.34) ** | 1.18(1.05, 1.33) ** | 1.18(1.05, 1.32) ** |
| Fourth quintile | 1.23(1.09, 1.39) ** | 1.24(1.09, 1.40) ** | 1.23(1.09, 1.38) ** | 1.22(1.08, 1.38) ** | 1.22(1.08, 1.37) ** | 1.20(1.06, 1.35) ** |
| Least disadvantaged | Reference | Reference | Reference | Reference | Reference | Reference |
| PR (95%CI) | Proportion Mediated by MDS % (95% CI) | |
|---|---|---|
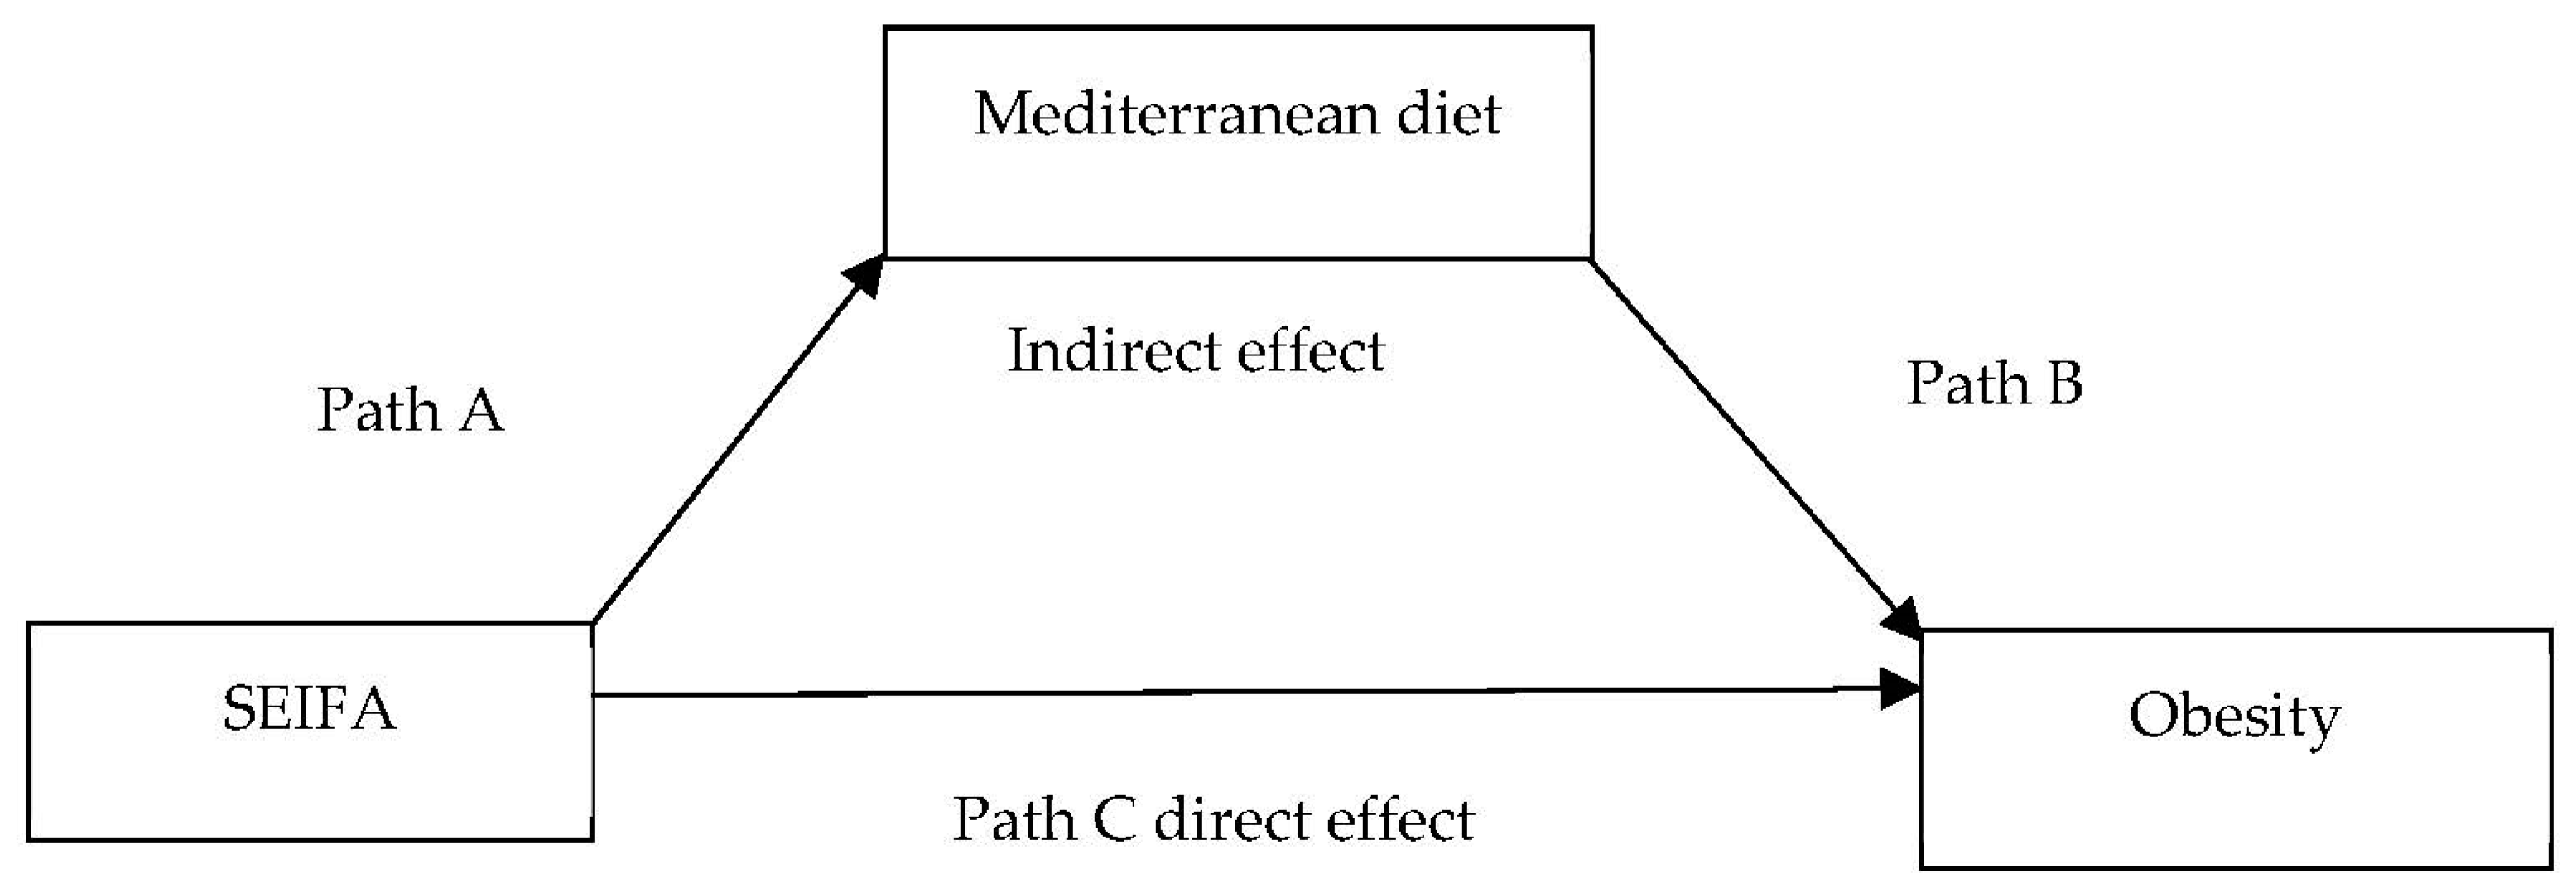
| Path A (SEIFA→MDS) | 1.13(1.08, 1.19) *** | |
| Path B (MDS→Obesity) | 1.19(1.10, 1.29) *** | |
| Path C direct effect (SEIFA→Obesity) | 1.09(1.06, 1.12) *** | |
| Indirect effect (SEIFA→Obesity mediated by MDS) | 1.00(1.00, 1.01) *** | |
| Total effect (SEIFA→MDS→Obesity) | 1.09(1.06, 1.13) *** | 4.0(1.9, 8.0) |
Publisher’s Note: MDPI stays neutral with regard to jurisdictional claims in published maps and institutional affiliations. |
© 2021 by the authors. Licensee MDPI, Basel, Switzerland. This article is an open access article distributed under the terms and conditions of the Creative Commons Attribution (CC BY) license (https://creativecommons.org/licenses/by/4.0/).
Share and Cite
Seifu, C.N.; Fahey, P.P.; Atlantis, E. Unhealthy Diet Pattern Mediates the Disproportionate Prevalence of Obesity among Adults with Socio-Economic Disadvantage: An Australian Representative Cross-Sectional Study. Nutrients 2021, 13, 1363. https://doi.org/10.3390/nu13041363
Seifu CN, Fahey PP, Atlantis E. Unhealthy Diet Pattern Mediates the Disproportionate Prevalence of Obesity among Adults with Socio-Economic Disadvantage: An Australian Representative Cross-Sectional Study. Nutrients. 2021; 13(4):1363. https://doi.org/10.3390/nu13041363
Chicago/Turabian StyleSeifu, Canaan Negash, Paul Patrick Fahey, and Evan Atlantis. 2021. "Unhealthy Diet Pattern Mediates the Disproportionate Prevalence of Obesity among Adults with Socio-Economic Disadvantage: An Australian Representative Cross-Sectional Study" Nutrients 13, no. 4: 1363. https://doi.org/10.3390/nu13041363
APA StyleSeifu, C. N., Fahey, P. P., & Atlantis, E. (2021). Unhealthy Diet Pattern Mediates the Disproportionate Prevalence of Obesity among Adults with Socio-Economic Disadvantage: An Australian Representative Cross-Sectional Study. Nutrients, 13(4), 1363. https://doi.org/10.3390/nu13041363