Abstract
The dynamics and diversity of human gut microbiota that can remarkably influence the wellbeing and health of the host are constantly changing through the host’s lifetime in response to various factors. The aim of the present study was to determine a set of parameters that could have a major impact on classifying subjects into a single cluster regarding gut bacteria composition. Therefore, a set of demographical, environmental, and clinical data of healthy adults aged 25–50 years (117 female and 83 men) was collected. Fecal microbiota composition was characterized using Illumina MiSeq 16S rRNA gene amplicon sequencing. Hierarchical clustering was performed to analyze the microbiota data set, and a supervised machine learning model (SVM; Support Vector Machines) was applied for classification. Seventy variables from collected data were included in machine learning analysis. The agglomerative clustering algorithm suggested the presence of four distinct community types of most abundant bacterial phyla. Each cluster harbored a statistically significant different proportion of bacterial phyla. Regarding prediction, the most important features classifying subjects into clusters were measures of obesity (waist to hip ratio, BMI, and visceral fat index), total body water, blood pressure, energy intake, total fat, olive oil intake, total fiber intake, and water intake. In conclusion, the SVM model was shown as a valuable tool to classify healthy individuals based on their gut microbiota composition.
1. Introduction
The human gut microbiota is a complex and dynamic community of bacteria, viruses, fungi, protozoa, and archaea, which coexist in symbiosis with the host [1]. Due to the relative abundance of the Bacteria domain and its role in health and disease of the host this part of gut microbiota has been widely studied. The density of bacterial community along the gastrointestinal (GI) tract varies and is the highest in the colon that harbors 1012 bacteria/gram of intestinal content [2]. A significant contribution of gut bacteria in the functionality of immune, GI, and nervous system has been observed, including (i) maturation and regulation of the immune system [3], (ii) intestinal mucosal barrier maintenance [4], (iii) protection against pathogens [5], and (iv) balancing energy metabolism and hormone levels [6]. Moreover, the disturbance in the gut microbiota homeostasis has been associated with gastrointestinal disorders [7], metabolic diseases [8], as well as with neurological disorders [9].
Although individually specific, the gut microbiota of a healthy adult is composed mainly of two dominant bacterial phyla Firmicutes and Bacteroides (90%) followed by other phyla, including Actinobacteria (mainly Bifidobacterium), Proteobacteria, Fusobacteria, and Verrucomicrobia in lower proportion [10]. While the key events of gut microbiota development are set already in early life [11], the microbial community can daily be influenced by a wide range of environmental and inter-individual variables, including diet, medications, and a wide range of anthropometric measurements [12]. The gut bacteria composition, diversity, and/or functional richness of a healthy individual have been shown before to be correlated with variables such as age and sex [12,13], obesity [14,15], diet (e.g., fiber intake, a diet rich in carbohydrates or proteins) [16,17]. Although diet and medications, specifically antibiotics, are recognized as the most important factors modulating the diversity and function of the gut microbiota, this explains only a small proportion of variations [12,18,19]. Interestingly, a negligible influence of host genetics on fecal microbiome composition was observed [20]. The last suggests that interventions on microbiota composition with the aim of beneficial health outcomes may be carried out across diverse genetic backgrounds [12].
However, it is still an open question which of the gut microbiota-associated variables could serve as predictors of phyla and genera abundance in healthy individuals. It is conceivable that the gut microbiota composition could then yield important information about the physiological state of the host. The classification from microbiome data has already been performed recognizing the support vector machines (SVM) as one of the most effective and accurate machine learning techniques [21]. The first aim of the present study was the clustering of healthy subjects according to the bacteria phyla abundance. Secondly, we aimed to determine which subject’s characteristics, such as age, gender, BMI (body mass index), macro- and micronutrient intakes, level of physical activity, alcohol consumption, daily sleeping hours, and others are of the highest importance in allocating healthy individuals into a single cluster, using SVM. The obtained data could provide us with a comprehensive check on microbiota-associated variables that simultaneously influence the allocation of healthy subjects into clusters.
2. Materials and Methods
2.1. Study Design
The present study was a part of a larger project on the effect of alcohol consumption on gut microbiota (ALMICROBHOL). This cross-sectional study has been approved by the Slovenian National Medical Ethics Committee (No. 53/03/2015) and was performed according to the Declaration of Helsinki (the latest amendment in Fortalesa, Brasil, 2013) at the Faculty of Health Sciences, University of Primorska, Izola, Slovenia, between October 2014 and December 2016. Prior to the study, all of the participants submitted a written informed consent.
The participants who met the inclusion criteria followed a two-visit schedule. In the first visit, participants completed questionnaires about physical activity, alcohol consumption and macro- and micronutrient intakes. Anthropometrical measurements, blood pressure, and questionnaires about overall health status and quality of life were performed in a second visit. All questionnaires were filled in by a trained investigator in personal interviews with the participant. In addition, all questionnaires were validated and translated into English and from English to the Slovenian language. For gut microbiota analysis, each participant brought a fresh stool sample that was collected in a sterile container at home the day before an in-person visit. The samples were immediately stored at −80 °C and collectively transported on dry ice to the Spanish Institute of Food Science, Technology and Nutrition (ICTAN, Madrid, Spain) for further analysis.
2.2. Study Subjects
For this cross-sectional study, 261 healthy individuals (Caucasian origin) from the general population were recruited by advertisement (internet forums, e-mail and newspaper advertisements). Only subjects who met the following inclusion criteria were eligible to participate: (a) aged 25–50 years; (b) body mass index (BMI) between 18.5 and 35 kg/m2; (c) healthy with no cardiovascular, endocrine, GI, or acute or chronic inflammatory diseases; (d) not taking nonsteroidal anti-inflammatory drugs or antibiotics 90 days prior to the study; and (e) reporting a stable weight within the last three months. Among 261 potential subjects, 61 were excluded from the study because of the missing questionnaire data or stool sample for microbiota analysis.
2.2.1. Dietary Assessment
Study subjects first underwent baseline energy intake assessments, including a three-day accurate food recording and an assessment of a 30-day validated food frequency questionnaire. The last estimates the amount and consumption frequency of 209 food items including both foods, water intake and beverages over the past one-month period [22]. One week prior to stool sample collection the subjects were instructed to record and weigh their food intake for three consecutive days (two days during the week and one weekend). Where possible, subjects were asked to include food labels and recipes for mixed dishes and were encouraged to avoid any alterations to their normal diet. They were taught to weigh and record all food and beverages immediately before eating and to weigh and describe any leftovers. Dietary data (energy values and macro- and micronutrient content) were analyzed using a freely accessible online dietary assessment and planning tool, named Open Platform for Clinical Nutrition (http://www.opkp.si/en_GB/cms/vstopna-stran). Moreover, adherence to the Mediterranean diet was investigated according to the 14-item Mediterranean diet adherence score used in the PREDIMED study. Based on the gained score, subjects adherence to the Mediterranean diet was classified as low (0–7), moderate (8–10), or high (11–17) [23]. In addition, the specific consumption of alcoholic beverages was determined by an ad-hoc modified questionnaire of the SUN study [24].
2.2.2. Body Composition Measurements
Subjects’ height, weight, waist and hip circumference, as well as blood pressure were measured using a standardized protocol. All measurements were performed by the same examiner between 7 a.m. and 9 a.m. The height and weight of participants were measured in light indoor clothing without shoes with a precision of 0.1 cm and 0.1 kg. The waist measurements were performed in a standing position halfway between the coastal edge and iliac crest, whereas for hips the greatest circumference around the buttocks as measured. BMI was calculated by the formula BMI = (weight in kg)/(height in m)2 and waist to hip ratios by the formula WHR = waist (cm)/hip (cm). Body composition (total percentage of body fat (% BF) and percentage of trunk fat (% TF) were assessed by bioelectrical impedance analysis (BIA) using a Tanita BC 418MA, followed by data analysis in software provided by the manufacturer (Tanita Corporation, Arlington Heights, IL). Although there is a correlation between % BF and % TF, visceral fat is better presented by % TF. In addition, the same analysis provided also the visceral fat rating data.
2.2.3. Overall Health Status and Quality of Life
Overall health status, diagnosed diseases, symptoms, drug administration, and sleep quality were evaluated through the interview. Socio-economic status (academic background, incomes, economic supports, and family members) and daily activities (hours spent for personal hygiene, shopping, cooking, and cleaning and tidying the house) were assessed by the modified AFINOS study questionnaire [25]. Subjective self-perception of physical and emotional health and pain were determined by the Short Form-36 Health Survey questionnaire [26]. In addition, the physical activity of participating subjects was assessed using the Minnesota Leisure Time Physical Activity Questionnaire. EER was estimated according to Institute of Medicine of the National Academies, accessible online: https://www.nap.edu/read/10490/chapter/1.
2.2.4. Gut Microbiota Composition
The gut microbiota composition was determined using the MiSeq Illumina system (Illumina, San Diego, CA, USA) as previously described [27]. Briefly, after the bacterial DNA extraction using an optimized protocol [28], the DNA was recovered with the commercial QIAamp DNA Stool Mini Kit (Qiagen N.V., Venlo, The Netherlands) following the manufacturer’s instructions and stored at −80 °C for further analysis. DNA concentration was measured by UV absorbance at 260 nm, and the DNA quality was also assessed by the 260/280 nm ratio using a Nanodrop ND-1000 spectrophotometer (Thermo Fisher Scientific, Wilmington, DE, USA). Subsequently, Picogreen analysis of double-stranded DNA was performed by a QuantiFluor ST fluorometer (Promega, Madison, WI, USA), and all samples were diluted to a final concentration of 0.5 ng/µL for the amplification of the V3–V4 variable regions of the 16S RNA gene. DNA amplicon integrity was checked by 1.5% agarose gel electrophoresis (Pronadisa, Madrid, Spain), and libraries were normalized and pooled. Sequencing was performed by the MiSeq Illumina system (Illumina, San Diego, CA, USA) using the V3 kit on a 2 × 270 paired-end runs.
The taxonomy classification was performed with the MiSeq Reporter software (v2.3, Illumina) in several steps, including demultiplexing and FASTq file generation, as described before [27]. Sequences were then clustered into operational taxonomic units (OTUs) with Classify Reads, a high-performance implementation of the Ribosomal Database Project (RDP) based on the Greengenes database, obtaining 26 phyla, 605 genera, and 1790 species (Classify Reads accuracy was 100%, 99.97%, and 98.65%, respectively) [29]. Taxa with relative abundance <0.002% of total reads and also those with a prevalence of <10 subjects were removed for the statistical analysis. For the present study, the data about relative abundance was obtained from the Illumina 16S Metagenomic Report of the gut microbiota from an individual stool sample, provided by the ICTAN (Madrid, Spain). Data with relative abundances of phyla and genera of 200 subjects that were included in the present study are presented as Supplementary Material (Table S1).
2.3. Data Analysis
The resulting data in the context of the survey questioners and gut microbiota analysis were entered into a database. Frequencies were compiled for all variables and are presented as percentages for nominal and as mean or median and standard deviation (SD) for numeric variables. Quantitative data analysis with the application of statistical software was performed in SPSS software version 23 (IBM, Armonk, NY, USA). An R package version 3.5 was used for pre-processing data and for performing hierarchy clustering using Ward’s linkage method. The caret package in R was used to build the Support Vector Machine (SVM) classifier. For the SVM classification model, the variable importance was calculated by computing the area under the Operating Characteristic (ROC) curve. The Variable importance function, which is a part of the caret package in R, automatically scales the importance scores to be between 0 and 100.
2.3.1. Cluster Analysis of Gut Microbiota
Hierarchical clustering using Ward’s linkage of the correlation coefficient as a distance measure was performed to analyze the microbiota data set. For clustering, the data that met the next criteria were used: most abundant phyla with more than 50% of the data above detection limit. According to the criteria, data of five phyla (Firmicutes, Bacteroidetes, Proteobacteria, Actinobacteria, and Verrucomicrobia) of 200 healthy individuals were used. Before the analysis, the data set were scaled so that all variables have zero mean and unit variance.
Pearson correlation distance was used as a similarity measure (distance) between variables. The correlation distance (D) is defined as D = 1 − R, where R is the Pearson correlation coefficient. We choose correlation distance as a similarity measure because the main interest was to inspect the strength of the linear relationship between variables. The Ward’s linkage, a minimal increase of sum-of-squares, was used to calculate the distance between clusters. Hierarchical clustering results in a clustering structure consisting of nested partitions. In an agglomerative clustering algorithm, the clustering begins with singleton sets of each point. That is, each data point is its own cluster. At a single time step, the most similar cluster pairs are combined according to the chosen similarity measure, and this step is repeated until predetermined criteria are met.
2.3.2. Predicting Microbiota Clusters Using Support Vector Machine
Support Vector Machine (SVM) is a supervised machine learning technique that is widely used for classification challenges. The SVM algorithm performs classification by constructing multidimensional planes that define decision boundaries. In this study, the Radial Basis Function (RBF) kernel was applied to discriminate four cluster classes. Seventy variables from data collected on demographics, anthropometrics, lifestyle, and socio-economic status were included to build the SVM model. The detailed description of variables is presented in the Table S2 of the Supplementary Materials. The variables were selected (1) to illustrate RBF performance when dealing with a high-dimensional biomedical problem combining continuous and categorical traits and (2) to uncover potentially unknown predictors of microbiota composition. Variable selection was also guided by biological plausibility and was limited to variables with less than 5% missing data. The SVM model was validated using a Leave-one-out cross-validation setup, which is a special case of cross-validation. Leave-one-out cross-method performs training on the whole data set minus single observation. The single observation, which is not a part of the training set, is used for the validation. Leave-one-out cross-validation is repeated k-times where k is the number of observations in the original sample. RBF has two main parameters: C controls the cost of miss-classification, and gamma determines the radius of influence of the support vectors. Thus, the systematic grid search in a combination of Leave-one-out cross-method was performed for the search of best C and gamma values. The values of C and gamma where the highest accuracy was achieved were selected as the optimal parameter set. The optimal parameters C and gamma were 7 and 0.03, respectively. The performance of the model was additionally estimated by a calculation of confusion matrix that shows in which way the model is confused when it makes predictions. The accuracy of the model was 0.70, where a 95% confidence interval was between 0.62 and 0.75. Furthermore, the balanced accuracy, which considers the imbalance between classes and is defined as the arithmetic mean of sensitivity (true positive rate) and specificity (false positive rate), was 0.783, 0.796, 0.791, and 0.712, for Cluster 1, Cluster 2, Cluster 3, and Cluster 4, respectively.
3. Results
3.1. Characteristics of the Study Subjects
A total of 200 healthy Caucasian adults (117 females and 83 males) were included in the present study of whom basic characteristics are provided in Table 1. The average age of the participants was 35.4 ± 7.0 years and most of them had a university degree (63.5%). The participants slept on average 7.7 ± 0.8 of nightly hours. Regular cigarette smoking was reported by 27% of them, and the average alcohol consumption was 14.5 ± 13.6 g/day. Regarding obesity parameters, the average BMI was 24.2 ± 3.5 kg/m2, WHR = waist (cm)/hip (cm) was 0.87 ± 0.07, and visceral fat index was 4.7 ± 2.9%. The mean Estimated Energy Requirements (EER) of participants was shown to be 3093 ± 776 kcal, and the estimated daily energy intake was 1892 ± 1000 kcal/day, followed by total fat intake of 32.07 ± 9.96%; 49.05 ± 10.18% of carbohydrates and 18.14 ± 6.48% of proteins. The average amount of consumed fiber was 19.37 ± 13.67 g/day. In the context of the Mediterranean diet, the adherence of most (59%) participants was moderate and for 11% high.

Table 1.
Basic characteristics of the participants included in the study (n = 200).
3.2. Microbiota Composition
To characterize the bacterial microbiota composition, 16S rRNA gene sequencing on collected fecal samples was performed. In the present cohort study, the microbial profiles of 200 individuals were analyzed. The abundances of 8 bacterial phyla (Figure 1A) and 23 genera (Figure 1B) that were found in more than 10% of study participants are presented in Figure 1. Firmicutes, Bacterioidetes, and Proteobacteria phyla were detected in the microbiota of all participants. Firmicutes was the predominant group at the phylum level (71.02 ± 11.45) followed by Bacteroidetes (13.85 ± 10.20), Proteobacteria (3.52 ± 3.33), Actinobacteria (2.80 ± 3.25), and Verrucomicrobia (0.28 ± 2.87). Moreover, Firmicutes was the most dominant phylum in the vast majority of individuals (98%). Regarding taxonomic classification, the most abundant genera also belonged to Firmicutes phyla (Blautia, Faecalibacterium, Ruminococcus, and Clostridium). In addition to this, most of the bacterial population belonged to the Blautia genus (11.79 ± 5.84), followed by Faecalibacterium (8.59 ± 5.09), Bacteroides (7.97 ± 8.05), Ruminococcus (6.51 ± 3.17), and Clostridium (4.79 ± 3.48).
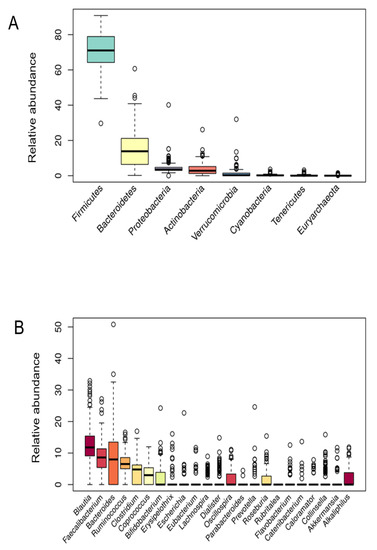
Figure 1.
Bacterial phyla (A) and genera (B) relative abundance.
3.3. Microbiota Cluster Analysis
Hierarchical clustering was performed to analyze the microbiota phyla data set. In the tradeoff between having a higher number of clusters, where better focus is achieved but clusters can contain too few variables, and a lower number of clusters with excessive variations, four clusters were selected. Choosing four clusters also resulted in interpretable results. The numbers of members (study participants) in each cluster were 80, 55, 34, and 31 for C1, C2, C3, and C4, respectively. The hierarchical clustering of microbiota data is presented by a tree diagram (dendrogram) in Figure 2.
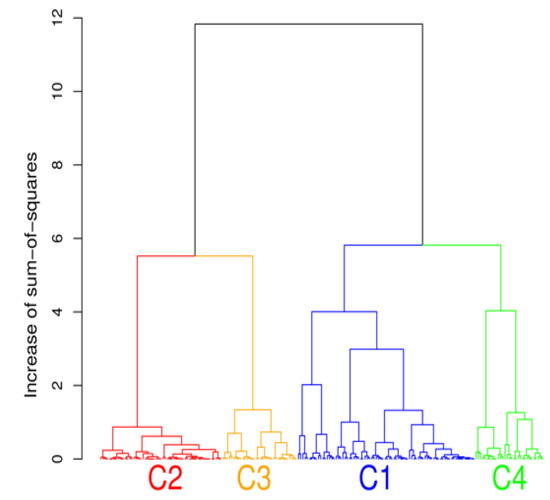
Figure 2.
The cluster analysis showing the presence of four distinct community types of gut bacteria phyla.
3.3.1. Microbial Abundance over Clusters
The cluster analysis suggested the presence of four distinct community types (Figure 2). All statistically significant differences between clusters regarding bacterial phyla and genera are presented in Figure 3; Figure 4. Based on the cluster distribution of phyla (Figure 3), the highest abundance of Firmicutes in the C2 cluster was observed, followed by C3, C4, and C1. Moreover, the C2 cluster has been characterized by a significantly lower abundance of Bacterioidetes, Proteobacteria, and Verrucomicrobia phyla. Among all, the C1 cluster was characterized by the highest proportion of Bacteroidetes and at the same time by the lowest proportion of Firmicutes and Actinobacteria phyla. The C4 cluster has been characterized by the highest proportion of Proteobacteria and Verrucomicrobia. Furthermore, the abundance of Actinobacteria phyla was significantly higher in C3, followed by C2, C4, and C1. Additionally, the C3 cluster was characterized also by a significantly higher proportion of the Bifidobacterium genus (Figure 4) when compared to other clusters C1 (p = 0.041), C2 (p = 0.010), and C4 (p = 0.027).
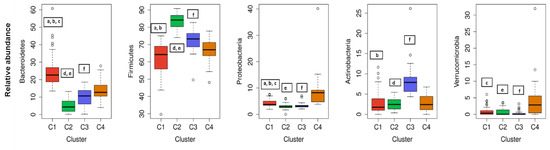
Figure 3.
The cluster distribution of five most abundant bacterial phyla. Relative abundance per cluster of the five most abundant bacteria phyla present in our cohort. Each box shows the median plus interquartile range of the relative abundance of bacterial phyla. Colors show the cluster. Statistical significance differences (p < 0.05) between clusters in each phylum are presented with symbols a, b, c, d, e, and f: a, statistical significance (p < 0.05) between C1 and C2. b, statistical significance (p < 0.05) between C1 and C3. c, statistical significance (p < 0.05) between C1 and C4. d, statistical significance (p < 0.05) between C2 and C3. e, statistical significance (p < 0.05) between C2 and C4. f, statistical significance (p < 0.05) between C3 and C4.
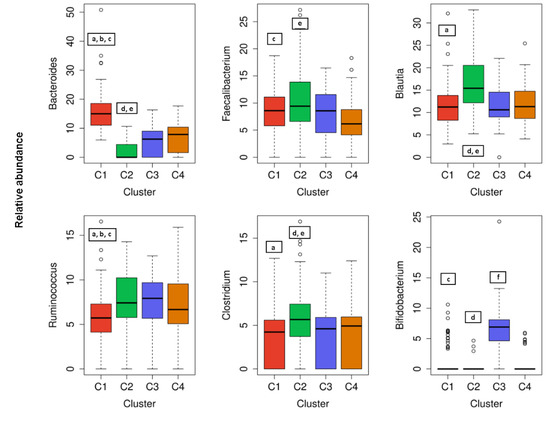
Figure 4.
The cluster distribution of six most abundant bacterial and genera. Relative abundance per cluster of the six most abundant bacteria genera present in our cohort. Each box shows the median plus interquartile range of the relative abundance of bacterial genera. Colors show the cluster. Statistical significance differences (p < 0.05) between clusters in each genus are presented with symbols a, b, c, d, e, and f: a, statistical significance (p < 0.05) between C1 and C2. b, statistical significance (p < 0.05) between C1 and C3. c, statistical significance (p < 0.05) between C1 and C4. d, statistical significance (p < 0.05) between C2 and C3. e, statistical significance (p < 0.05) between C2 and C4. f, statistical significance (p < 0.05) between C3 and C4.
Regarding the most abundant genera of participants gut microbiota, a significantly (p < 0.05) higher proportion of Clostridium and Blautia was observed in C2 than in the C1, C3, and C4 clusters (Figure 4). In addition, a significantly (p < 0.05) higher proportion of Bacteroides, and a significantly lower proportion of Ruminococcus was observed in C1 than in the C2, C3, and C4 clusters (Figure 4). When considering less abundant genera of gut bacteria, there was also a statistically significant higher abundance of the genera as follows: Prevotella in the C1 cluster compared to C3 or C2; Cyanobacteria in the C1 cluster compared to C2 or C4 and Erysipelothrix in the C4 cluster compared to C1, C2, or C3 (data not shown). Nevertheless, a dominant genus can be assigned to an individual cluster as follows: Bacteroides to C1, Blautia and Clostridium to C2, Bifidobacterium to C3, and Erysipelothrix to the C4 cluster.
3.3.2. The Most Important Variables for Classifying Subjects into Clusters
Table 2 lists the top 15 ranked representative variables for each cluster according to the relative model measure of variable importance. The most important variables (top five) for classifying subjects into clusters were measures of obesity (WHR, BMI, and visceral fat index), blood pressure, total body water, energy intake, total fat and olive oil intake, and total fiber intake and total water intake. Total fat intake was shown as the most important variable for classifying subjects into cluster 3; indeed, a score of importance was 91.0 for C3, 68.7 for C2, 64.0 for C1, and 60.5 for C4. The most important predictor with the highest score of importance (88.2) of the C2 cluster was BMI, a known measure of obesity. The BMI was also the second most important predictor for C1 (81.2) and the third for C3 (81.3). Furthermore, total fiber intake gained the highest score of importance (86.1) for classifying subjects into C1 and was the second most important for the C4 cluster. In addition, water intake with the highest score of importance (100) was the most important predictor for classifying subjects into C4. Among the 15 most important variables of the present prediction model were also sleeping hours, age, gender, metabolic age, EER, MEDAS, and dietary intake as follows: vitamins A, B9, and E; protein; saturated fatty acids; monounsaturated fatty acids; olive oil; vegetable fiber; carbohydrate; and milk and milk products intake, respectively (Table 2).
Table 2.
The list of demographical, social, nutritional, and medical predictors of four clusters by relative value of importance.
Moreover, for most of the highly ranged cluster predictors, there were statistically significant differences between clusters (Table 3). According to the most important parameters, there were significant differences in anthropometric parameters between clusters, whereas participants in C2 had significantly higher BMI, WHR, blood pressure, and visceral fat index, especially in comparison to participants in C1 (Table 3). The majority of the participants in C2 were overweight (BMI between 25 to 29.9 kg/m2), and 20% of the participants in C2 had two components of metabolic syndrome. When considering nutritional intake, the higher energy, fat, and saturated fat intake but lower carbohydrates intake were significant for C2 in comparison to subjects in other three clusters (Table 3). However, there were no statistically significant differences in total fiber or olive oil intake between the subjects in C1 and C4, and it was higher for both when compared to subjects in C2 and C3. On the other hand, subjects in C3 had significantly lower fat and saturated fat intake and higher carbohydrates intake in comparison to other clusters. Moreover, subjects in C3 had the highest consumption of milk and milk products (Table 3). Regarding gender, the majority of females can be found in the C1 cluster, whereas C2 was representative for males. The C2 cluster was also represented by the lowest number of average sleeping hours (7.5 ± 0.7). Nevertheless, the youngest participants (32.6 ± 6.1) were clustered in C3.
Table 3.
Differences in the top ten predictors (gender, obesity parameters, energy intake, physical activity, and nutrient intakes) between four clusters.
4. Discussion
Gut microbiota is a diverse consortium of microorganisms that can remarkably influence the wellbeing of the host. Although the adult-like microbiota establishes already in the first six years of a children’s life [30], composition and diversity can be affected by many factors further in life. The studies investigating various demographic, environmental, clinical, and genetic factors in correlation to microbial community diversity, composition, and/or function showed promising results. However, most of the variables were investigated individually not taking into consideration the collateral role of other individual-specific variables that often leads to inconsistent results [20]. Therefore, in this cross-sectional study, an extensive data set of 200 healthy Slovenian individuals was obtained with the aim of elucidating the variables that could predict the allocation of the subjects into clusters according to their gut microbiota composition. Regarding the distribution of major bacterial phyla and genera of healthy Slovene individuals in this study, it was comparable with previous population-based core microbiome studies [17,20,31]. Our data were consistent with Firmicutes and Bacteroidetes phyla covering the vast majority of the dominant human gut bacteria [32] with the relative abundance of Firmicutes 71.02 ± 11.45%, followed by 13.85 ± 10.20% of Bacteroidetes (Figure 1). In the hierarchical clustering of gut microbiota data set, five bacteria phyla with the highest abundance were included. The optimal number of clusters was set by the value four among which there were statistically significant differences in bacterial phyla abundance, and each cluster had a group representative (Figure 3). Namely, Bacteroidetes phylum was the most prevalent in the C1 cluster, Firmicutes in C2, Actinobacteria in C3, and in the C4 cluster Proteobacteria and Verrucomicrobia phyla. As expected, four (4/5) of the most abundant bacteria genera belonged to the Firmicutes, the dominant phylum in the vast majority of individuals (98%). However, representative genera of the individual clusters were Bacteroides and Prevotella in C1, Blautia and Clostridium in C2, Bifidobacterium in C3, and Erysipelothrix in the C4 cluster (Figure 4).
Several non-genetic variables, including demographic, lifestyle and environmental factors were associated with fecal microbiome diversity in healthy individuals [20]. Regarding the relative index as a measure of the variable importance in our SVM model, obesity measures (BMI, WHR, and visceral fat index), blood pressure, total body water, and dietary variables (energy intake, total fat and olive oil intake, total fiber intake, and water intake) were among first five in classifying subjects into clusters (Table 2). A lower abundance of Bacteroidetes with a proportional increase of bacteria belonging to Firmicutes phylum was observed in individuals with obesity [33], confirming our model since all three measures of obesity are significantly higher for subjects in the C2 cluster. Moreover, the differences in Firmicutes/Bacteroidetes ratio, which has great importance in the development of obesity, was shown to be influenced by the grade of obesity [34]. It is clear that our model identified several previously reviewed variables of gut microbiota, including blood pressure. Although only asymptomatic individuals were included in our study, subjects in the C2 cluster had higher blood pressure in comparison to subjects in other clusters (Table 3). In addition, 20% of the subjects in the C2 had two components of the metabolic syndrome (large waist circumference and increased blood pressure). However, only two out of five criteria for metabolic syndrome were measured in this study; fasting glucose and lipids were not assessed. Therefore, it was not possible to determine how many patients met the criteria of metabolic syndrome. Nevertheless, C2 was characterized by a significantly higher Firmicutes/Bacteroidetes (F/B) ratio when compared to other clusters, supporting previous results, e.g., for hypertensive individuals [35]. Moreover, high blood pressure was associated with gut microbiota dysbiosis, both in animal and human hypertension [36].
It is clear that the composition of the human gut microbiota fluctuates in response to the nutritional composition of the diet through life [37,38]. Due to its geographical location, the dietary pattern of most Slovenian people follows the guidelines of the Mediterranean diet. Accordingly, our result showed that most of the participants (59%) had moderate or even high (11%) adherence to the Mediterranean diet. Such dietary pattern consists of a high variety of vegetables and fruits, legumes and whole grains, olive oil as a main source of fat and is coupled with moderate consumption of red wine [39]. Fiber, mono- and poly-unsaturated fatty acids, antioxidants, and polyphenols rich Mediterranean diet has demonstrated beneficial modulation of the gut microbiota in humans as well as in experimental animal models [40]. The last could also be observed on the basis of this study results since the assignment of subjects in clusters is highly predictable by the consumption of dietary parameters characterizing the Mediterranean diet (Table 2). MUFAs such as the oleic acid present in extra virgin olive oil are among the main components of the “Mediterranean diet”. A recent systematic review [41] showed that high-MUFA diets have no effect on richness/diversity indexes, phylum distribution, or Bacteroidetes/Firmicutes ratio. However, at family and genera level, MUFA-rich diets could be positively correlated with Parabacteroides, Prevotella, and Turicibacter genera and Enterobacteriaceae family, and with a lower number of Bifidobacterium genus. In our model, olive oil intake was one of the most important predictors for classifying subjects in C1 and C4, where subjects had significantly higher olive oil intake and also a higher abundance of Prevotella.
By changing eating habits, the alternations in gut microbiota can be observed already after a single day, while the animal-based diet was showed to have a greater impact than the plant-based diet [16]. Correlations between dietary consumption parameters (e.g., fried products, raw fruits, and fish) and gut microbiome have previously been shown in the Milieu intérieur (MI) cohort—a population-based study of 1000 healthy individuals of western European ancestry, evenly stratified by sex and age [42]. Among dietary consumption parameters of the present study, total fat intake was the most important variable for classifying subjects into C3 with a score of importance 91.0, followed by 68.7 for C2, 64.0 for C1, and 60.5 as the C4 cluster predictor. Moreover, several studies described a decrease in Bacteroidetes and an increase in Firmicutes and Proteobacteria phyla in response to high-fat diet (HFD), specifically saturated fatty acids (SFAs) consumption [43]. In accordance, a higher abundance of Firmicutes was observed in C2, where subjects had statistically significant higher (p < 0.05) fat and saturated fat intake when compared to C1, C4, or the C3 cluster (Table 3). Accordingly, there was also a higher proportion of Blautia in C2 as it had already been shown before that high intake of SFAs was positively associated with the abundance of that genus [44]. In accordance with the present results, where a higher abundance of Bifidobacterium and Bacteroides and lower fat intake in C1 and C3 was observed, the same pattern was recognized by a recent systematic review [41] in the case of low fat/high carbohydrate diets in adults at increased risk of metabolic syndrome. The higher intake of total energy and a higher amount of carbohydrates in the diet has also been associated with lower gut microbiota diversity [12]. Furthermore, the growth and activity of preferred bacterial strains that can confer a beneficial physiologic effect on the host can be selectively stimulated by the dietary fiber intake [45,46]. Regarding total fiber intake in this study, subjects in the C1 and C4 cluster were characterized by higher values of fiber intake that was statistically significantly different when compared to C2 or the C3 cluster subjects. Correspondingly, the dominance of Bacteroidetes phylum in C1 was in accordance with previous studies showing an association of fiber and plant-derived polysaccharide-rich diet in children and adults to gut microbiota enriched in Bacteroidetes [16,47].
The C1 was characterized also by a higher abundance of Prevotella compared to C3 and C2, as shown before there was a positive correlation in fiber intake and this bacterial genus levels [48] and reduced during consumption of the animal-based diet [16]. Moreover, the C1 cluster was characterized by the lowest proportion of the Actinobacteria phylum, including low levels of Bifidobacterium genus, also common for populations in which meat and/or dairy consumption is low to absent, such as vegans [49]. On the other hand, the consumption of milk and milk products was significantly higher for subjects in the C3 cluster, which correlates to the highest abundance of Bifidobacterium among clusters. Dairy product consumption has widely been explored and was shown to increase the presence of potentially beneficial bacteria, particularly, Bifidobacterium genus [50]. Among the first five variables with the strongest prediction power, the water intake was also listed and was significantly higher for subjects in C1 and C4 compared to C3 (Table 3). As shown before, quantitative or qualitative changes in habitual water drinking habits can affect the abundance of several bacterial genera, whereas the abundance of Bacteroides could be assigned to higher water consumption [51]. Surprisingly, alcohol consumption and tobacco consumption were not among top-ranked variables. However, this study’s subjects were healthy individuals with the mean age of 35.4 ± 7.0 years, and in principle, most of them were not regular smokers or severe alcohol consumers. Nevertheless, the smokers of the present study clustered almost equally in all clusters (data not shown). Such behaviors or health status are however most often linked to a deviation of gut microbiota composition compared to healthy individuals [52].
For mammalian hosts, vitamins are essential micronutrients obtained from the diet or through the metabolism of commensal GI bacteria. In the present study, vitamins, A, B9, and E intake were found among the first 15 strongest predicting variables of cluster classification (Table 2). All of them were found to be crucial for the classification of subjects into the C3 cluster. Accordingly, in the C3 cluster, represented by a higher abundance of Bifidobacterium genus, subjects with a significantly lower vitamin A intake were classified. As shown by Liu et al. (2017), vitamin A supplementation of children with autism spectrum disorder resulted in significantly decreased Bifidobacterium [53]. Especially for water-soluble vitamins (e.g., vitamin B family and vitamin C), it is important to consume a diet containing the necessary amounts of these vitamins. There was a significantly higher vitamin B9 intake for subjects in C1 and C3 compared to C2 or C4 (Table 3) supporting the research of bacterial richness, and composition differed significantly by the consumption of folate and B vitamin group [54].
Nevertheless, gender, age, and sleeping hours were also among the first 15 most important variables for classification; gender for C1, C2, and C3 clusters but not for C4; age for C3 and C4 clusters; and sleeping hours for C3 cluster (Table 2). Both demographical variables were shown to be correlated not only to microbial composition and diversity but also to functional richness [12]. The differences in gut microbiota between males and females, such as higher levels of Bacteroides–Prevotella group (Bacteroidetes phylum) in males [55] and a higher proportion of Firmicutes in females [34], were shown before. However, due to the inter-individual heterogeneity of subjects, the results of studies describing gender-related differences in gut microbiota have shown to be contradictory. In accordance with Haro et al. (2016), a global pattern of the bacterial community tested by NGS Illumina platform confirmed the lower abundance of Bacteroidetes in females as compared with males when BMI is around 25 kg/m2 [34,56]. However, in the present study a heterogeneous group of lean, overweight, and obese subjects were included, and in the C1 cluster where there was a greater abundance of Bacteroidetes phylum, there was also the highest proportion of females (Figure 3).
Age-related changes of human gut microbiota, characterized by a different abundance of bacteria in various age groups, have been shown [57,58,59]. Moreover, the multivariate unsupervised analysis on genera abundance profile revealed the continuous aging progression of human gut microbiota along with the host aging process [60]. Regardless of the narrow age group of our study, the youngest participants were located in the C3 cluster. The last was represented also by the highest proportion of Actinobacteria phyla, which is in accordance with a previous publication showing substantial decrease of Actinobacteria relative abundance with age [58]. Although the data on the relationship between sleep and gut-microbiome composition are scarce, a recent study found that total microbiome diversity was positively correlated with increased sleep efficiency and total sleep time [61]. As shown by Benedict et al. (2016), increased Firmicutes:Bacteroidetes ratio followed restricted sleep vs. normal sleep [62]. Based on our study results, the increased abundance of Firmicutes was significant for the C2 cluster where participants with the lower average sleeping hours were clustered.
According to other authors’ results [34,56], there are several factors that need to be taken into consideration simultaneously when looking for variables linked to gut microbiota composition. Therefore, our model shows a promising result while healthy individuals can be clustered on the basis of gut microbiota composition, thus indicating different strong predictor parameters including demographics, anthropometrics, lifestyle (especially dietary intake), and socio-economic status. As the most prevalent predictors of all described clusters, measures of obesity (BMI, WHR, and visceral fat index) and blood pressure were observed. As diet stands for one of the modifiable risk factors for many non-communicable diseases, there is a high level of evidence supporting the efficacy of dietary interventions for both influencing disease risk and improving disease outcomes. Nevertheless, there is still an open window for studying micronutrition intake on gut microbiota that could have a potential clinical/therapeutic implication in different non-communicable diseases.
5. Conclusions
The SVM model presented in this study was shown as a valuable tool to classify healthy individuals based on their gut microbiota composition. Moreover, classification can be performed by lifestyle parameters, such as measures of obesity and dietary consumption habits. Using a large data set, this model could help us to predict the gut microbiota composition of a healthy individual. However, there is a need for additional research work to investigate the accuracy of the presented model in predicting gut microbiota of the most abundant genera and phyla on a larger group of healthy individuals.
Supplementary Materials
The following are available online at https://www.mdpi.com/2072-6643/12/9/2695/s1. Table S1: Data with relative abundances of phyla and genera of 200 subjects that were included in the present study. Table S2: Description of variables used for classification challenges in Support Vector Machine model.
Author Contributions
Conceptualization, A.P., E.N., A.M., and Z.J.P.; methodology, K.B., A.P., J.P., E.N., N.R., and Z.J.P.; software, J.P.; validation, J.P.; formal analysis, K.B. and J.P., and Z.J.P.; investigation, K.B., A.P., E.N., N.R., and Z.J.P.; resources, K.B. and A.M.; data curation, K.B., A.P., J.P., N.R., and Z.J.P.; writing—original draft preparation, K.B. and Z.J.P.; writing—review and editing, A.P., J.P., E.N., N.R., A.M., and Z.J.P.; visualization, J.P.; supervision, E.N., A.M., and Z.J.P.; project administration, A.P., N.R., and A.M.; funding acquisition, A.P., E.N., A.M., and Z.J.P. All authors have read and agreed to the published version of the manuscript.
Funding
The study was supported by the European foundation for alcohol research through a Spanish Slovenian bilateral project (ERAB EA. 14.44). This work was also supported by the Slovenian Research Agency (Programme P1-0386).
Acknowledgments
The authors would like to thank all the participants for volunteering in this study.
Conflicts of Interest
All the authors of this manuscript state that there are not financial and personal relationships with other people or organizations that could inappropriately influence (bias) our work.
References
- Hillman, E.T.; Lu, H.; Yao, T.; Nakatsu, C.H. Microbial Ecology along the Gastrointestinal Tract. Microbes Environ. 2017, 32, 300–313. [Google Scholar] [CrossRef]
- Sekirov, I.; Russell, S.L.; Antunes, L.C.M.; Finlay, B.B. Gut microbiota in health and disease. Physiol. Rev. 2010, 90, 859–904. [Google Scholar] [CrossRef] [PubMed]
- Shi, N.; Li, N.; Duan, X.; Niu, H. Interaction between the gut microbiome and mucosal immune system. Mil. Med. Res. 2017, 4, 14. [Google Scholar] [CrossRef] [PubMed]
- Wells, J.M.; Brummer, R.J.; Derrien, M.; MacDonald, T.T.; Troost, F.; Cani, P.D.; Theodorou, V.; Dekker, J.; Méheust, A.; de Vos, W.M.; et al. Homeostasis of the gut barrier and potential biomarkers. Am. J. Physiol. Gastrointest. Liver Physiol. 2016, 312, G171–G193. [Google Scholar] [CrossRef] [PubMed]
- Khosravi, A.; Mazmanian, S.K. Disruption of the gut microbiome as a risk factor for microbial infections. Curr. Opin. Microbiol. 2013, 16, 221–227. [Google Scholar] [CrossRef] [PubMed]
- Martin, A.M.; Sun, E.W.; Rogers, G.B.; Keating, D.J. The Influence of the Gut Microbiome on Host Metabolism through the Regulation of Gut Hormone Release. Front. Physiol. 2019, 10. [Google Scholar] [CrossRef] [PubMed]
- Brown, K.; DeCoffe, D.; Molcan, E.; Gibson, D.L. Diet-Induced Dysbiosis of the Intestinal Microbiota and the Effects on Immunity and Disease. Nutrients 2012, 4, 1095–1119. [Google Scholar] [CrossRef]
- Arora, T.; Bäckhed, F. The gut microbiota and metabolic disease: Current understanding and future perspectives. J. Intern. Med. 2016, 280, 339–349. [Google Scholar] [CrossRef]
- Grochowska, M.; Laskus, T.; Radkowski, M. Gut Microbiota in Neurological Disorders. Arch. Immunol. Ther. Exp. 2019, 67, 375–383. [Google Scholar] [CrossRef]
- Arumugam, M.; Raes, J.; Pelletier, E.; Le Paslier, D.; Yamada, T.; Mende, D.R.; Fernandes, G.R.; Tap, J.; Bruls, T.; Batto, J.-M.; et al. Enterotypes of the human gut microbiome. Nature 2011, 473, 174–180. [Google Scholar] [CrossRef]
- Rinninella, E.; Raoul, P.; Cintoni, M.; Franceschi, F.; Miggiano, G.A.D.; Gasbarrini, A.; Mele, M.C. What is the Healthy Gut Microbiota Composition? A Changing Ecosystem across Age, Environment, Diet, and Diseases. Microorganisms 2019, 7, 14. [Google Scholar] [CrossRef] [PubMed]
- Rothschild, D.; Weissbrod, O.; Barkan, E.; Kurilshikov, A.; Korem, T.; Zeevi, D.; Costea, P.I.; Godneva, A.; Kalka, I.N.; Bar, N.; et al. Environment dominates over host genetics in shaping human gut microbiota. Nature 2018, 555, 210–215. [Google Scholar] [CrossRef] [PubMed]
- Castaño-Rodríguez, N.; Underwood, A.P.; Merif, J.; Riordan, S.M.; Rawlinson, W.D.; Mitchell, H.M.; Kaakoush, N.O. Gut Microbiome Analysis Identifies Potential Etiological Factors in Acute Gastroenteritis. Infect. Immun. 2018, 86. [Google Scholar] [CrossRef] [PubMed]
- Ley, R.E.; Turnbaugh, P.J.; Klein, S.; Gordon, J.I. Human gut microbes associated with obesity. Nature 2006, 444, 1022–1023. [Google Scholar] [CrossRef]
- Turnbaugh, P.J.; Hamady, M.; Yatsunenko, T.; Cantarel, B.L.; Duncan, A.; Ley, R.E.; Sogin, M.L.; Jones, W.J.; Roe, B.A.; Affourtit, J.P.; et al. A core gut microbiome in obese and lean twins. Nature 2009, 457, 480–484. [Google Scholar] [CrossRef]
- David, L.A.; Maurice, C.F.; Carmody, R.N.; Gootenberg, D.B.; Button, J.E.; Wolfe, B.E.; Ling, A.V.; Devlin, A.S.; Varma, Y.; Fischbach, M.A.; et al. Diet rapidly and reproducibly alters the human gut microbiome. Nature 2014, 505, 559–563. [Google Scholar] [CrossRef]
- Garcia-Mantrana, I.; Selma-Royo, M.; Alcantara, C.; Collado, M.C. Shifts on Gut Microbiota Associated to Mediterranean Diet Adherence and Specific Dietary Intakes on General Adult Population. Front. Microbiol. 2018, 9, 890. [Google Scholar] [CrossRef]
- Jackson, M.A.; Verdi, S.; Maxan, M.-E.; Shin, C.M.; Zierer, J.; Bowyer, R.C.E.; Martin, T.; Williams, F.M.K.; Menni, C.; Bell, J.T.; et al. Gut microbiota associations with common diseases and prescription medications in a population-based cohort. Nat. Commun. 2018, 9, 1–8. [Google Scholar] [CrossRef]
- Zhernakova, A.; Kurilshikov, A.; Bonder, M.J.; Tigchelaar, E.F.; Schirmer, M.; Vatanen, T.; Mujagic, Z.; Vila, A.V.; Falony, G.; Vieira-Silva, S.; et al. Population-based metagenomics analysis reveals markers for gut microbiome composition and diversity. Science 2016, 352, 565–569. [Google Scholar] [CrossRef]
- Scepanovic, P.; Hodel, F.; Mondot, S.; Partula, V.; Byrd, A.; Hammer, C.; Alanio, C.; Bergstedt, J.; Patin, E.; Touvier, M.; et al. A comprehensive assessment of demographic, environmental, and host genetic associations with gut microbiome diversity in healthy individuals. Microbiome 2019, 7, 130. [Google Scholar] [CrossRef] [PubMed]
- Statnikov, A.; Henaff, M.; Narendra, V.; Konganti, K.; Li, Z.; Yang, L.; Pei, Z.; Blaser, M.J.; Aliferis, C.F.; Alekseyenko, A.V. A comprehensive evaluation of multicategory classification methods for microbiomic data. Microbiome 2013, 1, 11. [Google Scholar] [CrossRef] [PubMed]
- Bizjak, M.; Jenko-Pražnikar, Z.; Koroušić Seljak, B. Development and validation of an electronic FFQ to assess food intake in the Slovene population. Public Health Nutr. 2014, 17, 1729–1737. [Google Scholar] [CrossRef] [PubMed]
- Martínez-González, M.A.; García-Arellano, A.; Toledo, E.; Salas-Salvadó, J.; Buil-Cosiales, P.; Corella, D.; Covas, M.I.; Schröder, H.; Arós, F.; Gómez-Gracia, E.; et al. A 14-Item Mediterranean Diet Assessment Tool and Obesity Indexes among High-Risk Subjects: The PREDIMED Trial. PLoS ONE 2012, 7, e43134. [Google Scholar] [CrossRef]
- Sánchez-Villegas, A.; De Irala, J.; Martínez-González, M.A. Research team of the SUN (University of Navarre Follow-Up Study) project [The Mediterranean diet and cardiovascular disease: Results of a pilot study from the SUN project (University of Navarre Follow-Up Study)]. Rev. Med. Univ. Navar. 2002, 46, 9–16. [Google Scholar]
- Martínez-Gómez, D.; Eisenmann, J.C.; Gómez-Martínez, S.; Veses, A.; Marcos, A.; Veiga, O.L. Sedentarismo, adiposidad y factores de riesgo cardiovascular en adolescentes. Estudio AFINOS. Rev. Esp. Cardiol. 2010, 63, 277–285. [Google Scholar] [CrossRef]
- Veiga, O.L.; Gómez-Martínez, S.; Martínez-Gómez, D.; Villagra, A.; Calle, M.E.; Marcos, A. AFINOS Study Group Physical activity as a preventive measure against overweight, obesity, infections, allergies and cardiovascular disease risk factors in adolescents: AFINOS Study protocol. BMC Public Health 2009, 9, 475. [Google Scholar] [CrossRef]
- Redondo-Useros, N.; Gheorghe, A.; Díaz-Prieto, L.E.; Villavisencio, B.; Marcos, A.; Nova, E. Associations of Probiotic Fermented Milk (PFM) and Yogurt Consumption with Bifidobacterium and Lactobacillus Components of the Gut Microbiota in Healthy Adults. Nutrients 2019, 11, 651. [Google Scholar] [CrossRef] [PubMed]
- Santiago, A.; Panda, S.; Mengels, G.; Martinez, X.; Azpiroz, F.; Dore, J.; Guarner, F.; Manichanh, C. Processing faecal samples: A step forward for standards in microbial community analysis. BMC Microbiol. 2014, 14, 112. [Google Scholar] [CrossRef]
- Illumina Read Classification. Available online: https://support.illumina.com/help/BaseSpace_App_16S_Metagenomics_help/16S_Metagenomics_App_Help.htm#Vault/Informatics/Sequencing_Analysis/Apps/swSEQ_mAPP_16S_Read_Classification.htm%3FToc (accessed on 20 August 2020).
- Zhong, H.; Penders, J.; Shi, Z.; Ren, H.; Cai, K.; Fang, C.; Ding, Q.; Thijs, C.; Blaak, E.E.; Stehouwer, C.D.A.; et al. Impact of early events and lifestyle on the gut microbiota and metabolic phenotypes in young school-age children. Microbiome 2019, 7, 2. [Google Scholar] [CrossRef]
- Falony, G.; Joossens, M.; Vieira-Silva, S.; Wang, J.; Darzi, Y.; Faust, K.; Kurilshikov, A.; Bonder, M.J.; Valles-Colomer, M.; Vandeputte, D.; et al. Population-level analysis of gut microbiome variation. Science 2016, 352, 560–564. [Google Scholar] [CrossRef]
- Zoetendal, E.G.; Rajilić-Stojanović, M.; Vos, W.M. de High-throughput diversity and functionality analysis of the gastrointestinal tract microbiota. Gut 2008, 57, 1605–1615. [Google Scholar] [CrossRef] [PubMed]
- Koliada, A.; Syzenko, G.; Moseiko, V.; Budovska, L.; Puchkov, K.; Perederiy, V.; Gavalko, Y.; Dorofeyev, A.; Romanenko, M.; Tkach, S.; et al. Association between body mass index and Firmicutes/Bacteroidetes ratio in an adult Ukrainian population. BMC Microbiol. 2017, 17. [Google Scholar] [CrossRef] [PubMed]
- Haro, C.; Rangel-Zúñiga, O.A.; Alcalá-Díaz, J.F.; Gómez-Delgado, F.; Pérez-Martínez, P.; Delgado-Lista, J.; Quintana-Navarro, G.M.; Landa, B.B.; Navas-Cortés, J.A.; Tena-Sempere, M.; et al. Intestinal Microbiota Is Influenced by Gender and Body Mass Index. PLoS ONE 2016, 11. [Google Scholar] [CrossRef] [PubMed]
- Silveira-Nunes, G.; Durso, D.F.; de Oliveira, L.R.A., Jr.; Cunha, E.H.M.; Maioli, T.U.; Vieira, A.T.; Speziali, E.; Corrêa-Oliveira, R.; Martins-Filho, O.A.; Teixeira-Carvalho, A.; et al. Hypertension Is Associated With Intestinal Microbiota Dysbiosis and Inflammation in a Brazilian Population. Front. Pharmacol. 2020, 11. [Google Scholar] [CrossRef]
- Yang, T.; Santisteban, M.M.; Rodriguez, V.; Li, E.; Ahmari, N.; Carvajal, J.M.; Zadeh, M.; Gong, M.; Qi, Y.; Zubcevic, J.; et al. Gut microbiota dysbiosis is linked to hypertension. Hypertension 2015, 65, 1331–1340. [Google Scholar] [CrossRef] [PubMed]
- Chung, H.-J.; Nguyen, T.T.B.; Kim, H.-J.; Hong, S.-T. Gut Microbiota as a Missing Link Between Nutrients and Traits of Human. Front. Microbiol. 2018, 9. [Google Scholar] [CrossRef] [PubMed]
- Graf, D.; Di Cagno, R.; Fåk, F.; Flint, H.J.; Nyman, M.; Saarela, M.; Watzl, B. Contribution of diet to the composition of the human gut microbiota. Microb. Ecol. Health Dis. 2015, 26, 26164. [Google Scholar] [CrossRef]
- Martínez-González, M.Á.; Hershey, M.S.; Zazpe, I.; Trichopoulou, A. Transferability of the Mediterranean Diet to Non-Mediterranean Countries. What Is and What Is Not the Mediterranean Diet. Nutrients 2017, 9, 1226. [Google Scholar] [CrossRef]
- Nagpal, R.; Shively, C.A.; Register, T.C.; Craft, S.; Yadav, H. Gut microbiome-Mediterranean diet interactions in improving host health. F1000Res 2019, 8, 699. [Google Scholar] [CrossRef]
- Wolters, M.; Ahrens, J.; Romaní-Pérez, M.; Watkins, C.; Sanz, Y.; Benítez-Páez, A.; Stanton, C.; Günther, K. Dietary fat, the gut microbiota, and metabolic health—A systematic review conducted within the MyNewGut project. Clin. Nutr. 2019, 38, 2504–2520. [Google Scholar] [CrossRef]
- Partula, V.; Mondot, S.; Torres, M.J.; Kesse-Guyot, E.; Deschasaux, M.; Assmann, K.; Latino-Martel, P.; Buscail, C.; Julia, C.; Galan, P.; et al. Associations between usual diet and gut microbiota composition: Results from the Milieu Intérieur cross-sectional study. Am. J. Clin. Nutr. 2019, 109, 1472–1483. [Google Scholar] [CrossRef]
- Wu, G.D.; Chen, J.; Hoffmann, C.; Bittinger, K.; Chen, Y.-Y.; Keilbaugh, S.A.; Bewtra, M.; Knights, D.; Walters, W.A.; Knight, R.; et al. Linking long-term dietary patterns with gut microbial enterotypes. Science 2011, 334, 105–108. [Google Scholar] [CrossRef]
- Watson, H.; Mitra, S.; Croden, F.C.; Taylor, M.; Wood, H.M.; Perry, S.L.; Spencer, J.A.; Quirke, P.; Toogood, G.J.; Lawton, C.L.; et al. A randomised trial of the effect of omega-3 polyunsaturated fatty acid supplements on the human intestinal microbiota. Gut 2018, 67, 1974–1983. [Google Scholar] [CrossRef] [PubMed]
- Bindels, L.B.; Delzenne, N.M.; Cani, P.D.; Walter, J. Towards a more comprehensive concept for prebiotics. Nat. Rev. Gastroenterol. Hepatol. 2015, 12, 303–310. [Google Scholar] [CrossRef] [PubMed]
- Carlson, J.L.; Erickson, J.M.; Lloyd, B.B.; Slavin, J.L. Health Effects and Sources of Prebiotic Dietary Fiber. Curr. Dev. Nutr. 2018, 2. [Google Scholar] [CrossRef] [PubMed]
- Yatsunenko, T.; Rey, F.E.; Manary, M.J.; Trehan, I.; Dominguez-Bello, M.G.; Contreras, M.; Magris, M.; Hidalgo, G.; Baldassano, R.N.; Anokhin, A.P.; et al. Human gut microbiome viewed across age and geography. Nature 2012, 486, 222–227. [Google Scholar] [CrossRef]
- De Filippo, C.; Cavalieri, D.; Di Paola, M.; Ramazzotti, M.; Poullet, J.B.; Massart, S.; Collini, S.; Pieraccini, G.; Lionetti, P. Impact of diet in shaping gut microbiota revealed by a comparative study in children from Europe and rural Africa. Proc. Natl. Acad. Sci. USA 2010, 107, 14691–14696. [Google Scholar] [CrossRef]
- Zimmer, J.; Lange, B.; Frick, J.-S.; Sauer, H.; Zimmermann, K.; Schwiertz, A.; Rusch, K.; Klosterhalfen, S.; Enck, P. A vegan or vegetarian diet substantially alters the human colonic faecal microbiota. Eur. J. Clin. Nutr. 2012, 66, 53–60. [Google Scholar] [CrossRef]
- Volokh, O.; Klimenko, N.; Berezhnaya, Y.; Tyakht, A.; Nesterova, P.; Popenko, A.; Alexeev, D. Human Gut Microbiome Response Induced by Fermented Dairy Product Intake in Healthy Volunteers. Nutrients 2019, 11, 547. [Google Scholar] [CrossRef]
- Hansen, T.H.; Thomassen, M.T.; Madsen, M.L.; Kern, T.; Bak, E.G.; Kashani, A.; Allin, K.H.; Hansen, T.; Pedersen, O. The effect of drinking water pH on the human gut microbiota and glucose regulation: Results of a randomized controlled cross-over intervention. Sci. Rep. 2018, 8, 1–12. [Google Scholar] [CrossRef]
- Engen, P.A.; Green, S.J.; Voigt, R.M.; Forsyth, C.B.; Keshavarzian, A. The Gastrointestinal Microbiome: Alcohol Effects on the Composition of Intestinal Microbiota. Alcohol. Res. 2015, 37, 223–236. [Google Scholar] [PubMed]
- Liu, J.; Liu, X.; Xiong, X.-Q.; Yang, T.; Cui, T.; Hou, N.-L.; Lai, X.; Liu, S.; Guo, M.; Liang, X.-H.; et al. Effect of vitamin A supplementation on gut microbiota in children with autism spectrum disorders—A pilot study. BMC Microbiol. 2017, 17. [Google Scholar] [CrossRef] [PubMed]
- Gurwara, S.; Ajami, N.J.; Jang, A.; Hessel, F.C.; Chen, L.; Plew, S.; Wang, Z.; Graham, D.Y.; Hair, C.; White, D.L.; et al. Dietary Nutrients Involved in One-Carbon Metabolism and Colonic Mucosa-Associated Gut Microbiome in Individuals with an Endoscopically Normal Colon. Nutrients 2019, 11, 613. [Google Scholar] [CrossRef] [PubMed]
- Mueller, S.; Saunier, K.; Hanisch, C.; Norin, E.; Alm, L.; Midtvedt, T.; Cresci, A.; Silvi, S.; Orpianesi, C.; Verdenelli, M.C.; et al. Differences in Fecal Microbiota in Different European Study Populations in Relation to Age, Gender, and Country: A Cross-Sectional Study. Appl. Environ. Microbiol. 2006, 72, 1027–1033. [Google Scholar] [CrossRef]
- Dominianni, C.; Sinha, R.; Goedert, J.J.; Pei, Z.; Yang, L.; Hayes, R.B.; Ahn, J. Sex, body mass index, and dietary fiber intake influence the human gut microbiome. PLoS ONE 2015, 10, e0124599. [Google Scholar] [CrossRef]
- Salazar, N.; Arboleya, S.; Fernández-Navarro, T.; de los Reyes-Gavilán, C.G.; Gonzalez, S.; Gueimonde, M. Age-Associated Changes in Gut Microbiota and Dietary Components Related with the Immune System in Adulthood and Old Age: A Cross-Sectional Study. Nutrients 2019, 11, 1765. [Google Scholar] [CrossRef]
- Odamaki, T.; Kato, K.; Sugahara, H.; Hashikura, N.; Takahashi, S.; Xiao, J.; Abe, F.; Osawa, R. Age-related changes in gut microbiota composition from newborn to centenarian: A cross-sectional study. BMC Microbiol. 2016, 16. [Google Scholar] [CrossRef]
- Lan, Y.; Kriete, A.; Rosen, G.L. Selecting age-related functional characteristics in the human gut microbiome. Microbiome 2013, 1, 2. [Google Scholar] [CrossRef]
- Xu, C.; Zhu, H.; Qiu, P. Aging progression of human gut microbiota. BMC Microbiol. 2019, 19, 236. [Google Scholar] [CrossRef]
- Smith, R.P.; Easson, C.; Lyle, S.M.; Kapoor, R.; Donnelly, C.P.; Davidson, E.J.; Parikh, E.; Lopez, J.V.; Tartar, J.L. Gut microbiome diversity is associated with sleep physiology in humans. PLoS ONE 2019, 14, e0222394. [Google Scholar] [CrossRef]
- Benedict, C.; Vogel, H.; Jonas, W.; Woting, A.; Blaut, M.; Schürmann, A.; Cedernaes, J. Gut microbiota and glucometabolic alterations in response to recurrent partial sleep deprivation in normal-weight young individuals. Mol. Metab. 2016, 5, 1175–1186. [Google Scholar] [CrossRef] [PubMed]
© 2020 by the authors. Licensee MDPI, Basel, Switzerland. This article is an open access article distributed under the terms and conditions of the Creative Commons Attribution (CC BY) license (http://creativecommons.org/licenses/by/4.0/).