Chronic Ketogenic Low Carbohydrate High Fat Diet Has Minimal Effects on Acid–Base Status in Elite Athletes


 and
and
Abstract
:1. Introduction
2. Materials and Methods
2.1. Participants
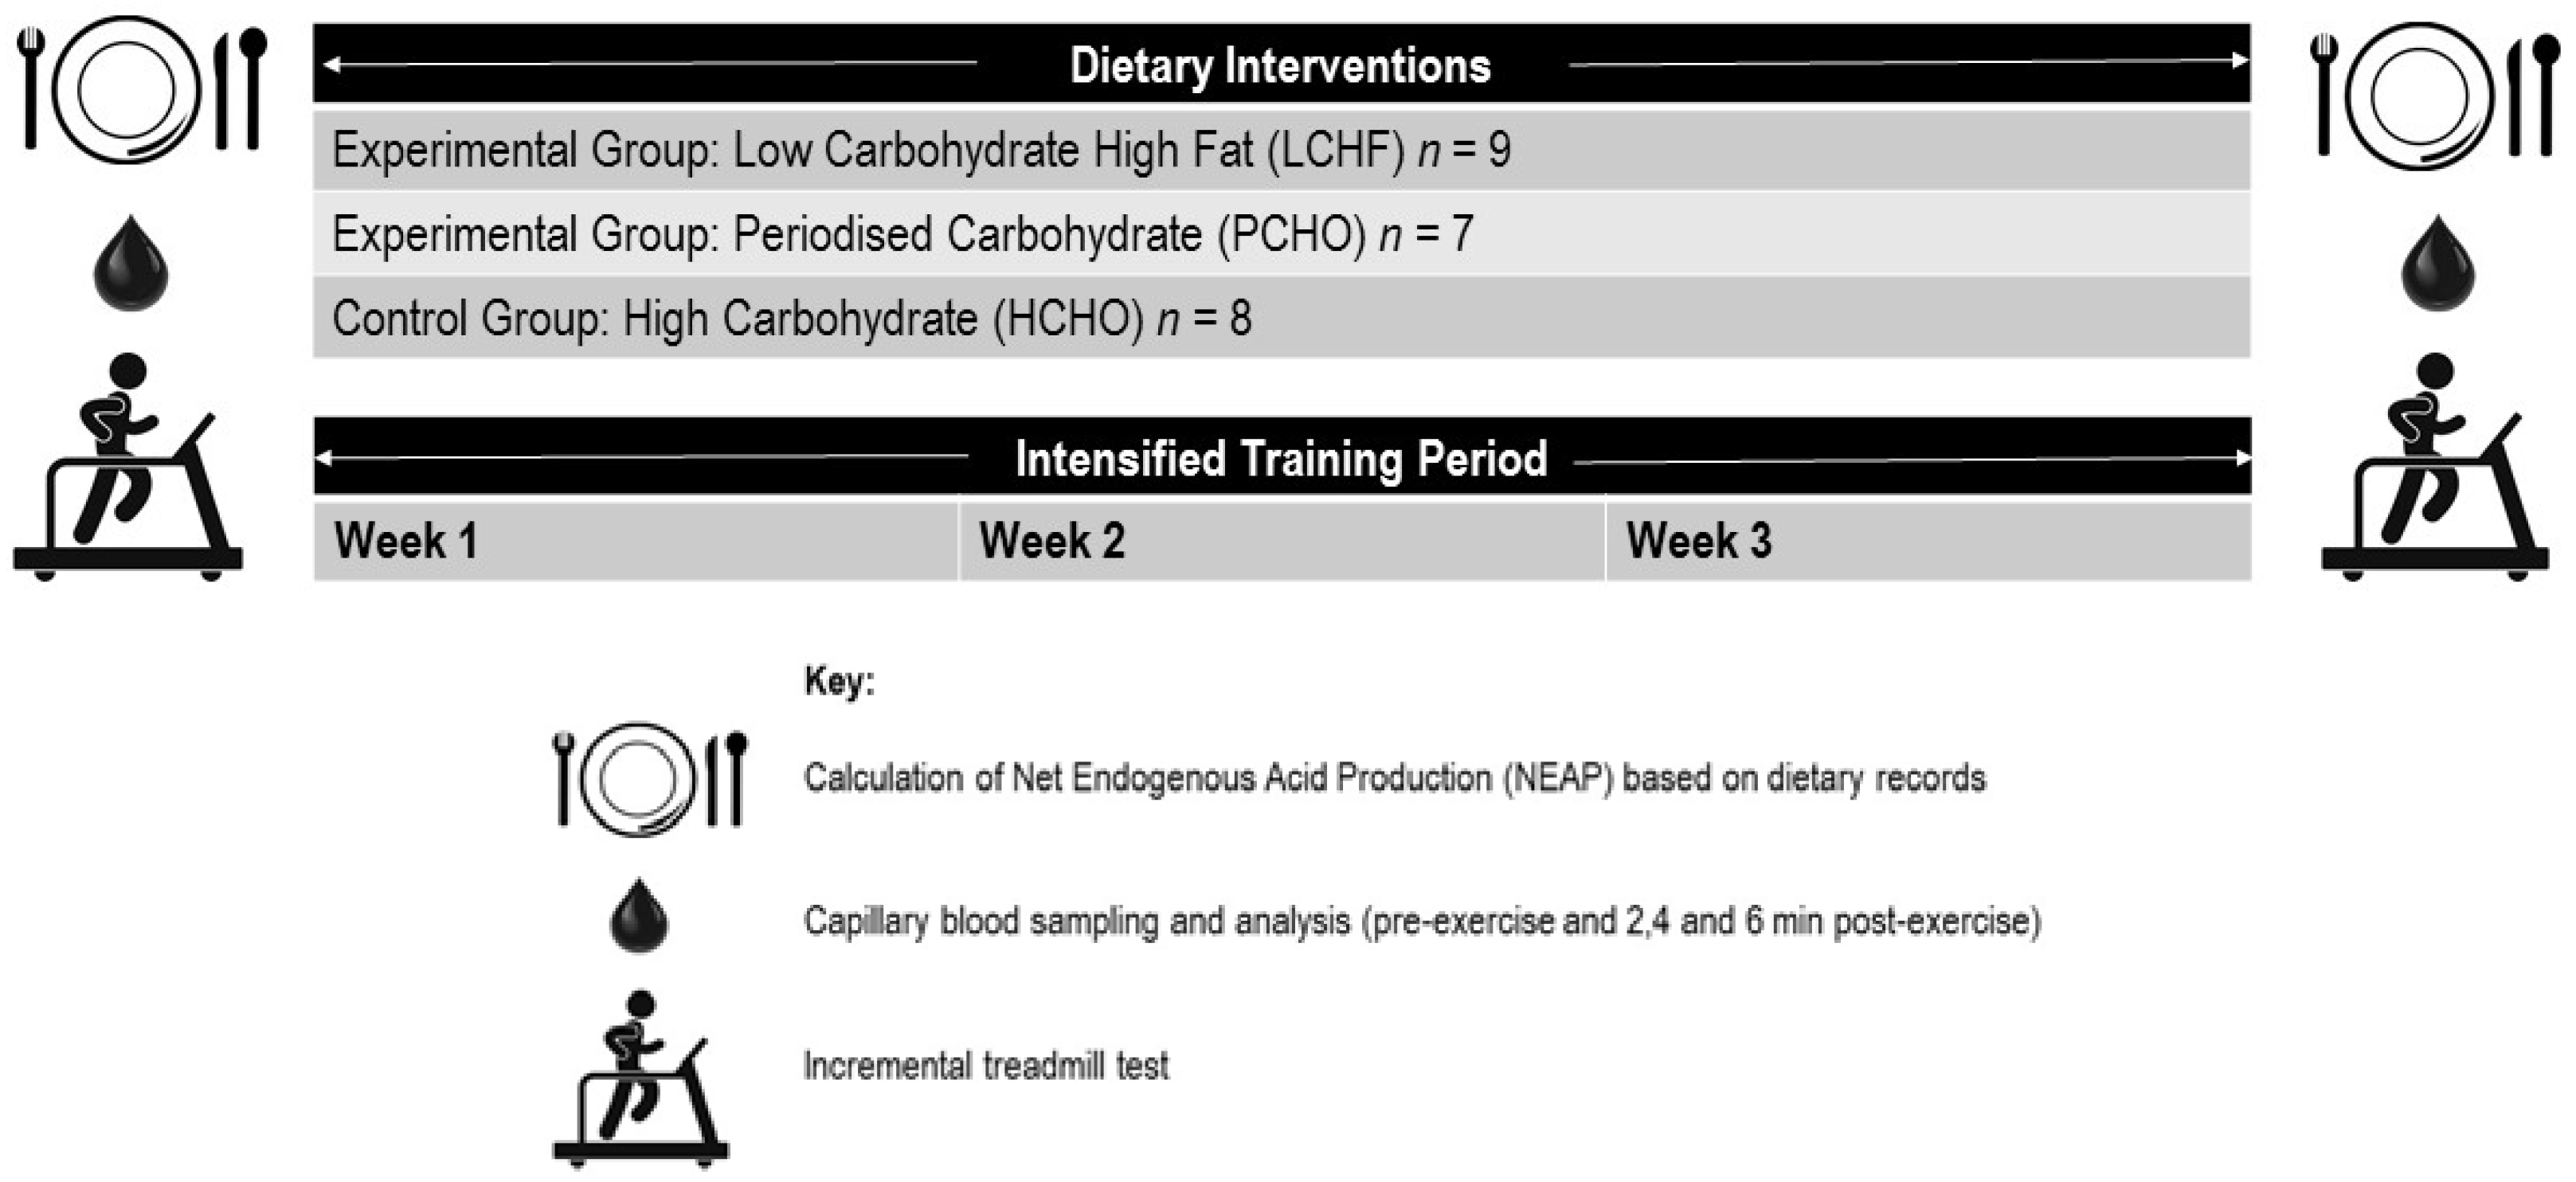
2.2. Training Intervention
2.3. Dietary Intervention
- -
- HCHO: traditional sports nutrition guidelines promoting high carbohydrate availability for all training sessions: CHO: ~8 g·kg−1 BM, 60–65% energy intake; protein: ~1.8 g·kg−1·day−1 15–20% energy; fat: ~20% energy intake [10].
- -
- -
2.4. Exercise Testing
2.5. NEAP Calculations
- Estimated NEAP (mEq·day−1) = (0.91 × protein (g·day−1)) − (0.57 × potassium (mEq·day−1)) + 21 [26] (NEAPF1).
- Estimated NEAP (mEq·day−1) = (54.5 × protein (g·day−1)/potassium (mEq·day−1)) − 10.2 [26] (NEAPF2).
- Estimated NEAP (mEq·day−1) = Potential Renal Acid Load (PRAL) (mEq·day−1) + Estimated Urinary Organic Anions (OAest) [38]. Within Equation (3), PRAL is calculated as: (mEq·day−1) = 0.488 × protein (g·day−1) + 0.037 × phosphorous (mg·day−1) − 0.021 × potassium (mg·day−1) – 0.026 × magnesium (mg·day−1) – 0.013 × calcium (mg·day−1), whereby: OAest (mEq·day−1) = (0.007184 × height0.725 × mass0.425) × (41/1.73) (NEAPR) [27].
2.6. Statistical Analysis
3. Results
3.1. Participants
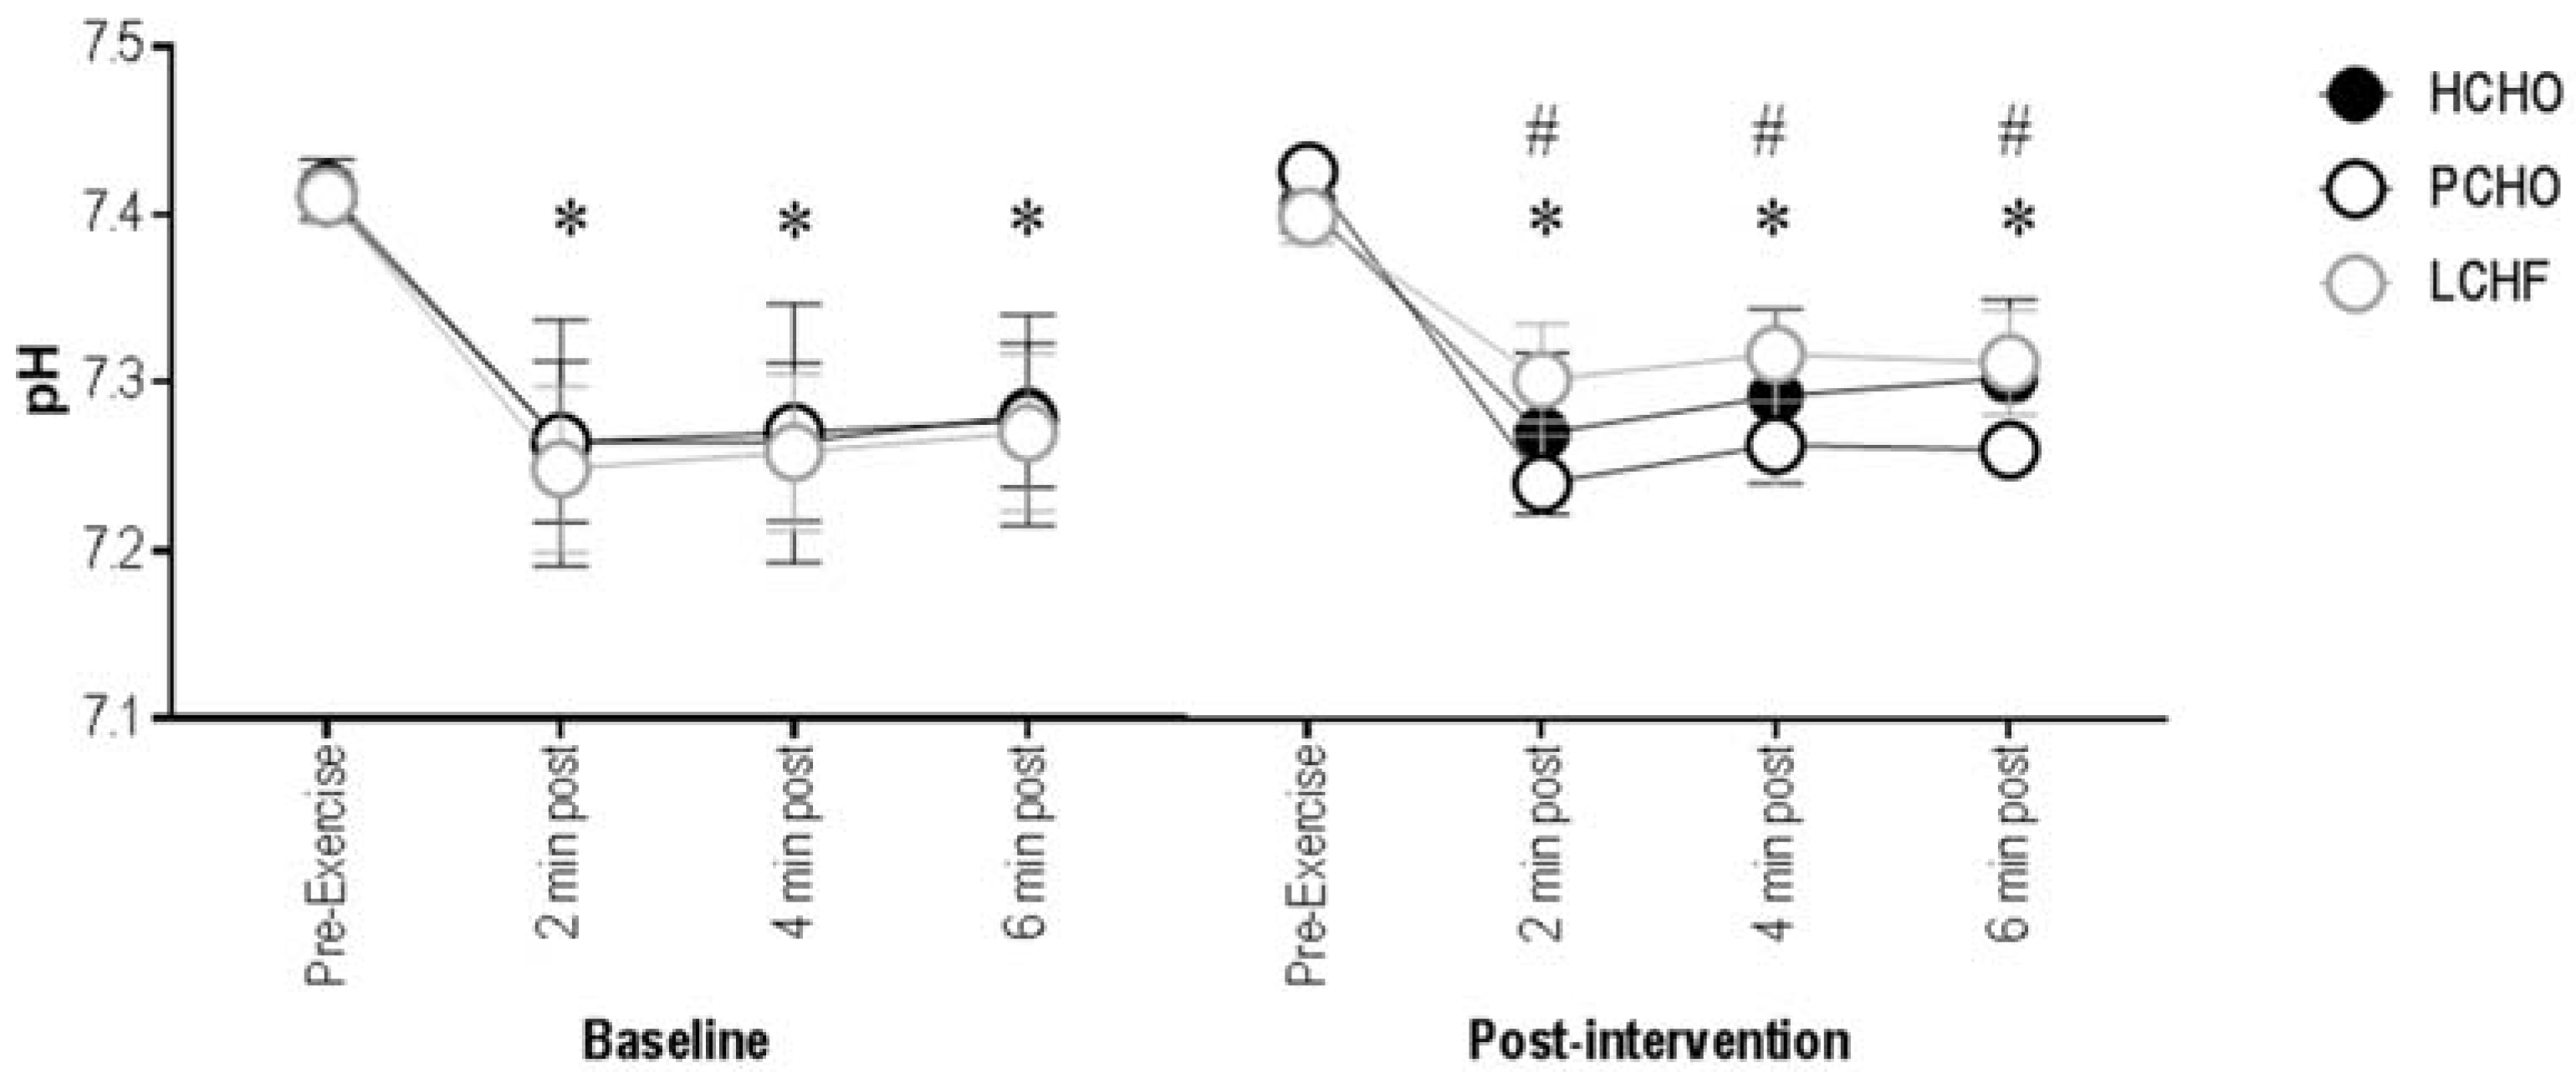
3.2. Blood pH
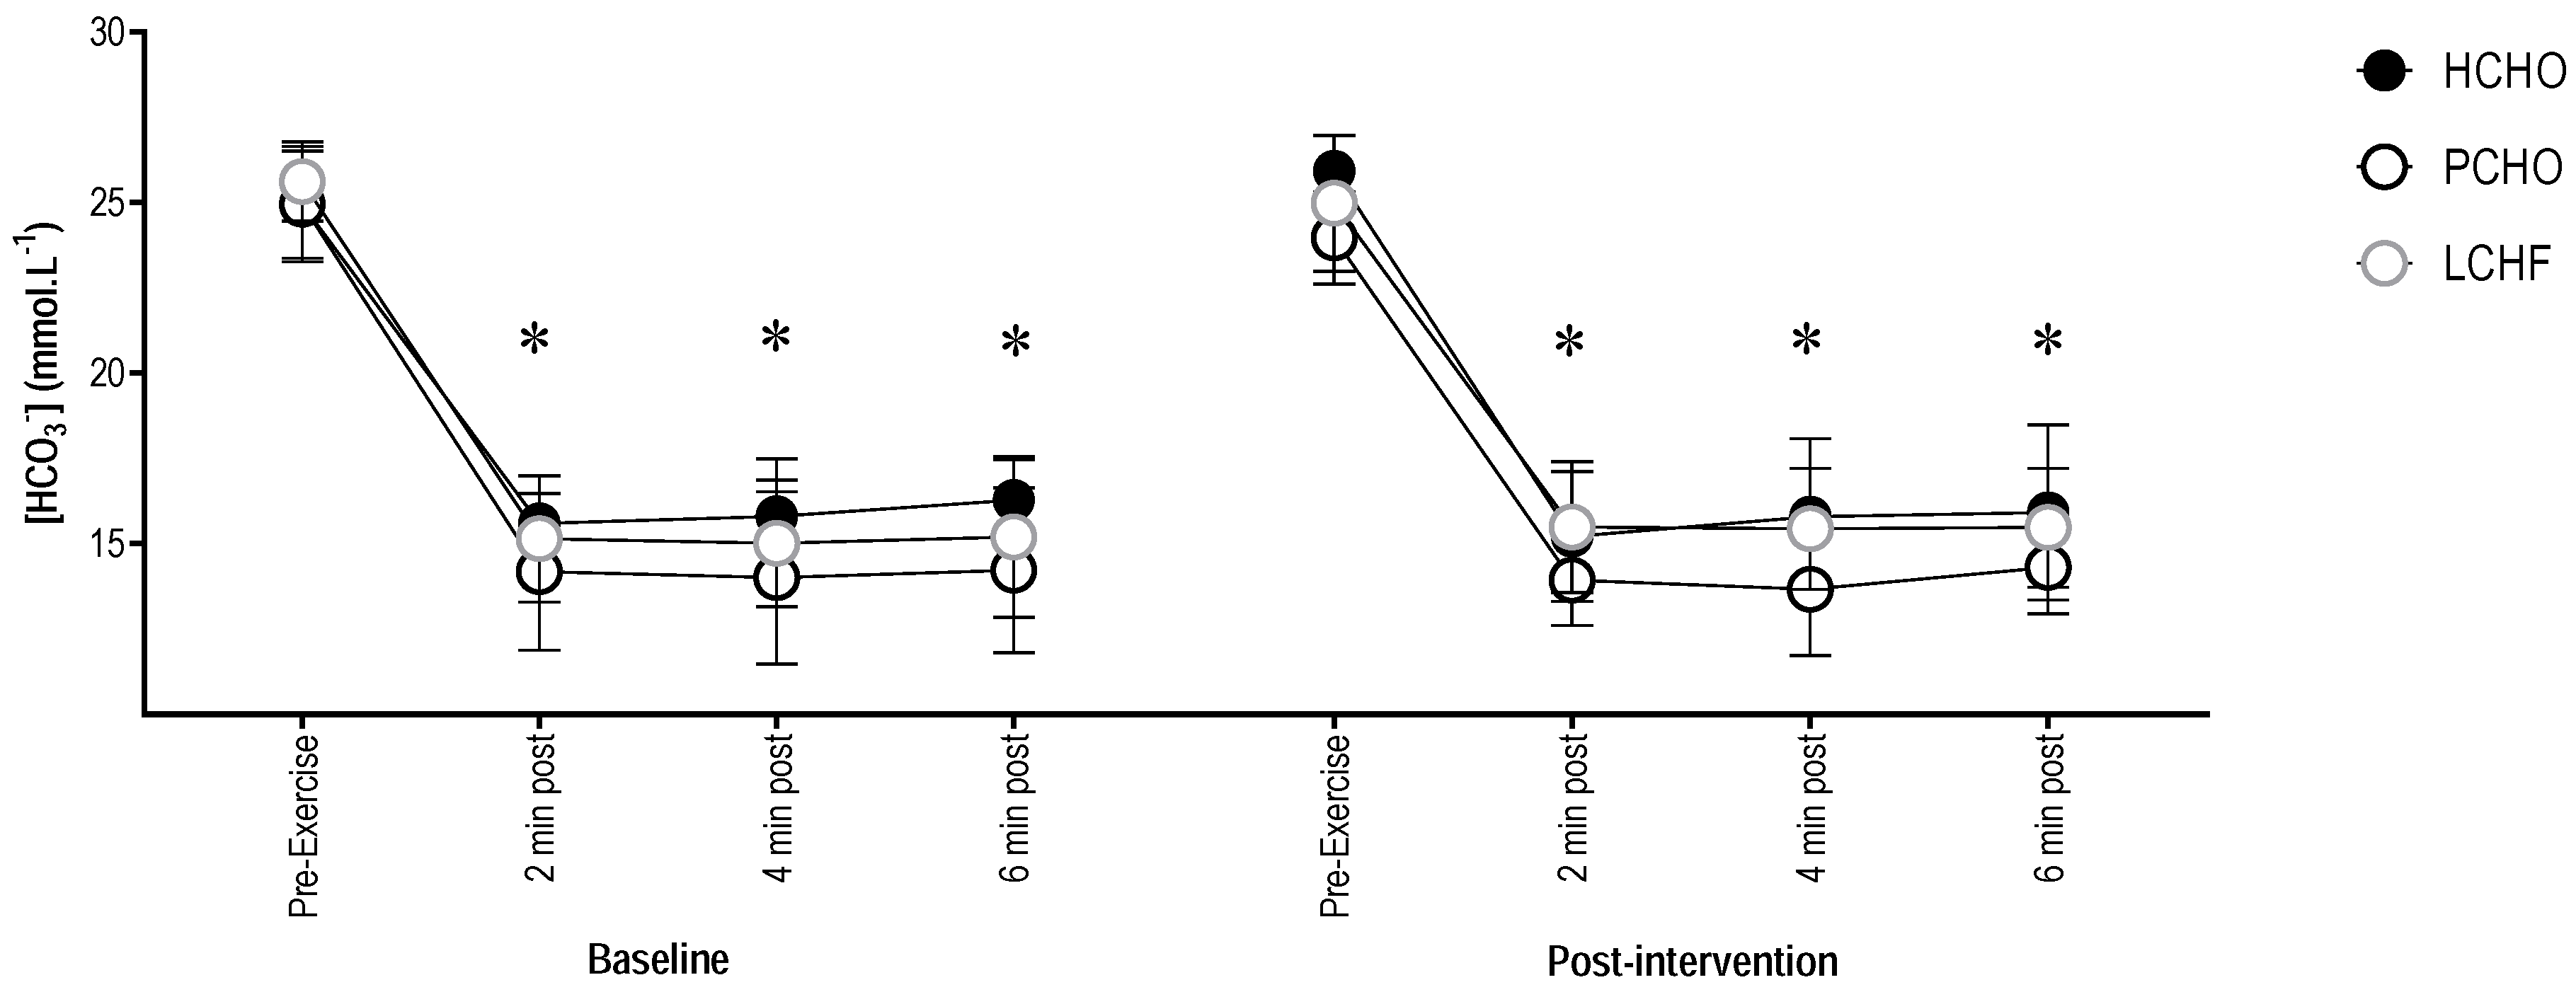
3.3. Blood Bicarbonate Concentration
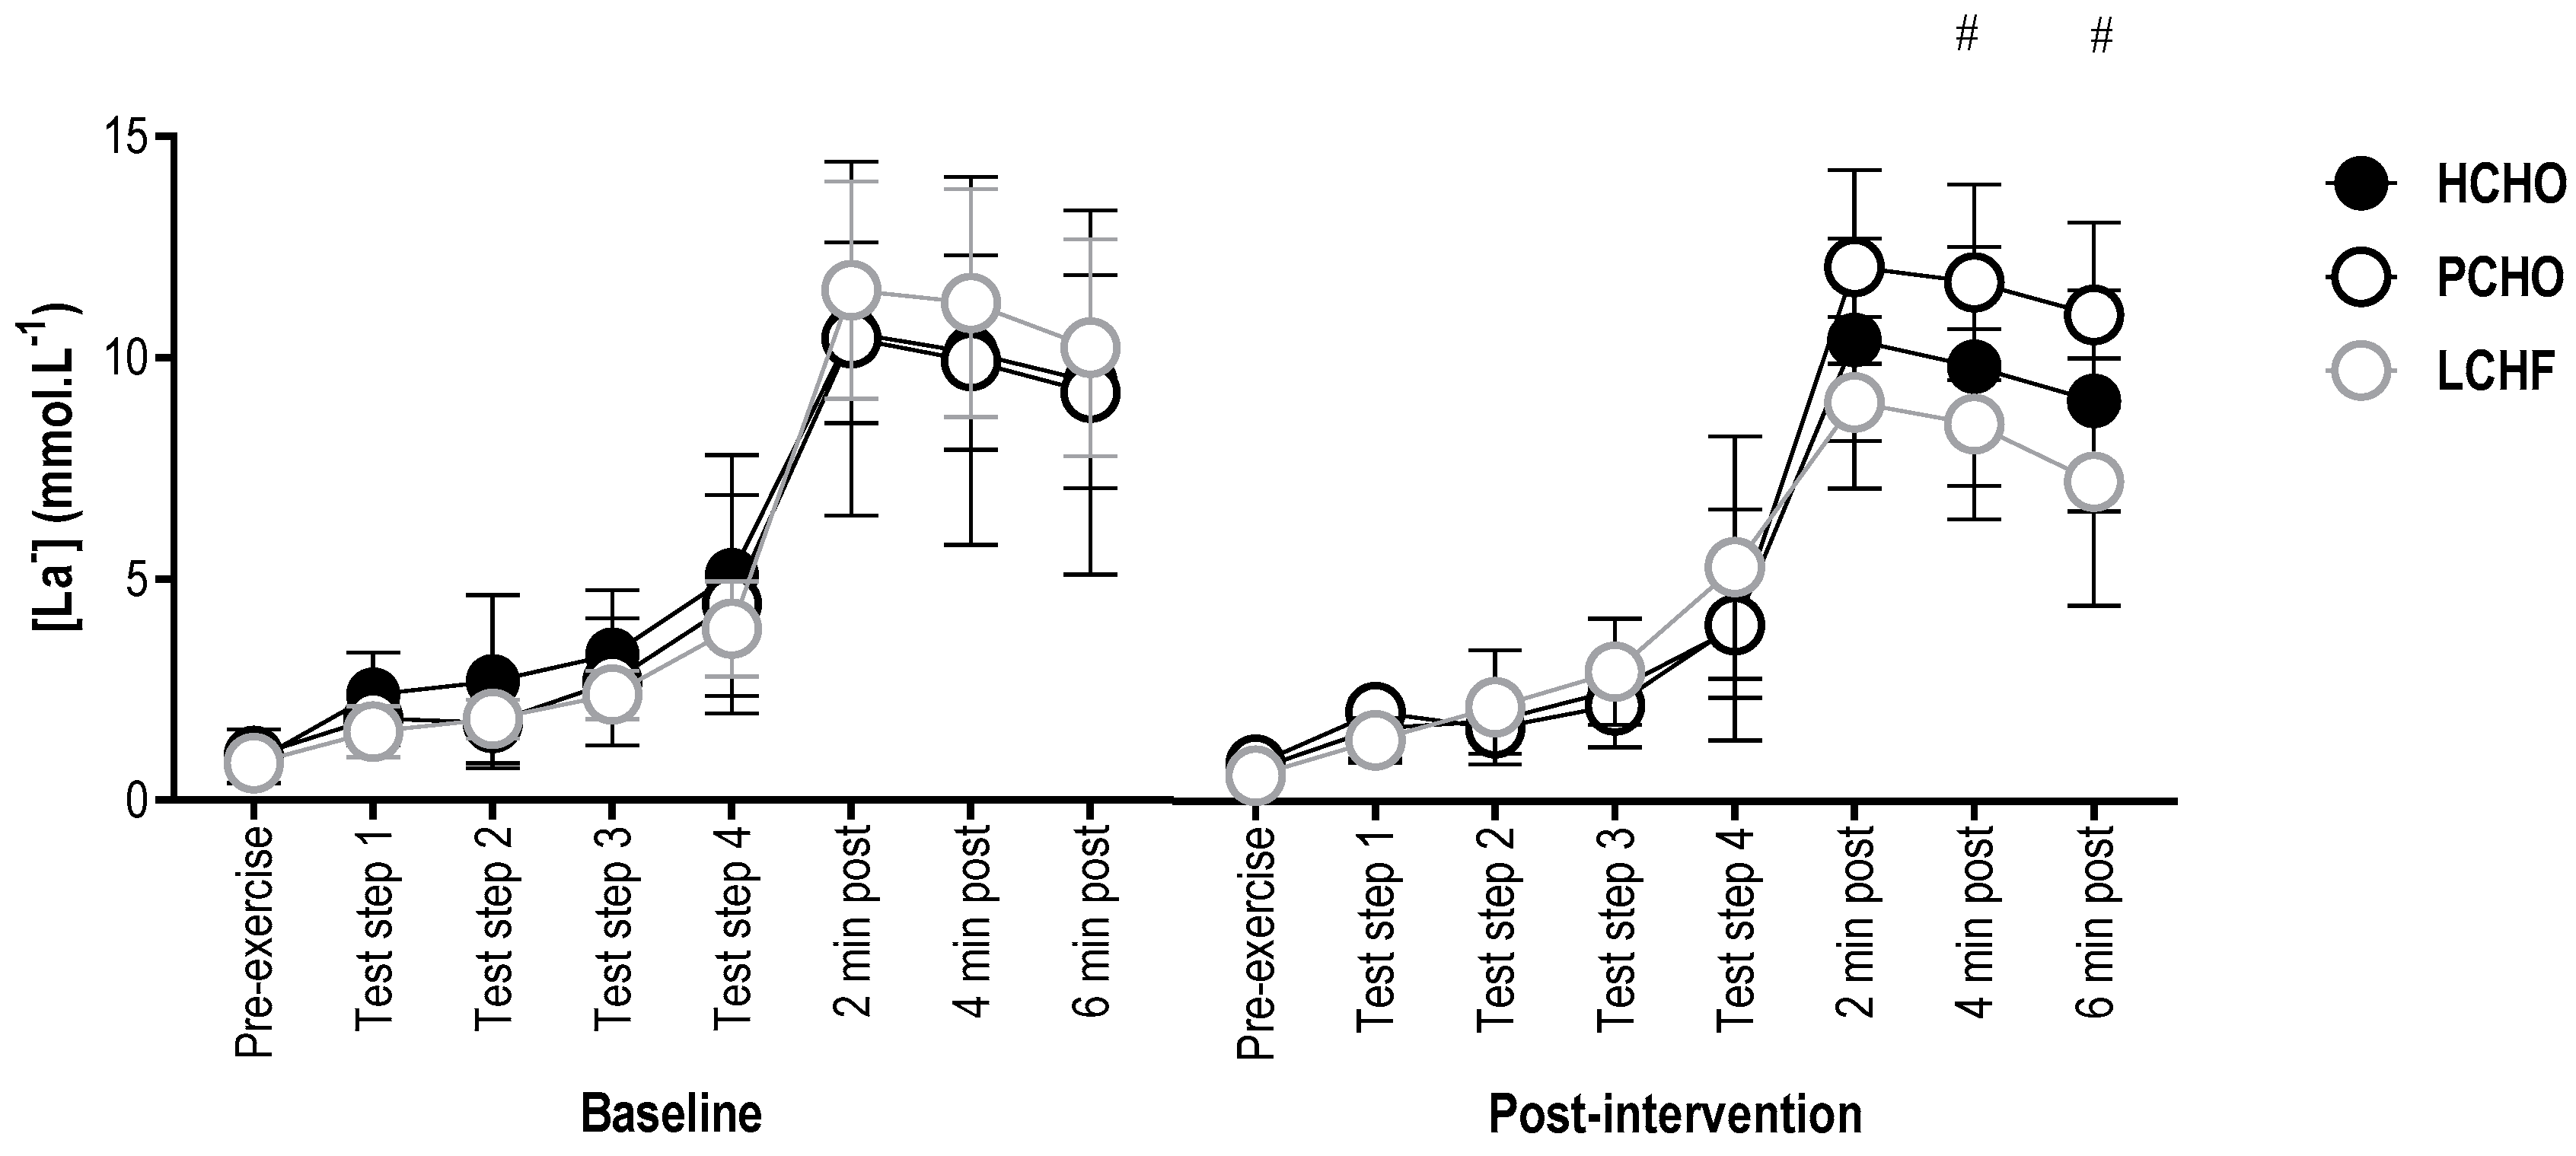
3.4. Blood Lactate Concentration
3.5. Net Endogenous Acid Production
4. Discussion
5. Conclusions
Supplementary Materials
Acknowledgments
Author Contributions
Conflicts of Interest
References
- Freeman, J.; Veggiotti, P.; Lanzi, G.; Tagliabue, A.; Perucca, E. The ketogenic diet: From molecular mechanisms to clinical effects. Epilepsy Res. 2006, 68, 145–180. [Google Scholar] [PubMed]
- Lefevre, F.; Aronson, N. Ketogenic diet for the treatment of refractory epilepsy in children: A systematic review of efficacy. Pediatrics 2000, 105, e46. [Google Scholar] [CrossRef] [PubMed]
- Johnstone, A.; Horgan, G.; Murison, S.; Bremner, D.; Lobley, G. Effects of a high-protein ketogenic diet on hunger, appetite, and weight loss in obese men feeding ad libitum. Am. J. Clin. Nutr. 2008, 87, 44–55. [Google Scholar] [CrossRef] [PubMed]
- Yancy, W.; Olsen, M.; Dudley, T.; Westman, E. Acid-base analysis of individuals following two weight loss diets. Eur. J. Clin. Nutr. 2007, 61, 1416–1422. [Google Scholar] [CrossRef] [PubMed]
- Volek, J.; Noakes, T.; Phinney, S. Rethinking fat as a fuel for endurance exercise. Eur. J. Sport Sci. 2015, 15, 13–20. [Google Scholar] [CrossRef] [PubMed]
- Phinney, S.; Bistrian, B.; Evans, W.; Gervino, E.; Blackburn, G. The human metabolic response to chronic ketosis without caloric restriction: Preservation of submaximal exercise capability with reduced carbohydrate oxidation. Metabolism 1983, 8, 769–776. [Google Scholar] [CrossRef]
- Volek, J.; Freidenreich, J.; Saenz, C.; Kunces, L.; Creighton, B.; Bartley, J.; Davitt, P.; Munoz, C.; Anderson, J.; Maresh, C.; et al. Metabolic characteristics of keto-adapted ultra-endurance runners. Metabolism 2016, 65, 100–110. [Google Scholar] [CrossRef] [PubMed]
- Webster, C.; Noakes, T.; Chacko, S.; Swart, J.; Kohn, T.; Smith, J. Gluconeogenesis during endurance exercise in cyclists habituated to a long-term low carbohydrate high-fat diet. J. Physiol. 2016, 15, 4389–4405. [Google Scholar] [CrossRef] [PubMed]
- Burke, L.; Ross, M.; Garvican-Lewis, L.; Welvaert, M.; Heikura, I.; Forbes, S.; Mirtschin, J.; Cato, L.; Strobel, N.; Sharma, A.; et al. Low carbohydrate, high fat diet impairs exercise economy and negates the performance effect from intensified training in elite race walkers. J. Physiol. 2017, 595, 2785–2807. [Google Scholar] [CrossRef] [PubMed]
- Coyle, E. Timing and method of increased carbohydrate intake to cope with heavy training, competition and recovery. J. Sports Sci. 1991, 9, 29–51. [Google Scholar] [CrossRef] [PubMed]
- Marquet, L.; Brisswalter, J.; Louis, J.; Tiollier, E.; Burke, L.; Hawley, J.; Hausswirth, C. Enhanced endurance performance by periodization of carbohydrate intake: “Sleep low” strategy. Med. Sci. Sports Exerc. 2016, 48, 663–672. [Google Scholar] [CrossRef] [PubMed]
- Yeo, W.; Lessard, A.; Chen, Z.; Garnham, A.; Burke, L.; Rivas, D.; Kemp, B.; Hawley, J. Fat adaptation followed by carbohydrate restoration increases AMPK activity in skeletal muscle from trained humans. J. Appl. Physiol. 2008, 105, 1519–1526. [Google Scholar] [CrossRef] [PubMed]
- Marquet, L.; Hausswirth, C.; Molle, O.; Hawley, J.; Burke, L.; Tiollier, E.; Brisswalter, J. Periodization of carbohydrate intake: Short-term effect on performance. Nutrients 2016, 8, 755. [Google Scholar] [CrossRef] [PubMed]
- Gejl, K.; Ørtenblad, N.; Andersson, E.; Plomgaard, P.; Holmberg, H.-C.; Nielsen, J. Local depletion of glycogen with supramaximal exercise in human skeleton fibres. J. Physiol. 2017, 595, 2809–2821. [Google Scholar] [CrossRef] [PubMed]
- Greenhaff, P.; Gleeson, M.; Whiting, P.; Maughan, R. Dietary composition and acid-base status: Limiting factors in the performance of maximal exercise in man? Eur. J. Appl. Physiol. 1987, 56, 444–450. [Google Scholar] [CrossRef]
- Greenhaff, P.; Gleeson, M.; Maughan, R. The effects of a glycogen loading regimen on acid-base status and blood lactate concentration before and after a fixed period of high intensity exercise in man. Eur. J. Appl. Physiol. 1988, 57, 254–259. [Google Scholar] [CrossRef]
- Greenhaff, P.; Gleeson, M.; Maughan, R. The effects of diet on muscle pH and metabolism during high intensity exercise. Eur. J. Appl. Physiol. 1988, 57, 531–539. [Google Scholar] [CrossRef]
- Greenhaff, P.; Gleeson, M.; Maughan, R. The effects of dietary manipulation on blood acid-base status and the performance of high intensity exercise. Eur. J. Appl. Physiol. 1987, 56, 331–337. [Google Scholar] [CrossRef]
- Lutz, J. Calcium balance and acid-base status of women as affected by increased protein intake and by sodium bicarbonate ingestion. Am. J. Clin. Nutr. 1984, 39, 281–288. [Google Scholar] [CrossRef] [PubMed]
- Nowson, C.; Wattanapenpaiboon, N.; Pachett, A. Low-sodium dietary approaches to stop hypertension. Nutr. Res. 2009, 29, 8–18. [Google Scholar] [CrossRef] [PubMed]
- Luis, D.; Huang, X.; Riserus, U.; Sjögren, P.; Lindholm, B.; Arnlöv, J.; Cederholm, T.; Carrero, J. Estimated dietary acid load is not associated with blood pressure or hypertension incidence in men who are approximately 70 years old. J. Nutr. 2015, 145, 315–321. [Google Scholar] [CrossRef] [PubMed]
- Frassetto, L.; Hardcastle, A.; Sebastian, A.; Aucott, L.; Fraser, W.; Reid, D.; Macdonald, H. No evidence that the skeletal non-response to potassium alkali supplements in healthy postmenopausal women depends on blood pressure or sodium chloride intake. Eur. J. Clin. Nutr. 2012, 66, 1315–1322. [Google Scholar] [CrossRef] [PubMed]
- Pizzorno, J.; Frassetto, L.; Katzinger, J. Diet-indicued acidosis: Is it real and clinically relevant? Br. J. Nutr. 2010, 103, 1185–1194. [Google Scholar] [PubMed]
- Adeva, M.; Souto, G. Diet-induced metabolic acidosis. Clin. Nutr. 2011, 30, 416–421. [Google Scholar] [CrossRef] [PubMed]
- Poupin, N.; Calvez, J.; Lassale, C.; Chesneau, C.; Tomé, D. Impact of diet on net endogenous acid production and acid-base balance. Clin. Nutr. 2012, 31, 313–321. [Google Scholar] [CrossRef] [PubMed]
- Frassetto, L.; Todd, K.; Morris, R.; Sebastian, A. Estimation of net endogenous noncarbonic acid production in humans from diet potassium and protein contents. Am. J. Clin. Nutr. 1998, 68, 576–583. [Google Scholar] [CrossRef] [PubMed]
- Remer, T.; Manz, F. Potential renal acid loads of foods and its influence on urine pH. J. Am. Diet. Assoc. 1995, 95, 791–797. [Google Scholar] [CrossRef]
- Ball, D.; Greenhaff, P.; Maughan, R. The acute reversal of a diet-induced metabolic acidosis does not restore endurance capacity during high-intensity exercise in man. Eur. J. Appl. Physiol. 1996, 73, 105–112. [Google Scholar] [CrossRef]
- Ball, D.; Maughan, R. Blood and urine acid-base status of premenopausal omnivorous and vegetarian women. Br. J. Nutr. 1997, 78, 683–693. [Google Scholar] [CrossRef] [PubMed]
- Cairns, S. Lactic acid and exercise performance: Culprit or friend? Sports Med. 2006, 36, 279–291. [Google Scholar] [CrossRef] [PubMed]
- Messionnier, L.; Kristensen, M.; Juel, C.; Denis, C. Importance of pH regulation and lactate/H+ transport capacity for work production during supramaximal exercise in humans. J. Appl. Physiol. 2007, 102, 1936–1944. [Google Scholar] [CrossRef] [PubMed]
- Edge, J.; Bishop, D.; Hill-Hass, S.; Dawson, B.; Goodman, C. Comparison of muscle buffer capacity and repeated-sprint ability of untrained, endurance-trained and team-sport athletes. Eur. J. Appl. Physiol. 2006, 96, 225–234. [Google Scholar] [CrossRef] [PubMed]
- Bishop, D.; Spencer, M. Determinants of repeated-sprint ability in well-trained team-sport athletes and endurance-trained athletes. J. Sports Med. Phys. Fit. 2004, 44, 1–7. [Google Scholar]
- Spiriev, B. IAAFscoring Tables of Athletics. Available online: https://www.iaaf.org/news/iaaf-news/scoring-tables-2017 (accessed on 20 January 2018).
- Mirtschin, J.; Forbes, S.; Cato, L.; Heikura, I.; Strobel, N.; Hall, R.; Burke, L. Organisation of dietary control for training-nutrition intervention involving low carbohydrate high fat (LCHF) diet. Int. J. Sport Nutr. Exerc. Metab. 2017. [Google Scholar] [CrossRef]
- Bartlett, J.; Hawley, J.; Morton, J. Carbohydrate availability and exercise training adaptation: Too much of a good thing? Eur. J. Sport Sci. 2015, 15, 3–12. [Google Scholar] [CrossRef] [PubMed]
- Saunders, P.; Telford, R.; Pyne, D.; Cunningham, R.; Gore, C.; Hahn, A.; Hawley, J. Improved running economy in elite runners after 20 days of simulated moderate-altitude exposure. J. Appl. Physiol. 2004, 96, 931–937. [Google Scholar] [CrossRef] [PubMed]
- Wang, Y.; Moss, J. Predictors of body surface area. J. Clin. Anaesth. 1992, 4, 4–10. [Google Scholar] [CrossRef]
- Bates, D.; Maechler, M.; Bolker, B.; Walker, S. Fitting linear mixed models using lme4. J. Stat. Softw. 2015, 67, 1–48. [Google Scholar] [CrossRef]
- Fox, J.; Wrisberg, S. An R Companion to Applied Regression, 2nd ed.; Sage Publications: Thousand Oaks, CA, USA, 2011; Available online: http://socserv.socsi.mcmaster.ca/jfox/Books/Companion (accessed on 8 December 2017).
- Hanley, B. An analysis of racing profiles of world-class racewalkers. Int. J. Sports Physiol. Perform. 2013, 8, 435–441. [Google Scholar] [CrossRef] [PubMed]
- Vernillo, G.; Agnello, L.; Drake, A.; Padulo, J.; Piacentini, M.; La Torre, A. An observational study on the perceptive and physiological variables during a 10,000-m race walking competition. J. Strength Cond. Res. 2012, 26, 2741–2747. [Google Scholar] [CrossRef] [PubMed]
- Pugliese, L.; Serpiello, F.; Millet, G.; La Torre, A. Training diaries during altitude training camp in two olympic champions: An observational case study. J. Sports Sci. Med. 2014, 13, 666–672. [Google Scholar] [PubMed]
- Weston, A.; Myburgh, K.; Lindsay, F.; Dennis, S.; Noakes, T.; Hawley, J. Skeletal muscle buffering capacity and endurance performance after high-intensity interval training by well-trained cyclists. Eur. J. Appl. Physiol. 1997, 75, 7–13. [Google Scholar] [CrossRef]
- Edge, J.; Bishop, D.; Goodman, C. The effects of training intensity on muscle buffer capacity in females. Eur. J. Appl. Physiol. 2006, 96, 97–105. [Google Scholar] [CrossRef] [PubMed]
- Cameron, S.; McLay-Cooke, R.; Brown, R.; Gray, A.; Fairbairn, K. Increased blood pH but not performance with sodium bicarbonate supplementation in elite rugby union players. Int. J. Sport Nutr. Exerc. Metab. 2010, 20, 307–321. [Google Scholar] [CrossRef] [PubMed]
- Tan, F.; Polglaze, T.; Cox, G.; Dawson, B.; Mujika, I.; Clark, S. Effects of induced alkalosis on simulated match performance in elite female water polo players. Int. J. Sport Nutr. Exerc. Metab. 2010, 20, 198–205. [Google Scholar] [CrossRef] [PubMed]
- Carr, A.; Hopkins, W.; Gore, C. Effects of acute alkalosis and acidosis on performance: A meta-analysis. Sports Med. 2011, 41, 801–814. [Google Scholar] [CrossRef] [PubMed]
- Reilly, T.; Waterhouse, J.; Burke, L.; Alonso, J. Nutrition for travel. J. Sports Sci. 2007, 25, S125–S134. [Google Scholar] [CrossRef] [PubMed]
- Frassetto, L.; Lanham-New, S.; Macdonald, H.; Remer, T.; Sebastian, A.; Tucker, K.; Tylavsky, F. Standardizing terminology for estimating the diet-dependent net acid load to the metabolic system. J. Nutr. 2007, 137, 1491–1492. [Google Scholar] [CrossRef] [PubMed]
- Parmenter, B.; Slater, G.; Frassetto, L. Spot-testing urine pH, a novel dietary biomarker? A randomised cross-over trial. Nutr. Diet. 2017, 74, 313–319. [Google Scholar] [CrossRef] [PubMed]


| Males (n = 18) | Females (n = 7) | |
|---|---|---|
| BASELINE TEST RESULTS | ||
| Height (cm) | 178.4 ±. 6.3 | 165.9 ± 5.8 |
| Mass (kg) | 67.7 ± 5.4 | 54.1 ± 5.1 |
| VO2max (mL·kg·min−1) | 60.5 ± 4.5 | 56.2 ± 3.6 |
| BASELINE NUTRITIONAL INTAKE | ||
| Carbohydrate (g·kg−1 BM) | 6.6 ± 1.3 (53 ± 7%) | 7.1 ± 1.5 (53 ± 9%) |
| Protein (g·kg−1 BM) | 2.5 ± 0.6 (20 ± 4%) | 2.5 ± 0.6 (18 ± 4%) |
| Fat (g·kg−1 BM) | 1.5± 0.5 (26 ± 5%) | 1.6 ± 0.4 (26 ± 5%) |
| DAY | Monday | Tuesday | Wednesday | Thursday | Friday | Saturday | Sunday |
|---|---|---|---|---|---|---|---|
| AM | 10 km walk | 10–15 km walk # Resistance training | >20 km long walk Hydrotherapy strategies | 10 km walk Resistance training | Hill session † | >20 km long walk Hydrotherapy strategies | 10 km walk or rest |
| PM | 1 km reps † Hydrotherapy strategies | 10 km walk | 10 km walk or rest | 10–15 km walk | 10–15 km walk # | 10 km walk or rest |
| HCHO | PCHO | LCHF | |
|---|---|---|---|
| BASELINE | |||
| NEAPF1 (mEq·day−1) | 75 ± 19 | 84 ± 18 | 104 ± 35 |
| NEAPF2 (mEq·day−1) | 49 ± 9 | 62 ± 16 | 61 ± 15 |
| NEAPR (mEq·day−1) | 62 ± 19 * | 63 ± 14 * | 68 ± 31 * |
| POST-INTERVENTION | |||
| NEAPF1 (mEq·day−1) | 65 ± 12 | 71 ± 16 | 98 ± 15 |
| NEAPF2 (mEq·day−1) | 45 ± 4 | 48 ± 4 | 70 ± 7 |
| NEAPR (mEq·day−1) | 40 ± 10 * | 58 ± 35 * | 69 ± 17 * |
© 2018 by the authors. Licensee MDPI, Basel, Switzerland. This article is an open access article distributed under the terms and conditions of the Creative Commons Attribution (CC BY) license (http://creativecommons.org/licenses/by/4.0/).
Share and Cite
Carr, A.J.; Sharma, A.P.; Ross, M.L.; Welvaert, M.; Slater, G.J.; Burke, L.M. Chronic Ketogenic Low Carbohydrate High Fat Diet Has Minimal Effects on Acid–Base Status in Elite Athletes. Nutrients 2018, 10, 236. https://doi.org/10.3390/nu10020236
Carr AJ, Sharma AP, Ross ML, Welvaert M, Slater GJ, Burke LM. Chronic Ketogenic Low Carbohydrate High Fat Diet Has Minimal Effects on Acid–Base Status in Elite Athletes. Nutrients. 2018; 10(2):236. https://doi.org/10.3390/nu10020236
Chicago/Turabian StyleCarr, Amelia J., Avish P. Sharma, Megan L. Ross, Marijke Welvaert, Gary J. Slater, and Louise M. Burke. 2018. "Chronic Ketogenic Low Carbohydrate High Fat Diet Has Minimal Effects on Acid–Base Status in Elite Athletes" Nutrients 10, no. 2: 236. https://doi.org/10.3390/nu10020236
APA StyleCarr, A. J., Sharma, A. P., Ross, M. L., Welvaert, M., Slater, G. J., & Burke, L. M. (2018). Chronic Ketogenic Low Carbohydrate High Fat Diet Has Minimal Effects on Acid–Base Status in Elite Athletes. Nutrients, 10(2), 236. https://doi.org/10.3390/nu10020236