A Plant-Based Dietary Intervention Improves Beta-Cell Function and Insulin Resistance in Overweight Adults: A 16-Week Randomized Clinical Trial


Abstract
:1. Introduction
2. Materials and Methods
2.1. Study Design and Eligibility
2.2. Randomization and Study Groups
2.3. Outcomes
2.4. Statistical Analysis
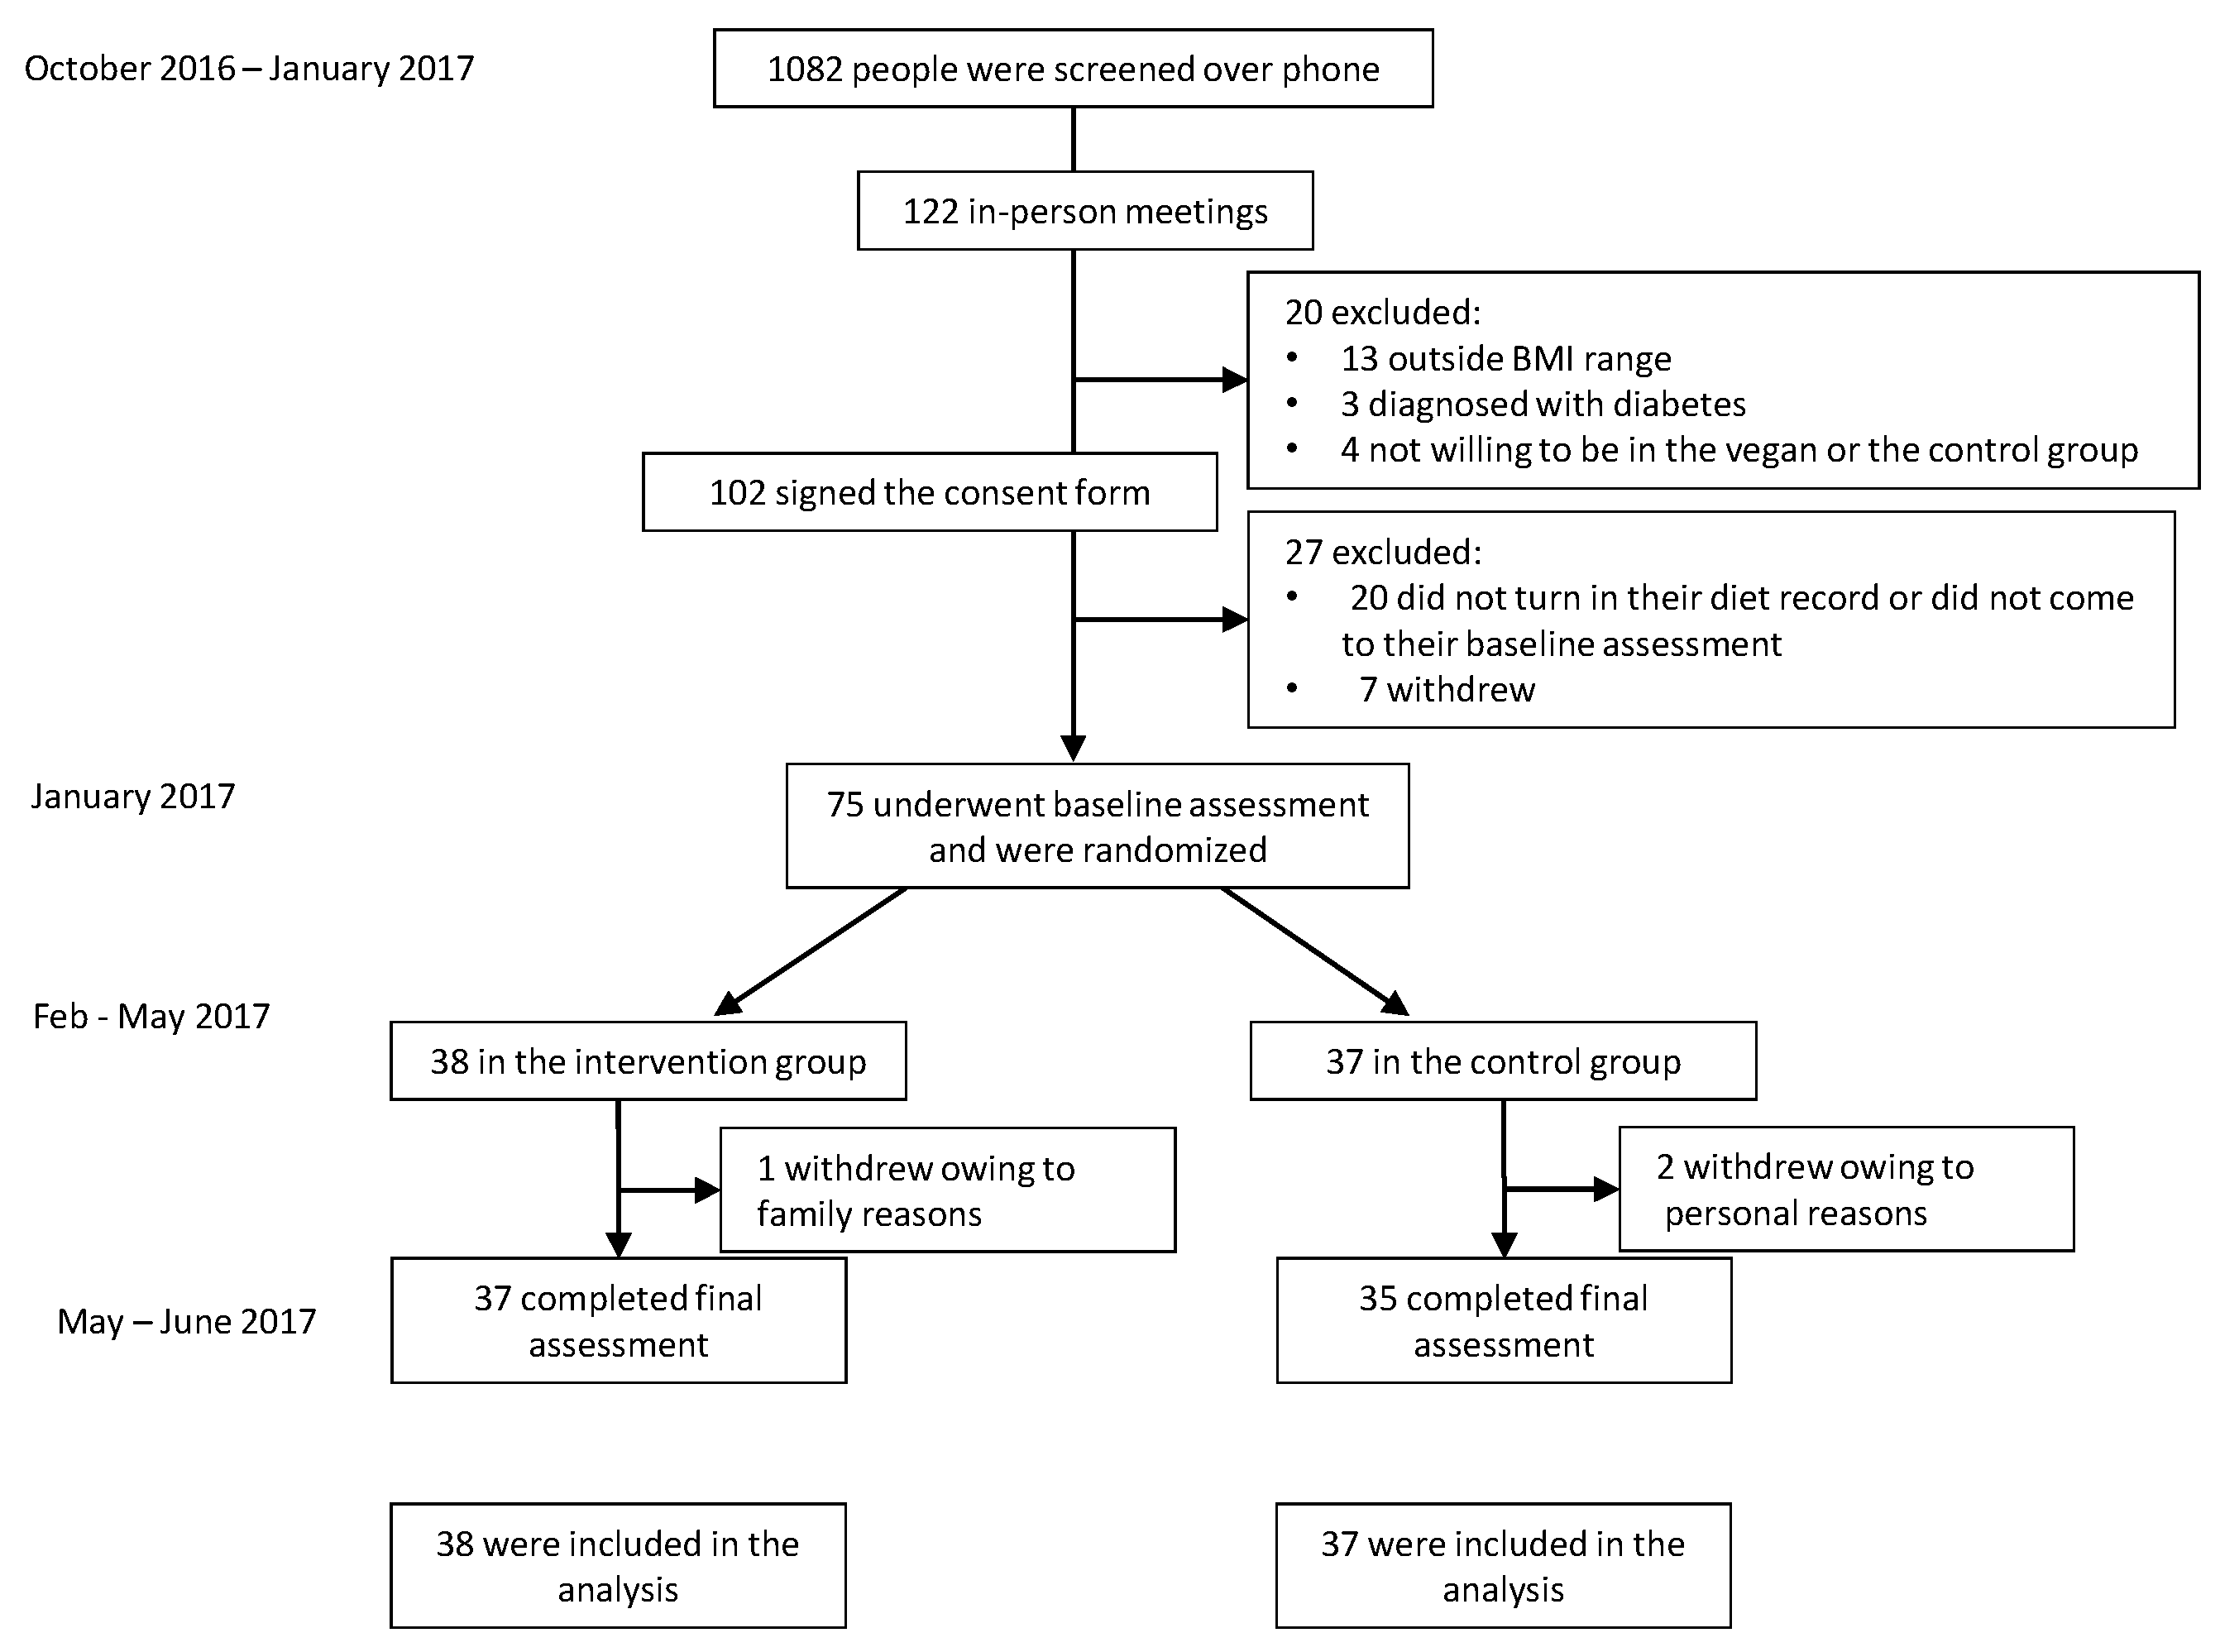
3. Results
3.1. Characteristics of the Participants
3.2. Physical Activity and Dietary Intake
3.3. Body Mass Index and Body Composition
3.4. Laboratory Variables
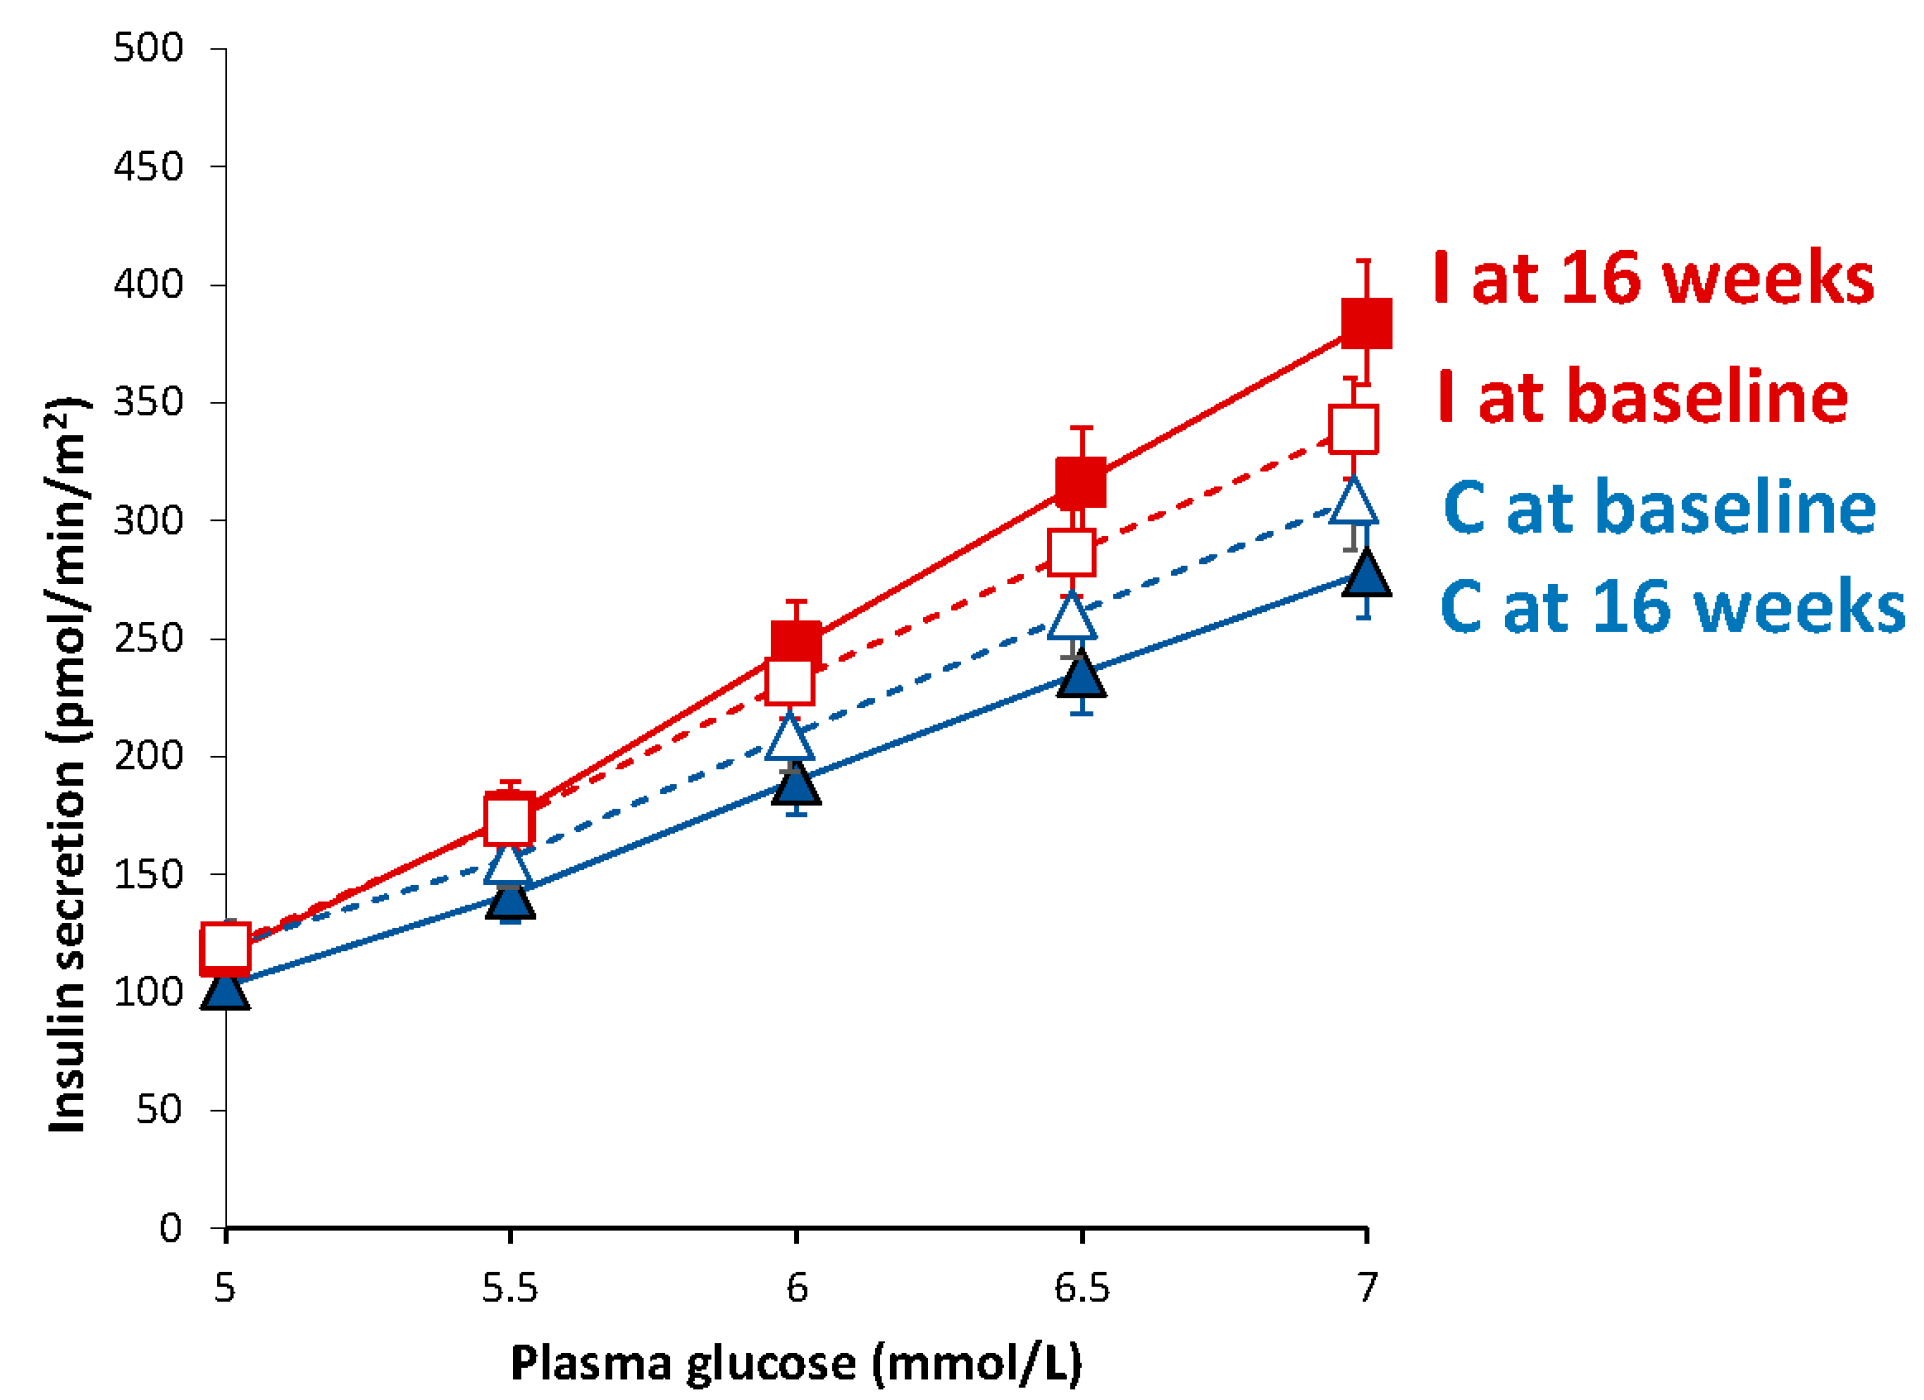
3.5. Beta-Cell Function
3.6. Insulin Resistance
3.7. The Effect of BMI and Adiposity
4. Discussion
5. Conclusions
Acknowledgments
Author Contributions
Conflicts of Interest
Abbreviations
| BMI | body mass index |
| Gxt | the interaction between the factors group and time in the ANOVA model |
| HbA1c | glycated hemoglobin |
| HOMA-IR | Homeostasis Model Assessment Insulin Resistance |
References
- Ferrannini, E.; Gastaldelli, A.; Miyazaki, Y.; Matsuda, M.; Pettiti, M.; Natali, A.; Mari, A.; DeFronzo, R.A. Predominant role of reduced beta-cell sensitivity to glucose over insulin resistance in impaired glucose tolerance. Diabetologia 2003, 46, 1211–1219. [Google Scholar] [CrossRef] [PubMed]
- Butler, A.E.; Janson, J.; Bonner-Weir, S.; Ritzel, R.; Rizza, R.A.; Butler, P.C. Beta-cell deficit and increased beta-cell apoptosis in humans with type 2 diabetes. Diabetes 2003, 52, 102–110. [Google Scholar] [CrossRef] [PubMed]
- Gastaldelli, A.; Ferrannini, E.; Miyazaki, Y.; Matsuda, M.; DeFronzo, R.A. Beta-cell dysfunction and glucose intolerance: Results from the San Antonio metabolism (SAM) study. Diabetologia 2004, 47, 31–39. [Google Scholar] [CrossRef] [PubMed]
- Solomon, T.P.J.; Haus, J.M.; Kelly, K.R.; Rocco, M.; Kashyap, S.R.; Kirwan, J.P. Improved Pancreatic Beta-Cell Function In Type 2 Diabetics Following Lifestyle-Induced Weight Loss Is Related To Glucose-Dependent Insulinotropic Polypeptide. Diabetes Care 2010. [Google Scholar] [CrossRef] [PubMed]
- Tonstad, S.; Butler, T.; Yan, R.; Fraser, G.E. Type of Vegetarian Diet, Body Weight, and Prevalence of Type 2 Diabetes. Diabetes Care 2009, 32, 791–796. [Google Scholar] [CrossRef] [PubMed]
- Snowdon, D.A.; Phillips, R.L. Does a vegetarian diet reduce the occurrence of diabetes? Am. J. Public Health 1985, 75, 507–512. [Google Scholar] [CrossRef] [PubMed]
- Cersosimo, E.; Solis-Herrera, C.; Trautmann, M.E.; Malloy, J.; Triplitt, C.L. Assessment of pancreatic β-cell function: Review of methods and clinical applications. Curr. Diabetes Rev. 2014, 10, 2–42. [Google Scholar] [CrossRef] [PubMed]
- Pacini, G.; Mari, A. Methods for clinical assessment of insulin sensitivity and beta-cell function. Best Pract. Res. Clin. Endocrinol. Metab. 2003, 17, 305–322. [Google Scholar] [CrossRef]
- Vang, A.; Singh, P.N.; Lee, J.W.; Haddad, E.H.; Brinegar, C.H. Meats, processed meats, obesity, weight gain and occurrence of diabetes among adults: Findings from Adventist Health Studies. Ann. Nutr. Metab. 2008, 52, 96–104. [Google Scholar] [CrossRef] [PubMed]
- Barnard, N.D.; Cohen, J.; Jenkins, D.J.A.; Turner-McGrievy, G.; Gloede, L.; Jaster, B.; Seidl, K.; Green, A.A.; Talpers, S. A low-fat vegan diet improves glycemic control and cardiovascular risk factors in a randomized clinical trial in individuals with type 2 diabetes. Diabetes Care 2006, 29, 1777–1783. [Google Scholar] [CrossRef] [PubMed]
- Barnard, N.D.; Gloede, L.; Cohen, J.; Jenkins, D.J.A.; Turner-McGrievy, G.; Green, A.A.; Ferdowsian, H. A low-fat vegan diet elicits greater macronutrient changes, but is comparable in adherence and acceptability, compared with a more conventional diabetes diet among individuals with type 2 diabetes. J. Am. Diet. Assoc. 2009, 109, 263–272. [Google Scholar] [CrossRef] [PubMed]
- Schakel, S.F.; Sievert, Y.A.; Buzzard, I.M. Sources of data for developing and maintaining a nutrient database. J. Am. Diet. Assoc. 1988, 88, 1268–1271. [Google Scholar] [PubMed]
- Hagströmer, M.; Oja, P.; Sjöström, M. The International Physical Activity Questionnaire (IPAQ): A study of concurrent and construct validity. Public Health Nutr. 2006, 9, 755–762. [Google Scholar] [CrossRef] [PubMed]
- Van Cauter, E.; Mestrez, F.; Sturis, J.; Polonsky, K.S. Estimation of insulin secretion rates from C-peptide levels. Comparison of individual and standard kinetic parameters for C-peptide clearance. Diabetes 1992, 41, 368–377. [Google Scholar] [CrossRef] [PubMed]
- Mari, A.; Tura, A.; Gastaldelli, A.; Ferrannini, E. Assessing insulin secretion by modeling in multiple-meal tests: Role of potentiation. Diabetes 2002, 51, S221–S226. [Google Scholar] [CrossRef] [PubMed]
- Mari, A.; Schmitz, O.; Gastaldelli, A.; Oestergaard, T.; Nyholm, B.; Ferrannini, E. Meal and oral glucose tests for assessment of beta-cell function: Modeling analysis in normal subjects. Am. J. Physiol. Endocrinol. Metab. 2002, 283, E1159–E1166. [Google Scholar] [CrossRef] [PubMed]
- Matthews, D.R.; Hosker, J.P.; Rudenski, A.S.; Naylor, B.A.; Treacher, D.F.; Turner, R.C. Homeostasis model assessment: Insulin resistance and beta-cell function from fasting plasma glucose and insulin concentrations in man. Diabetologia 1985, 28, 412–419. [Google Scholar] [CrossRef] [PubMed]
- Abdul-Ghani, M.A.; Matsuda, M.; Balas, B.; DeFronzo, R.A. Muscle and liver insulin resistance indexes derived from the oral glucose tolerance test. Diabetes Care 2007, 30, 89–94. [Google Scholar] [CrossRef] [PubMed]
- Gupta, S.K. Intention-to-treat concept: A review. Perspect. Clin. Res. 2011, 2, 109–112. [Google Scholar] [CrossRef] [PubMed]
- Kahleova, H.; Mari, A.; Nofrate, V.; Matoulek, M.; Kazdova, L.; Hill, M.; Pelikanova, T. Improvement in β-cell function after diet-induced weight loss is associated with decrease in pancreatic polypeptide in subjects with type 2 diabetes. J. Diabetes Complicat. 2012, 26, 442–449. [Google Scholar] [CrossRef] [PubMed]
- Gerst, F.; Wagner, R.; Kaiser, G.; Panse, M.; Heni, M.; Machann, J.; Bongers, M.N.; Sartorius, T.; Sipos, B.; Fend, F.; et al. Metabolic crosstalk between fatty pancreas and fatty liver: Effects on local inflammation and insulin secretion. Diabetologia 2017, 60, 2240–2251. [Google Scholar] [CrossRef] [PubMed]
- Tuomilehto, J.; Lindström, J.; Eriksson, J.G.; Valle, T.T.; Hämäläinen, H.; Ilanne-Parikka, P.; Keinänen-Kiukaanniemi, S.; Laakso, M.; Louheranta, A.; Rastas, M.; et al. Finnish Diabetes Prevention Study Group Prevention of type 2 diabetes mellitus by changes in lifestyle among subjects with impaired glucose tolerance. N. Engl. J. Med. 2001, 344, 1343–1350. [Google Scholar] [CrossRef] [PubMed]
- De Mello, V.D.F.; Lindström, J.; Eriksson, J.; Ilanne-Parikka, P.; Keinänen-Kiukaanniemi, S.; Sundvall, J.; Laakso, M.; Tuomilehto, J.; Uusitupa, M. Insulin secretion and its determinants in the progression of impaired glucose tolerance to type 2 diabetes in impaired glucose-tolerant individuals: The Finnish Diabetes Prevention Study. Diabetes Care 2012, 35, 211–217. [Google Scholar] [CrossRef] [PubMed]
- Moore, W.J.; McGrievy, M.E.; Turner-McGrievy, G.M. Dietary adherence and acceptability of five different diets, including vegan and vegetarian diets, for weight loss: The New DIETs study. Eat. Behav. 2015, 19, 33–38. [Google Scholar] [CrossRef] [PubMed]
- Barnard, N.D.; Levin, S.M.; Yokoyama, Y. A systematic review and meta-analysis of changes in body weight in clinical trials of vegetarian diets. J. Acad. Nutr. Diet. 2015, 115, 954–969. [Google Scholar] [CrossRef] [PubMed]
- Huang, R.-Y.; Huang, C.-C.; Hu, F.B.; Chavarro, J.E. Vegetarian Diets and Weight Reduction: A Meta-Analysis of Randomized Controlled Trials. J. Gen. Intern. Med. 2016, 31, 109–116. [Google Scholar] [CrossRef] [PubMed]
- Yokoyama, Y.; Levin, S.M.; Barnard, N.D. Association between plant-based diets and plasma lipids: A systematic review and meta-analysis. Nutr. Rev. 2017, 75, 683–698. [Google Scholar] [CrossRef] [PubMed]
- Kahleova, H.; Levin, S.; Barnard, N. Cardio-Metabolic Benefits of Plant-Based Diets. Nutrients 2017, 9, 848. [Google Scholar] [CrossRef] [PubMed]
- Page, K.A.; Reisman, T. Interventions to Preserve Beta-Cell Function in the Management and Prevention of Type 2 Diabetes. Curr. Diabetes Rep. 2013, 13, 252–260. [Google Scholar] [CrossRef] [PubMed]
- Ismail-Beigi, F. Clinical practice. Glycemic management of type 2 diabetes mellitus. N. Engl. J. Med. 2012, 366, 1319–1327. [Google Scholar] [CrossRef] [PubMed]
- Kahleova, H.; Matoulek, M.; Malinska, H.; Oliyarnik, O.; Kazdova, L.; Neskudla, T.; Skoch, A.; Hajek, M.; Hill, M.; Kahle, M.; et al. Vegetarian diet improves insulin resistance and oxidative stress markers more than conventional diet in subjects with Type 2 diabetes. Diabet. Med. 2011, 28, 549–559. [Google Scholar] [CrossRef] [PubMed]
- Kahleova, H.; Klementova, M.; Herynek, V.; Skoch, A.; Herynek, S.; Hill, M.; Mari, A.; Pelikanova, T. The Effect of a Vegetarian vs Conventional Hypocaloric Diabetic Diet on Thigh Adipose Tissue Distribution in Subjects with Type 2 Diabetes: A Randomized Study. J. Am. Coll. Nutr. 2017, 36, 364–369. [Google Scholar] [CrossRef] [PubMed]
- Shulman, G.I. Ectopic Fat in Insulin Resistance, Dyslipidemia, and Cardiometabolic Disease. Available online: http://www.nejm.org/doi/full/10.1056/NEJMra1011035 (accessed on 24 October 2017).
- Wajchenberg, B.L. β-cell failure in diabetes and preservation by clinical treatment. Endocr. Rev. 2007, 28, 187–218. [Google Scholar] [CrossRef] [PubMed]
- Vilsbøll, T.; Holst, J.J. Incretins, insulin secretion and Type 2 diabetes mellitus. Diabetologia 2004, 47, 357–366. [Google Scholar] [CrossRef] [PubMed]
- Belinova, L.; Kahleova, H.; Malinska, H.; Topolcan, O.; Vrzalova, J.; Oliyarnyk, O.; Kazdova, L.; Hill, M.; Pelikanova, T. Differential acute postprandial effects of processed meat and isocaloric vegan meals on the gastrointestinal hormone response in subjects suffering from type 2 diabetes and healthy controls: A randomized crossover study. PLoS ONE 2014, 9, e107561. [Google Scholar] [CrossRef] [PubMed]
- Haghighatdoost, F.; Bellissimo, N.; Totosy de Zepetnek, J.O.; Rouhani, M.H. Association of vegetarian diet with inflammatory biomarkers: A systematic review and meta-analysis of observational studies. Public Health Nutr. 2017, 20, 2713–2721. [Google Scholar] [CrossRef] [PubMed]
- Gower, B.A.; Goree, L.L.; Chandler-Laney, P.C.; Ellis, A.C.; Casazza, K.; Granger, W.M. A higher-carbohydrate, lower-fat diet reduces fasting glucose concentration and improves β-cell function in individuals with impaired fasting glucose. Metab. Clin. Exp. 2012, 61, 358–365. [Google Scholar] [CrossRef] [PubMed]
- Carrasco-Pozo, C.; Tan, K.N.; Reyes-Farias, M.; De La Jara, N.; Ngo, S.T.; Garcia-Diaz, D.F.; Llanos, P.; Cires, M.J.; Borges, K. The deleterious effect of cholesterol and protection by quercetin on mitochondrial bioenergetics of pancreatic β-cells, glycemic control and inflammation: In vitro and in vivo studies. Redox Biol. 2016, 9, 229–243. [Google Scholar] [CrossRef] [PubMed]
- Xiao, J.B.; Högger, P. Dietary polyphenols and type 2 diabetes: Current insights and future perspectives. Curr. Med. Chem. 2015, 22, 23–38. [Google Scholar] [CrossRef] [PubMed]
- Yuan, C.; Spiegelman, D.; Rimm, E.B.; Rosner, B.A.; Stampfer, M.J.; Barnett, J.B.; Chavarro, J.E.; Rood, J.C.; Harnack, L.J.; Sampson, L.K.; et al. Relative Validity of Nutrient Intakes Assessed by Questionnaire, 24-Hour Recalls, and Diet Records Compared With Urinary Recovery and Plasma Concentration Biomarkers: Findings for Women. Am. J. Epidemiol. 2017. [Google Scholar] [CrossRef] [PubMed]


| Characteristic | Intervention Group (n = 38) | Control Group (n = 37) |
|---|---|---|
| Age (years) | 52.6 ± 14.7 | 54.3 ± 9.9 |
| Sex (number, %) | ||
| Male | 2 (5%) | 6 (16%) |
| Female | 36 (95%) | 31 (84%) |
| Race, (number, %) | ||
| White | 15 (39%) | 19 (51%) |
| Black | 20 (53%) | 14 (38%) |
| Asian, Pacific Islander | 0 | 4 (11%) |
| American Indian, Eskimo, Aleut | 2 (5%) | 0 |
| N/A—did not disclose | 1 (3%) | 0 |
| Ethnicity, (number, %) | ||
| Non-hispanic | 33 (87%) | 31 (84%) |
| Hispanic | 3 (8%) | 3 (8%) |
| N/A—did not disclose | 2 (5%) | 3 (8%) |
| Marital status | ||
| Not married | 22 (58%) | 19 (51%) |
| Married | 16 (42%) | 17 (46%) |
| NA | 0 | 1 (3%) |
| Education | ||
| High school | 0 | 0 |
| College | 17 (45%) | 20 (54%) |
| Graduate degree | 20 (53%) | 17 (46%) |
| NA | 1 (2%) | 0 |
| Occupation | ||
| Service occupation | 5 (13%) | 1 (3%) |
| Technical, sales, administrative | 15 (39%) | 10 (27%) |
| Professional or managerial | 10 (26%) | 16 (43%) |
| Retired | 4 (11%) | 6 (16%) |
| Other | 4 (11%) | 4 (11%) |
| Medications | ||
| Lipid-lowering therapy (%) | 5 (13) | 4 (11) |
| Antihypertensive therapy (%) | 11 (29) | 7 (19) |
| Thyroid medications (%) | 6 (16) | 3 (8) |
| Control Group | Intervention Group | Treatment Effect | p-Value | |||
|---|---|---|---|---|---|---|
| Baseline | Week 16 | Baseline | Week 16 | |||
| Total physical activity (METs) | 2642 (1476–3809) | 2575 (1169–3980) | 2207 (1444–2969) | 2490 (1586–3395) | +351 (−1143 to +1846) | 0.46 |
| Dietary intake | ||||||
| Caloric intake (kcal/day) | 1923 (1627–2219) | 1582 (1368–1795) ** | 1851 (1695–2007) | 1450 (1249–1652) *** | −60 (−352 to +233) | 0.69 |
| Carbohydrates (% of daily energy) | 45.5 (42.6–48.4) | 46.6 (42.9–50.4) | 46.1 (43.5–48.8) | 69.6 (67.3–71.8) *** | +22.3 (+17.7 to +26.9) | <0.001 |
| Fats (% of daily energy) | 35.6 (32.3–38.9) | 35.0 (31.5–38.4) | 36.1 (34.0–38.1) | 17.5 (15.5–19.4) *** | −17.9 (−22.3 to −13.6) | <0.001 |
| Proteins (% of daily energy) | 16.1 (15.0–17.1) | 17.0 (15.5–18.5) | 16.8 (15.4–18.2) | 12.3 (11.3–13.3) *** | −5.4 (−7.8 to −3.0) | <0.001 |
| Fiber intake (g/day) | 25.2 (20.9–29.6) | 23.5 (19.6–27.4) | 24.2 (21.0–27.4) | 37.8 (31.4–44.1) *** | +15.3 (+8.0 to +22.6) | <0.001 |
| Cholesterol intake (mg/day) | 290 (220–360) | 212 (149–275) | 264 (213–315) | 6.5 (2.5–10.5) *** | −180 (−278 to −82) | <0.001 |
| Saturated fatty acids (g/day) | 25.5 (19.8–31.1) | 17.9 (13.6–22.2) ** | 24.5 (21.2–27.7) | 5.6 (4.6–6.7) *** | −11.2 (−16.5 to −5.9) | <0.001 |
| Monounsaturated fatty acids (g/day) | 30.5 (23.8–37.2) | 24.9 (19.8–30.0) | 28.9 (25.1–32.7) | 9.5 (7.8–11.2) *** | −13.8 (−19.5 to −8.2) | <0.001 |
| Polyunsaturated fatty acids (g/day) | 20.9 (15.3–26.5) | 17.9 (14.8–21.1) | 18.2 (15.2–21.1) | 10.6 (9.0–12.2) *** | −4.6 (−10.1 to +0.9) | 0.10 |
| Glycemic index | 58.1 (56.2–59.9) | 57.4 (55.3–59.5) * | 57.7 (55.5–59.9) | 54.4 (53.4–55.5) ** | −2.6 (−5.7 to +0.5) | 0.10 |
| Anthropometric variables | ||||||
| BMI (kg/m2) | 33.6 (32.5–34.8) | 33.4 (32.2–34.6) | 33.1 (31.8–34.3) | 31.2 (29.9–32.5) *** | −2.0 (−2.6 to −1.5) | <0.001 |
| Lean mass (kg) | 49.8 (46.2–53.4) | 48.8 (45.4–52.2) ** | 50.6 (48.6–52.5) | 48.3 (46.5–50.1) *** | −1.2 (−2.0 to −0.5) | 0.002 |
| Fat mass (kg) | 39.1 (35.6–42.5) | 39.5 (36.0–43.0) | 42.0 (39.3–44.7) | 38.1 (35.6–40.7) *** | −4.3 (−5.4 to −3.2) | <0.001 |
| Visceral fat volume (cm3) | 1434 (1154–1714) | 1459 (1173–1744) | 1289 (1040–1539) | 1090 (864–1315) *** | −224 (−328 to −120) | <0.001 |
| Laboratory variables | ||||||
| Total cholesterol (mmol/L) | 5.4 (5.0–5.8) | 5.3 (5.0–5.6) | 5.4 (5.1–5.7) | 4.8 (4.4–5.2) *** | −1.1 (−2.0 to −0.2) | 0.02 |
| HDL-cholesterol (mmol/L) | 1.6 (1.4–1.8) | 1.6 (1.4–1.8) | 1.6 (1.5–1.8) | 1.4 (1.3–1.6) *** | −0.4 (−0.6 to −0.2) | 0.002 |
| LDL-cholesterol (mmol/L) | 3.2 (2.9–3.6) | 3.2 (2.9–3.5) | 3.2 (2.9–3.5) | 2.7 (2.3–3.1) ** | −0.9 (−1.8 to −0.1) | 0.03 |
| Triglycerides (mmol/L) | 1.1 (0.9–1.4) | 1.2 (0.9–1.6) | 1.2 (1.0–1.3) | 1.4 (1.2–1.7) ** | +0.9 (−0.3 to +2.2) | 0.16 |
| Fasting plasma glucose (mmol/L) | 5.5 (5.3–5.7) | 5.6 (5.4–5.8) | 5.3 (5.1–5.6) | 5.1 (4.9–5.2) ** | −0.4 (−0.6 to −0.2) | <0.001 |
| Fasting plasma insulin (pmol/L) | 72.9 (56.9–88.2) | 88.9 (38.9–135.4) | 91.7 (72.9–111.8) | 71.5 (55.6–87.5) ** | −85.4 (−170.8 to +0.7) | 0.05 |
| Fasting plasma C-peptide (ng/mL) | 2.5 (2.2–2.8) | 3.0 (2.2–3.8) | 2.6 (2.3–2.9) | 2.1 (1.9–2.4) *** | −1.0 (−1.6 to −0.4) | 0.003 |
| HbA1c (DCCT, %) | 5.8 (5.7–5.9) | 5.8 (5.7–5.9) | 5.8 (5.7–5.9) | 5.8 (5.7–5.9) | 0.0 (−0.1 to +0.1) | 0.81 |
| HbA1c (IFCC, mmol/mol) | 40 (38.8–41.2) | 40.1 (38.8–41.4) | 39.9 (38.3–41.4) | 40.1 (38.9–41.4) | +0.1 (−24.6 to +22.4) | 0.81 |
| Insulin secretion/ Beta-cell function | ||||||
| Basal insulin secretion (pmol/min/m2) | 100.5 (94.4–107.2) | 104.1 (97.7–111.3) | 108.6 (102.2–115.8) | 83.0 (78.9–87.5) ** | −54.2 (−86.5 to −21.9) | <0.001 |
| Total insulin secretion (nmol/m2) | 55.3 (52.6–58.2) | 63.3 (60.4–66.4) ** | 53.8 (51.4–56.3) | 54.8 (52.4–57.3) | −8.8 (−17.3 to +0.4) | 0.07 |
| Insulin secretion at a fixed glucose value (5 mM) (pmol/min/m2) | 110.0 (99.6–121.1) | 103.1 (93.9–112.8) | 109.4 (100.1–119.4) | 116.6 (105.9–128.1) * | +14.2 (−25.0 to +63.3) | 0.10 |
| Mean glucose (mmol/L) | 5.5 (5.2–5.8) | 6.1 (5.7–6.4) *** | 5.6 (5.2–6.0) | 5.4 (4.9–5.9) * | −0.8 (−1.2 to −0.4) | <0.001 |
| Mean insulin (pmol/L) | 312.2 (234.4–390.0) | 406.4 (316.8–496.0) * | 330.0 (259.4–400.6) | 348.6 (274.7–422.5) | −75.7 (−180.4 to +29.1) | 0.15 |
| Glucose sensitivity (pmol/min/m2/mM) | 107.5 (76.4–146.5) | 181.1 (135.3–237.2) | 108.5 (80.8–142.4) | 213.8 (167.9–268.3) ** | +65.5 (−74.4 to +205.4) | 0.13 |
| Rate sensitivity (pmol/m2/mM) | 2260 (1419–3101) | 1978 (1188–2768) | 2783 (2127–3438) | 2269 (1505–3033) | −232 (−1601 to +1137) | 0.38 |
| Potentiation factor ratio (dimensionless) | 1.45 (1.28–1.63) | 1.62 (1.43–1.82) | 1.32 (1.17–1.47) | 1.08 (0.95–1.22) | −0.51 (−1.04 to +0.03) | 0.08 |
| Insulin sensitivity /resistance | ||||||
| 3 h-oral glucose insulin sensitivity (mL/min/m2) | 403.2 (389.1–417.6) | 388.2 (374.5–402.3) | 404.1 (391.7–416.8) | 406.7 (394.2–419.5) | +10.8 (−29.5 to +51.1) | 0.78 |
| HOMA-IR (dimensionless) | 2.4 (2.1–2.7) | 2.8 (2.5–3.1) | 2.5 (2.3–2.8) | 1.9 (1.7–2.1) *** | −1.0 (−1.2 to −0.8) | 0.004 |
© 2018 by the authors. Licensee MDPI, Basel, Switzerland. This article is an open access article distributed under the terms and conditions of the Creative Commons Attribution (CC BY) license (http://creativecommons.org/licenses/by/4.0/).
Share and Cite
Kahleova, H.; Tura, A.; Hill, M.; Holubkov, R.; Barnard, N.D. A Plant-Based Dietary Intervention Improves Beta-Cell Function and Insulin Resistance in Overweight Adults: A 16-Week Randomized Clinical Trial. Nutrients 2018, 10, 189. https://doi.org/10.3390/nu10020189
Kahleova H, Tura A, Hill M, Holubkov R, Barnard ND. A Plant-Based Dietary Intervention Improves Beta-Cell Function and Insulin Resistance in Overweight Adults: A 16-Week Randomized Clinical Trial. Nutrients. 2018; 10(2):189. https://doi.org/10.3390/nu10020189
Chicago/Turabian StyleKahleova, Hana, Andrea Tura, Martin Hill, Richard Holubkov, and Neal D. Barnard. 2018. "A Plant-Based Dietary Intervention Improves Beta-Cell Function and Insulin Resistance in Overweight Adults: A 16-Week Randomized Clinical Trial" Nutrients 10, no. 2: 189. https://doi.org/10.3390/nu10020189
APA StyleKahleova, H., Tura, A., Hill, M., Holubkov, R., & Barnard, N. D. (2018). A Plant-Based Dietary Intervention Improves Beta-Cell Function and Insulin Resistance in Overweight Adults: A 16-Week Randomized Clinical Trial. Nutrients, 10(2), 189. https://doi.org/10.3390/nu10020189