A Preliminary Study for Evaluating the Dose-Dependent Effect of d-Allulose for Fat Mass Reduction in Adult Humans: A Randomized, Double-Blind, Placebo-Controlled Trial

Abstract
:1. Introduction
2. Materials and Methods
2.1. Subjects
2.2. Sample Size
2.3. Design
2.4. Anthropometric and Biochemical Analyses
2.5. Plasma Lipid Analyses
2.6. Biochemical Analyses
2.7. Statistical Analysis
3. Results
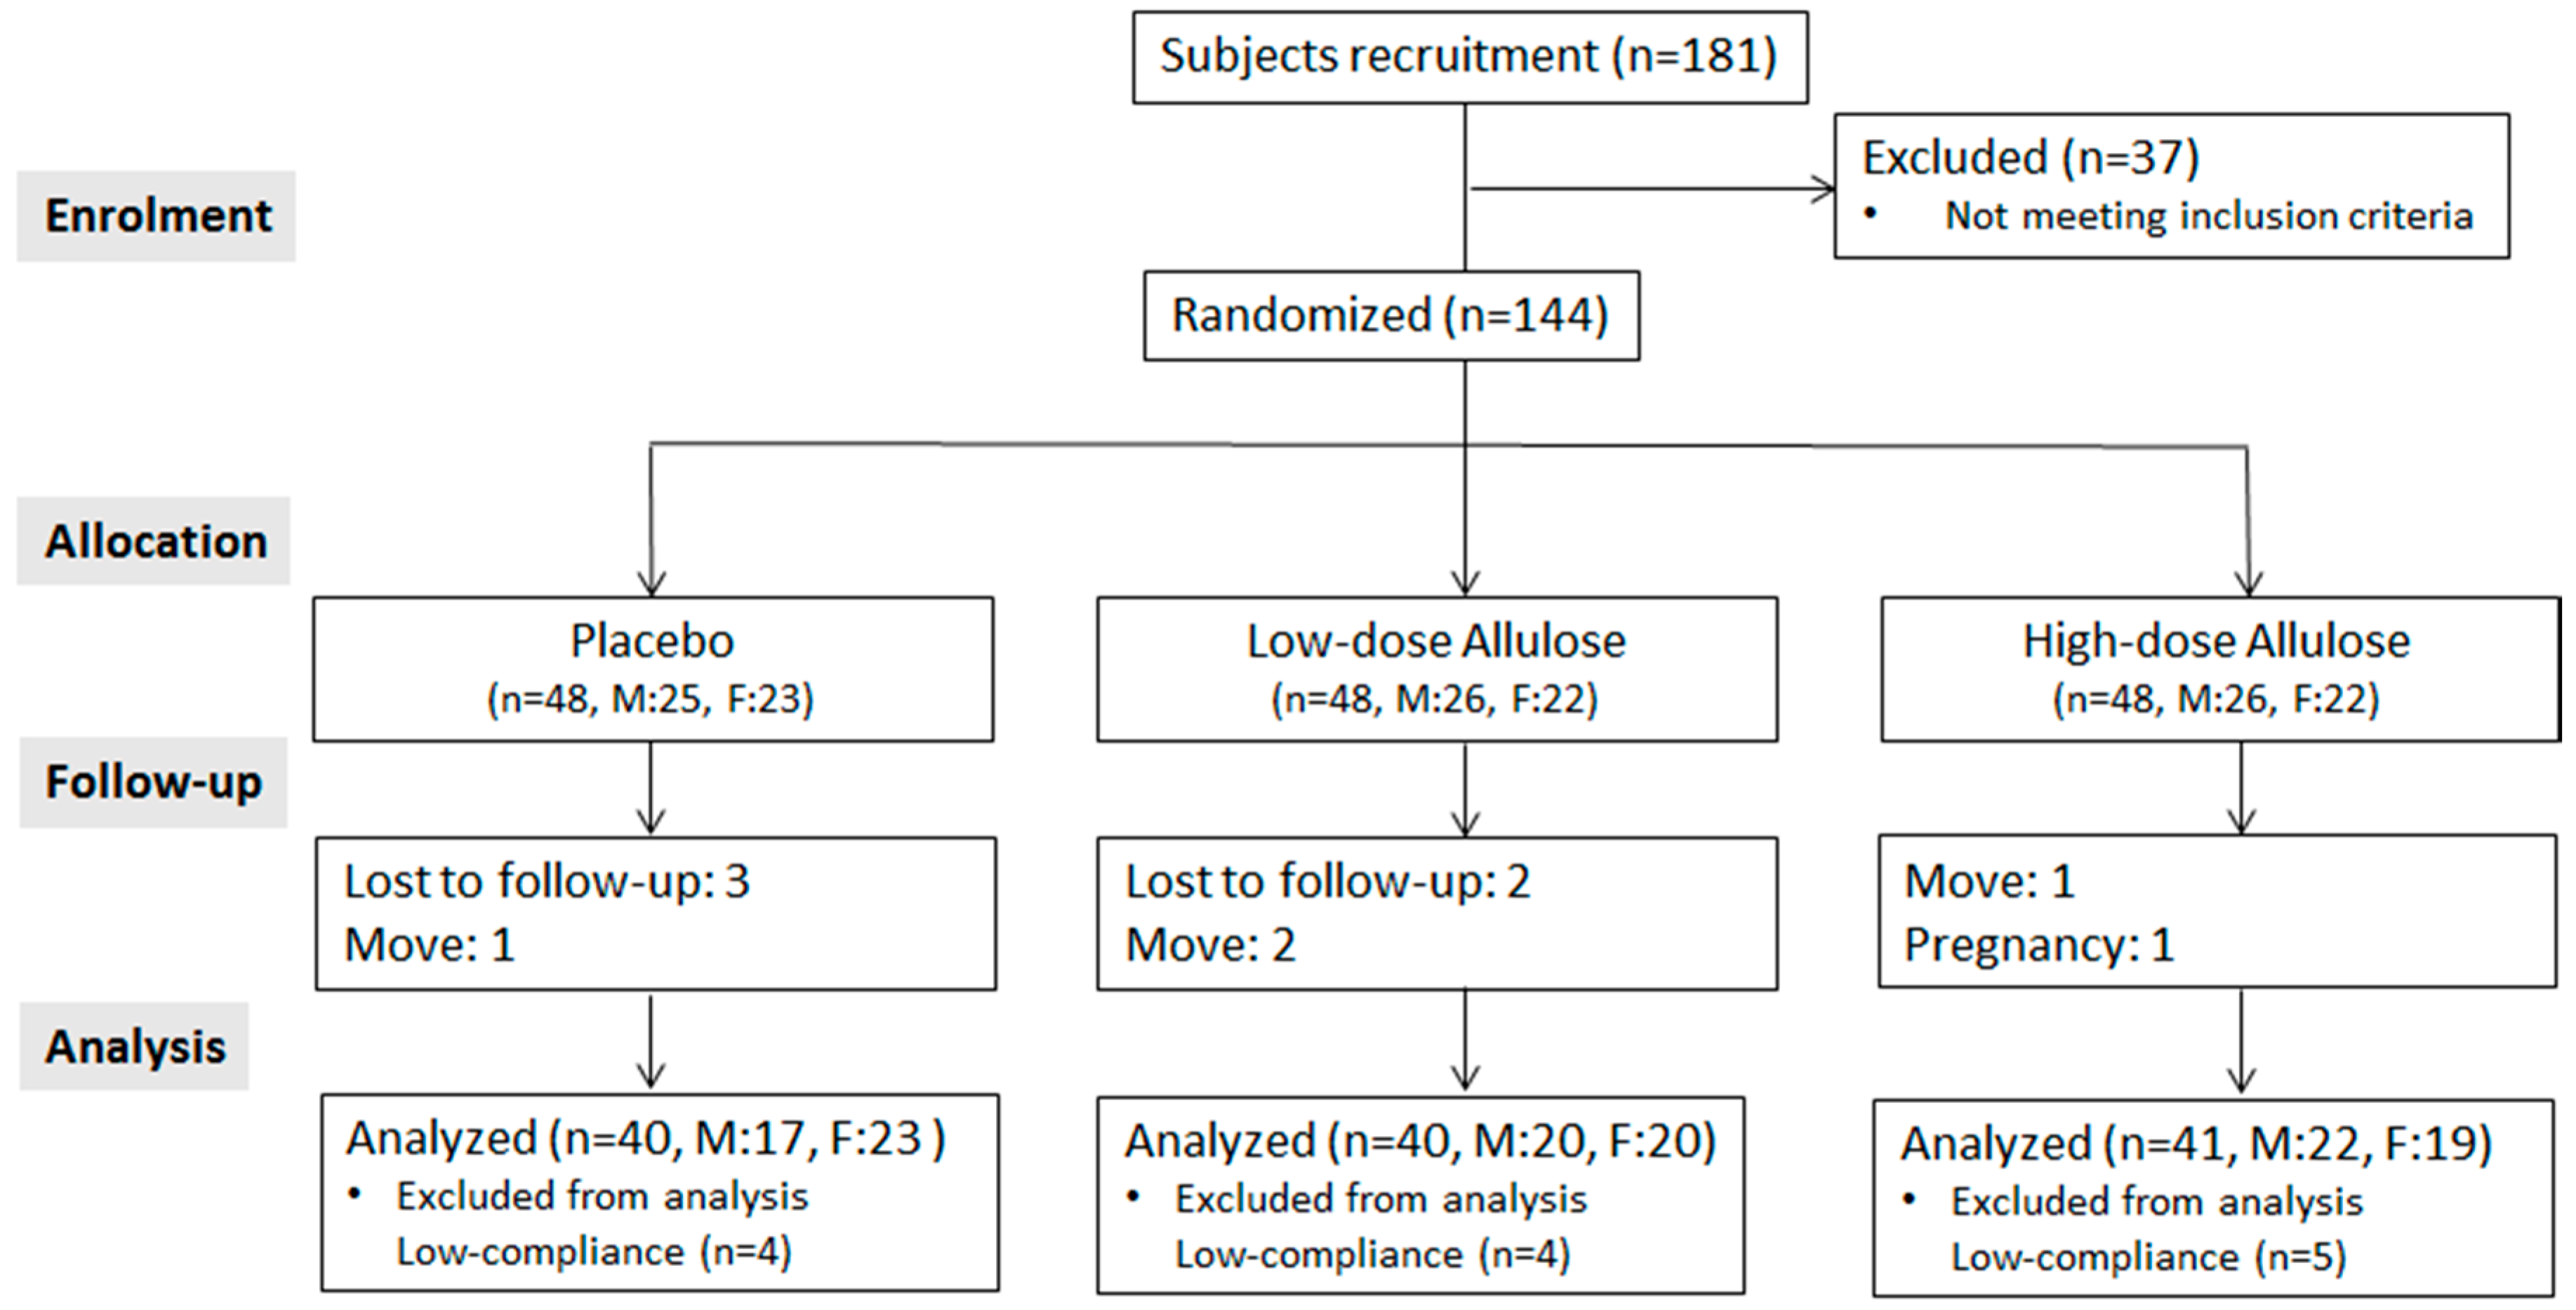
3.1. Study Flow
3.2. Baseline Clinical Characteristics and Nutrient Intake
3.3. Body Composition
3.4. Plasma Lipid Profiles
3.5. Blood, Plasma Glucose, and Related Biomarkers
3.6. Plasma Adipokines and Indirect Markers of Hepatic and Renal Function
4. Discussion
5. Conclusions
Acknowledgments
Author Contributions
Conflicts of Interest
References
- Janssen, I. Morbidity and Mortality Risk Associated with an Overweight BMI in Older Men and Women. Obesity 2007, 15, 1827–1840. [Google Scholar] [CrossRef] [PubMed]
- Reilly, J.J.; Kelly, J. Long-Term Impact of Overweight and Obesity in Childhood and Adolescence on Morbidity and Premature Mortality in Adulthood: Systematic Review. Int. J. Obes. 2011, 35, 891–898. [Google Scholar] [CrossRef] [PubMed]
- Marks, H.H. Influence of Obesity on Morbidity and Mortality. Bull. N. Y. Acad. Med. 1960, 36, 296–312. [Google Scholar] [PubMed]
- Hotamisligil, G.S. Inflammation and Metabolic Disorders. Nature 2006, 444, 860–867. [Google Scholar] [CrossRef] [PubMed]
- Grundy, S.M. Obesity, Metabolic Syndrome, and Cardiovascular Disease. J. Clin. Endocrinol. Metab. 2004, 89, 2595–2600. [Google Scholar] [CrossRef] [PubMed]
- Shin, H.; Kang, H. Recent Trends in the Prevalence of Underweight, Overweight, and Obesity in Korean Adults: The Korean National Health and Nutrition Examination Survey from 1998 to 2014. J. Epidemiol. 2017. [Google Scholar] [CrossRef] [PubMed]
- Ludwig, D.S.; Peterson, K.E.; Gortmaker, S.L. Relation between Consumption of Sugar-Sweetened Drinks and Childhood Obesity: A Prospective, Observational Analysis. Lancet 2001, 357, 505–508. [Google Scholar] [CrossRef]
- Malik, V.S.; Popkin, B.M.; Bray, G.A.; Despres, J.P.; Hu, F.B. Sugar-Sweetened Beverages, Obesity, Type 2 Diabetes Mellitus, and Cardiovascular Disease Risk. Circulation 2010, 121, 1356–1364. [Google Scholar] [CrossRef] [PubMed]
- Bray, G.A.; Nielsen, S.J.; Popkin, B.M. Consumption of high-fructose corn syrup in beverages may play a role in the epidemic of obesity. Am. J. Clin. Nutr. 2004, 79, 537–543. [Google Scholar] [PubMed]
- Kroger, M.; Meister, K.; Kava, R. Low-calorie Sweeteners and Other Sugar Substitutes: A Review of the Safety Issues. Compr. Rev. Food Sci. Food Saf. 2006, 5, 35–47. [Google Scholar] [CrossRef]
- Levin, G.V.; Zehner, L.R.; Saunders, J.P.; Beadle, J.R. Sugar Substitutes: Their Energy Values, Bulk Characteristics, and Potential Health Benefits. Am. J. Clin. Nutr. 1995, 62, 1161S–1168S. [Google Scholar] [CrossRef] [PubMed]
- Tandel, K.R. Sugar Substitutes: Health Controversy over Perceived Benefits. J. Pharmacol. Pharmacother. 2011, 2, 236–243. [Google Scholar] [CrossRef] [PubMed]
- Granström, T.B.; Takata, G.; Tokuda, M.; Izumori, K. Izumoring: A Novel and Complete Strategy for Bioproduction of Rare Sugars. J. Biosci. Bioeng. 2004, 97, 89–94. [Google Scholar] [CrossRef]
- Takeshita, K.; Suga, A.; Takada, G.; Izumori, K. Mass Production of d-Psicose from d-Fructose by a Continuous Bioreactor System using Immobilized d-Tagatose 3-Epimerase. J. Biosci. Bioeng. 2000, 90, 453–455. [Google Scholar] [CrossRef]
- Carlson, S. Generally Recognized As Safe; CJ Cheiljedang, Inc.: Seoul, Korea, 2011; Available online: https://www.accessdata.fda.gov/scripts/fdcc/index.cfm?set=GRASNotices&id=400 (accessed on 25 August 2011).
- Nagata, Y.; Kanasaki, A.; Tamaru, S.; Tanaka, K. d-Psicose, an Epimer of d-Fructose, Favorably Alters Lipid Metabolism in Sprague—Dawley Rats. J. Agric. Food Chem. 2015, 63, 3168–3176. [Google Scholar] [CrossRef] [PubMed]
- Ochiai, M.; Onishi, K.; Yamada, T.; Iida, T.; Matsuo, T. d-Psicose Increases Energy Expenditure and Decreases Body Fat Accumulation in Rats Fed a High-Sucrose Diet. Int. J. Food Sci. Nutr. 2014, 65, 245–250. [Google Scholar] [CrossRef] [PubMed]
- Han, Y.; Han, H.J.; Kim, A.; Choi, J.; Cho, S.; Park, Y.B.; Jung, U.J.; Choi, M. d-Allulose Supplementation Normalized the Body Weight and Fat-pad Mass in Diet-induced Obese Mice Via the Regulation of Lipid Metabolism Under Isocaloric Fed Condition. Mol. Nutr. Food Res. 2016, 60, 1695–1706. [Google Scholar] [CrossRef] [PubMed]
- Matsuo, T.; Baba, Y.; Hashiguchi, M.; Takeshita, K.; Izumori, K.; Suzuki, H. Dietary d-psicose, a C-3 Epimer of D-fructose, Suppresses the Activity of Hepatic Lipogenic Enzymes in Rats. Asia Pac. J. Clin. Nutr. 2001, 10, 233–237. [Google Scholar] [CrossRef] [PubMed]
- Hayashi, N.; Yamada, T.; Takamine, S.; Iida, T.; Okuma, K.; Tokuda, M. Weight Reducing Effect and Safety Evaluation of Rare Sugar Syrup by a Randomized Double-Blind, Parallel-Group Study in Human. J. Funct. Foods 2014, 11, 152–159. [Google Scholar] [CrossRef]
- Faul, F.; Erdfelder, E.; Buchner, A.; Lang, A. Statistical Power Analyses using G*Power 3.1: Tests for Correlation and Regression Analyses. Behav. Res. Methods 2009, 41, 1149–1160. [Google Scholar] [CrossRef] [PubMed]
- Friedewald, W.T.; Levy, R.I.; Fredrickson, D.S. Estimation of the Concentration of Low-Density Lipoprotein Cholesterol in Plasma, without use of the Preparative Ultracentrifuge. Clin. Chem. 1972, 18, 499–502. [Google Scholar] [PubMed]
- Matthews, D.; Hosker, J.; Rudenski, A.; Naylor, B.; Treacher, D.; Turner, R. Homeostasis Model Assessment: Insulin Resistance and Β-Cell Function from Fasting Plasma Glucose and Insulin Concentrations in Man. Diabetologia 1985, 28, 412–419. [Google Scholar] [CrossRef] [PubMed]
- Lee, J.; Son, H.; Ryu, O. Management Status of Cardiovascular Disease Risk Factors for Dyslipidemia among Korean Adults. Yonsei Med. J. 2017, 58, 326–338. [Google Scholar] [CrossRef] [PubMed]
- Tokunaga, K.; Matsuzawa, Y.; Ishikawa, K.; Tarui, S. A Novel Technique for the Determination of Body Fat by Computed Tomography. Int. J. Obes. 1983, 7, 437–445. [Google Scholar] [PubMed]
- Kvist, H.; Chowdhury, B.; Grangard, U.; Tylen, U.; Sjostrom, L. Total and Visceral Adipose-Tissue Volumes Derived from Measurements with Computed Tomography in Adult Men and Women: Predictive Equations. Am. J. Clin. Nutr. 1988, 48, 1351–1361. [Google Scholar] [CrossRef] [PubMed]
- Hossain, M.A.; Kitagaki, S.; Nakano, D.; Nishiyama, A.; Funamoto, Y.; Matsunaga, T.; Tsukamoto, I.; Yamaguchi, F.; Kamitori, K.; Dong, Y. Rare Sugar d-Psicose Improves Insulin Sensitivity and Glucose Tolerance in Type 2 Diabetes Otsuka Long-Evans Tokushima Fatty (OLETF) Rats. Biochem. Biophys. Res. Commun. 2011, 405, 7–12. [Google Scholar] [CrossRef] [PubMed]
- Hossain, A.; Yamaguchi, F.; Hirose, K.; Matsunaga, T.; Sui, L.; Hirata, Y.; Noguchi, C.; Katagi, A.; Kamitori, K.; Dong, Y.; et al. Rare Sugar d-Psicose Prevents Progression and Development of Diabetes in T2DM Model Otsuka Long-Evans Tokushima Fatty Rats. Drug Des. Dev. Ther. 2015, 9, 525–535. [Google Scholar] [CrossRef] [PubMed]
- Fox, C.S.; Massaro, J.M.; Hoffmann, U.; Pou, K.M.; Maurovich-Horvat, P.; Liu, C.Y.; Vasan, R.S.; Murabito, J.M.; Meigs, J.B.; Cupples, L.A.; et al. Abdominal Visceral and Subcutaneous Adipose Tissue Compartments: Association with Metabolic Risk Factors in the Framingham Heart Study. Circulation 2007, 116, 39–48. [Google Scholar] [CrossRef] [PubMed]
- Jones, D.Y.; Judd, J.T.; Taylor, P.R. Campbell WS and Nair PP. Menstrual cycle effect on plasma lipids. Metab. Clin. Exp. 1988, 37, 1–2. [Google Scholar] [CrossRef]
- Svendsen, O.L.; Haarbo, J.; Hassager, C.; Christiansen, C. Accuracy of Measurements of Body Composition by Dual-Energy X-ray Absorptiometry in Vivo. Am. J. Clin. Nutr. 1993, 57, 605–608. [Google Scholar] [CrossRef] [PubMed]

| Placebo (Sucralose) | Low-Dose Allulose | High-Dose Allulose | |
|---|---|---|---|
| Unit: g/30mL | |||
| Sucralose | 0.012 | ||
| Allulose | 4 | 7 | |
| Citric acid | 0.024 | 0.024 | 0.051 |
| Malic acid | 0.006 | 0.006 | 0.015 |
| Sodium citrate | 0.006 | 0.006 | 0.024 |
| Flavor | 0.036 | 0.036 | 0.030 |
| Purified water | 29.922 | 25.928 | 22.880 |
| Calorie (Kcal) | 0 | 0 | 0 |
| Placebo | Low-Allulose | High-Allulose | ||||
|---|---|---|---|---|---|---|
| Male | Female | Male | Female | Male | Female | |
| n | 22 | 18 | 20 | 20 | 22 | 19 |
| Age (year) | 26.09 ± 4.32 | 25.72 ± 7.08 | 26.40 ± 3.75 | 30.40 ± 8.93 | 25.55 ± 4.14 | 27.74 ± 8.51 |
| Height (cm) | 174.95 ± 6.06 | 162.43 ± 4.62 | 174.87 ± 5.08 | 163.10 ± 6.30 | 175.17 ± 4.48 | 161.39 ± 4.99 |
| Systolic BP (mmHg) | 135.41 ± 13.18 | 118.50 ± 14.78 | 132.50 ± 15.10 | 120.05 ± 9.48 | 137.09 ± 11.38 | 114.26 ± 9.84 |
| Diastolic BP (mmHg) | 77.36 ± 10.28 | 66.33 ± 13.41 | 75.95 ± 9.95 | 72.45 ± 9.94 | 79.73 ± 10.41 | 67.37 ± 8.67 |
| FBG (mg/dL) | 100.24 ± 11.28 | 96.95 ± 11.53 | 100.45 ± 10.13 | 101.20 ± 10.80 | 101.64 ± 10.19 | 102.68 ± 10.46 |
| Placebo (M:17, F:23) | Low-Allulose (M:20, F:20) | High-Allulose (M:22, F:19) | ||||
|---|---|---|---|---|---|---|
| Baseline | Follow Up | Baseline | Follow Up | Baseline | Follow Up | |
| Physical activity 1 | 2.13 ± 0.10 | 2.18 ± 0.10 | 2.10 ± 0.11 | 2.08 ± 0.10 | 2.20 ± 0.11 | 2.17 ±0.11 |
| Energy (kcal/day) | 2440.37 ± 57.93 | 2450.05 ± 52.69 | 2433.30 ± 62.84 | 2438.40 ± 63.58 | 2421.04 ± 60.74 | 2429.10 ± 58.06 |
| Protein (g/day) | 112.16 ± 67.37 | 104.88 ± 17.66 | 98.96 ± 13.88 | 103.88 ± 17.58 | 104.89 ± 13.24 | 106.34 ± 13.59 |
| Fat (g/day) | 75.80 ± 17.07 | 79.81 ± 17.79 | 74.74 ± 16.78 | 77.49 ± 17.33 | 78.00 ± 15.78 | 74.79 ± 16.59 |
| Carbohydrate (g/day) | 340.05 ± 46.92 | 336.02 ± 44.41 | 340.97 ± 39.03 | 339.58 ± 40.86 | 321.87 ± 44.06 | 334.64 ± 45.84 |
| Cholesterol (mg/day) | 672.96 ± 196.74 | 734.50 ± 190.73 | 698.73 ± 183.52 | 783.43 ± 281.88 | 742.84 ± 175.68 | 734.03 ± 190.73 |
| Placebo (M:17, F:23) | Low-Allulose (M:20, F:20) | High-Allulose (M:22, F:19) | p-Value | |
|---|---|---|---|---|
| Mean ± SD | Mean ± SD | Mean ± SD | ||
| Body weight (kg) | ||||
| Baseline | 77.14 ± 11.19 | 79.00 ± 14.72 | 76.63 ± 11.38 | |
| Follow up | 76.78 ± 12.20 | 78.02 ± 14.56 *** | 75.35 ± 11.33 ### | 0.064 1 |
| Change from baseline | −0.36 ± 1.96 | −0.98 ± 1.51 | −1.28 ± 1.84 | |
| BMI (kg/m2) | ||||
| Baseline | 26.83 ± 2.81 | 27.45 ± 3.21 | 26.79 ± 2.47 | |
| Follow up | 26.70 ± 3.14 | 27.13 ± 3.16 ** | 26.30 ± 2.49 ### | 0.047 1 |
| Change from baseline | −0.13 ± 0.78 | −0.32 ± 0.62 | −0.48 ± 0.69 | |
| Difference (Low vs. placebo) (LSmean ± SE) | −0.24 ± 0.15 | 0.224 2 | ||
| Difference (High vs. placebo) (LSmean ± SE) | −0.38 ± 0.15 | 0.027 2 | ||
| BFP (%) | ||||
| Baseline | 29.61 ± 4.99 | 30.66 ± 4.26 | 29.74 ± 4.66 | |
| Follow up | 29.34 ± 4.99 | 29.63 ± 4.41 *** | 28.73 ± 4.53 ### | 0.027 1 |
| Change from baseline | −0.27 ± 1.16 | −1.03 ± 1.44 | −1.01 ± 1.51 | |
| Difference (Low vs. placebo) (LSmean ± SE) | −0.71 ± 0.31 | 0.042 2 | ||
| Difference (High vs. placebo) (LSmean ± SE) | −0.74 ± 0.31 | 0.033 2 | ||
| Body fat mass (kg) | ||||
| Baseline | 22.86 ± 5.39 | 24.19 ± 5.63 | 22.63 ± 4.20 | |
| Follow up | 22.52 ± 5.49 | 23.05 ± 5.36 *** | 21.52 ± 4.23 ### | 0.018 1 |
| Change from baseline | −0.34 ± 1.10 | −1.14 ± 1.46 | −1.11 ± 1.53 | |
| Difference (Low vs. placebo) (LSmean ± SE) | −0.74 ± 0.31 | 0.033 2 | ||
| Difference (High vs. placebo) (LSmean ± SE) | −0.78 ± 0.30 | 0.021 2 | ||
| Lean body mass (kg) | ||||
| Baseline | 54.28 ± 8.82 | 54.81 ± 10.82 | 54.01 ± 9.72 | |
| Follow up | 54.26 ± 9.67 | 54.97 ± 11.11 | 53.83 ± 9.55 | 0.595 1 |
| Change from baseline | −0.02 ± 1.65 | 0.16 ± 1.30 | −0.18 ± 1.30 | |
| Waist (cm) | ||||
| Baseline | 88.40 ± 7.46 | 91.11 ± 9.54 | 89.84 ± 8.78 | |
| Follow up | 88.26 ± 7.93 | 90.53 ± 8.66 | 88.26 ± 9.01 | 0.298 1 |
| Change from baseline | −0.14 ± 3.20 | −0.49 ± 3.61 | −1.59 ± 5.74 | |
| Hip (cm) | ||||
| Baseline | 103.54 ± 6.04 | 103.80 ± 5.60 | 102.24 ± 5.52 | |
| Follow up | 102.86 ± 5.81 | 102.59 ± 5.35 | 101.65 ± 5.68 | 0.720 1 |
| Change from baseline | −0.68 ± 2.21 | −1.21 ± 2.86 | −0.60 ± 3.67 | |
| WHR | ||||
| Baseline | 0.85 ± 0.05 | 0.88 ± 0.07 | 0.88 ± 0.06 | |
| Follow up | 0.86 ± 0.06 | 0.88 ± 0.06 | 0.87 ± 0.07 | 0.225 1 |
| Change from baseline | 0.00 ± 0.03 | 0.01 ± 0.04 | −0.01 ± 0.06 | |
| Systolic BP (mmHg) | ||||
| Baseline | 127.80 ± 16.16 | 126.28 ± 13.95 | 126.51 ± 15.63 | |
| Follow up | 122.55 ± 12.66 | 122.85 ± 12.86 | 119.07 ± 15.38 | 0.194 1 |
| Change from baseline | −5.25 ± 11.42 | −3.43 ± 10.31 | −7.44 ± 12.55 | |
| Diastolic BP (mmHg) | ||||
| Baseline | 72.40 ± 12.89 | 74.20 ± 9.98 | 74.00 ± 11.39 | |
| Follow up | 71.20 ± 11.10 | 68.53 ± 10.14 | 68.95 ± 12.40 | 0.163 1 |
| Change from baseline | −1.20 ± 11.95 | −5.68 ± 9.99 | −5.05 ± 9.43 |
| Placebo (n = 26) | Low-Allulose (n = 29) | High-Allulose (n = 26) | p-Value | ||||
|---|---|---|---|---|---|---|---|
| M: 17 (65%) | F: 9 (35%) | M: 17 (59%) | F: 12 (41%) | M: 15 (55%) | F: 12 (45%) | ||
| Mean ± SD | Mean ± SD | Mean ± SD | |||||
| Total abdominal fat (cm2) | |||||||
| Baseline | 322.85 ± 100.33 | 378.94 ± 107.39 | 333.83 ± 75.93 | ||||
| Follow up | 322.95 ± 100.59 | 364.64 ± 101.67 * | 312.53 ± 72.35 ### | 0.052 1 | |||
| Change from baseline | 0.11 ± 30.61 | −14.31 ± 30.89 | −21.31 ± 30.45 | ||||
| Difference (Low vs. placebo) (LSmean ± SE) | −9.78 ± 8.29 | 0.242 2 | |||||
| Difference (High vs. placebo) (LSmean ± SE) | −20.51 ± 8.276 | 0.015 2 | |||||
| Subcutaneous fat (cm2) | |||||||
| Baseline | 215.53 ± 64.78 | 254.15 ± 84.87 | 229.45 ± 72.59 | ||||
| Follow up | 214.87 ± 66.28 | 246.89 ± 79.37 | 208.86 ± 66.66 ### | 0.010 1 | |||
| Change from baseline | −0.67 ± 21.13 | −7.26 ± 26.31 | −20.59 ± 24.80 | ||||
| Difference (Low vs. placebo) (LSmean ± SE) | −2.76 ± 6.42 | 0.874 2 | |||||
| Difference (High vs. placebo) (LSmean ± SE) | −18.54 ± 6.47 | 0.010 2 | |||||
| Visceral fat (cm2) | |||||||
| Baseline | 107.31 ± 54.46 | 124.79 ± 40.52 | 104.38 ± 36.05 | ||||
| Follow up | 108.09 ± 58.64 | 117.74 ± 34.38 | 103.67 ± 35.30 | 0.446 1 | |||
| Change from baseline | 0.77 ± 16.54 | −7.05 ± 21.59 | −0.72 ± 16.52 | ||||
| Placebo (M:17, F:23) | Low-Allulose (M:20, F:20) | High-Allulose (M:22, F:19) | p-Value | |
|---|---|---|---|---|
| Mean ± SD | Mean ± SD | Mean ± SD | ||
| Triglyceride (mmol/L) | ||||
| Baseline | 2.00 ± 0.80 | 2.25 ± 1.05 | 2.29 ± 0.90 | |
| Follow up | 2.17 ± 1.41 | 2.26 ± 1.13 | 2.10 ± 0.82 | 0.160 1 |
| Change from baseline | 0.17 ± 0.90 | 0.15 ± 0.70 | −0.19 ± 0.72 | |
| Total-C (mmol/L) | ||||
| Baseline | 4.82 ± 0.68 | 5.14 ± 1.01 | 5.08 ± 1.02 | |
| Follow up | 4.82 ± 0.96 | 4.91 ± 1.08 | 5.15 ± 0.90 | 0.338 1 |
| Change from baseline | 0.00 ± 1.07 | −0.23 ± 1.01 | 0.07 ± 0.76 | |
| HDL-C (mmol/L) | ||||
| Baseline | 0.77 ± 0.02 | 0.76 ± 0.03 | 0.85 ± 0.02 | |
| Follow up | 0.78 ± 0.02 | 0.74 ± 0.02 | 0.86 ± 0.03 | 0.054 1 |
| Change from baseline | 0.01 ± 0.02 | −0.02 ± 0.03 | 0.01 ± 0.03 | |
| Non-HDL-C (mmol/L) | ||||
| Baseline | 4.05 ± 0.11 | 4.38 ± 0.16 | 4.23 ± 0.16 | |
| Follow up | 4.04 ± 0.15 | 4.17 ± 0.18 | 4.29 ± 0.15 | 0.561 1 |
| Change from baseline | −0.01 ± 0.17 | −0.21 ± 0.17 | 0.06 ± 0.12 | |
| LDL-C (mmol/L) | ||||
| Baseline | 3.65 ± 0.11 | 3.93 ± 0.16 | 3.78 ± 0.16 | |
| Follow up | 3.60 ± 0.17 | 3.71 ± 0.18 | 3.87 ± 0.15 | 0.45 1 |
| Change from baseline | −0.05 ± 0.17 | −0.21 ± 0.17 | 0.10 ± 0.13 | |
| Apo A-1 (mg/dL) | ||||
| Baseline | 102.67 ± 5.25 | 124.97 ± 1.97 | 137.41 ± 2.71 | |
| Follow up | 105.26 ± 7.31 | 119.99 ± 3.74 | 138.51 ± 2.70 | 0.180 1 |
| Change from baseline | 2.58 ± 6.23 | −4.97 ± 4.11 | 1.10 ± 3.01 | |
| Lp-PLA2 (ng/mL) | ||||
| Baseline | 5.46 ± 2.47 | 7.38 ± 4.07 | 5.53 ± 3.31 | |
| Follow up | 6.21 ± 2.78 | 8.19 ± 4.35 | 5.90 ± 3.66 | 0.228 1 |
| Change from baseline | 0.76 ± 2.73 | 0.81 ± 4.52 | 0.37 ± 2.57 | |
| AI | ||||
| Baseline | 0.84 ± 0.04 | 0.85 ± 0.05 | 0.83 ± 0.05 | |
| Follow up | 0.80 ± 0.16 | 0.83 ± 0.12 | 0.83 ± 0.05 | 0.601 1 |
| Change from baseline | 0.04 ± 0.25 | −0.02 ± 0.12 | 0.00 ± 0.05 | |
| FFA (uEq/dL) | ||||
| Baseline | 442.87 ± 59.62 | 484.82 ± 47.12 | 454.72 ± 51.22 | |
| Follow up | 446.62 ± 59.25 | 489.12 ± 40.23 | 455.78 ± 55.55 | 0.803 1 |
| Change from baseline | 3.75 ± 66.20 | 4.30 ± 45.78 | 1.06 ± 59.37 |
| Placebo (M:17, F:23) | Low-Allulose (M:20, F:20) | High-Allulose (M:22, F:19) | p-Value | |
|---|---|---|---|---|
| Mean ± SD | Mean ± SD | Mean ± SD | ||
| FBG (mg/dL) | ||||
| Baseline | 97.89 ± 10.86 | 100.93 ± 10.19 | 102.12 ± 10.20 | |
| Follow up | 100.45 ± 17.76 | 97.40 ± 9.68 | 101.05 ± 17.26 | 0.489 1 |
| Change from baseline | 2.55 ± 18.39 | −3.53 ± 12.44 | −1.07 ± 19.93 | |
| HbA1c (%) | ||||
| Baseline | 5.39 ± 0.29 | 5.49 ± 0.35 | 5.50 ± 0.29 | |
| Follow up | 5.36 ± 0.29 | 5.45 ± 0.31 | 5.49 ± 0.32 | 0.583 1 |
| Change from baseline | −0.03 ± 0.23 | −0.04 ± 0.23 | −0.01 ± 0.22 | |
| Plasma glucose (mmol/L) | ||||
| Baseline | 5.17 ± 0.40 | 5.25 ± 0.0 | 5.34 ± 0.47 | |
| Follow up | 5.17 ± 0.52 | 5.12 ± 0.63 | 5.21 ± 0.63 | 0.814 1 |
| Change from baseline | 0.01 ± 0.50 | −0.13 ± 1.16 | −0.13 ± 0.51 | |
| Insulin (ng/mL) | ||||
| Baseline | 1.00 ± 0.60 | 1.17 ± 0.83 | 1.20 ± 1.05 | |
| Follow up | 1.09 ± 0.83 | 1.04 ± 0.73 | 1.33 ± 1.56 | 0.431 1 |
| Change from baseline | 0.09 ± 0.73 | −0.13 ± 0.83 | 0.13 ± 1.22 | |
| HOMA-IR | ||||
| Baseline | 2.34 ± 1.35 | 2.82 ± 2.16 | 2.78 ± 2.71 | |
| Follow up | 2.37 ± 1.68 | 2.43 ± 1.71 | 2.71 ± 2.64 | 0.747 1 |
| Change from baseline | 0.03 ± 1.47 | −0.40 ± 2.11 | −0.06 ± 2.48 | |
| Ghrelin (pg/mL) | ||||
| Baseline | 199.10 ± 68.76 | 304.56 ± 162.86 | 208.04 ± 109.80 | |
| Follow up | 203.81 ± 75.29 | 288.31 ± 139.16 | 206.36 ± 94.09 | 0.753 1 |
| Change from baseline | 4.71 ± 41.92 | −16.25 ± 120.94 | −1.64 ± 72.51 | |
| GIP (pg/mL) | ||||
| Baseline | 62.92 ± 54.04 | 113.71 ± 54.70 | 92.18 ± 49.97 | |
| Follow up | 77.06 ± 49.96 | 118.23 ± 54.84 | 95.47 ± 51.02 | 0.160 1 |
| Change from baseline | 13.79 ± 46.55 | 2.02 ± 242.35 | 3.29 ± 66.19 | |
| PAI-1 (ng/mL) | ||||
| Baseline | 6.00 ± 2.94 | 8.55 ± 3.16 | 7.15 ± 3.03 | |
| Follow up | 5.27 ± 3.02 | 7.64 ± 4.10 | 6.26 ± 2.99 | 0.565 1 |
| Change from baseline | −0.73 ± 2.92 | −0.90 ± 2.95 | −0.89 ± 2.89 |
| Placebo (M:17, F:23) | Low-Allulose (M:20, F:20) | High-Allulose (M:22, F:19) | p-Value | |
|---|---|---|---|---|
| Mean ± SD | Mean ± SD | Mean ± SD | ||
| Leptin (ng/mL) | ||||
| Baseline | 2.79 ± 2.20 | 3.63 ± 2.54 | 2.67 ± 2.23 | |
| Follow up | 2.50 ± 2.68 | 3.78 ± 2.31 | 2.86 ± 2.46 | 0.231 1 |
| Change from baseline | −0.29 ± 1.48 | 0.15 ± 2.05 | 0.19 ± 1.08 | |
| Resistin (ng/mL) | ||||
| Baseline | 8.45 ± 4.44 | 7.09 ± 3.89 | 6.67 ± 2.86 | |
| Follow up | 9.28 ± 4.84 | 7.16 ± 3.82 | 7.24 ± 2.90 | 0.063 1 |
| Change from baseline | 0.82 ± 2.11 | −0.09 ± 1.15 | 0.57 ± 1.30 | |
| Adiponectin (mg/mL) | ||||
| Baseline | 3.46 ± 2.04 | 4.81 ± 3.88 | 3.85 ± 3.05 | |
| Follow up | 3.30 ± 1.98 | 4.44 ± 3.54 | 3.37 ± 2.48 | 0.558 1 |
| Change from baseline | −0.16 ± 2.14 | −0.37 ± 2.33 | −0.48 ± 2.03 | |
| TNF-alpha (pg/mL) | ||||
| Baseline | 13.18 ± 4.37 | 13.93 ± 3.36 | 13.16 ± 2.81 | |
| Follow up | 13.02 ± 2.71 | 13.98 ± 4.17 | 13.24 ± 2.43 | 0.611 1 |
| Change from baseline | −0.16 ± 3.10 | 0.04 ± 3.51 | 0.08 ± 3.27 | |
| MCP 1 (pg/mL) | ||||
| Baseline | 23.71 ± 8.69 | 30.50 ± 10.06 | 26.13 ± 8.31 | |
| Follow up | 22.23 ± 7.90 | 28.98 ± 11.80 | 26.33 ± 9.01 | 0.376 1 |
| Change from baseline | −1.49 ± 7.52 | −1.52 ± 8.65 | 0.19 ± 8.58 |
| Placebo (M:17, F:23) | Low-Allulose (M:20, F:20) | High-Allulose (M:22, F:19) | p-Value | |
|---|---|---|---|---|
| Mean ± SD | Mean ± SD | Mean ± SD | ||
| GOT (AST) (Karman/mL) | ||||
| Baseline | 20.04 ± 0.96 | 16.76 ± 1.12 | 18.39 ± 0.94 | |
| Follow up | 20.04 ± 1.11 | 16.06 ± 1.25 | 18.00 ± 0.97 | 0.504 1 |
| Change from baseline | −0.01 ± 0.42 | −0.70 ± 1.06 | −0.38 ± 0.66 | |
| GPT (ALT) (Karman/mL) | ||||
| Baseline | 15.47 ± 2.02 | 11.58 ± 1.43 | 11.44 ± 1.30 | |
| Follow up | 14.25 ± 1.74 | 10.63 ± 1.28 | 10.95 ± 1.14 | 0.786 1 |
| Change from baseline | −1.22 ± 0.71 | −0.95 ± 0.86 | −0.49 ± 1.05 | |
| Albumin (g/dL) | ||||
| Baseline | 4.59 ± 0.26 | 4.69 ± 0.29 | 4.68 ± 0.21 | |
| Follow up | 4.69 ± 0.29 | 4.76 ± 0.36 | 4.82 ± 0.25 | 0.965 1 |
| Change from baseline | 0.10 ± 0.16 | 0.07 ± 0.27 | 0.14 ± 0.16 | |
| Creatinine (mg/dL) | ||||
| Baseline | 6.67 ± 1.00 | 6.34 ± 0.75 | 6.63 ± 0.55 | |
| Follow up | 6.92 ± 1.01 | 6.28 ± 0.60 | 6.70 ± 0.65 | 0.838 1 |
| Change from baseline | 0.25 ± 0.30 | −0.06 ± 0.55 | 0.08 ± 0.53 | |
| Total Bilirubin (mg/dL) | ||||
| Baseline | 0.49 ± 0.20 | 0.50 ± 0.29 | 0.49 ± 0.23 | |
| Follow up | 0.52 ± 0.19 | 0.56 ± 0.23 | 0.49 ± 0.22 | 0.385 1 |
| Change from baseline | 0.03 ± 0.20 | 0.06 ± 0.30 | 0.00 ± 0.25 | |
| γ-GTP (U/L) | ||||
| Baseline | 25.51 ± 24.89 | 28.28 ± 21.40 | 27.02 ± 22.03 | |
| Follow up | 26.45 ± 22.88 | 21.13 ± 17.23 | 26.29 ± 25.24 | 0.249 1 |
| Change from baseline | 0.95 ± 7.60 | −7.15 ± 17.03 | −0.73 ± 33.62 | |
© 2018 by the authors. Licensee MDPI, Basel, Switzerland. This article is an open access article distributed under the terms and conditions of the Creative Commons Attribution (CC BY) license (http://creativecommons.org/licenses/by/4.0/).
Share and Cite
Han, Y.; Kwon, E.-Y.; Yu, M.K.; Lee, S.J.; Kim, H.-J.; Kim, S.-B.; Kim, Y.H.; Choi, M.-S. A Preliminary Study for Evaluating the Dose-Dependent Effect of d-Allulose for Fat Mass Reduction in Adult Humans: A Randomized, Double-Blind, Placebo-Controlled Trial. Nutrients 2018, 10, 160. https://doi.org/10.3390/nu10020160
Han Y, Kwon E-Y, Yu MK, Lee SJ, Kim H-J, Kim S-B, Kim YH, Choi M-S. A Preliminary Study for Evaluating the Dose-Dependent Effect of d-Allulose for Fat Mass Reduction in Adult Humans: A Randomized, Double-Blind, Placebo-Controlled Trial. Nutrients. 2018; 10(2):160. https://doi.org/10.3390/nu10020160
Chicago/Turabian StyleHan, Youngji, Eun-Young Kwon, Mi Kyeong Yu, Seon Jeong Lee, Hye-Jin Kim, Seong-Bo Kim, Yang Hee Kim, and Myung-Sook Choi. 2018. "A Preliminary Study for Evaluating the Dose-Dependent Effect of d-Allulose for Fat Mass Reduction in Adult Humans: A Randomized, Double-Blind, Placebo-Controlled Trial" Nutrients 10, no. 2: 160. https://doi.org/10.3390/nu10020160
APA StyleHan, Y., Kwon, E.-Y., Yu, M. K., Lee, S. J., Kim, H.-J., Kim, S.-B., Kim, Y. H., & Choi, M.-S. (2018). A Preliminary Study for Evaluating the Dose-Dependent Effect of d-Allulose for Fat Mass Reduction in Adult Humans: A Randomized, Double-Blind, Placebo-Controlled Trial. Nutrients, 10(2), 160. https://doi.org/10.3390/nu10020160