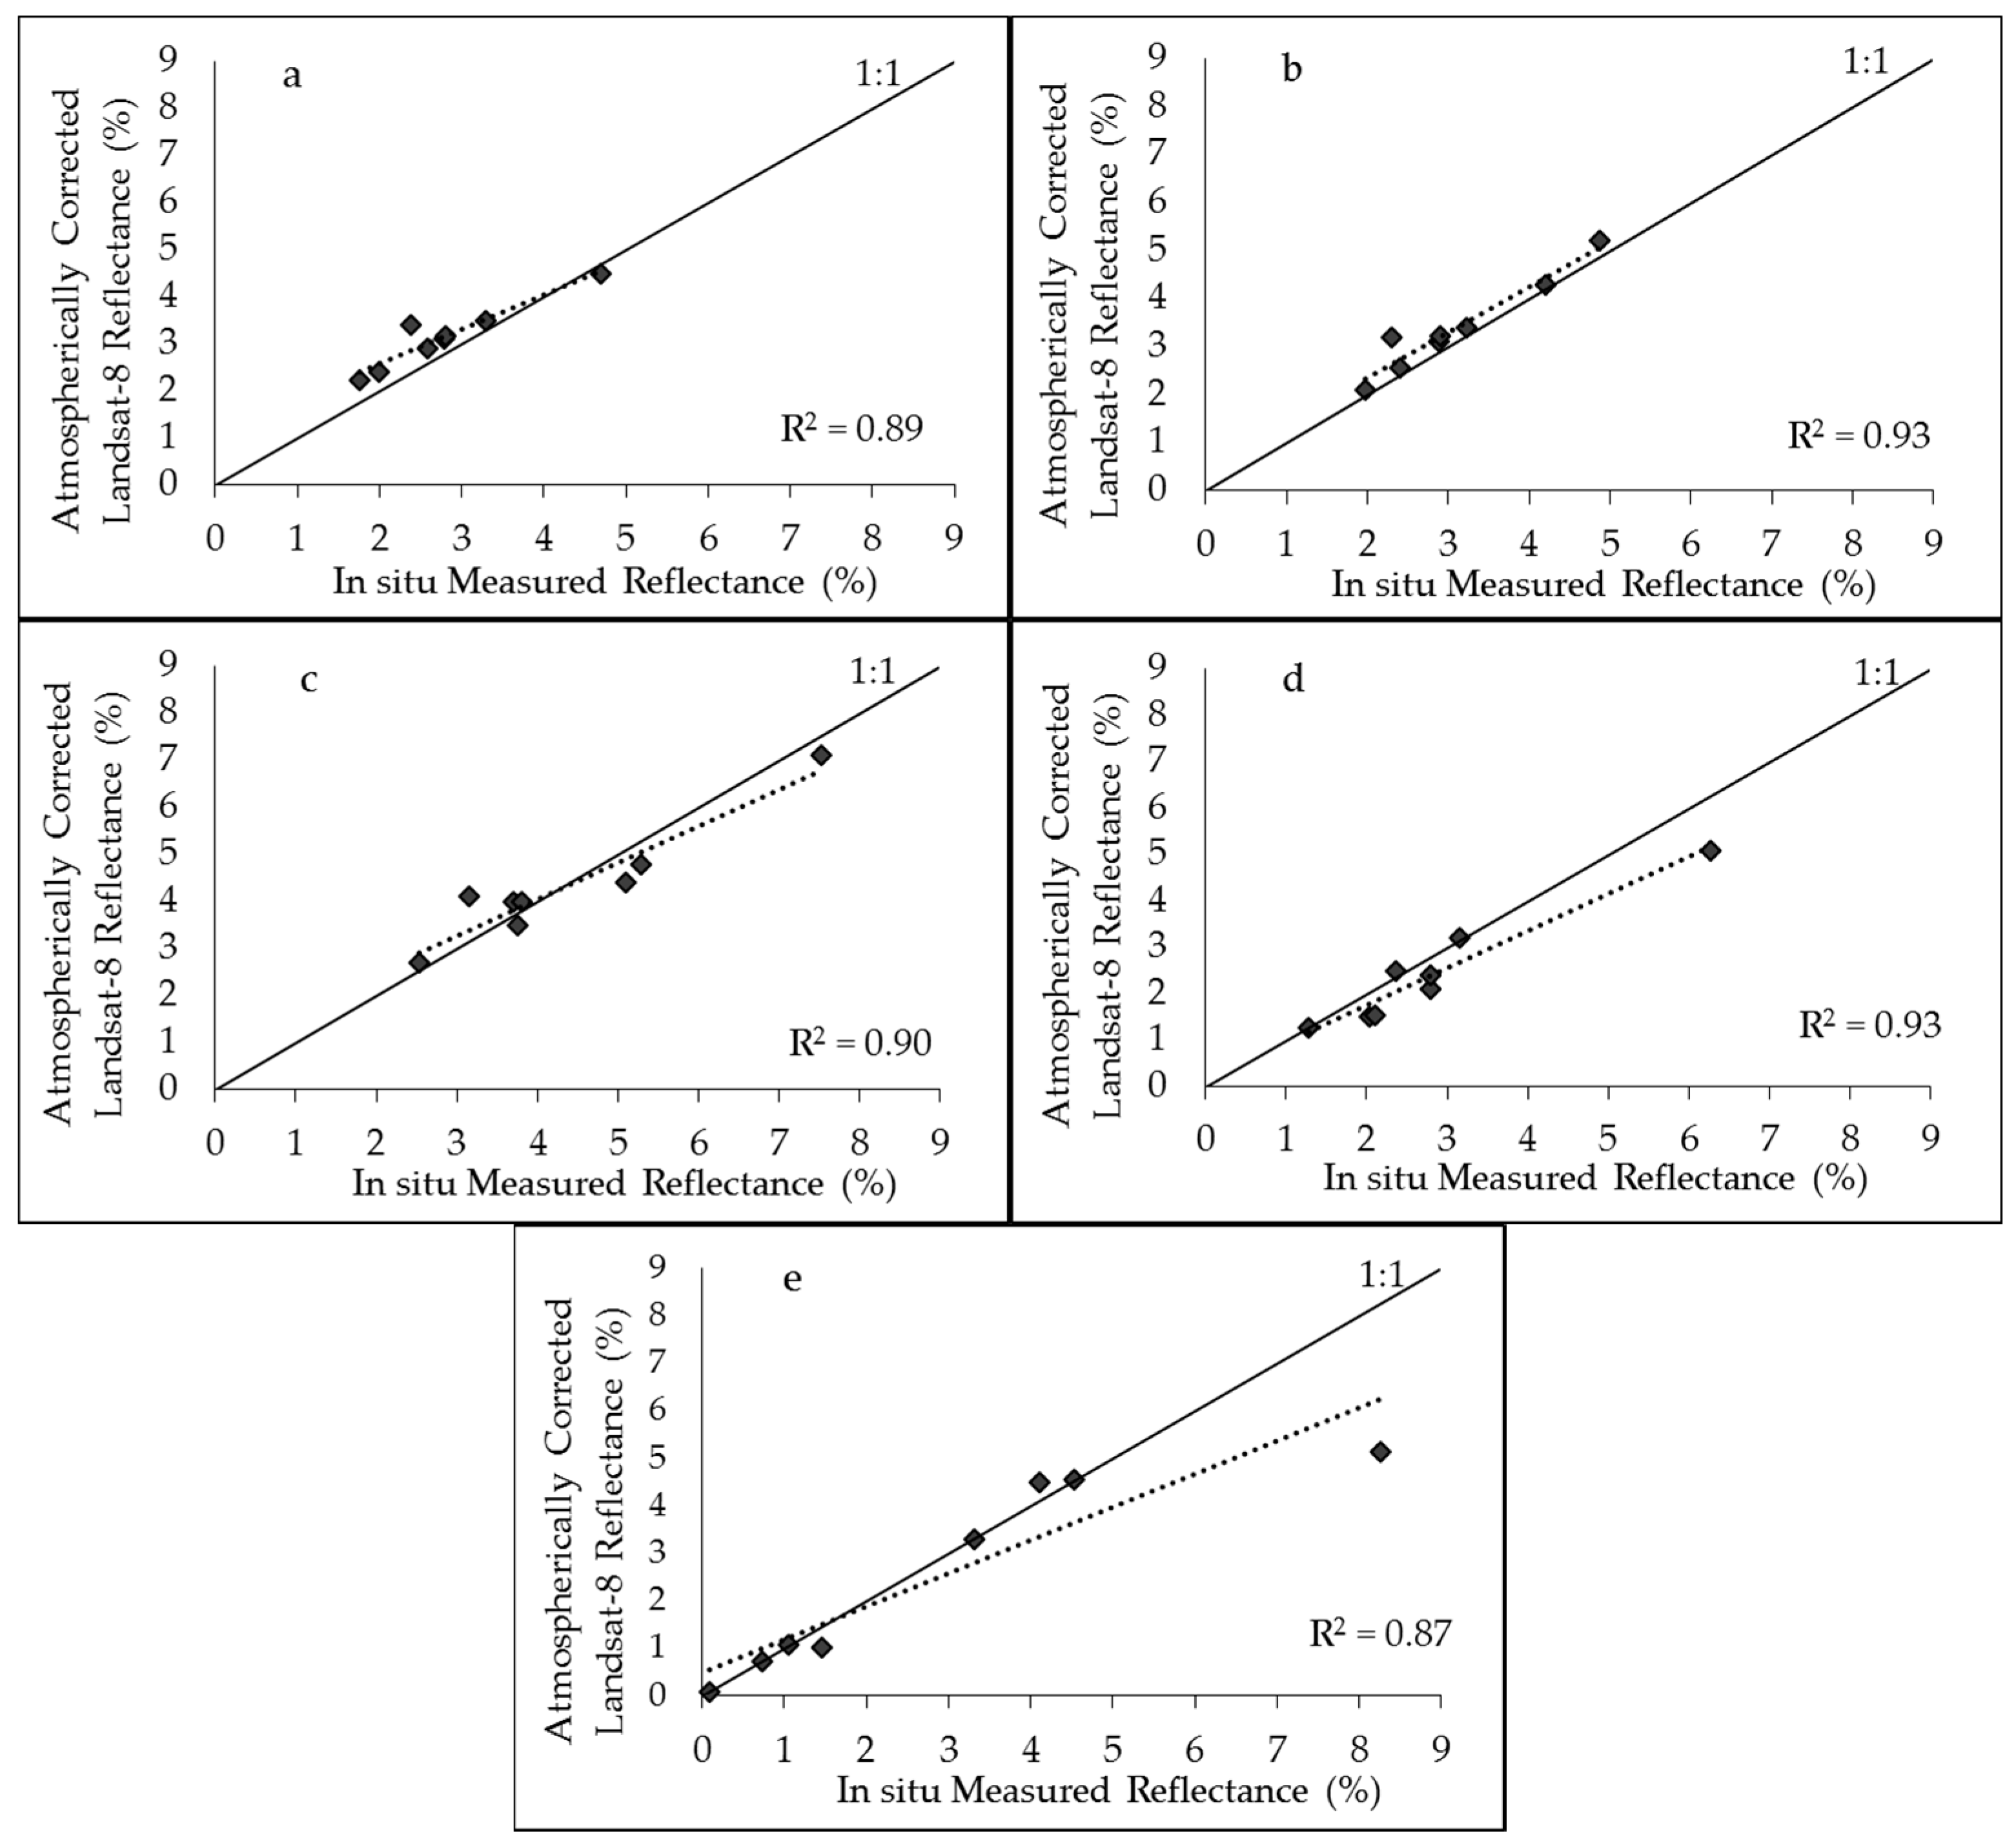
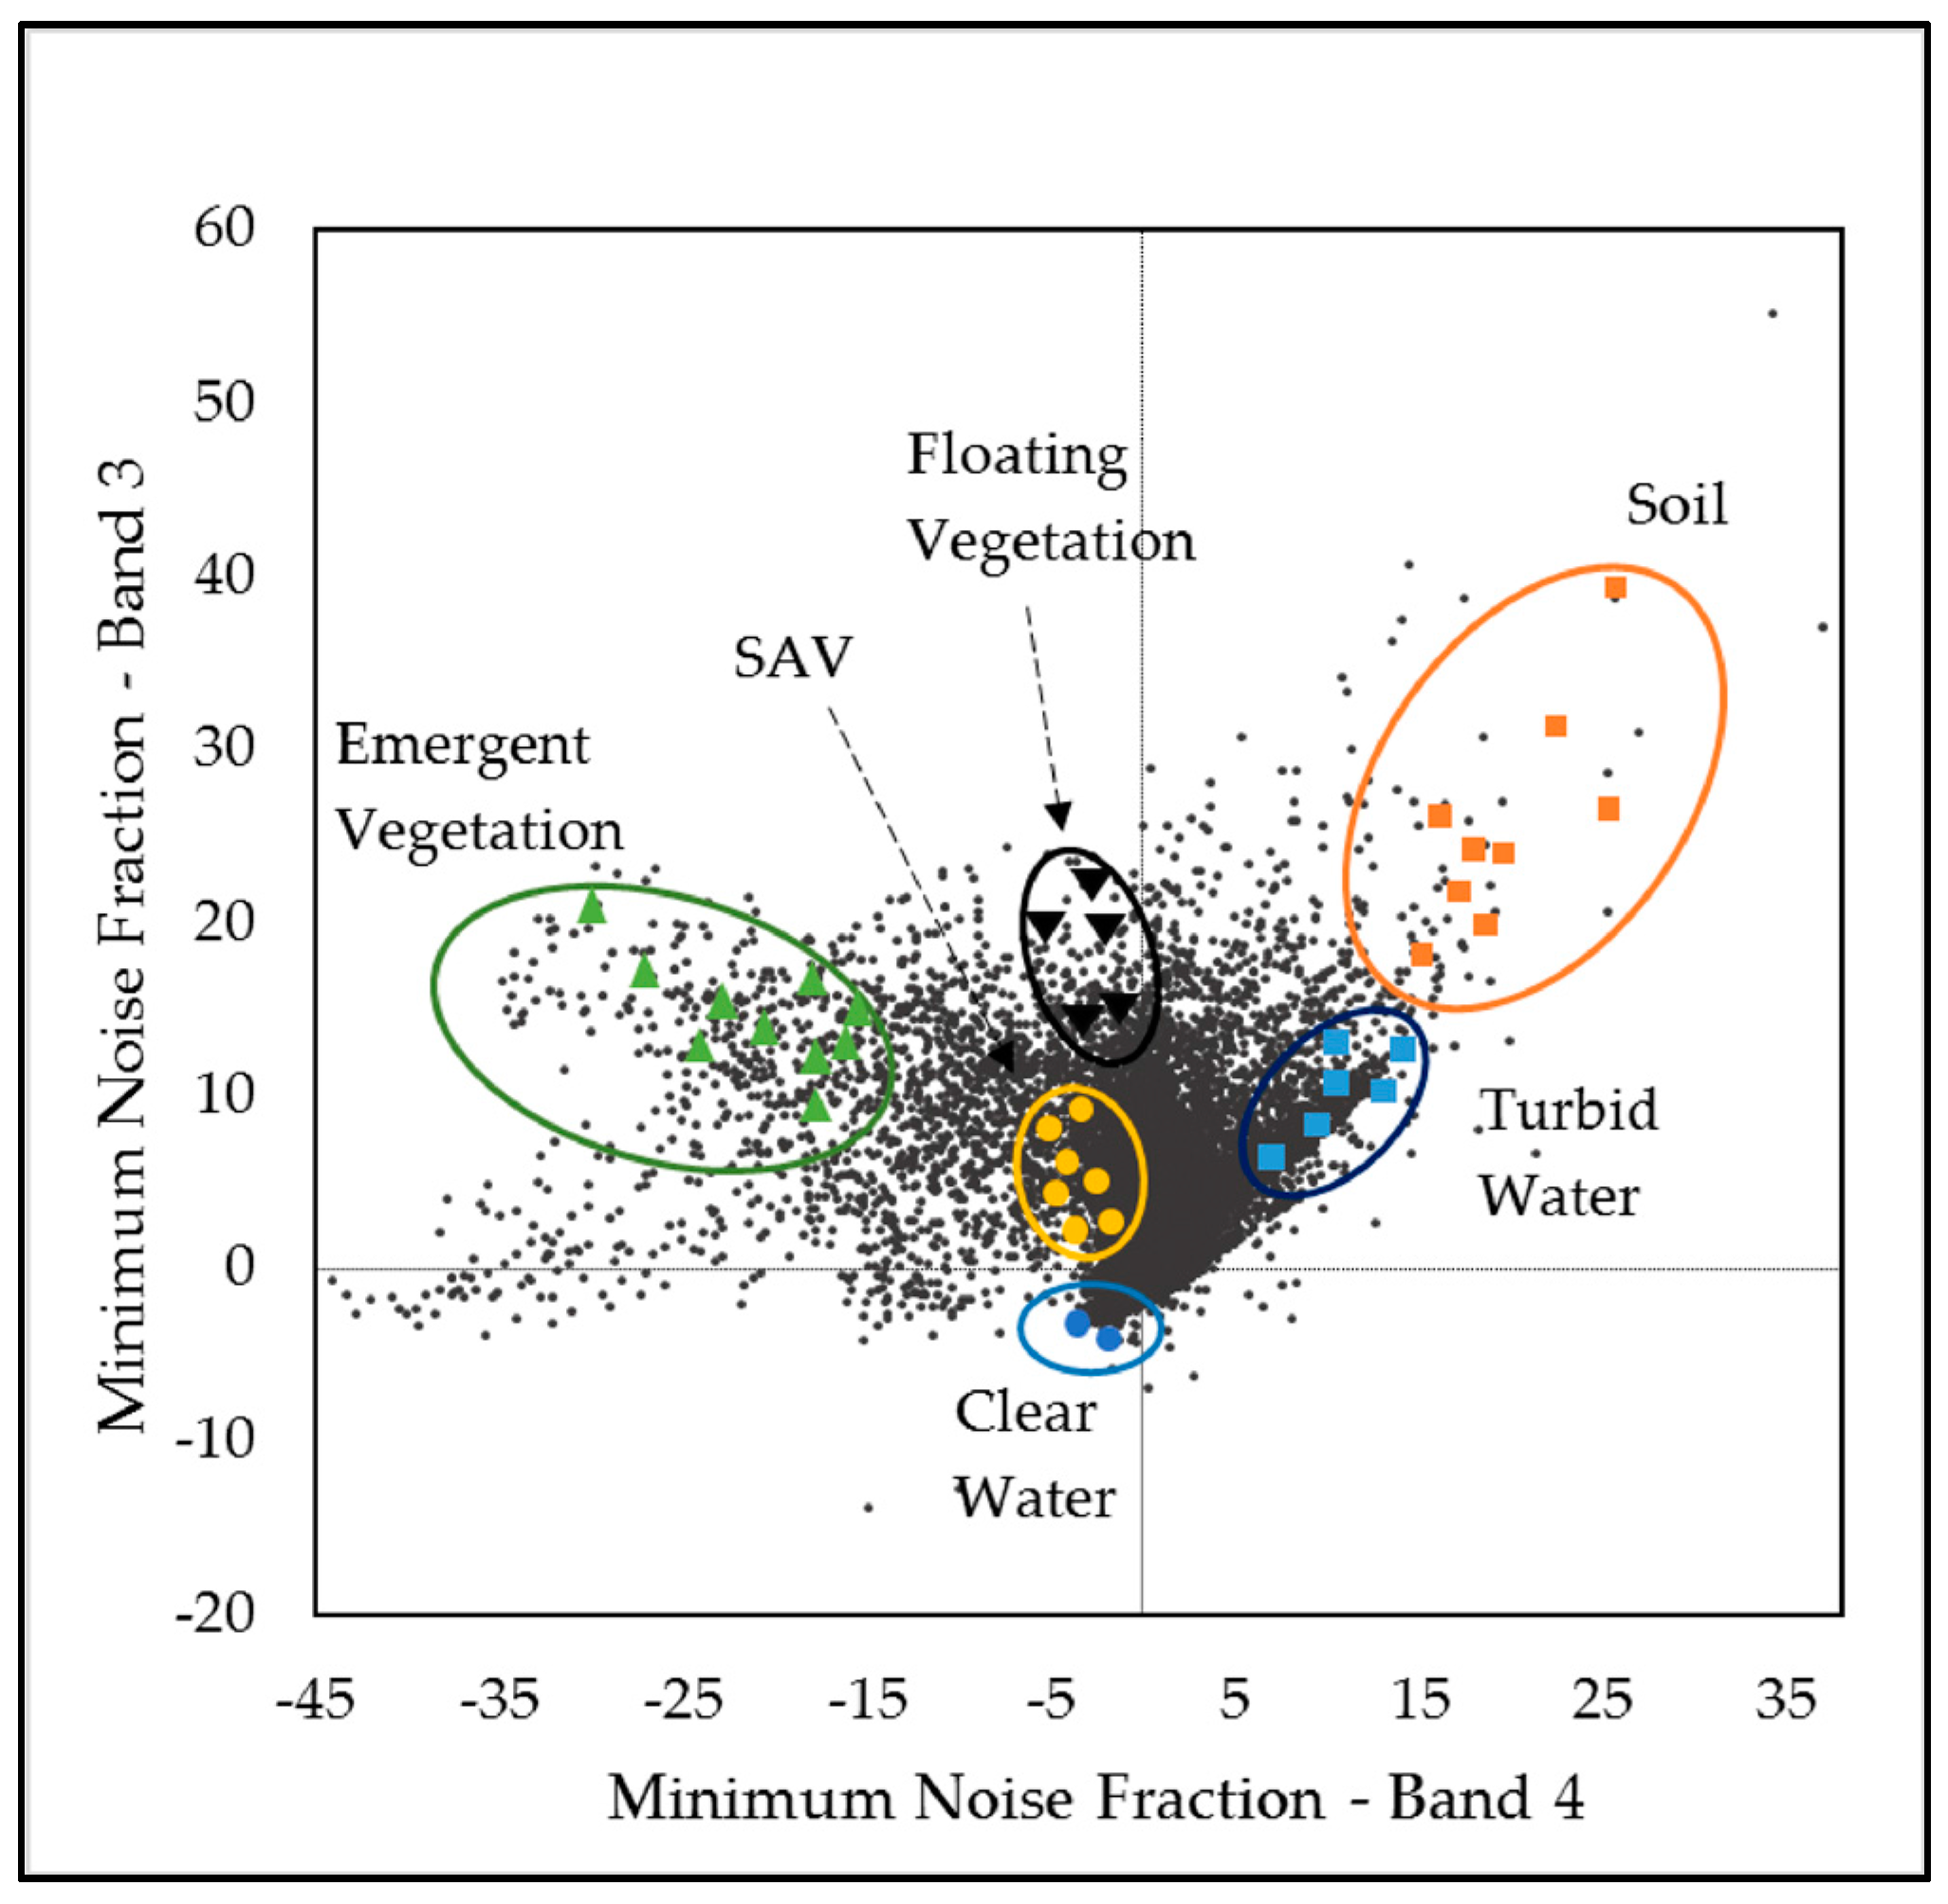
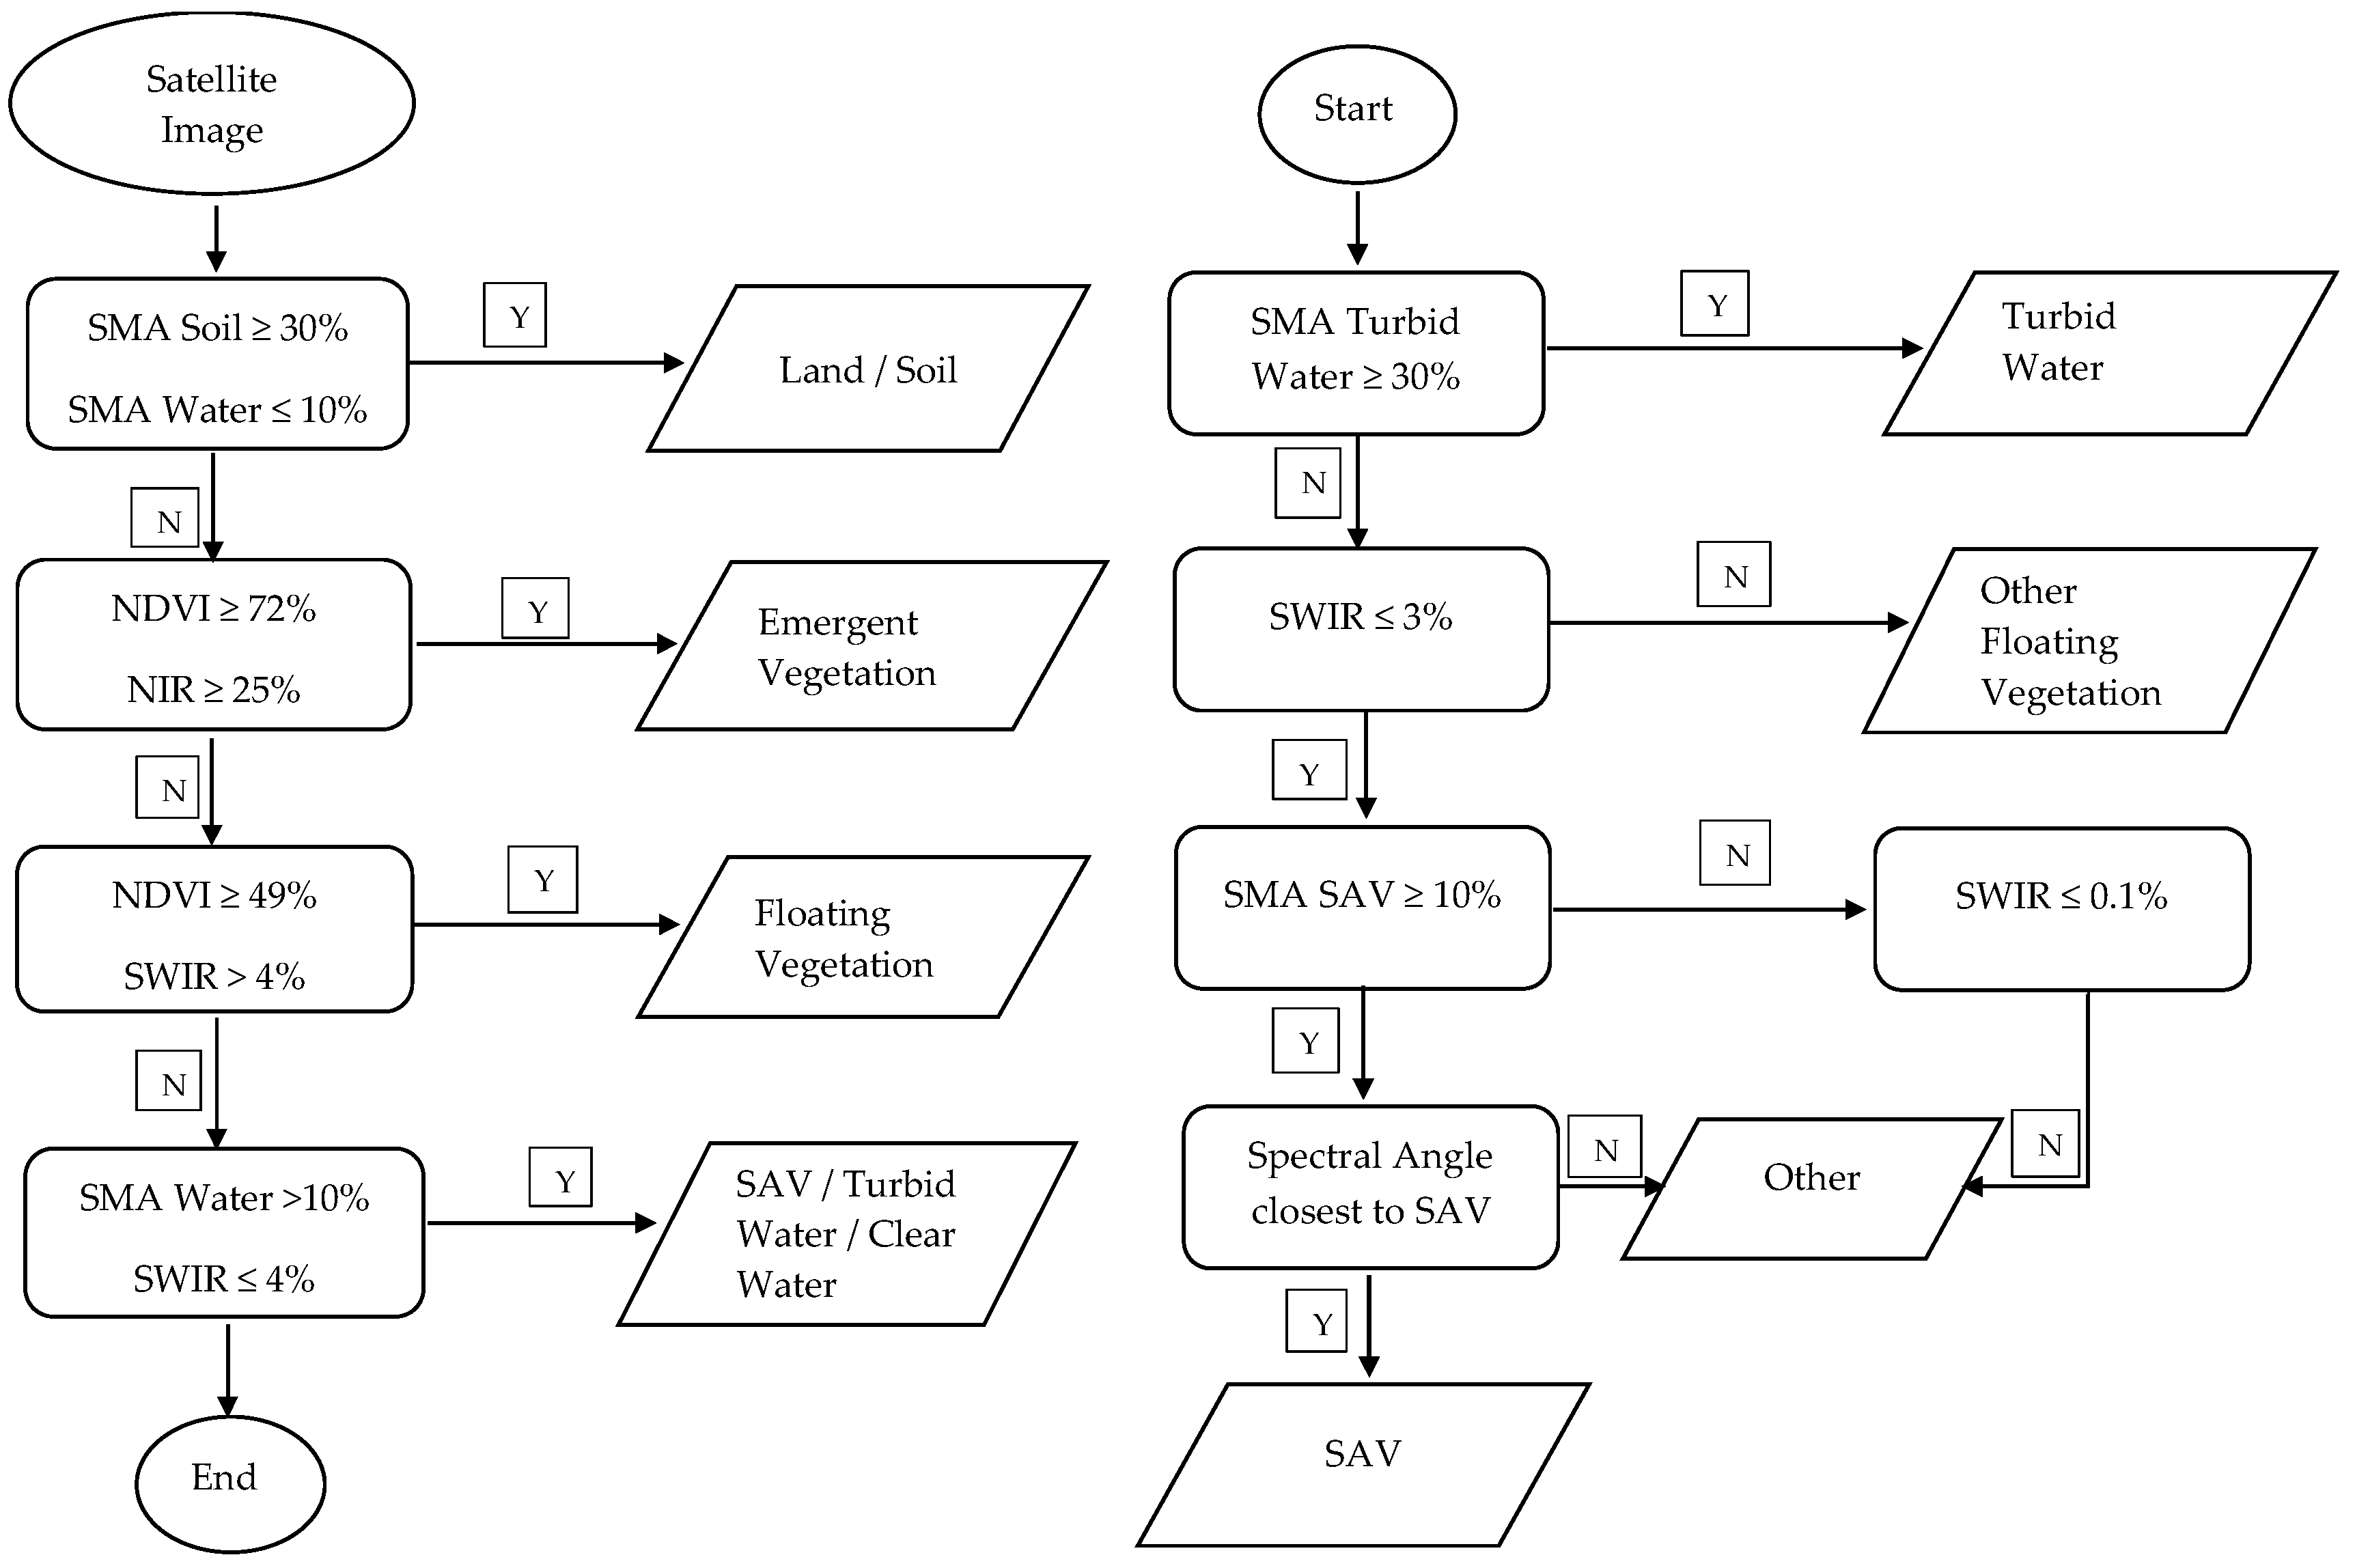
1. Introduction
Historically, there has been considerable interest in submerged aquatic vegetation (SAV), as it is intricately involved in the aquatic food web and significantly influences the freshwater ecosystem [
1,
2,
3,
4]. On the other hand, the rampant overgrowth of invasive SAV species in natural lakes and streams has also received much attention recently from water engineers and research scientists [
5,
6,
7,
8,
9]. When present, large SAV beds sequester nutrients, provide habitats for fish and other invertebrates, prevent sediment re-suspension, and thus maintain clear water conditions in shallow water bodies [
4,
10,
11]. Dense macrophyte cover competes for the nutrients and releases the allelochemicals that are suspected to inhibit the growth of phytoplankton and avert eutrophication [
12,
13]. Re-establishment of SAV has also been recognized as an important ecological technique for the restoration of the eutrophic lakes [
14,
15]. Conversely, the massive overgrowth of invasive SAV species is associated primarily with the anthropogenic nutrient enrichment in freshwater ecosystems, and it is likely to have an impact, environmentally or economically. In particular, invasive aquatic plants alter the nutrient cycles, degrade water quality, dominate native species, and obstruct navigation, fishery and other recreational activities [
5,
6,
16]. In Japan, over 40 alien aquatic plant species have already been naturalized and have proliferated in many lakes and river beds [
17]. The most dominant alien species commonly found in Japanese lakes are Egeria Densa and Elodea Nuttallii. Egeria Densa (also known as Brazilian waterweed) which is a submerged aquatic plant with relatively fast growth rate, thrives in low light conditions to a water depth of 4 m, and can invade freshwater systems with its dense canopy formation [
18].
Previous works have demonstrated the feasibility of mapping and monitoring the SAV cover in the large lakes using satellite remote sensing [
8,
19,
20,
21]. Aerial photographs and high resolution airborne hyperspectral images have been used for vegetation mapping to overcome spatial heterogeneity in the optically complex aquatic environment [
16,
22,
23]. However, due to the large area coverage, ease of data acquisition, and low costs associated with the medium resolution satellite image (e.g., Landsat Thematic Mapper (TM)/Enhanced Thematic Mapper (ETM)/Operational Land Imager (OLI), Spot, Terra/Aster) they are widely used for mapping SAV along with other limnologic parameters [
8,
24,
25]. Satellite remote sensing is a potential tool for monitoring the growth and characteristics of SAV in fresh waters [
19,
26,
27,
28,
29,
30]. The principles behind aquatic vegetation and terrestrial vegetation spectral characteristics are same, however, aquatic plants are not easily detectable due to the complex aquatic environment as compared to the environment of their terrestrial counterparts [
27].
In optically shallow water, the detection of SAV using remote sensing is often hindered by the absorption and scattering processes of the optically active components (OAC), mainly phytoplankton (chlorophyll a), non-phytoplankton suspended sediments (NPSS) and cDOM (chromophoric dissolved organic matter) [
27,
31,
32,
33,
34]. The presence of OAC potentially diminishes the water transparency which limits plant growth and reduces the possibility of detecting submerged plants using satellite images [
35,
36]. In order to map the SAV species in lake water, their reflectance must cross the air–water interface, which is not possible in the highly turbid water. Nevertheless, if the water is less turbid and the SAV signal significantly contributes to the water leaving reflectance, then it is possible to map the distribution of SAV using satellite images [
23,
35]. Hence, water clarity is an important factor substantially influencing the detection of SAV by satellite remote sensing [
20]. In a eutrophic lake, the mixed pixel effect due to the presence of OAC can result in misclassification. Thus, it is essential to have water clarity information before SAV classification. Consequently, in some studies, the satellite images were used to estimate the water transparency [
37] and optical depth (water clarity or transparency) assessment [
26], before SAV abundance mapping. Most frequently used approach for water clarity estimation involves the linear regression of the satellite bands and the in situ water clarity data [
37,
38,
39,
40].
In addition, several remote sensing techniques have been used for SAV spectral analysis and bottom mappings. Some of the frequently used techniques include vegetation presence frequency [
22], vegetation indices [
38,
41], the radiative transfer model and linear mixture approach [
31,
41], the modular inversion program, and the Water Color Simulator (WASI) [
23,
42] and classification tree model [
43,
44]. Moreover, high spatial resolution imagery such as the Quickbird multispectral image was applied in some studies for SAV mapping [
45]. Techniques using the Spectral Angle Mapper (SAM) [
46], Spectral Mixture Analysis (SMA) [
16], and Continuum Removal and Minimum Noise Fraction (MNF) [
29] were successfully applied mainly to hyperspectral images for aquatic vegetation mapping and identification [
16,
23,
28,
29,
47]. However, the application of these techniques to medium resolution satellite images such as those obtained with Landsat-8 is still insufficient, especially for classifying and mapping the SAV in the shallow eutrophic lakes.
Furthermore, to quantitatively assess the growth of SAV communities, biomass estimation is essential. SAV biomass is an important factor indicating the productivity of the lake ecosystem. Conversely, excessive plant material (i.e., the biomass) also contributes to the plant nuisance problem in shallow waters [
48,
49,
50]. Remote sensing techniques such as the Submerged Aquatic Vegetation Mapping Algorithm (SAVMA) were used to estimate the SAV biomass (mainly
Cladophora) by assigning the average dry weight density obtained from the field survey to the identified SAV area (i.e., grouped as the dense and less dense
Cladophora area) [
26]. In contrast, in some studies an aquatic vegetation biomass estimation model was developed by establishing a relationship between the Normalized Difference Vegetation Index (NDVI) and the observed biomass of aquatic plants, using multispectral satellite images [
39]. In the former case, a different set of dry weight estimates is required to estimate the biomass for other time of the year. In the latter case, the NDVI values of SAV can be influenced by the presence of phytoplankton, particularly in eutrophic lakes [
40]. The time-specific and location-specific approach may not be applicable in other optically shallow lakes.
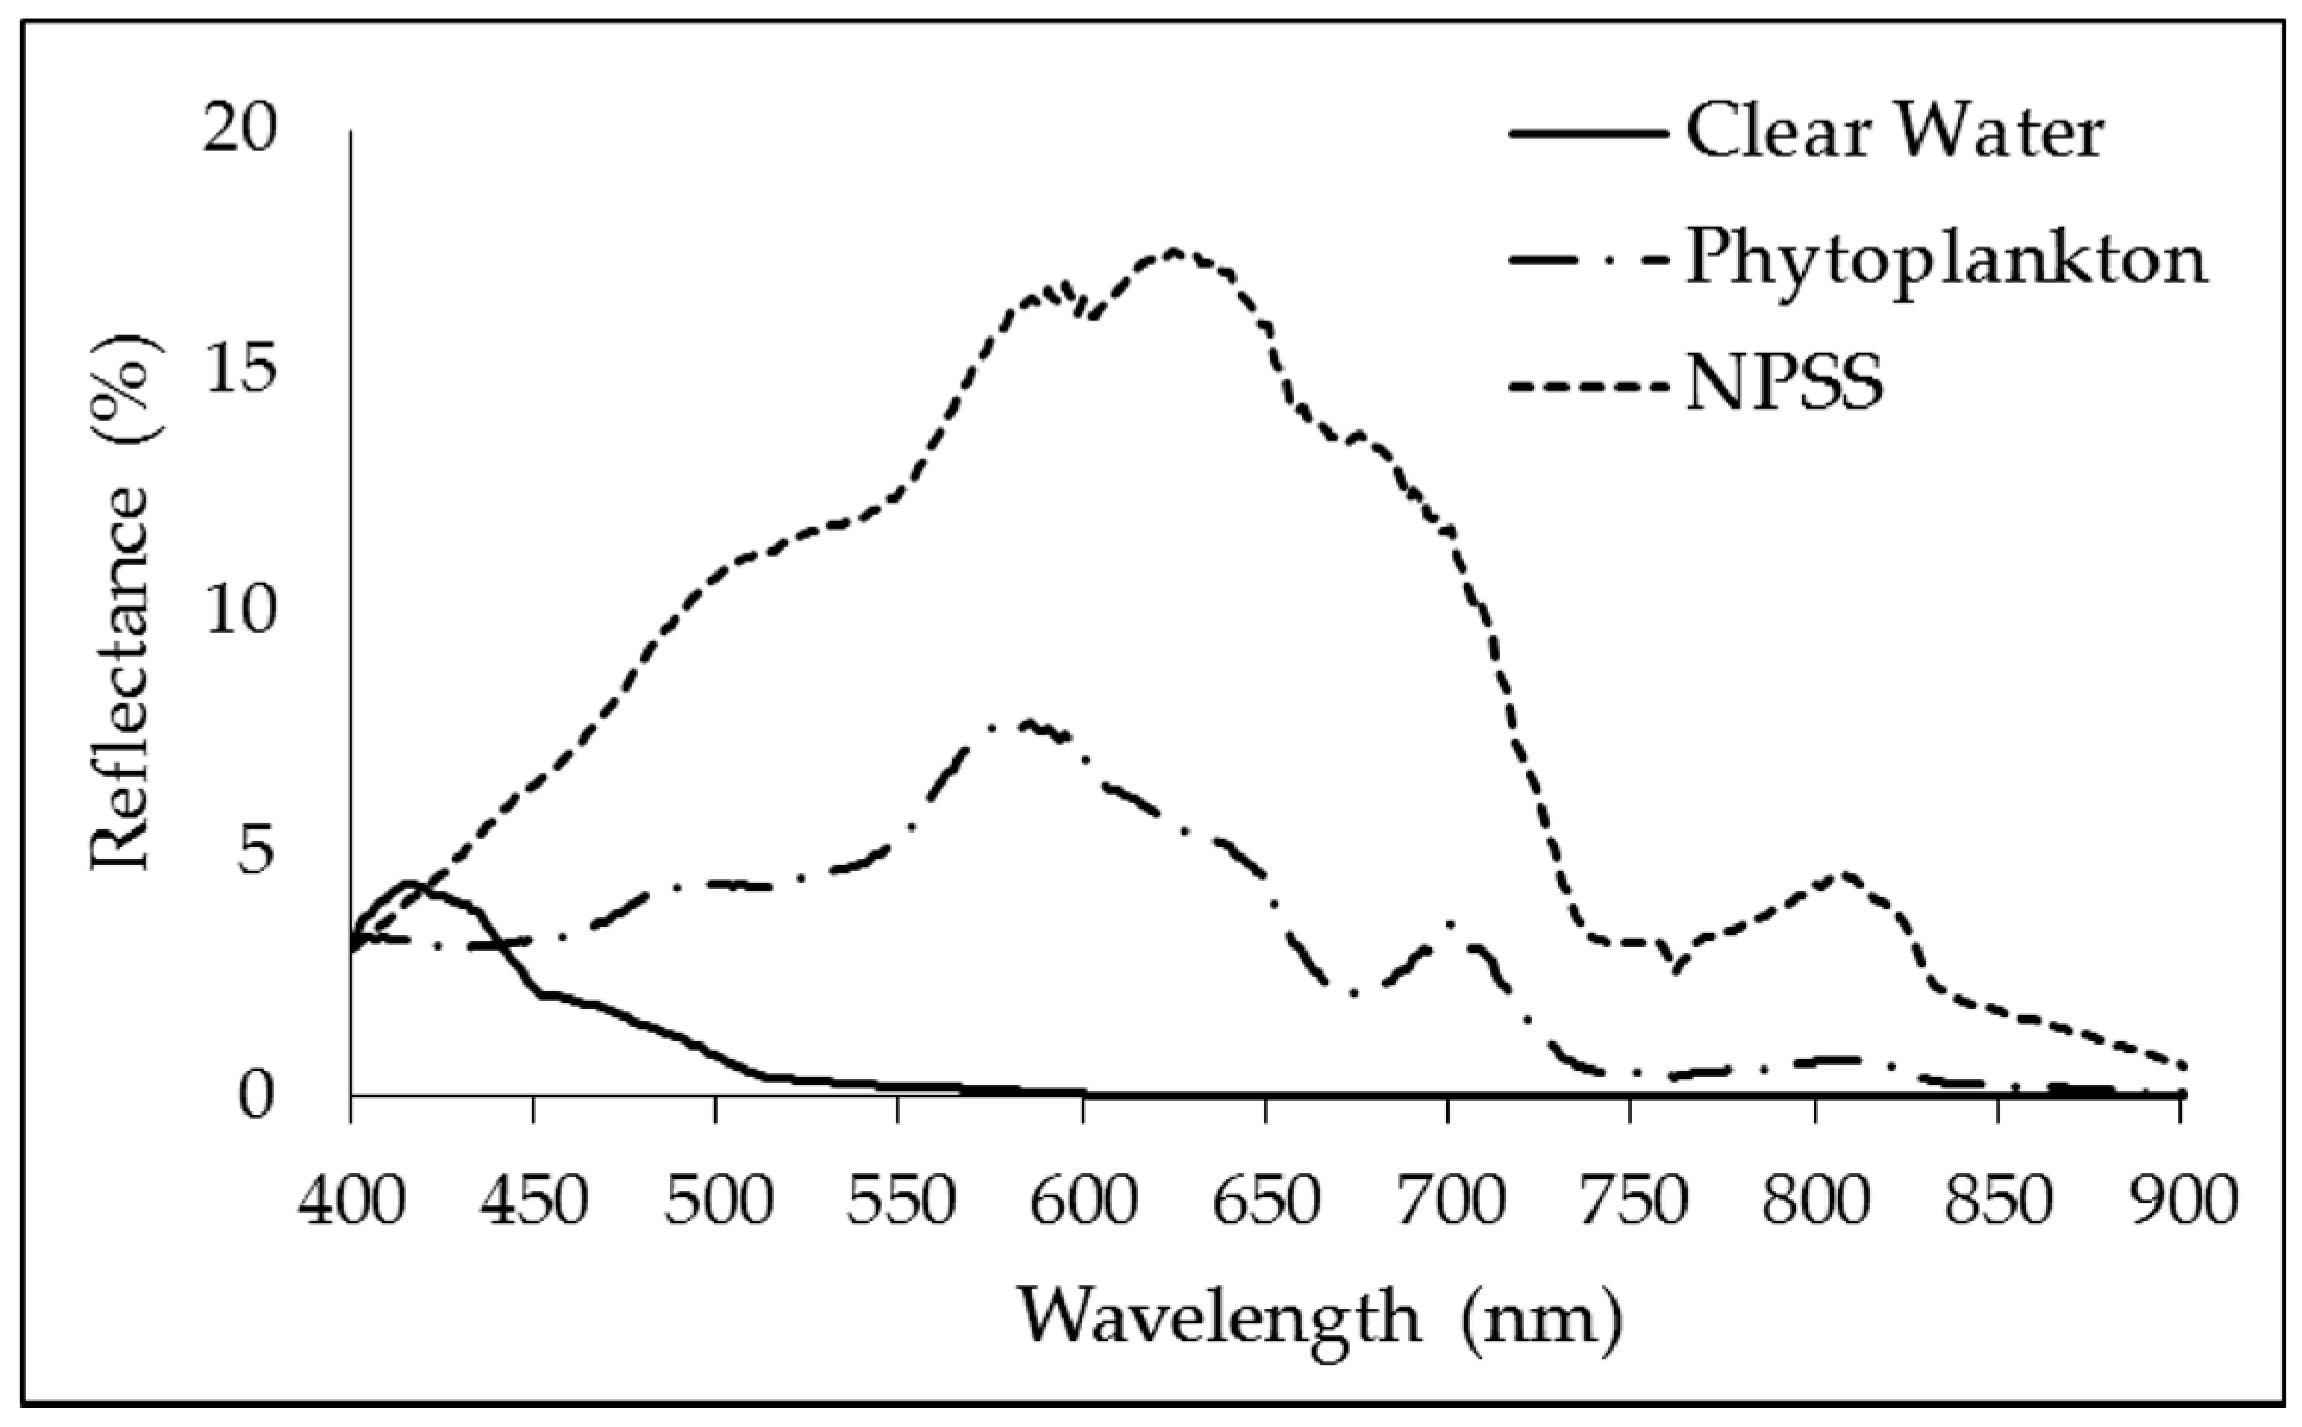
In this study, we developed a new biomass estimation approach based on the Spectral Decomposition Algorithm. The algorithm conceptualizes the mixed pixel reflectance and expresses it as a linear combination of the potential endmembers (i.e., OAC). The Spectral Decomposition Algorithm has previously been used only for water quality monitoring for the shallow lakes using three main OAC, i.e., clear water, NPSS and phytoplankton [
51,
52]. Nevertheless, in optically shallow waters, the upward irradiance just below the water surface is the sum of the flux backscattered by the water column and the flux reflected by the bottom [
31,
53,
54,
55,
56]. Thus, when analyzing the remote sensing data for optically shallow lakes, the influence of the bottom albedo has to be included [
23,
53]. Specifically, this applies for lakes with long stands of dense vegetation substrate which substantially contribute to the water, leaving reflectance. However, the influence of the bottom substrate has not been accounted for using the same algorithm in the previous studies, which could be due to the different environmental conditions of their study areas.
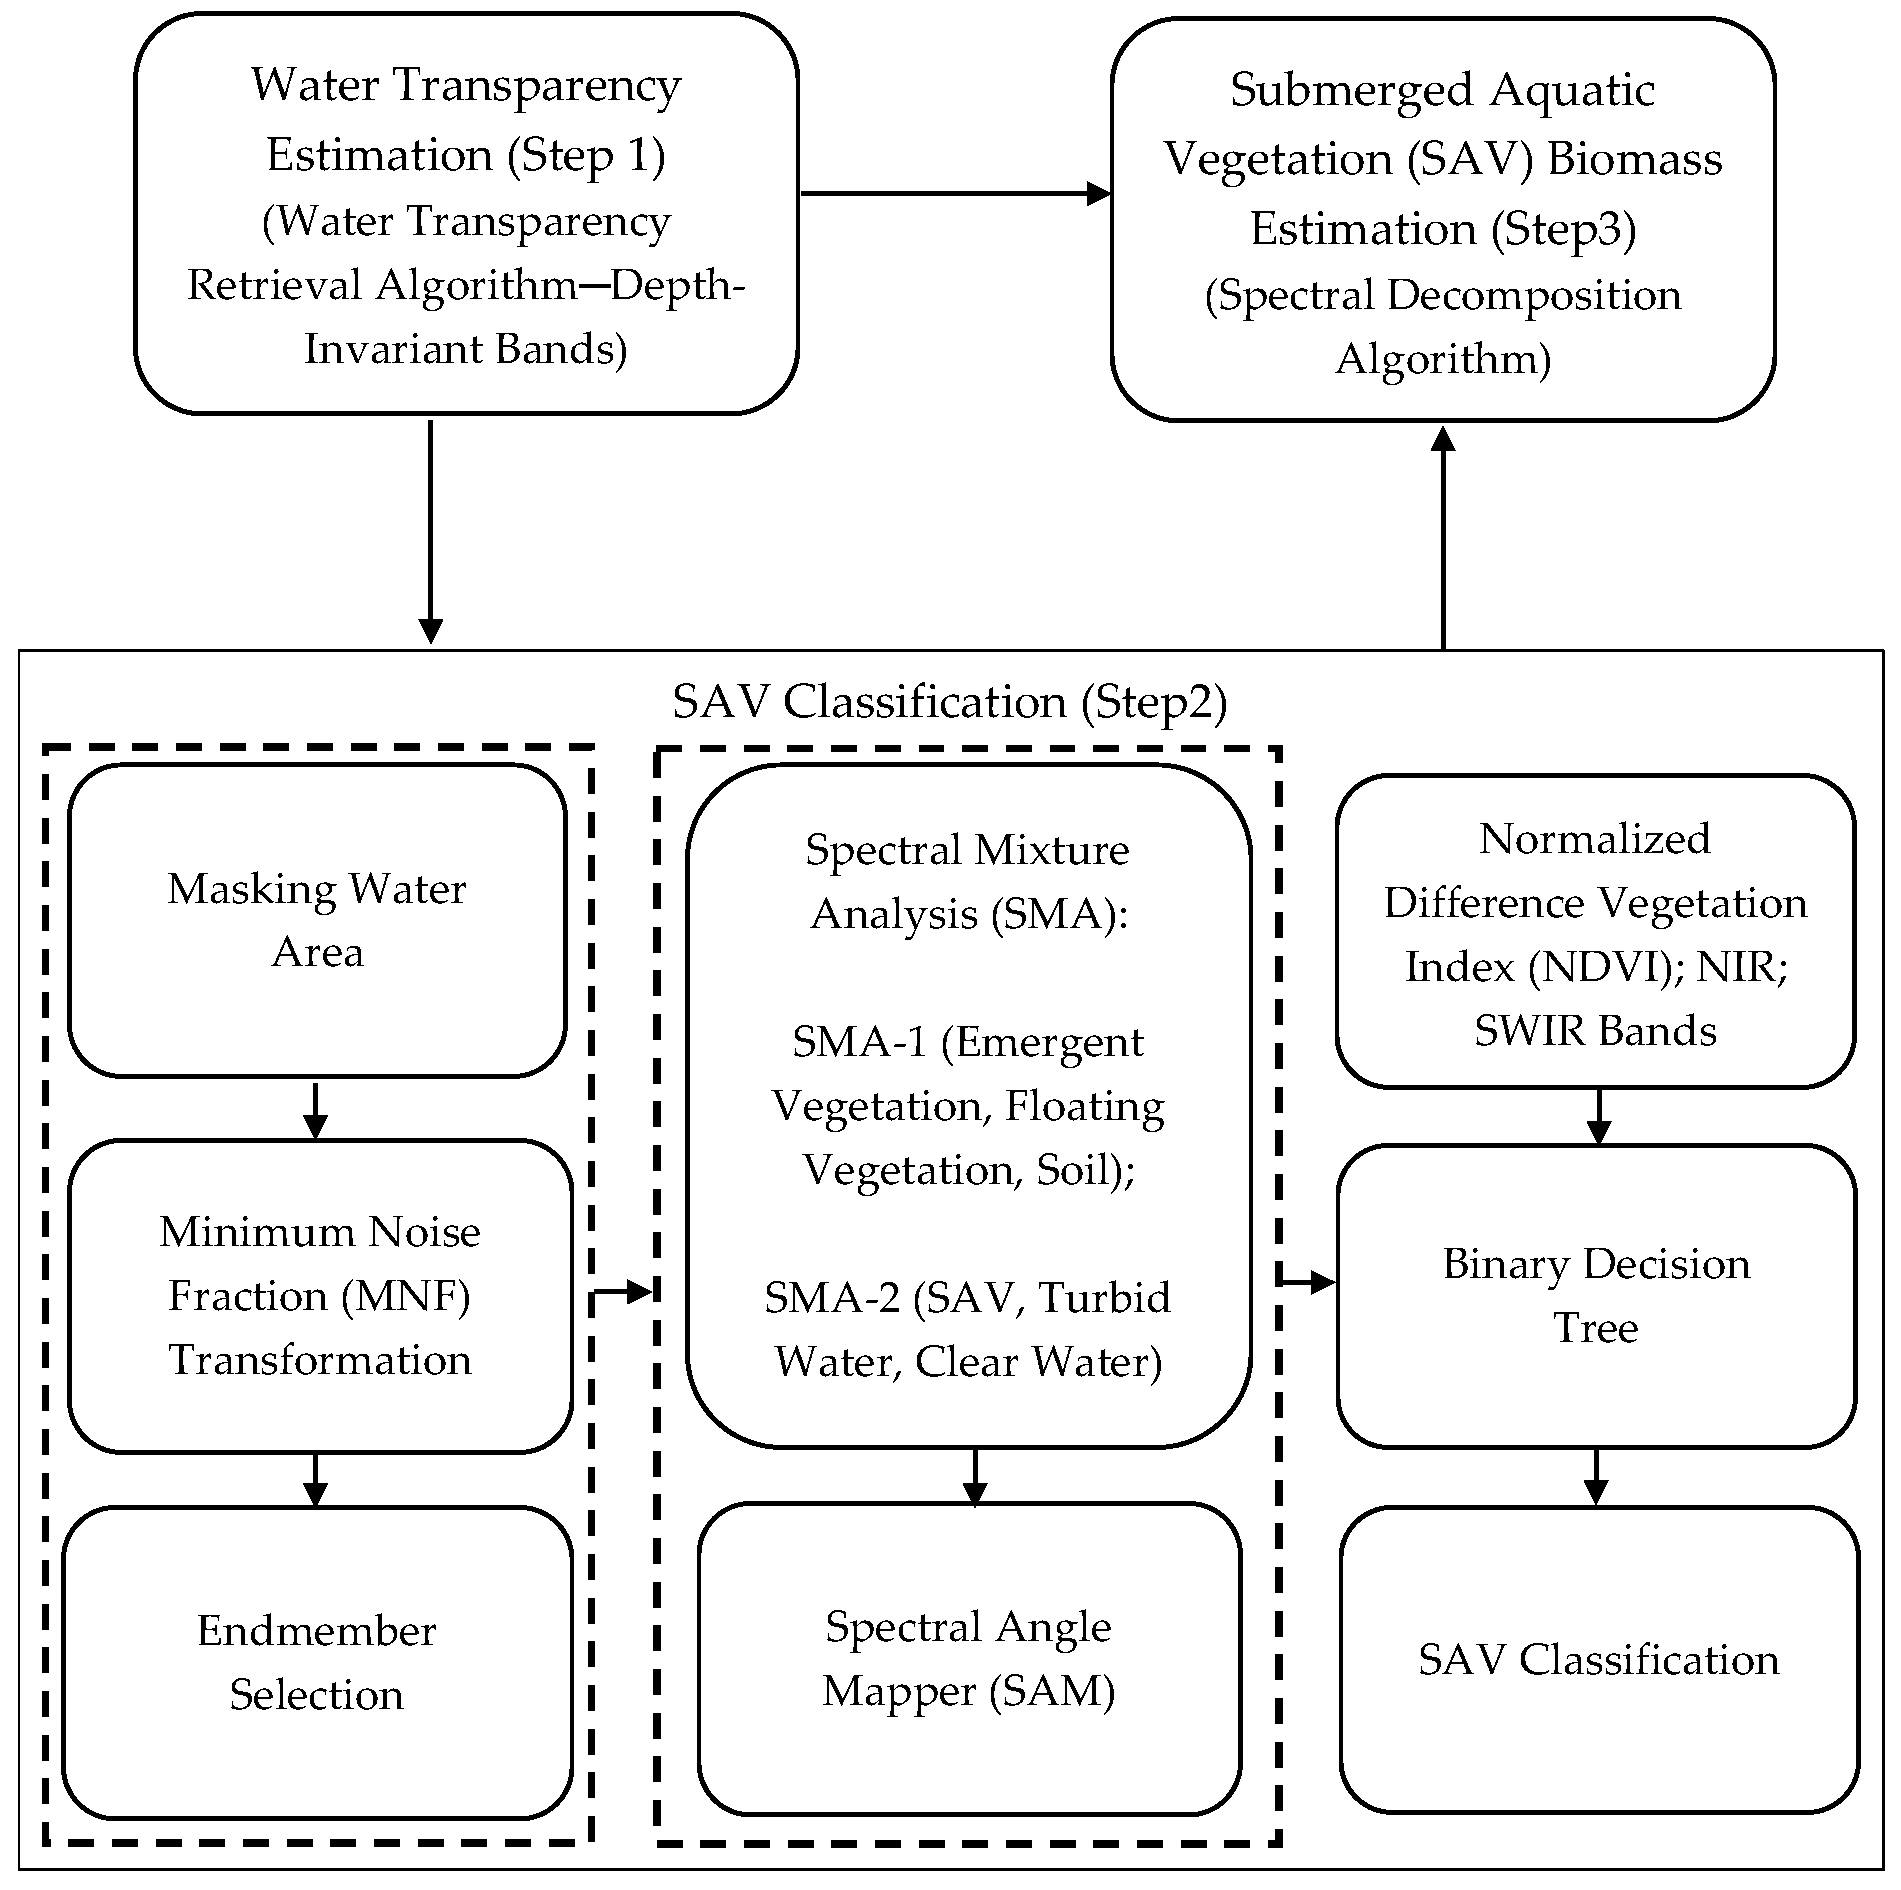
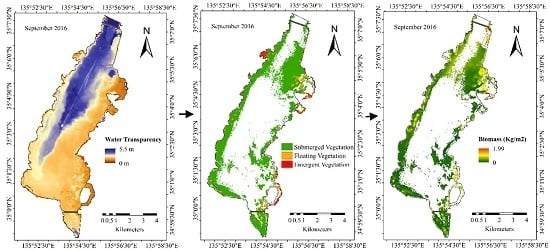
To address the gaps in monitoring the SAV in the shallow eutrophic lakes, the present study aims to develop a satellite-based approach for SAV distribution and biomass mapping using the Landsat-8 Operational Land Imager (OLI) image for the SAV peak growth period, mainly in September (2013–2016). The main purpose of the study was further divided into three objectives: (1) to estimate the water transparency of the shallow eutrophic lake; (2) to identify and map the SAV distribution area in the shallow lake; and (3) to develop a satellite-based SAV biomass estimation approach for the SAV area detected using the satellite image. The water transparency determination was primarily used to confirm the turbid water area for SAV mapping and for SAV biomass model development.
This study presents the new Spectral Decomposition Algorithm to quantify the SAV biomass for the classified SAV pixels in the optically complex, eutrophic, and shallow lake, using the medium resolution satellite image. The developed approach accounts for the bottom albedo thus, with accurate water clarity information, this can be utilized as an important tool to assess the SAV abundance in the shallow water bodies. Furthermore, the satellite-based (i.e., Landsat-8) approach developed in this study also provides a cost-effective method for the frequent monitoring of SAV, which could apply to large lakes.
4. Discussion
In optically shallow lakes, high turbidity significantly affects the spectral detection of SAV by reducing the water clarity [
38,
45]. Additionally, healthy vegetation growth often related to the water clarity in an aquatic system [
10,
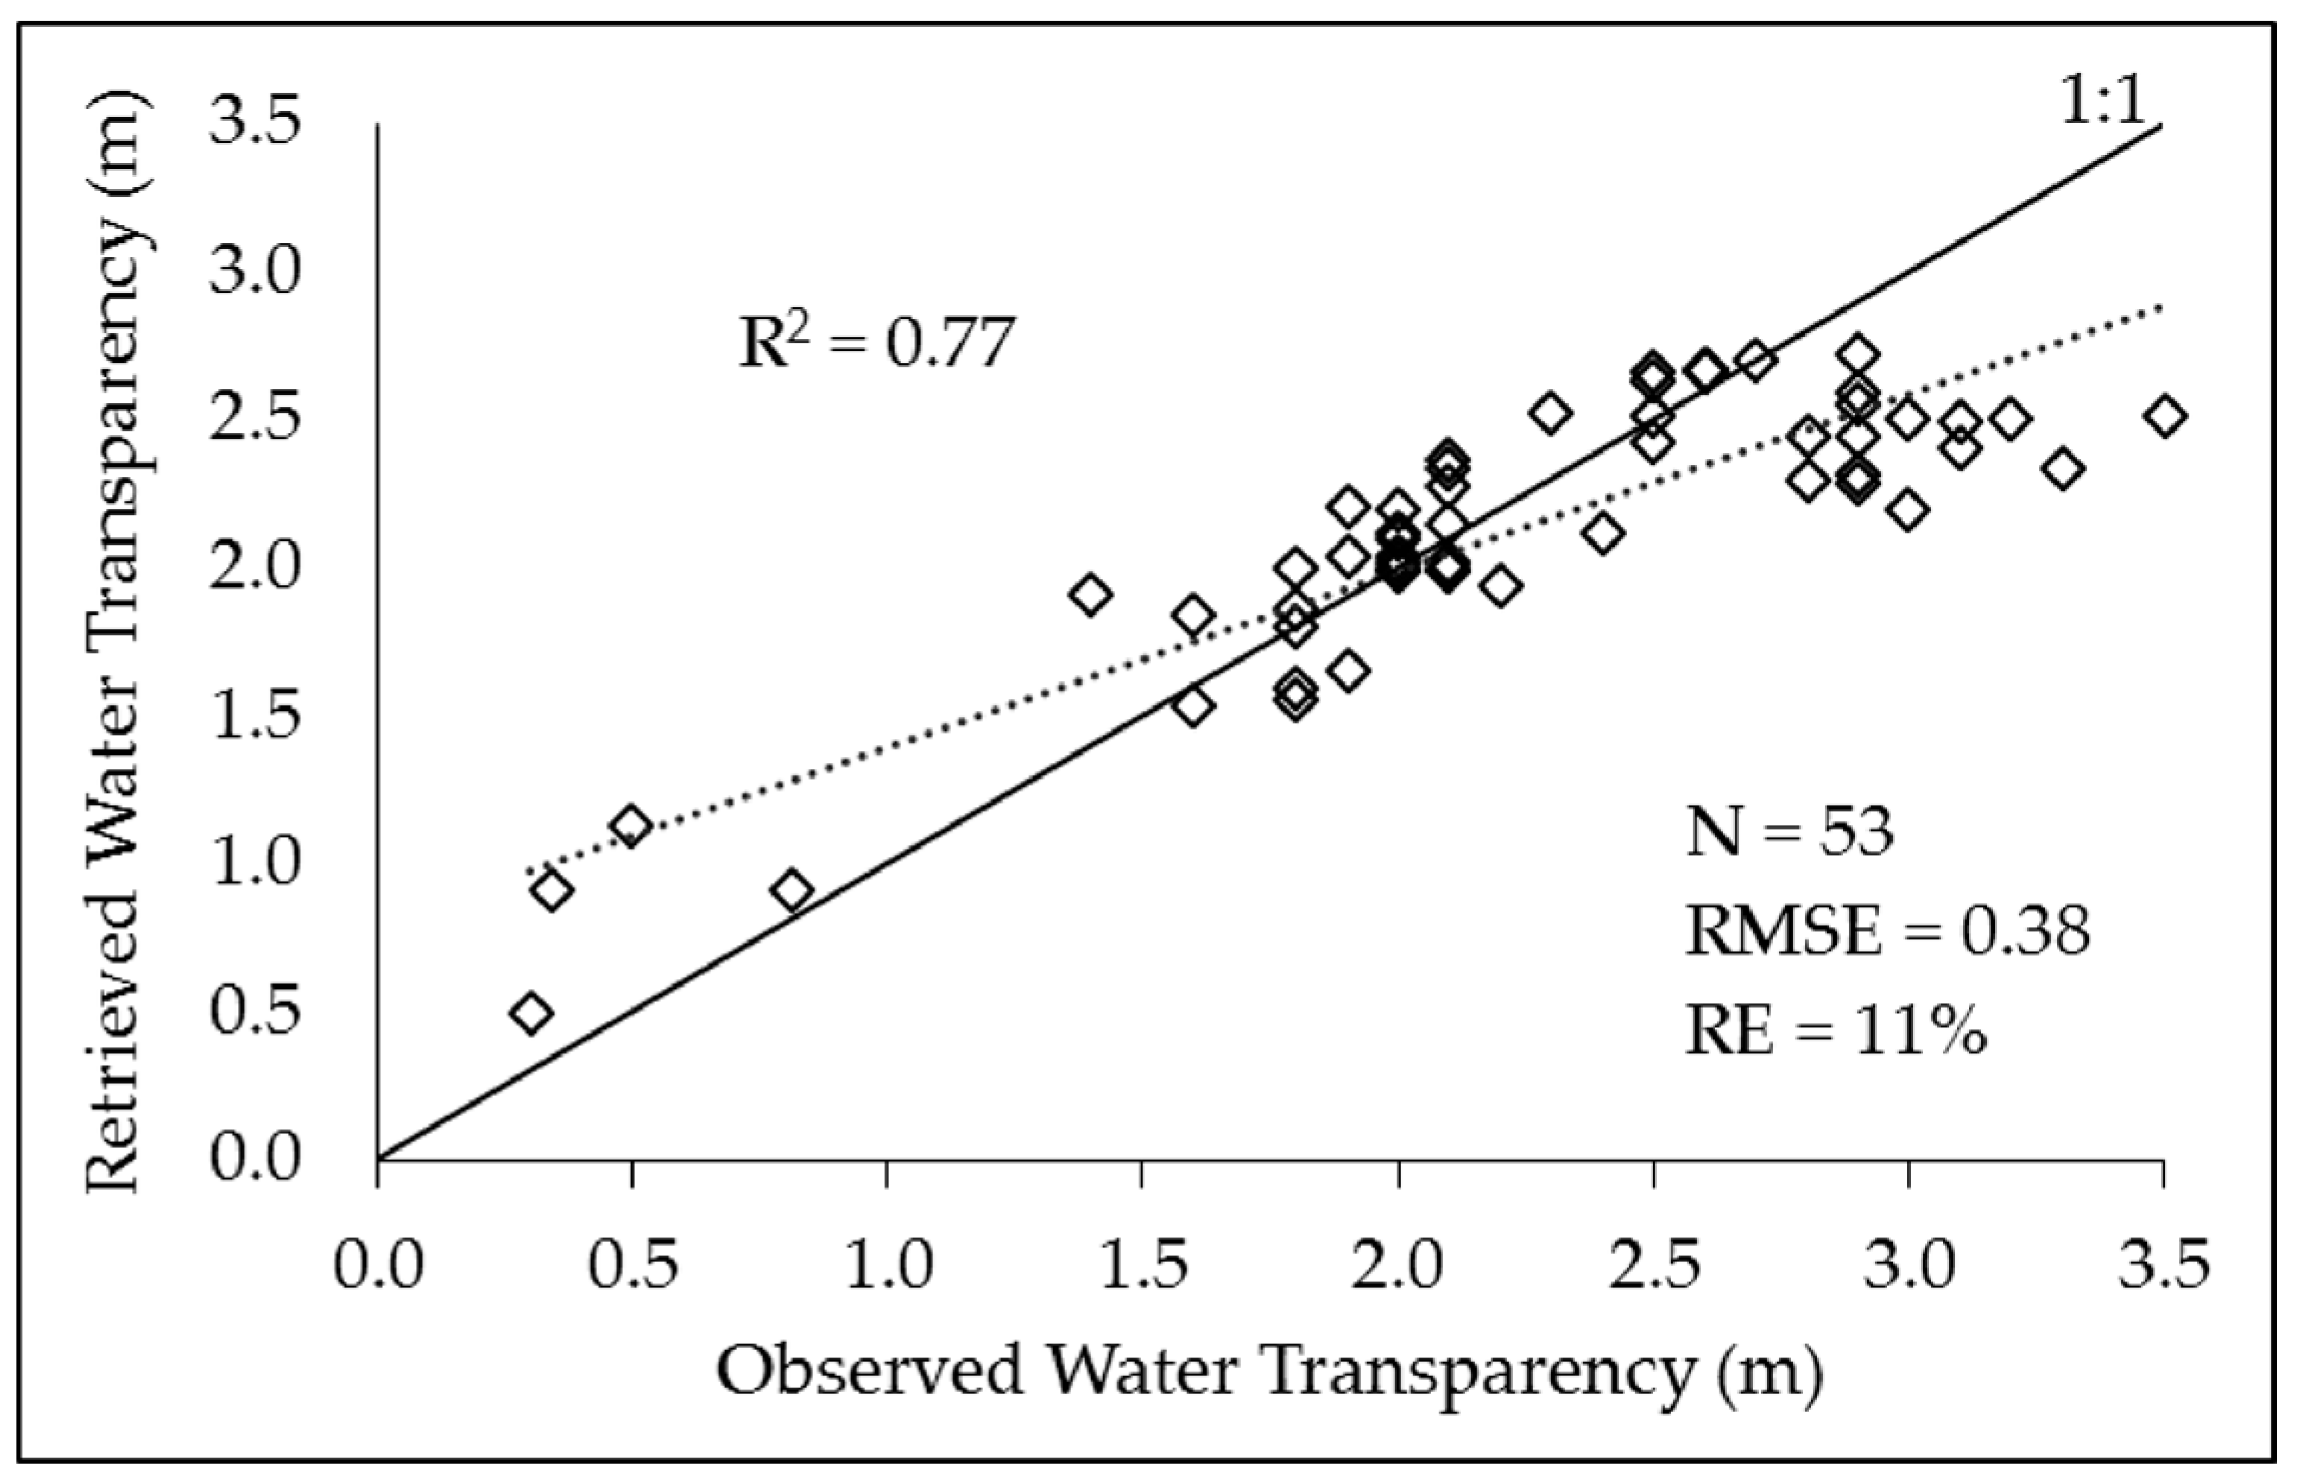
11]. Therefore, in this study water clarity (i.e., water transparency) is considered as an important parameter for SAV abundance mapping. However, obtaining water transparency data for each year and location which can coincide with the satellite overpass time is not possible every time. Therefore, we applied a water transparency retrieval algorithm to the Landsat-8 image in order to generate the water clarity map for the SAV growth period in the south basin of Lake Biwa. Conversely, due to the time difference of ±5 days in the observed water transparency data and the Landsat-8 image acquisition time, a good agreement between the observed and satellite-derived water transparency was not expected (the obtained R
2 is 0.77). In the south basin of Lake Biwa, the amplified SAV growth is considered as a key driving factor for improved water clarity [
22,
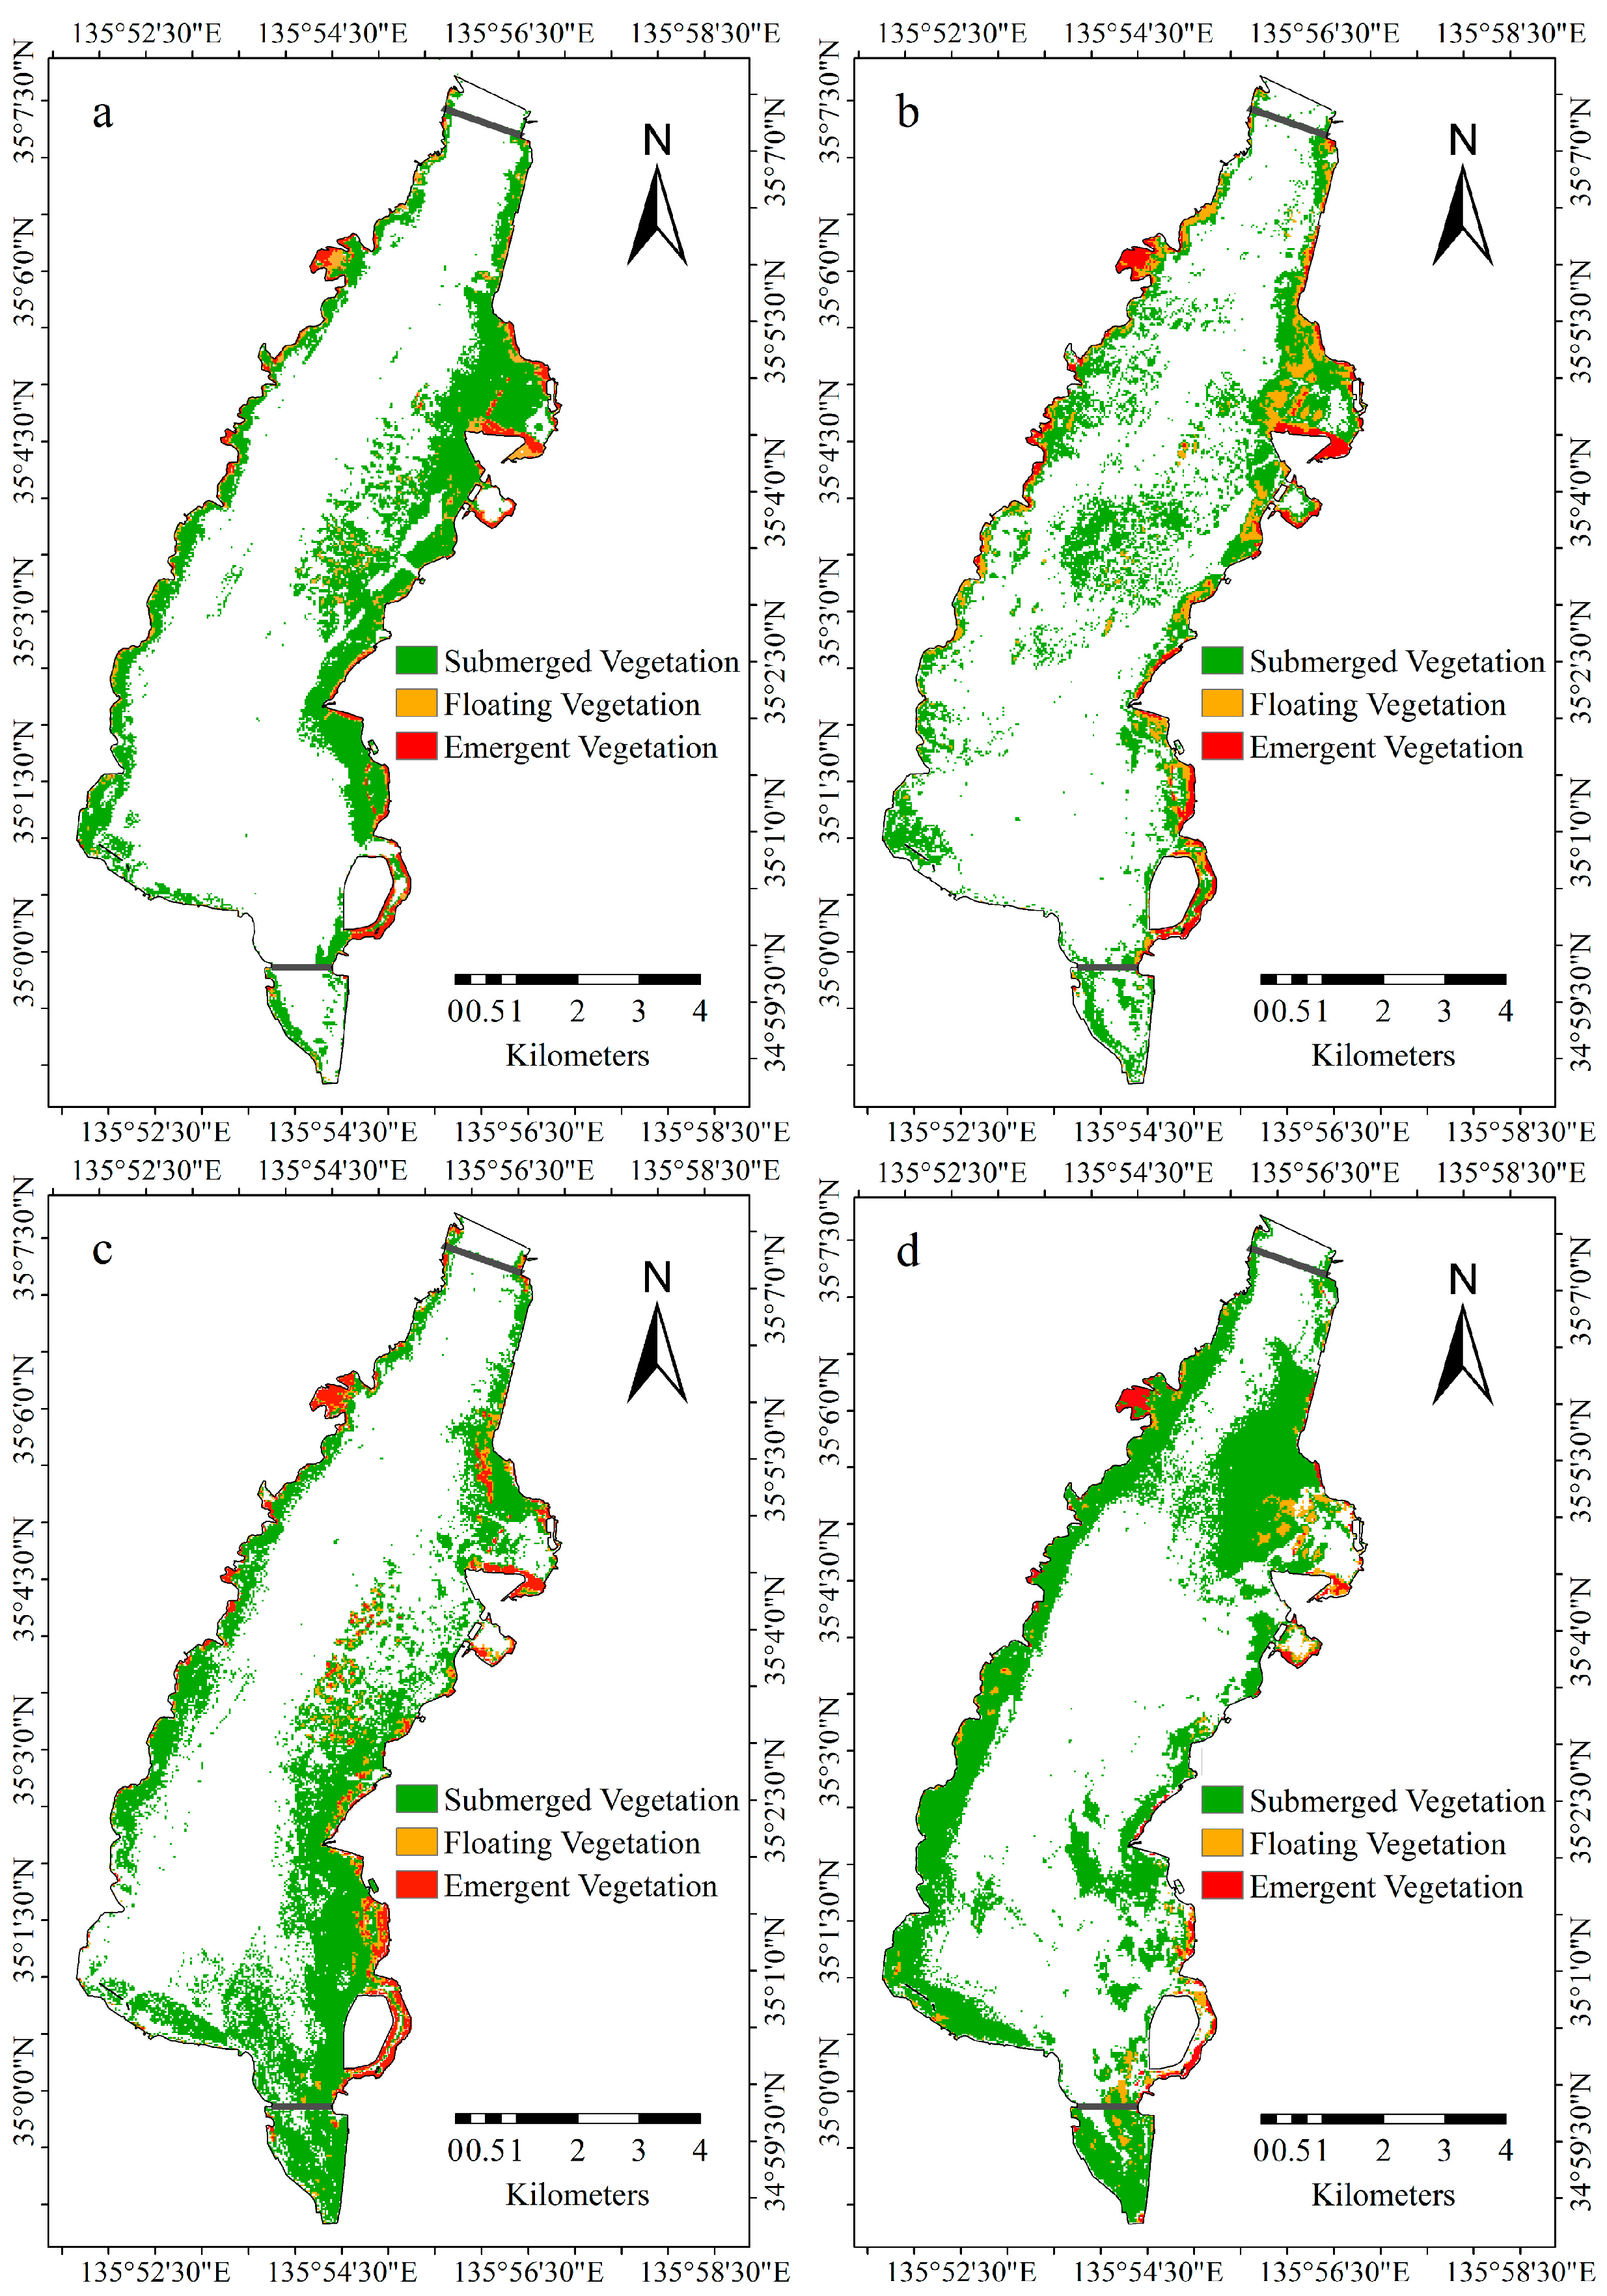
61]. In this study, the mapped SAV coverage area does not rise as expected, with increased water clarity for the same year. For instance, water clarity obtained in 2014 is higher than 2013, 2015, and 2016, while the detected SAV area is rather low (9.6 km
2), in the same year (
Figure 13 and
Figure 14). It could be attributed to the fact that aquatic macrophyte reacts slowly and progressively (i.e., in years) to the changes in aquatic systems (such as nutrient conditions and turbidity), in contrast to phytoplankton and other microalgae [
70]. Principally, in lakes with increasing eutrophication, SAV communities often show a considerable delay response time [
1]. However, another factor such as SAV stand height could simultaneously contribute to its low detection [
64]. In Lake Biwa, SAV stand height tends to increase at the water depth of 4–6 m and decrease in relatively shallow turbid water areas [
61]. Therefore, if the water is relatively turbid in the shallow basin even with an extensive SAV bed of short growing species, the detection of SAV is restricted using the satellite image. Moreover, in deep water, if the stand height of SAV is not within the optical depth limit the detection of SAV is not possible using the satellite image [
8]. Consequently, an increased SAV distribution can be seen in the following year of 2015 (15.7 km
2) and 2016 (21.0 km
2), in this study (
Table 6).
Based on the previous studies [
59,
61] on the south basin of Lake Biwa, we assumed that >90% of the basin area has SAV as the bottom surface. However, the detected SAV coverage area in this study is 18% to 40% (i.e., minimum to maximum detection from all four images (2013–2016)). The pixels classified as SAV are located mainly in the near shore areas of the basin. This indicates the limitation of the classification approach used in this study, which can classify the SAV mainly in the low water depth area (or with the low canopy depth). Several factors may contribute to the low detection, such as increased eutrophication, SAV stand height, and deep water areas (the maximum water depth in south basin is 8 m). In some studies [
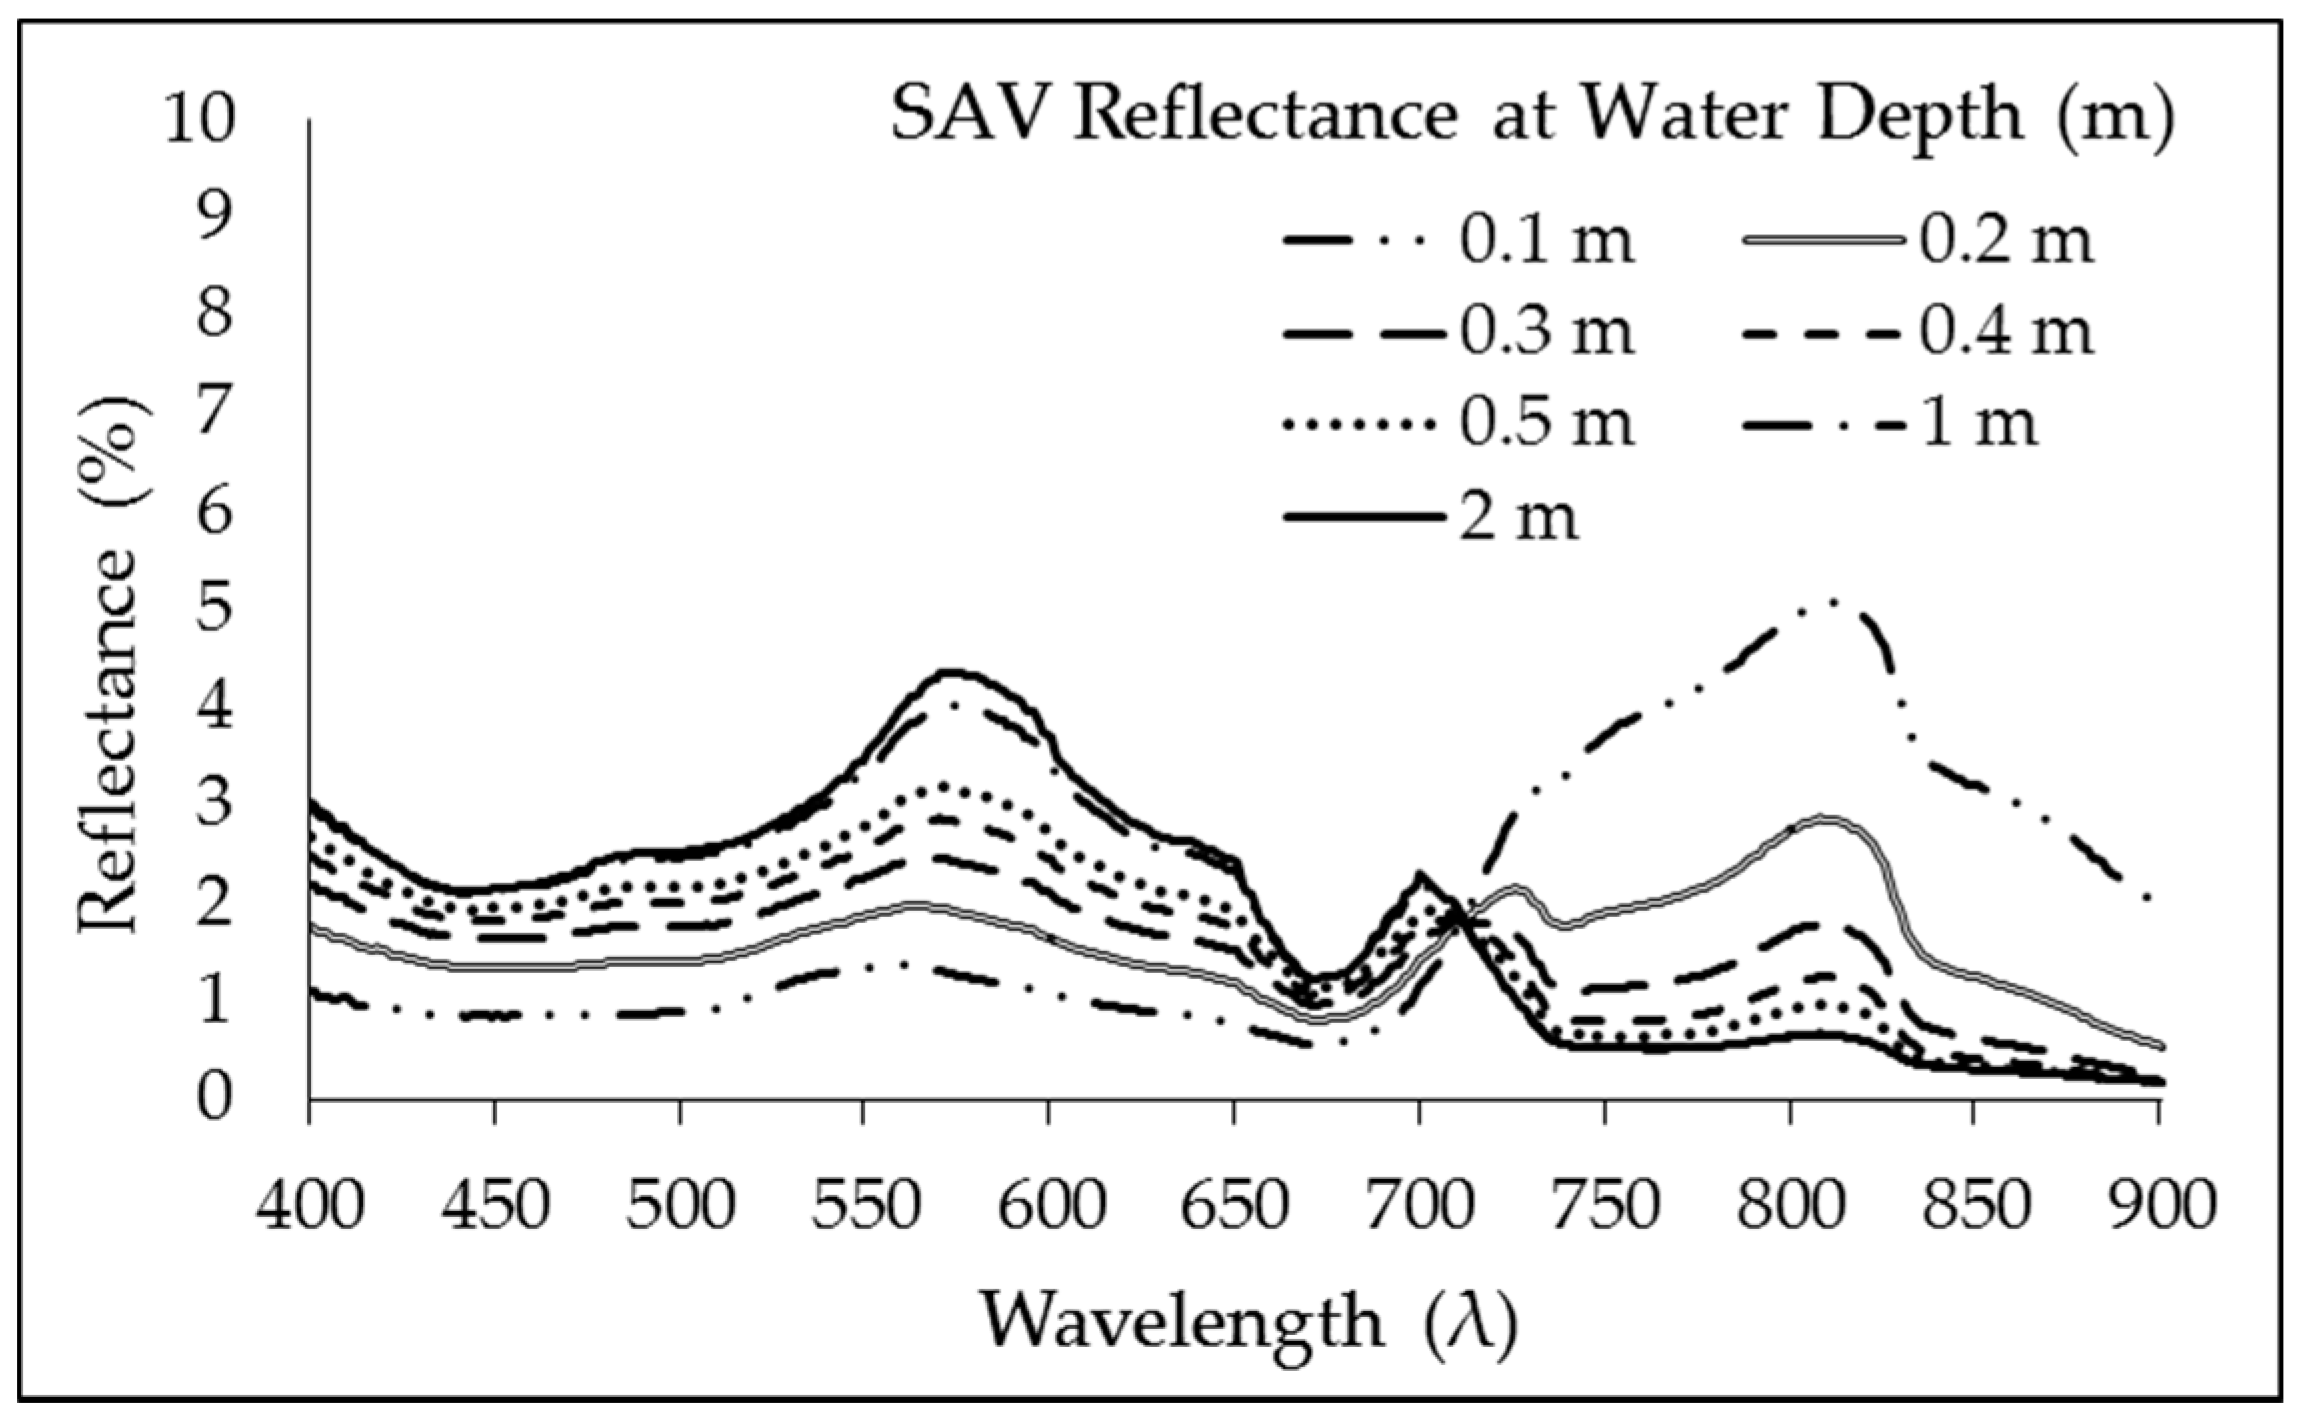
36], the result showed that in clear water the SAV could easily be detected at a 1-m canopy depth (the water column depth from the water surface to the top of the SAV canopy). However, with the increase in turbidity the detection reduces to a maximum canopy depth of 0.46 m to 0.5 m. The result further suggests that increased turbidity significantly affects SAV detection. With increased water level in Lake Biwa, it is not possible to detect all the SAV (i.e., canopy depth increases) [
22]. In the south basin, based on the in situ survey and previous studies [
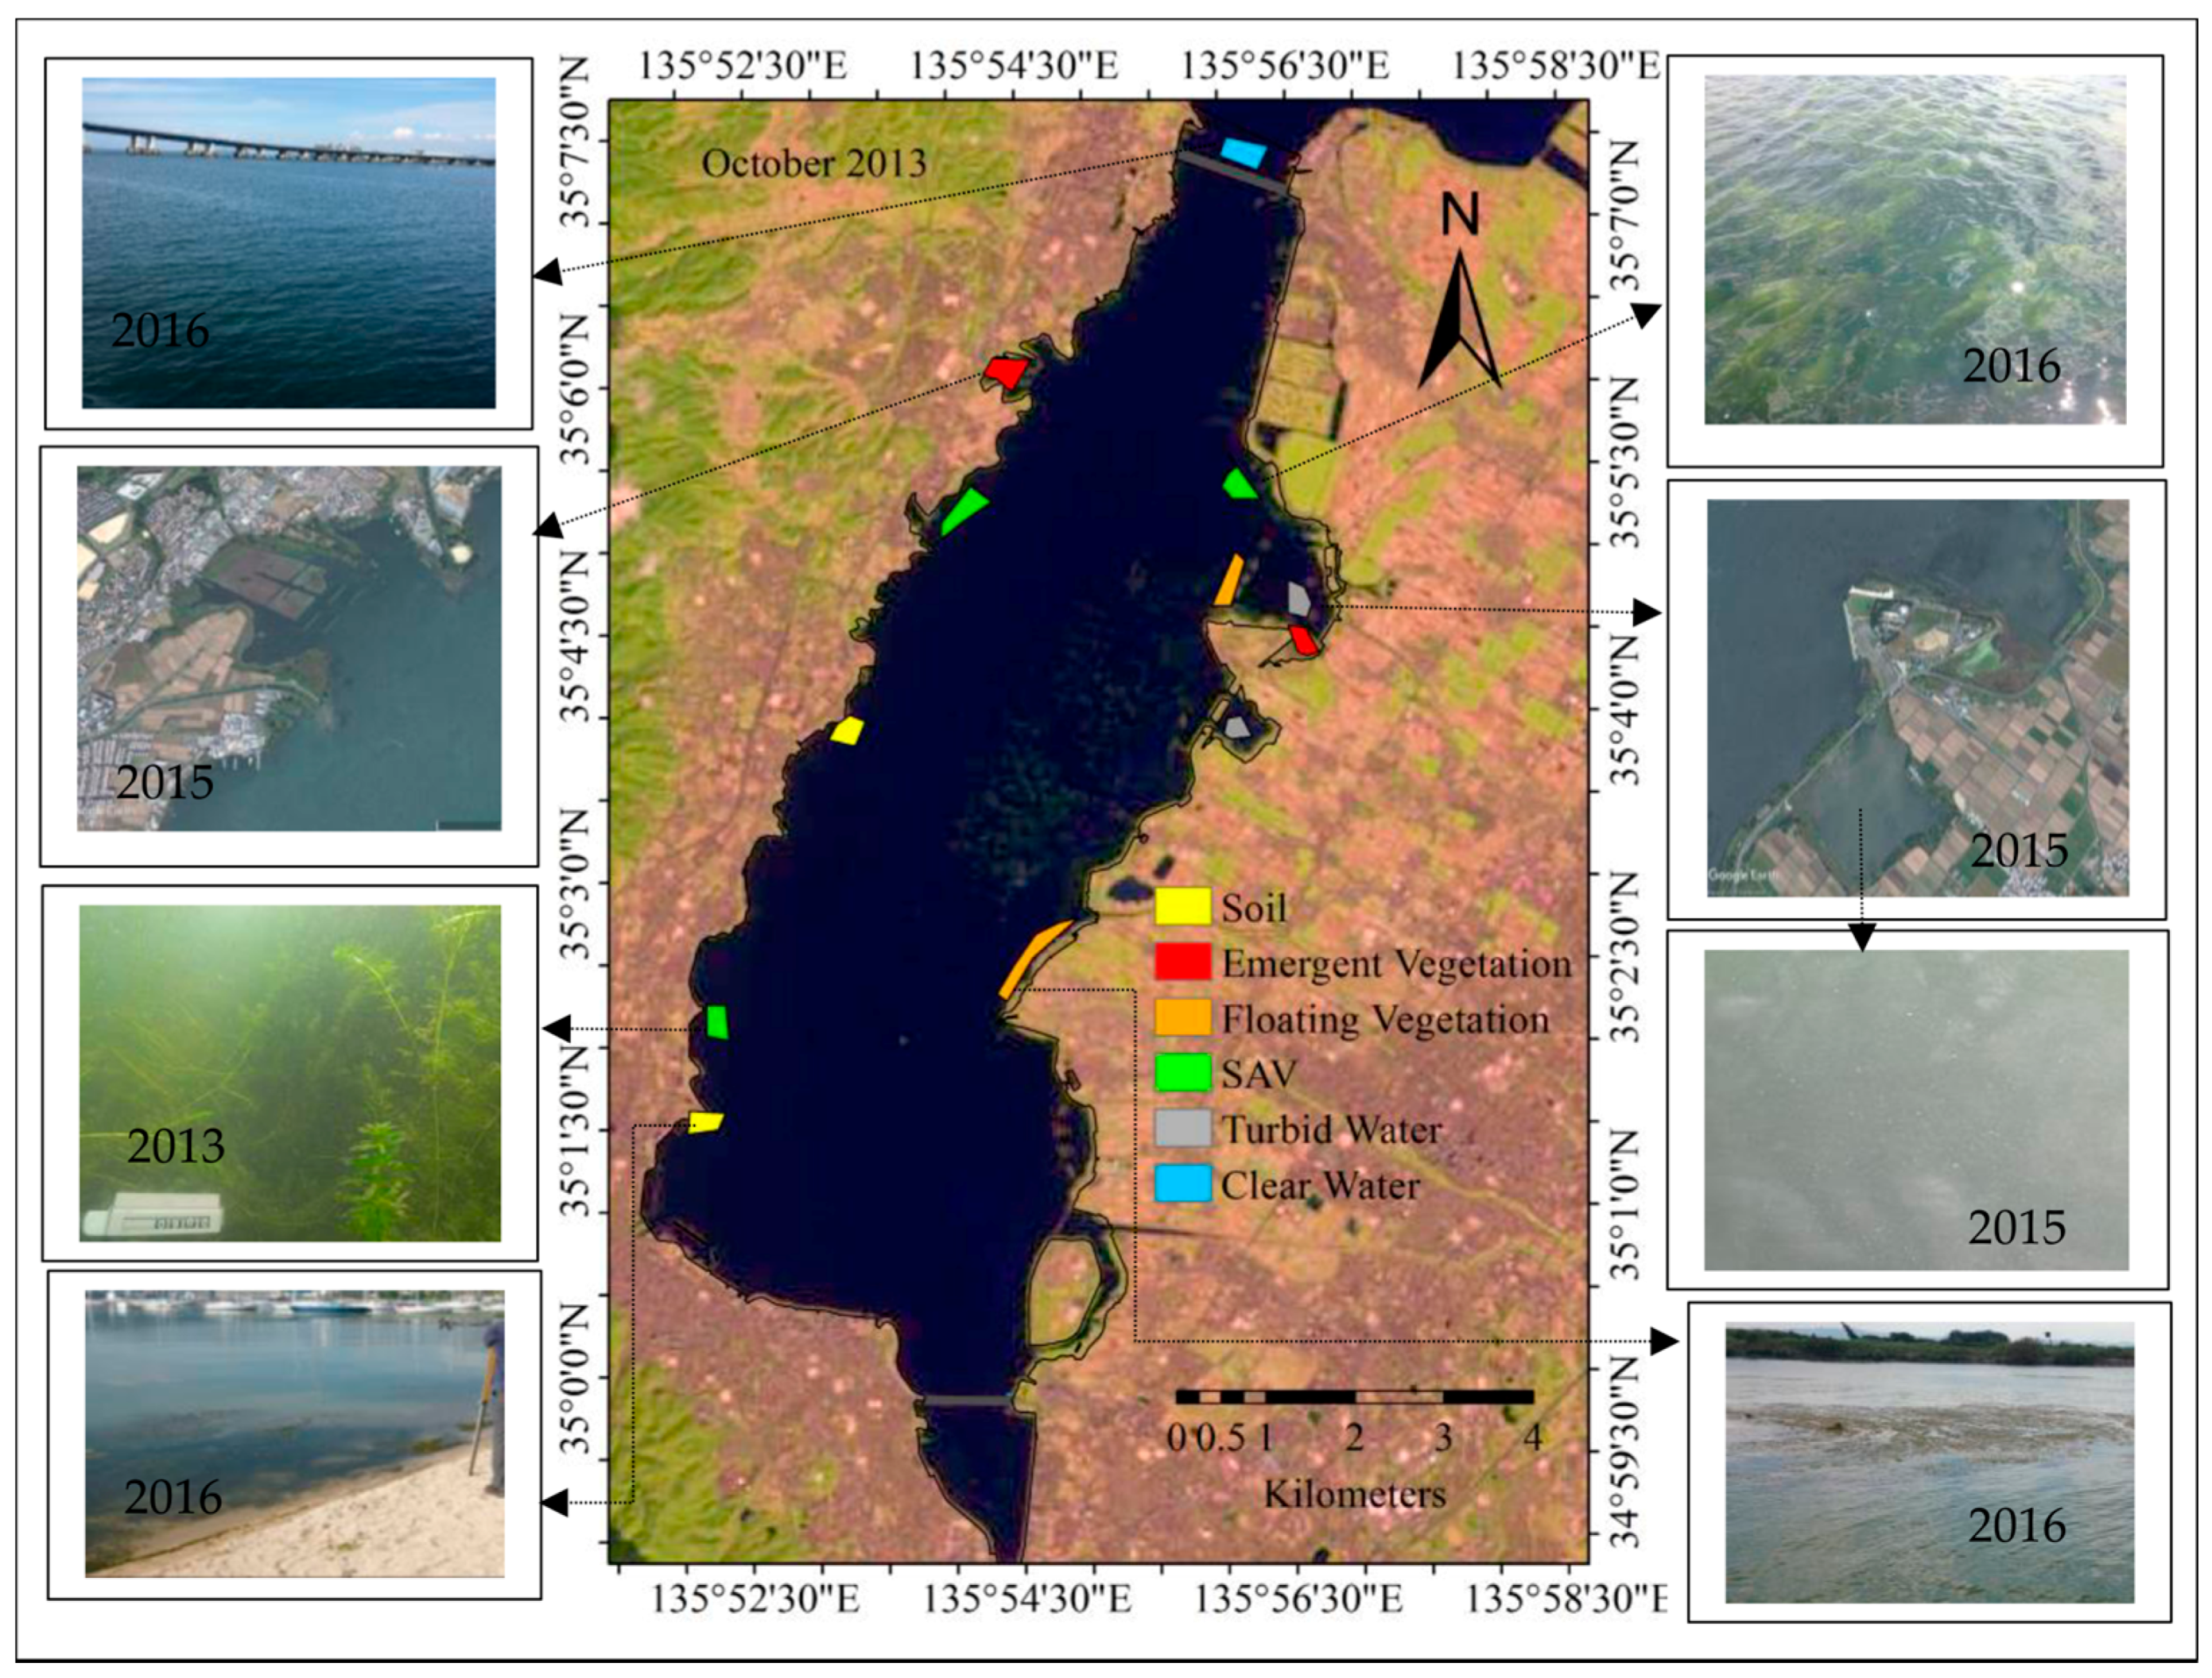
61], we found that SAV stand height varies (i.e., <0.2 m to >3 m) with location and water depth. It could also be the reason for the variation in the SAV detection rate in this study. For instance, SAV could not be detected at a location surveyed in September 2016 (i.e., pixel circled next to station 50 in
Figure 1), where the observed SAV coverage is 95% (diver survey). The estimated SAV canopy depth at the same location was between 3.2 m and 4.3 m (i.e., subtracting observed water depth 5.1 m and SAV stand height 0.76 m to 1.9 m). Similar is the case with the location circled next to station 26, with an SAV canopy depth from 2.6 m to 3.6 m (i.e., water depth 4.2 m, SAV stand height 0.6–1.6 m, SAV coverage 68%), where SAV could not be detected. Furthermore, the discrimination and identification of submerged vegetation become more difficult with the increase in water depth as the proportion of reflectance reaching the remote sensing device, diminishes with water depth [
71]. Thus, apart from coverage area, the SAV canopy depth is also an important factor which substantially affects the detection of SAV. In previous studies, the seagrass of a coastal zone was mapped with an accuracy of only 59% by multispectral imagery (i.e., Landsat) whereas the high accuracy of 85–90% was obtained using the hyperspectral images (such as IKONOS and CASI) [
71,
72]. This further indicates the limitation of mapping deep water SAV species using the multispectral image which offers the information in 4–8 broad spectral bands compared to the hyperspectral images which provide the information at many more narrow spectral wavelengths, located around typical absorption points [
71].
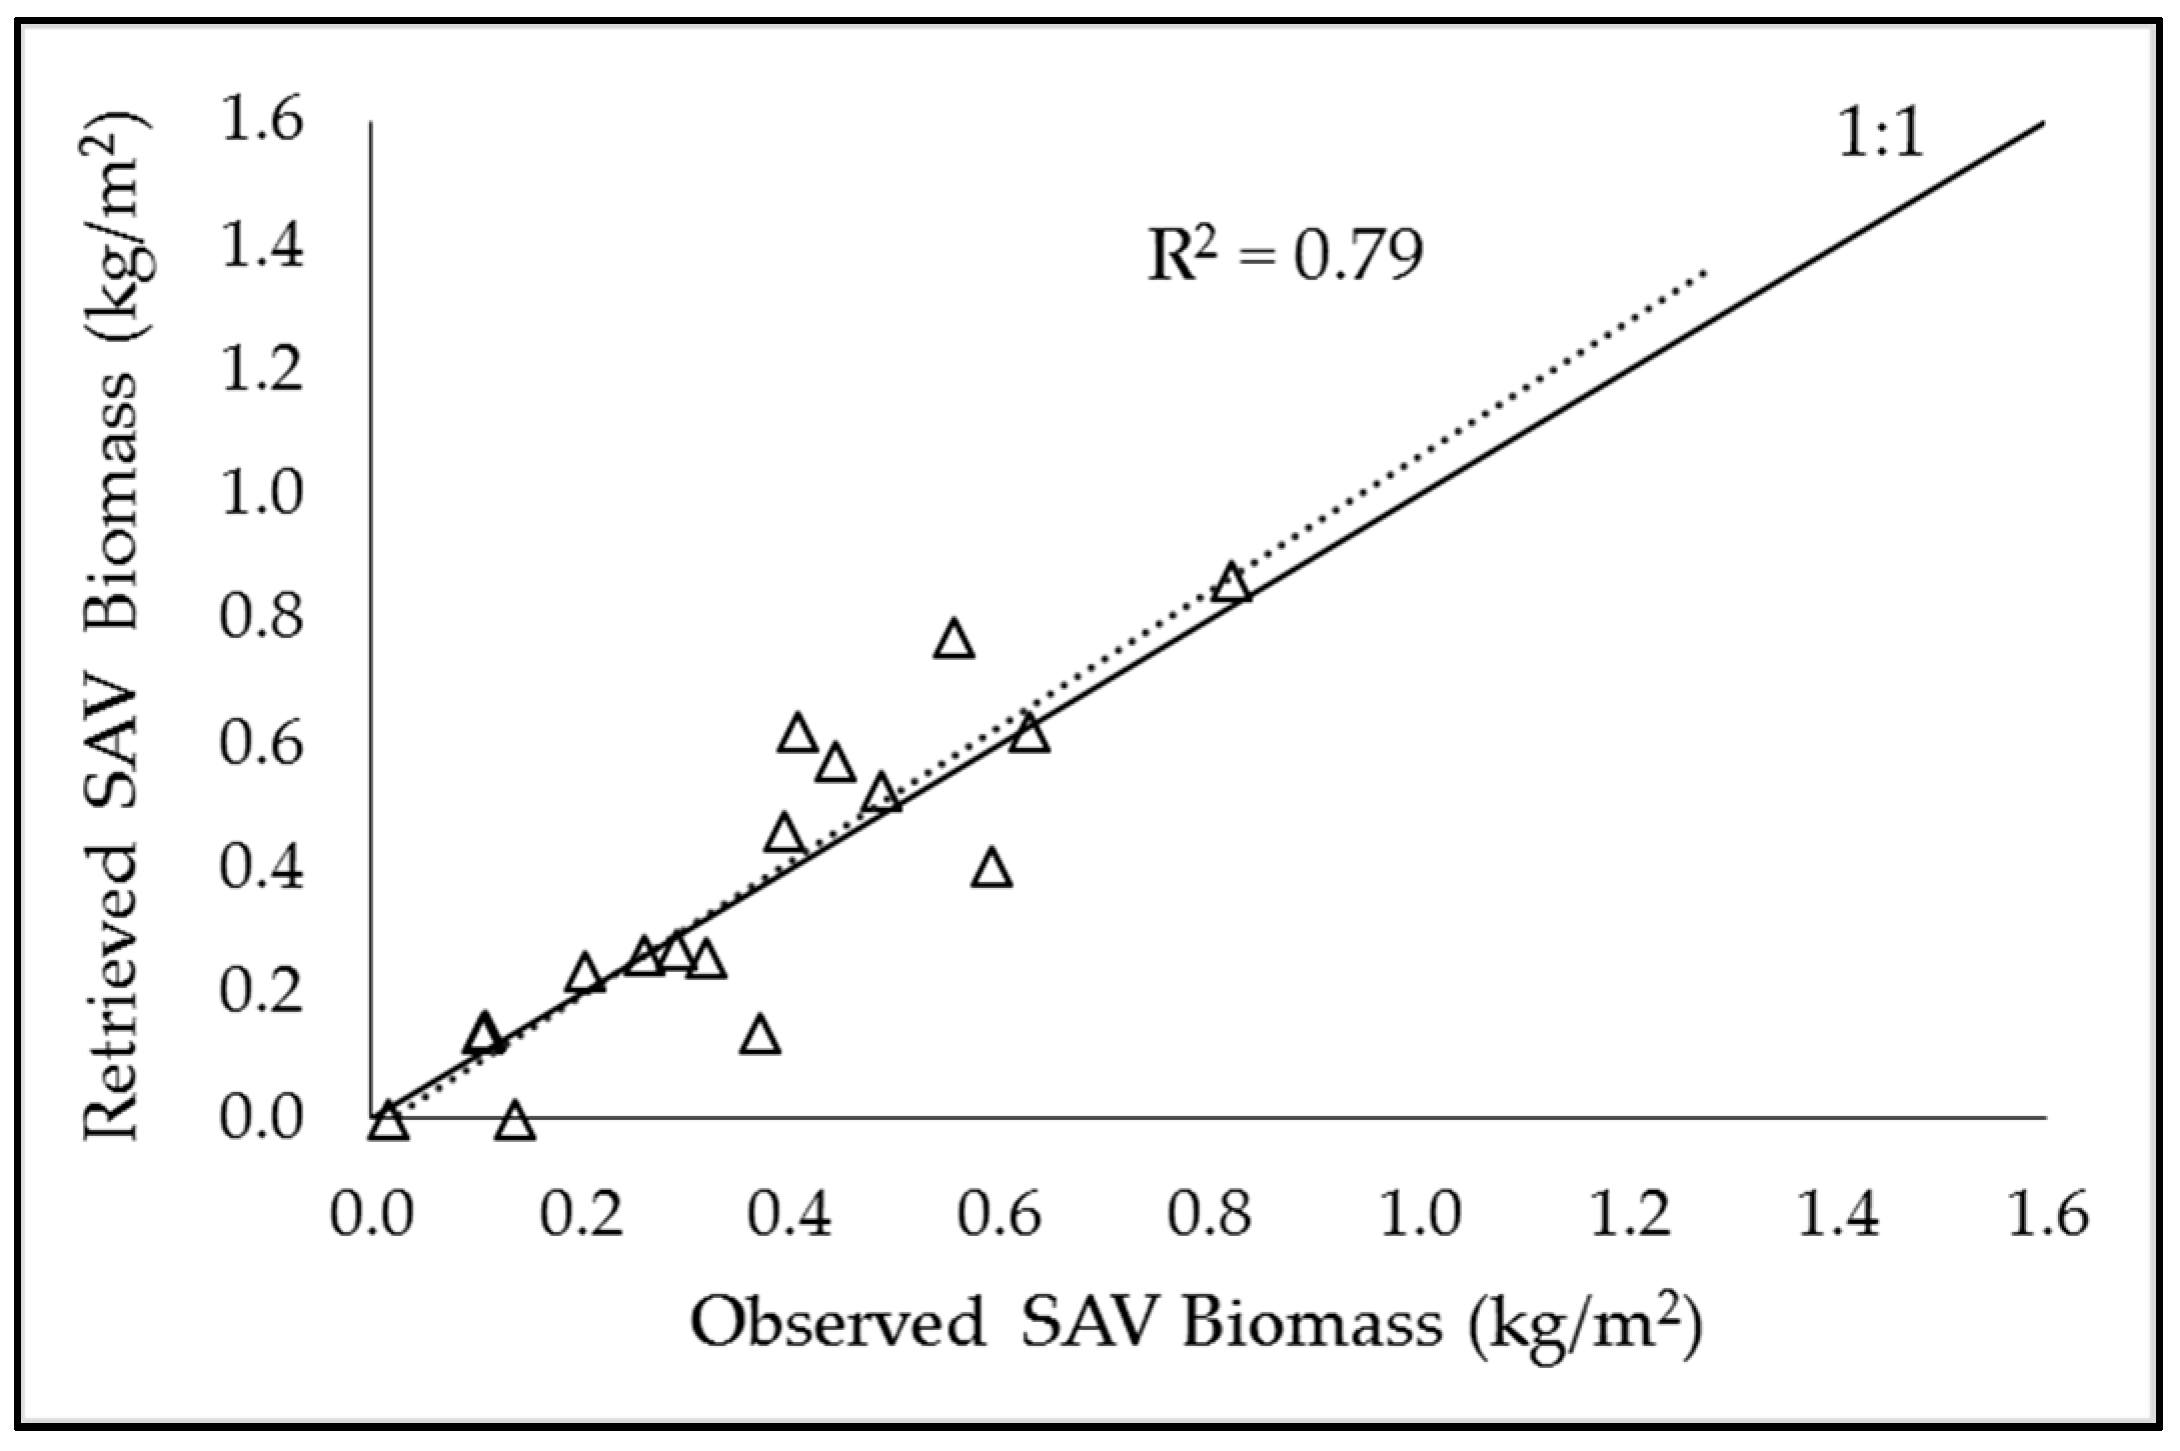
The new Spectral Decomposition Algorithm was developed and applied to determine the SAV biomass for the south basin. Each decomposition coefficient in the algorithm holds the mass information of each endmember, and they were used independently in the estimation model (SAV biomass model). Therefore, compared to the conventional models, this approach is less sensitive to geographical and temporal variability. If the standard reflectance spectra of the respective endmember remain consistent with similar spectral sensitivity, this model could be applied to other satellite images [
51,
73]. The new model is capable of estimating the SAV biomass for the whole lake basin. To avoid any confusion with other mixed pixels, we applied the biomass model to the SAV classified pixels in the satellite image. Because the technique applies to the classified SAV pixels only, the low detection of SAV may affect the total biomass estimation of the basin. Conversely, when the deep water SAV can also be detected, the biomass model can successfully determine the total biomass. Thus, there is a need for a classification approach which can detect the deep water SAV.
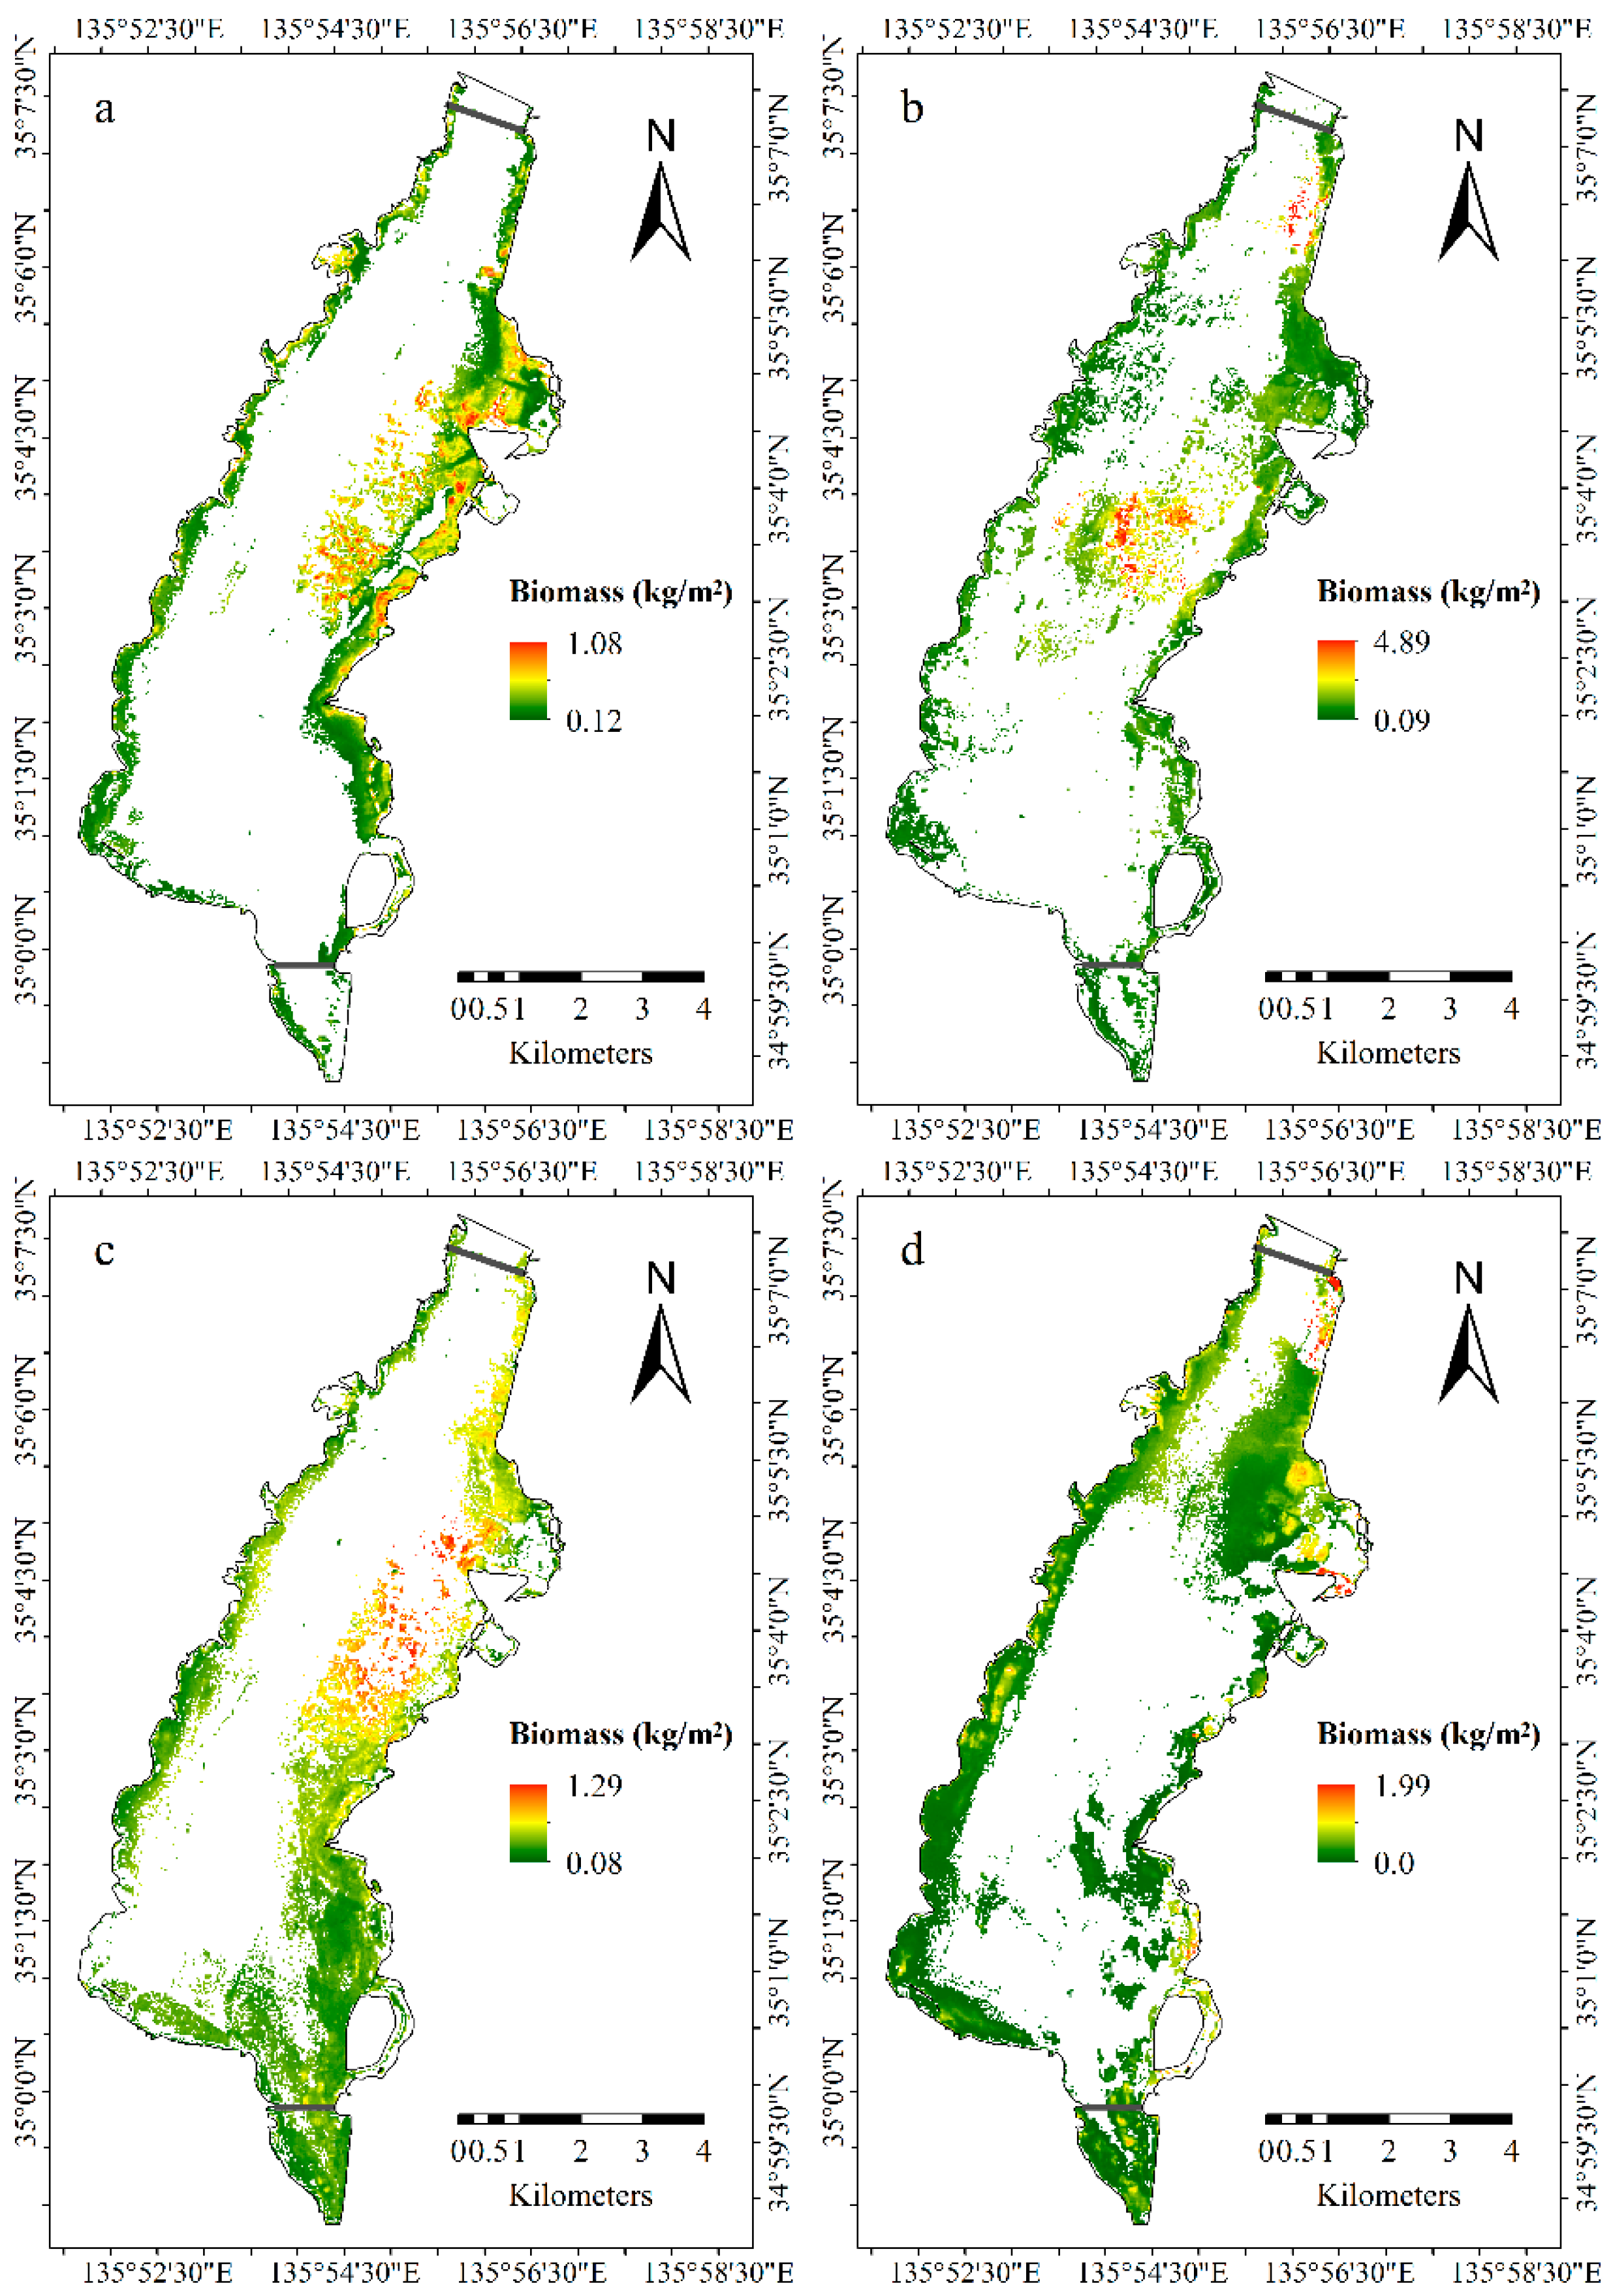
In 2014, the SAV coverage area was comparatively lower than in other years. Conversely, the maximum biomass density is substantially higher (4.89 kg DW m
−2) in the same year. It could be the result of improved water clarity, which allowed sufficient light penetration. Light is predominantly an important environmental factor regulating SAV growth [
55], which is directly affected by the transparency, depth of plant growth, and shading from other plants. Noticeably high total SAV biomass was estimated for 2015 and 2016, following the clear water year (2014). In some instances, the eutrophication or invasive aquatic species results in excessive growth of the SAV biomass, mainly in locations where previously nutrient levels did not support the extensive SAV growth [
3,
48,
55].
Distinguishing aquatic vegetation from the other sources of confusion, such as deep water and turbid water is an essential step before mapping SAV in eutrophic lakes. The prior knowledge of water depth and transparency helps to detect and classify aquatic vegetation from turbid water areas. Nevertheless, SAV detection in inland waters is often restricted by meteorological (i.e., weather condition, cloud cover, the sun, wind speed, view angle), physical (i.e., water depth, wave action), and biological (i.e., phenology of plant species) heterogeneity [
4,
20,
16,
27,
35,
74]. Furthermore, the apparent optical properties (i.e., surface reflectance and diffuse attenuation) and inherent optical properties (i.e., absorption and scattering) of water largely affects the SAV detection in the water bodies [
31,
55,
74]. Even in a pixel with 100% SAV cover, its reflectance is still dominated by absorption of water [
16]. In Lake Biwa, SAV species often grow in clusters. Therefore, it is hard to find a pure pixel representing a single SAV species in a medium resolution image (30 m × 30 m) thus the species level classification could not be performed.
5. Conclusions
We tested the applicability of multispectral Landsat-8 satellite image to map the distribution and biomass of the submerged aquatic vegetation (SAV)-infested area in the eutrophic shallow basin of Lake Biwa. The new biomass estimation model was successfully applied to the SAV-classified area. The study shows that water clarity is important for SAV detection and biomass estimation using satellite remote sensing for shallow lakes. However, long-term monitoring (i.e., monthly or seasonally) is essential to accurately understanding the influence of water clarity on the growth and distribution of SAV in a eutrophic water body. Apart from water conditions and depth, the SAV stand height in the lake also influences the detection of SAV. The estimated biomass density was significantly high for 2014, with high water transparency. An upsurge in SAV biomass to 16% (2014), 55% (2015), and 34% (2016), was noted when compared to the biomass in 2013. The technique provides a biomass estimate that is consistent with the in situ measurements. The satellite-derived results suggest that SAV growth is significantly influenced by the water quality conditions, in the eutrophic basin. However, the changes may not occur immediately but are more visible in the following years.
The limitation of the developed approach is mainly associated with the low detection of SAV (i.e., using SAV classification method) and inadequate ground truth data (i.e., limited field data matching with the satellite image acquisition time). Adequate field data which also coincides with the satellite-overpass time is essential to developing a robust satellite-based model with good agreement, to be applied to other satellite images. In addition, the SAV biomass model also depends on the water transparency data of the lake. Thus, it is essential to have an accurate water clarity information for the respective water body. For detailed SAV species studies, the application of medium resolution satellite images may not be very feasible with limited in situ field data information. Furthermore, with the appropriate information of the potential endmembers (i.e., based on the water condition of the lake), their respective standard reflectance spectra, and with the sufficient water transparency data of the lake, the developed method could be tested on other shallow lakes for SAV biomass estimation.
The Landsat-8 image was successfully utilized for SAV abundance mapping in the eutrophic basin of the large lake. The application of the satellite-based technique to assess the SAV distribution and biomass will be useful for the lake water managers and concerned stakeholders, for frequent monitoring, and to decide effective management activity and remediation efforts for maintaining a healthy lake ecosystem.


