1. Introduction
Ground movement is the soil-related geohazard most damaging to infrastructure in the UK [
1]. As such, the ability to measure the impact of soil movement on infrastructure networks in a cost-effective manner offers great value to utilities, insurance companies, and governments. Infrastructure resilience can be compromised by infrastructure pressures (ageing assets, embrittlement, thinning, increasing demand and loading), environmental pressures (changing climate, soil movement), and financial pressures. However, a fully functioning and fault-resistant system of infrastructure is important for the critical operation of healthcare, transport, trade, and commerce. The UK government is set to invest £100 billion in infrastructure by 2021 to ensure that the UK’s infrastructure needs are met for future generations [
2]. Monitoring the structural condition of infrastructure networks is essential to ensure its long-term resilience. Developing suitable methods to monitor infrastructure networks at the regional to national scale is also a key challenge [
2].
Several in situ techniques are available for the local monitoring of infrastructure assets, including manual visual inspection, levelling, total station surveying, and GPS technologies [
3]. These approaches provide highly accurate measurements of deformation at a single point, yet they require significant investment of human resources and equipment to obtain a high density of measurements suitable for wide-scale infrastructure monitoring. On this premise, satellite remote sensing—particularly with the onset of new generation high resolution Synthetic Aperture Radar (SAR) sensors—can measure deformation over areas several tens of kilometres wide while retaining high precision and accuracy. This allows the cost-effective monitoring of surface deformation [
4].
Advanced Differential Interferometry (D-InSAR) techniques, such as Persistent Scatterers Interferometry (PSI), offer promise for the monitoring of large scale soil movement and long-term deformation of infrastructure networks. PSI requires at least 20 SAR images to measure surface deformation over months or years, removing the effects of atmosphere, topography, and signal noise [
5,
6]. Several applications of PSI have previously been investigated. Some examples include monitoring either natural or anthropogenic urban subsidence [
3,
7,
8], measuring the inter-annual variability of soil related ground movement [
3,
9,
10], the detection of natural hazards such as landslides [
11,
12], as well as observing the structural condition of infrastructure [
13,
14].
This technique is of great potential value to utility companies wishing to monitor assets in near real-time, and could ultimately lead to observations of an entire infrastructure network with a high spatial and temporal resolution. In a recent study of Mexico City, a density of 575 PS targets per km
2 was achieved using the European Space Agency’s Sentinel 1 data [
15]. With the advent of very high resolution SAR data, such as TerraSAR-X, a PS density of up to 5201 targets per km
2 have been recorded [
16]. Lower resolution datasets such as the ERS, and the ENVISAT satellite constellations have an archive of data extending back to 1992, enabling historical evaluations of surface deformation if required [
17]. However, new satellite missions such as the Sentinel 1 offer an increased spatial resolution with a quicker revisit period of 6 days drawing on a combination of Sentinel 1a and 1b, making it a promising new tool for environmental monitoring. On this basis, PSI applied to Sentinel 1 data could provide high density measurements of ground movement on a regional scale and over a range of different land cover types [
3]. Furthermore, PSI outputs can be integrated into a Geographical Information System (GIS) which allows for a greater understanding of the relationships between surface deformation and the natural environment [
18,
19]. Additional data such as soil maps, geological maps, and climate and meteorological data, can all provide information to further explain observed deformation phenomena [
18]. Therefore, remote infrastructure observation with PSI has the potential to prompt proactive asset maintenance, increase network resilience and reduce the need for expensive in situ monitoring.
One example of a PSI investigation is Aldiss et al.’s study [
18], in which a large time series of 60 ERS and ENVISAT images in descending orbit were collected between March 1997 and December 2005, with ground movement being quantified over a 95 × 55 km scene over London, UK. The study found that PSI targets in large parts of the Thames estuary subsided between 0.9 and 1.5 mm year
−1 with the fastest soil subsidence rate being, on average 2.1 mm year
−1. By combining PSI outputs with geological data in a GIS, the authors noted that regional patterns of uplift and subsidence are controlled by both deep geological features, such as the relative mass of underlying geology, and shallow geological features such as fault lines. Boyle et al.’s study [
20] noted that the shrink swell behavior of the London clays can give rise to 50 mm year
−1 of vertical movement (cumulative shrink and swell) over wide areas. This rate of movement was attributed largely to dry summers and wet winters. Both studies [
18,
20] noted the importance of external factors such as extreme meteorological conditions, local topography, urban fabric, vegetation, and anthropogenically-induced subsidence such as tunneling and water abstraction.
National soil maps, such as the one used in this study [
21], often estimate ground movements based on the laboratory assessment of clay soils’ volumetric change potential. Such categorical maps are widely used by utilities, with classes such as “high” and “low” ground movement potential [
22]. Quantification of the vertical movement of soils is difficult due to numerous external factors (vegetation, agriculture, erosion etc.). Therefore, applying PSI over engineered surfaces that maintain high coherence can act as one possible method to quantify soil movement.
Previous studies have investigated the effects of engineering design on the rates of observed surface movement [
3,
16]. The importance of foundation depth is consistently noted as a predominant control over surface deformation of structures. This paper seeks to measure directly how road and rail networks respond to the movement of different soils. By investigating the use of PSI over 6 different UK urban areas (Bristol, Bath, Bournemouth, Kings Lynn, Peterborough and Grantham), a wide range of environmental conditions, soil types and asset responses can be included in the analysis. This work will improve the current knowledge of how different types of infrastructure respond to soil movement—particularly in the UK—and will help determine the suitability of the PSI technique to monitor critical infrastructure networks nationally.
2. Materials and Methods
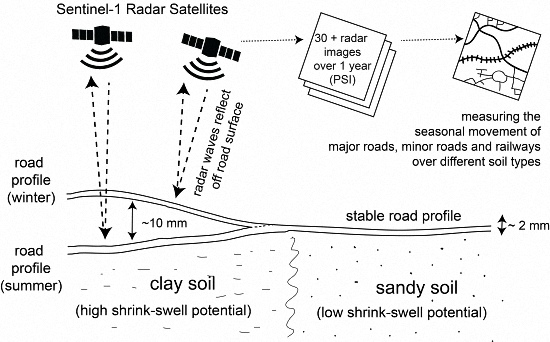
This study uses Sentinel 1a C-band SAR data to produce a time-series of interferograms used in the PSI process. Sentinel-1 Single Look Complex (SLC) data has a swath width of 250 km in Interferometric Wide (IW) mode, with a spatial resolution (pixel size) of 3 m × 20 m in range and azimuth, respectively. The tandem satellites (Sentinel 1a and 1b) cycle over 175 different orbits and have a full-global repeat cycle of 6 days. Many areas—such as the UK—receive more frequent data acquisition.
Sentinel 1 images were selected based on the same orbit number to ensure full spatial coverage of the study areas. Precision orbit ephemerides files were downloaded for each SAR image to ensure that no errors occurred in the co-registration of the data. This process, known as de-bursting, ensures phase continuity over the burst limits. If no precise orbit files are applied, then linear features can appear in some interferograms [
15]. Images were also selected as per the minimum separation between two orbits for each pair (perpendicular baseline) at an interval of at least 12 days, so limiting the temporal and spatial decorrelation of the interferometric pairs. Data were collected in two separate areas (see
Figure 1) so comparison between infrastructure responses over a large area could be undertaken. For the Western study area (Bristol, Bath and Bournemouth), data were downloaded between the 8 September 2015 to the 31 December 2016, with a polarization of VV (Vertical transmit and Vertical receive) in ascending orbit. In total, 23 images were downloaded for processing, including one master image which was selected as the 16 July 2016. For the Eastern study area (Grantham, Peterborough and Kings Lynn), 23 images were collected from the 13 January 2016 to the 8 March 2017, also collected in VV polarisation in ascending orbit. The master image for all Eastern England sites was selected as the 16 August 2016. See
Table 1 for a description of the image dates, perpendicular and temporal baselines of the Sentinel 1a images used in this study.
All PSI processing was conducted using Harris Corporation’s (Melbourne, FL, USA) ENVI SARscape software v5.3. After the SAR images were connected (spatially and temporally), a series of interferometric pairs were created. These image pairs were then consequently co-registered to the master images’ slant geometry. Each of the slave images were then co-registered to the master to calculate the phase difference between each image pair. A Doppler filter was applied to reduce the temporal decorrelation of the image pairs. In this step, a SRTM 3 Digital Elevation Model (DEM) was downloaded with a spatial resolution of 90 m to correct errors related to phase and atmospheric effects between the interferometric pairs. For each study site Ground Control Point (GCP) files were created to correct the images geometrically, after which a Goldstein filter was applied to decrease the signal-to-noise ratio by filtering the differential phase [
23]. Values of 5 in range and 1 in azimuth were used in the multi-looking phase to obtain square pixels for the image pairs. This step is used to avoid the effects of over and under sampling on geocoded images.
The interferometric pairs were then processed by the first and second inversion steps in the ENVI PSI workflow to locate the potential Persistent Scatterers (PS). The first inversion step estimates the residual height and displacement velocity of the study area, and is applied to flatten the interferograms. Reference points are used in this step (one or more) and are automatically selected (based on high coherence and minimal deformation) for the removal of the offset phase from all interferograms. For the processing of large areas, the scene is split into sub-areas where individual processing is undertaken. A mosaicking operation is then conducted to merge all smaller subset areas to produce the final velocity map, and in this instance several reference points are selected. The second inversion step removes the atmospheric phase effects from the interferograms using the low and high pass filters, which correct the spatial and temporal distributions of atmospheric effects. The low pass filter accounts for the spatial distribution of atmospheric variations. The high pass filter accounts for the temporal distribution of atmospheric variations. The second model inversion creates the date-by-date displacements, which is then used to create the geocoded output, which is displacement along the Line of Sight (LOS). The interferometric workflow is based on Ferretti et al.’s methodology, for a mathematical account of the algorithms used see Ferretti [
11,
12].
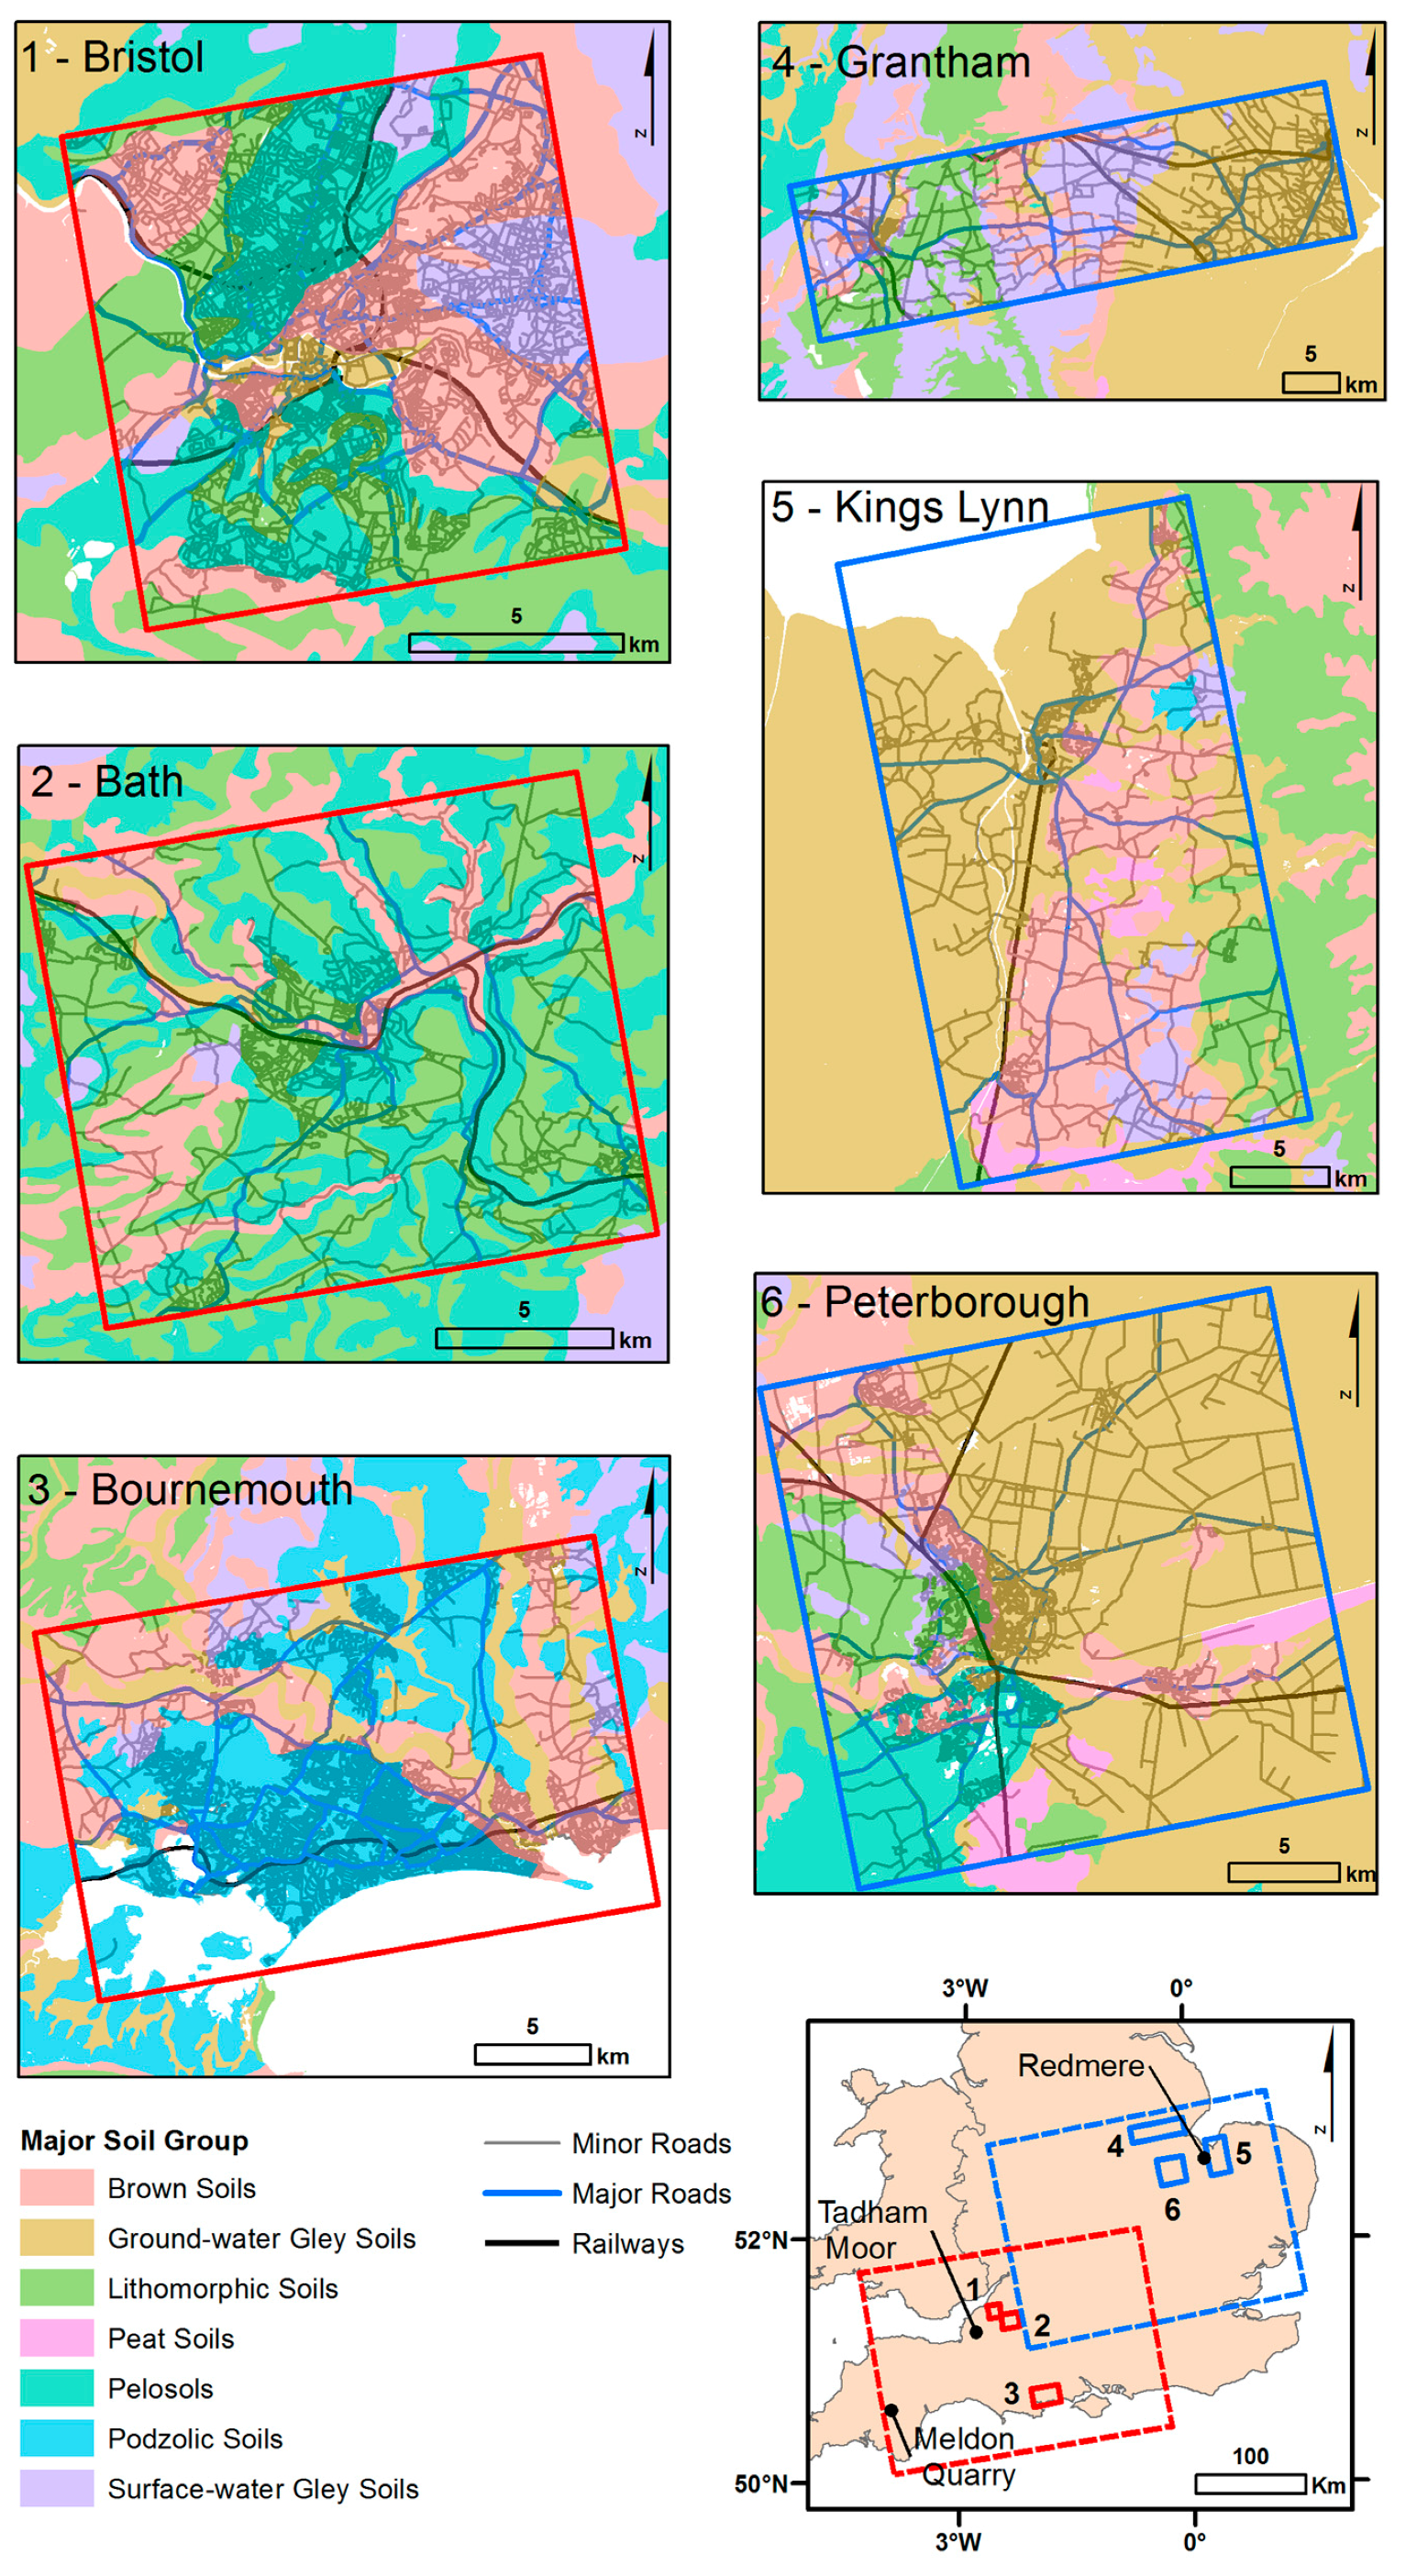
Transport infrastructure data was freely sourced from the UK Ordnance Survey Meridian 2 dataset, which provides a frequently updated and accurate network of principle infrastructure types across Great Britain. The data provides information on the location and extent of motorways, A-roads, B-roads, Unclassified roads and Railways at the nominal viewing scale of 1:50,000. Data is provided in a GIS ready format, with road classification provided as attributes. Road types were categorised into minor roads (Unclassified and B-roads) and major roads (A-roads and Motorways), to simplify the analysis. From these categorisations, a buffer distance of 2 m from the center line of infrastructure was created for minor roads, 3 m for major roads and railways, and 4 m for motorways. This buffer zone was then used to subset the PSI output. This ensured that only PSI points which are in close proximity to the infrastructure were analysed, which reduces the number of PS points returned from pavements (sidewalks), surrounding buildings and vegetation and adjacent unconsolidated ground.
By analysing the PSI output in a GIS environment, each PS point was attributed with information pertaining to the major soil group, which permitted contrasting the information about ground deformation with major soil groups. This study uses Cranfield University’s National Soil Map [
21]. The 1:250,000 scale soil map contains information related to soil properties including ground movement potential (based on the laboratory assessment of volume change potential of soils, categorized from “low” to “high”), texture, drainage, fertility, land cover, and habitats. The major soil groups included in this study were Brown soils, Ground-water Gley soils, Lithomorphic soils, Pelosols, Podozolic soils, Surface-water Gley soils, and Peat soils—see
Table 2 below for their descriptions.
Validation of the PSI outputs was undertaken over the closed Meldon quarry site (50.716084N, −4.026326W—see
Figure 1. Meldon Quarry has been disused since 2007 [
24], and comprises a mixture of metamorphic and igneous rocks. To this extent, the geology is highly stable and so presents itself as an area of high coherence, excepting natural erosion and deposition. The PSI processing over Meldon Quarry was undertaken with an identical model set up as for the 6 other test sites, so direct comparison upon the reliability of the results could be determined.
In total, six sites were selected for this study, separated into two distinct study areas, see
Figure 1 and
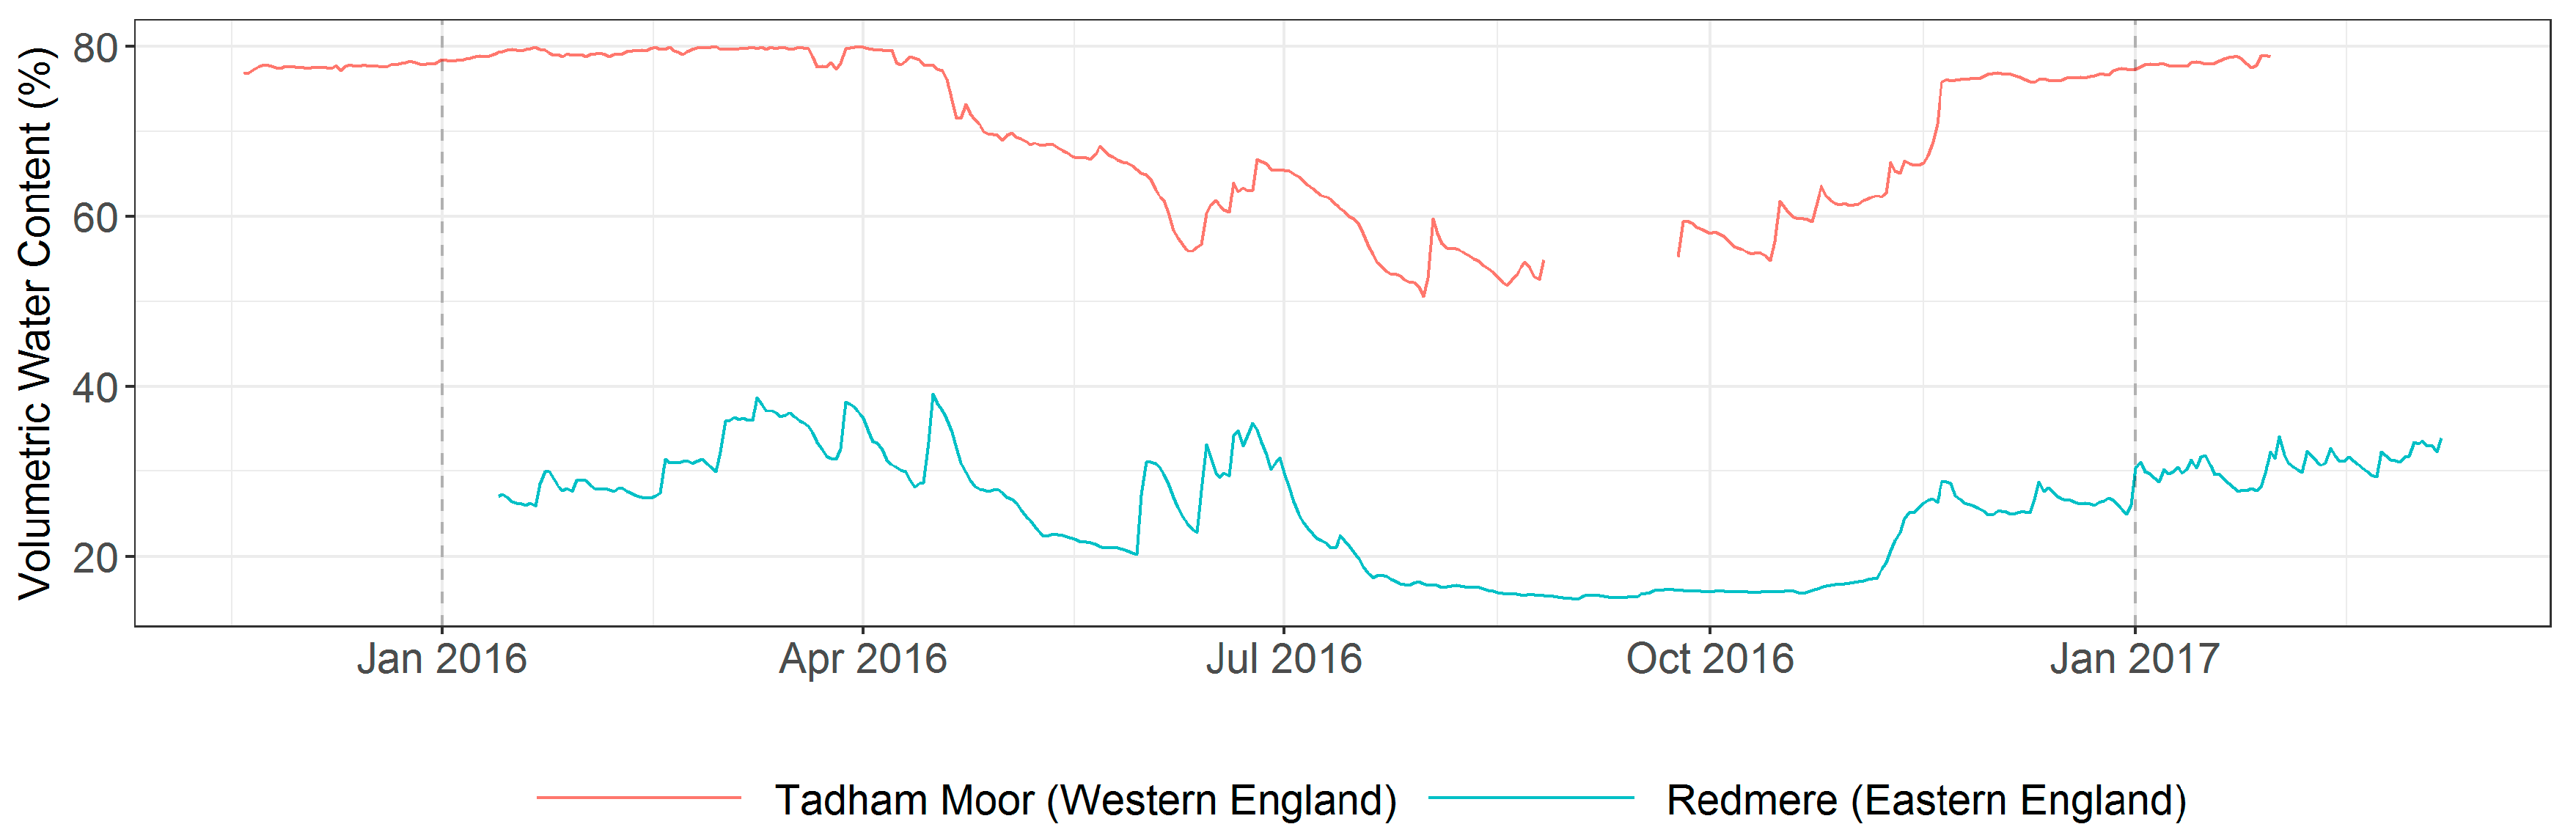
Table 3. The prevailing climate across all sites is classified as temperate oceanic, with all areas receiving regular precipitation events throughout the year. Sites situated in the West of England receive on average 195 mm more precipitation annually than sites in Eastern England. Of the six sites, Bournemouth receives the highest annual precipitation of 835 mm, whilst Grantham receives the least (608 mm). Temperature ranges exhibit very little variation between all six sites, with typical maximum average summer temperatures of ~21 °C and minimum average winter temperatures of ~1 °C. Bournemouth receives the highest range in monthly total precipitation from 47.8 mm in July to 100.7 mm in December. Grantham receives its highest monthly precipitation in October—59.3 mm—and its lowest—36.8 mm—in February. Bristol and Bath show similar precipitation trends to Bournemouth, whilst Kings Lynn and Peterborough show similar trends to Grantham. Due to the seasonal changes in temperature and precipitation all study sites have annual profiles of soil moisture which gives rise to the conditions required for the shrinking and swelling of clay soils. Moreover, soils which are prone to seasonal waterlogging (i.e., Ground-water Gley soils, Brown soils, Pelosols and Surface-water Gley soils) may also show shrink and swell cycles in accordance to available soil moisture. In situ soil moisture data was obtained from two representative meteorological stations (data provided by the Centre for Ecology and Hydrology). The data provided in
Figure 2 shows the daily averaged (from 30-minute measurements) soil Volumetric Water Content (VWC), taken at a depth of 10 cm using a Time-domain Transmission probe. As expected, the Eastern site (Redmere) held the lowest VWC value 14.8% (2 September 2016) with a range of 26.6%, whilst the Western site (Tadham Moor) had a significantly larger VWC—49.5% (1 August 2016)—and a range of 33.9%,
Figure 2. Therefore, some degree of surface deformation was expected in all study sites where clay soils, or soils which have significant volume change potential, are present.
The Bristol and Bath study sites both have had an extensive history of coal mining dating back to 1223 [
17], as well as mineral mining which can be dated back further to 2000 years. Due to high likelihood of surface deformation, a previous PSI investigation using ERS and ENVISAT data has been undertaken over Bristol and Bath [
17] and despite the historic mining activity, compressible alluvium, and shrink swell soils being present, no surface deformation was observed using PSI in this study. This present study measures recent surface deformations over Bristol and Bath using Sentinel 1 data. However, our results can be compared with previous DinSAR investigations in the area, offering continuity of surface deformation data between previous and current satellite missions.
The other sites were selected based on the high potential for infrastructure responses to shrink swell cycles of soil. Sites selected in Eastern England have the highest shrink-swell potential of soils in England, based on the largest annual Soil Moisture Deficit (SMD) [
25]. Pritchard, O.G. et al. [
25] notes that Eastern England has the highest SMD rates in the country, calculated from the daily precipitation, evapotranspiration and drainage of the soil, and describes the amount of water needed for the soil to return to field capacity (in mm). Furthermore, we include the response of railways to peat soils deformation in the Peterborough area, which is of importance given the significant peat wastage rates described in [
26]. The predominant land use in Eastern England sites is agriculture. Bournemouth has been selected as a control site, with freely and quickly draining bedrock lithology (of chalk and gravels) and Podzolic soils which are not prone to soil deformation. To our knowledge, Bournemouth, Kings Lynn, Peterborough and Grantham have not been included in any previous PSI investigations. The sites selected all have different urban densities, which help in understanding the effectiveness of PSI for monitoring infrastructure across a range of landscapes. The study areas of Bristol and Bournemouth have the most-dense urban fabric, whilst Bath and Peterborough contain a mix of rural and urban areas. Grantham and Kings Lynn are mostly a rural (agricultural) landscape, with pockets of dense settlements allowing for the PSI process to be undertaken. A description of the lengths of infrastructure, study area extent, and a description of urban coverage is provided in
Table 3.
4. Discussion
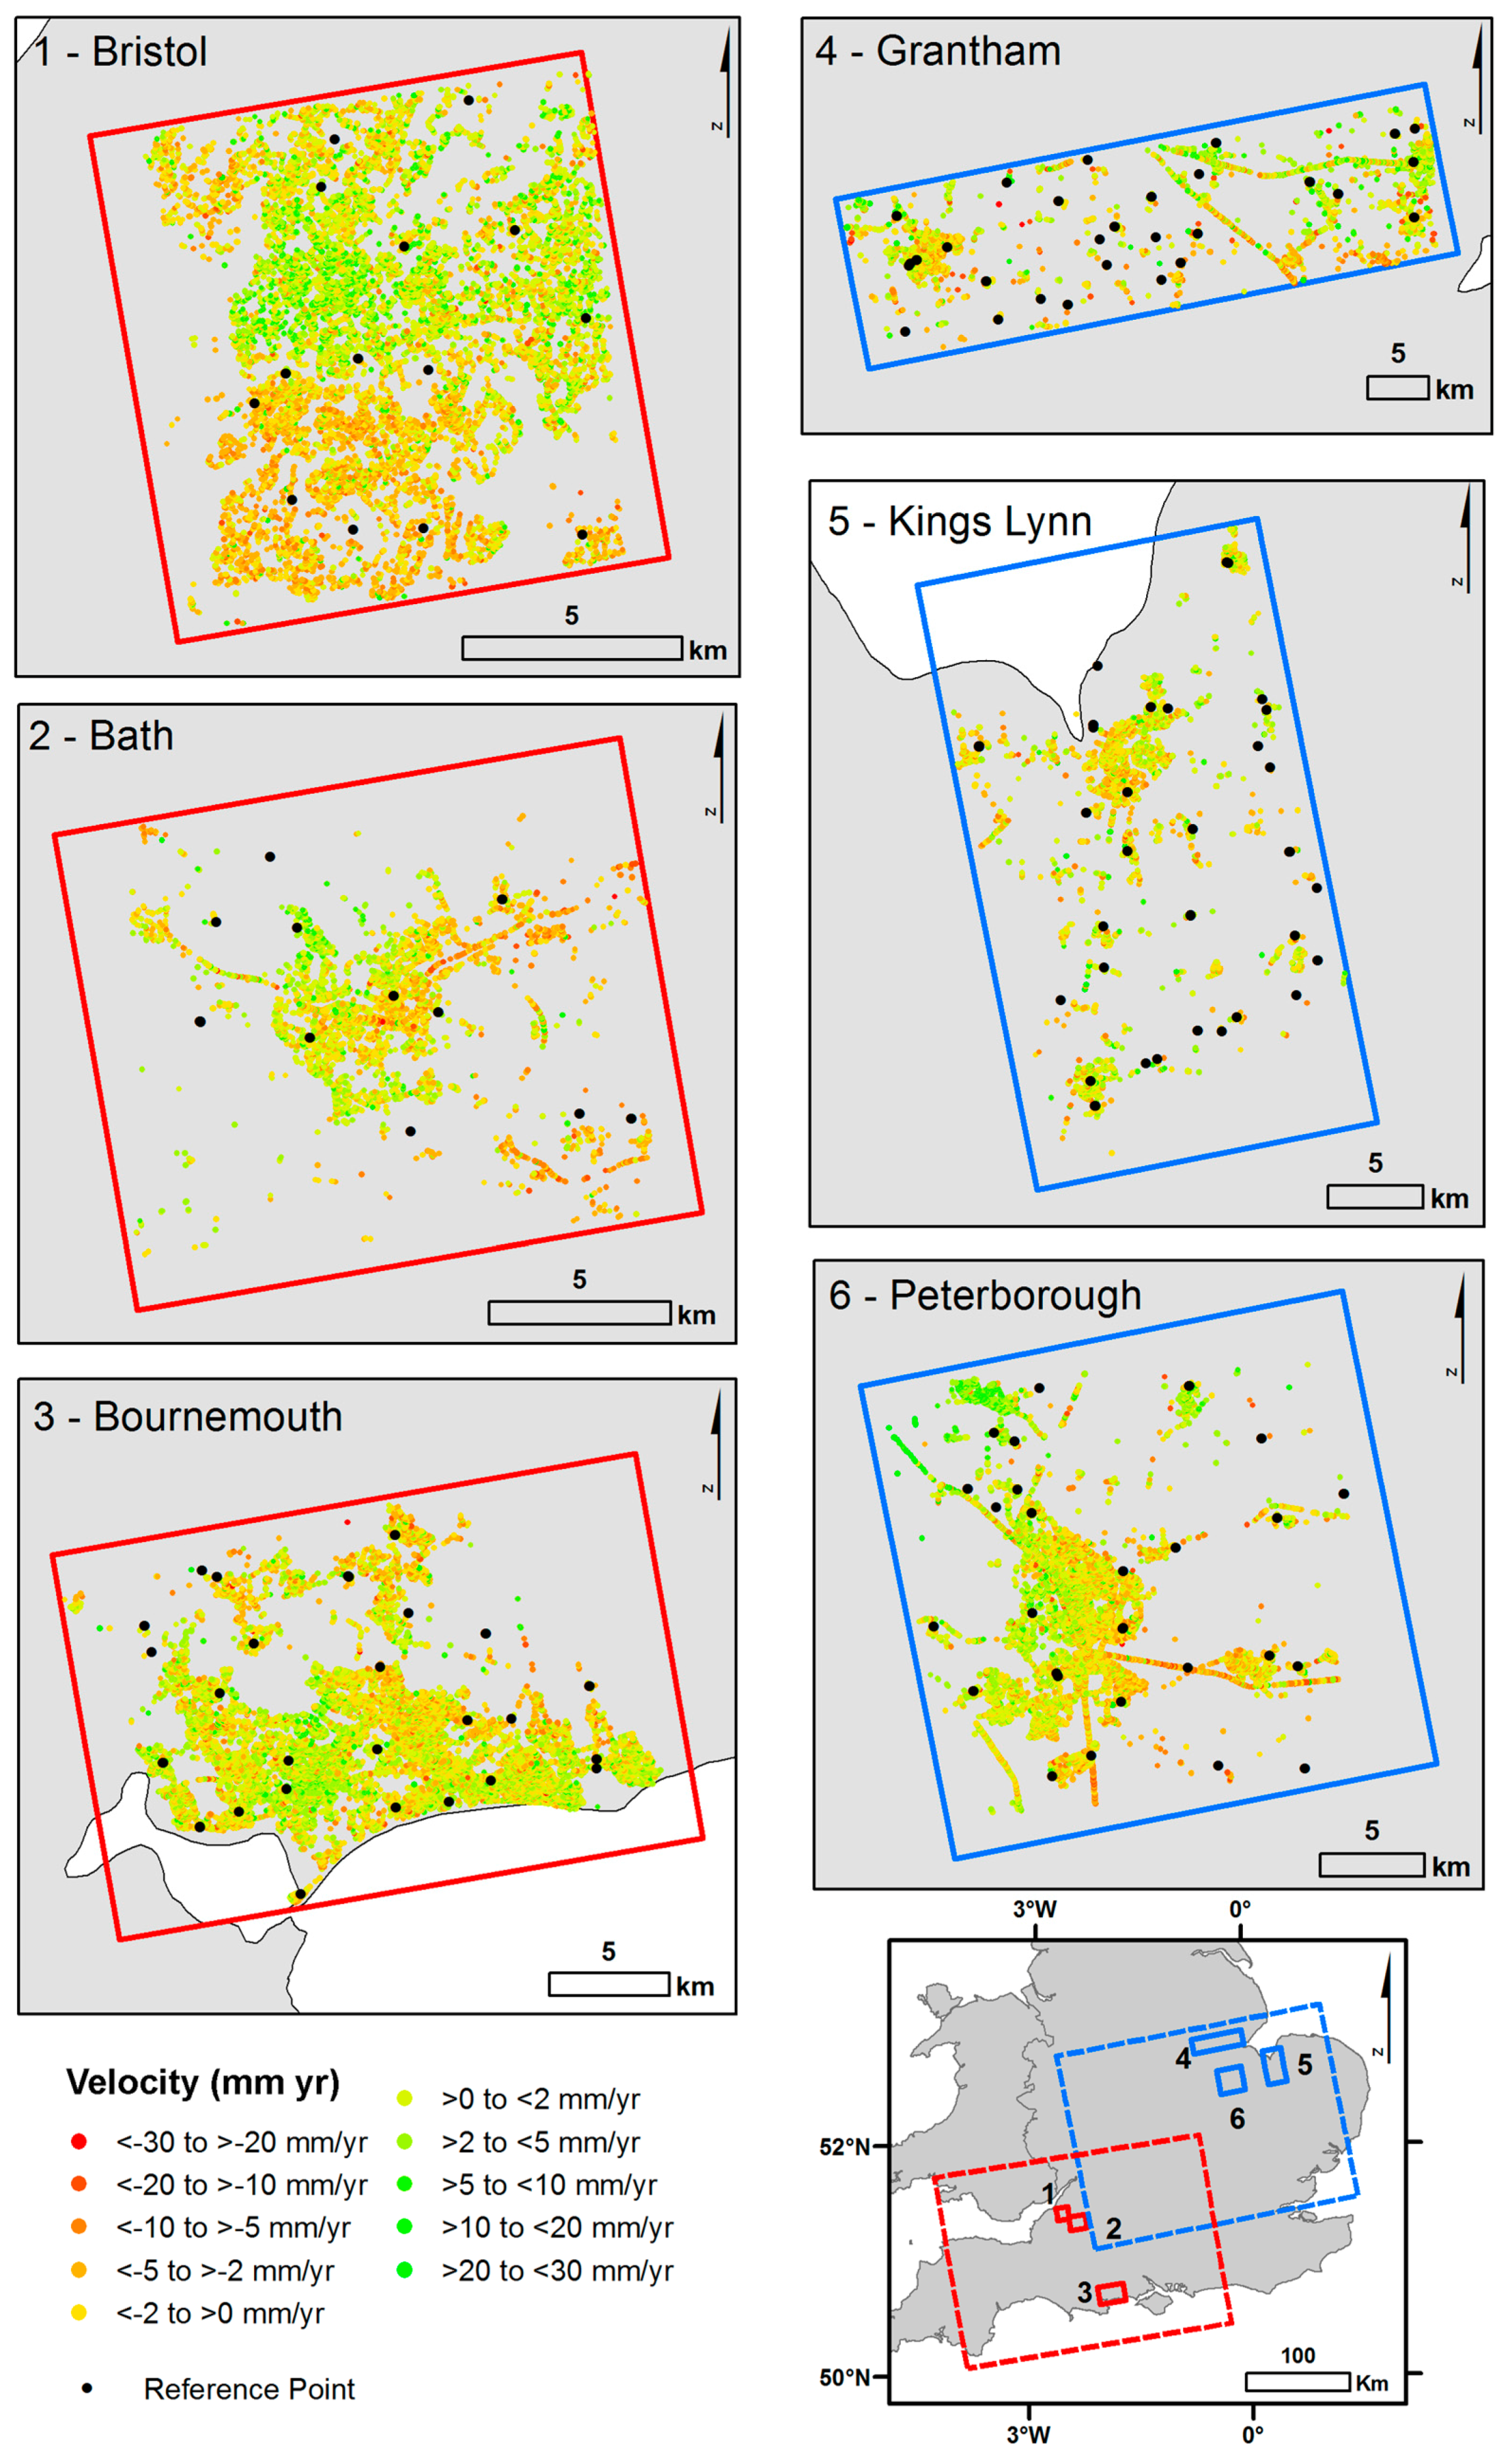
Sentinel 1 is highly effective to monitor infrastructures over the selected study sites. The response to seasonal soil moisture changes has been detected in the three of the infrastructures investigated. Observed surface deformation has been discussed as a function of both major soil group type, soil moisture change and the infrastructure’s engineered design. Observed deformation across all sites reveal unique spatial and temporal patterns of measured movement, which have been discussed as functions of the regional water use and the shrink swell potential of the different soil types studied. Sentinel 1 has proved itself to be effective at capturing these patterns across relatively wide study areas. This holds operational promise for the long-term monitoring of infrastructure using Sentinel 1 with PSI.
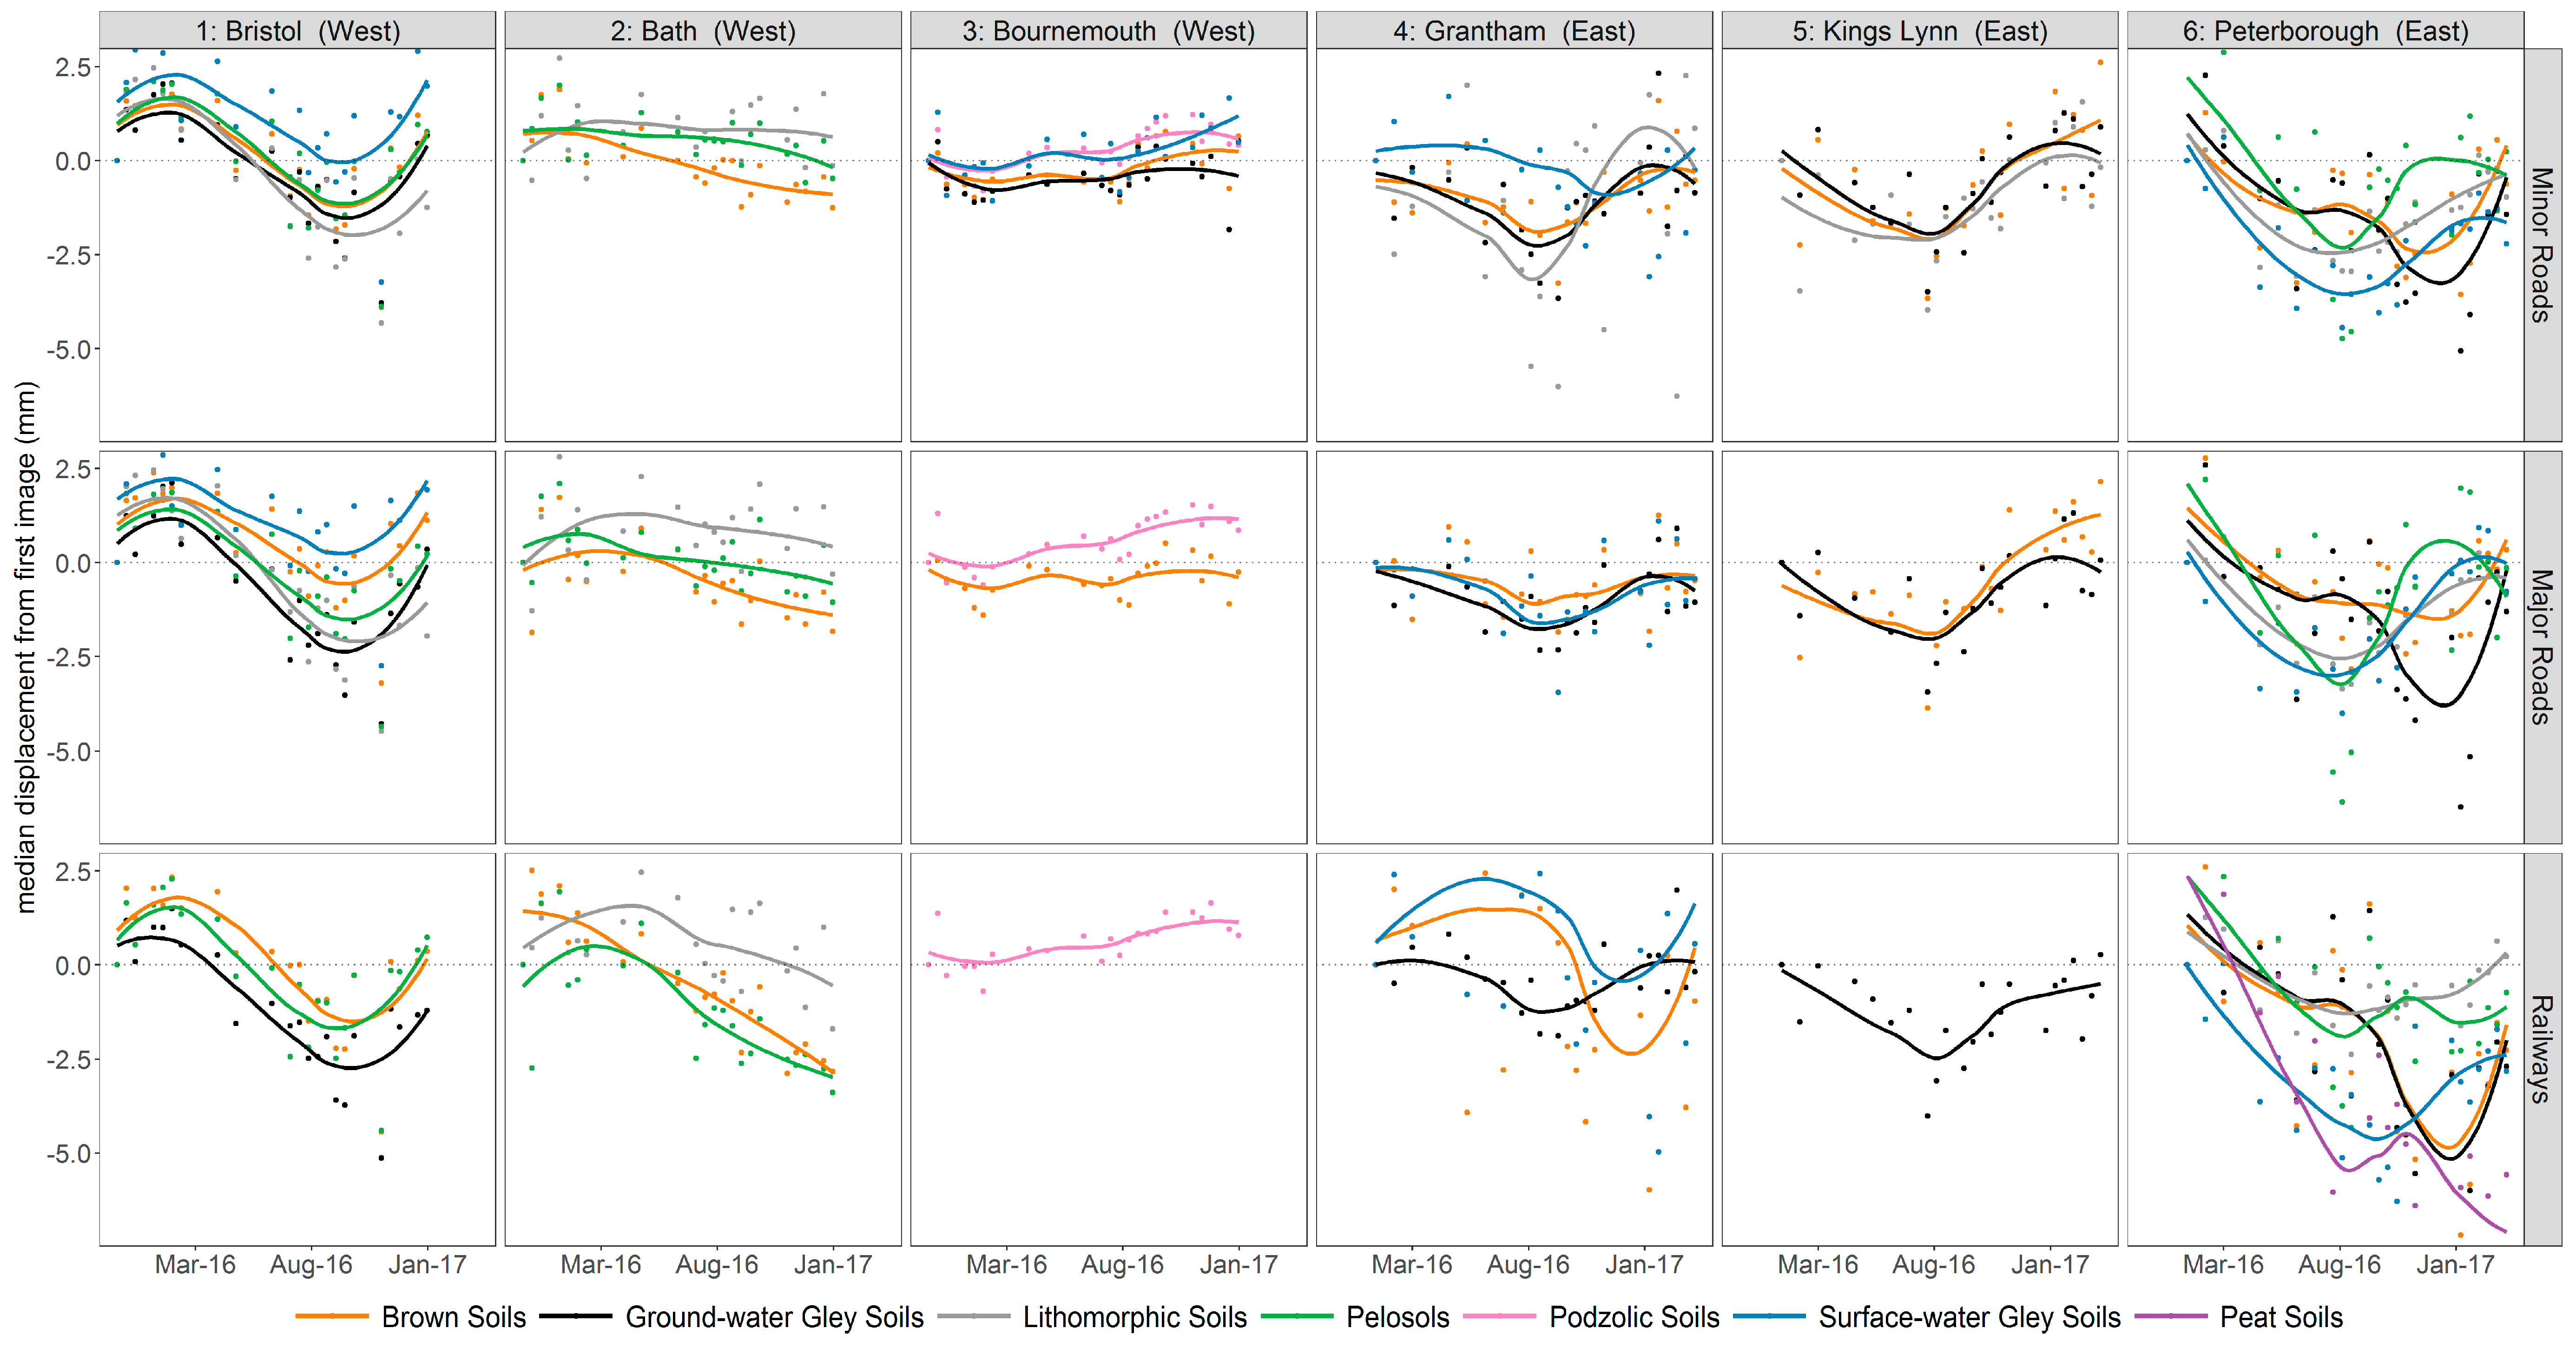
It is evident that different soil types have an influence on observed infrastructure movement. This is particularly so for soils which are seasonally waterlogged and exhibit cycles of drying and wetting. Surface deformation of infrastructure has been observed to deform (along LOS) in all infrastructure classes analysed, mostly coinciding with the expected periods of soil shrink (summer months), and soil heave (autumn and winter months). The main soil groups included in this study which are prone to seasonal volume change are Ground-water Gley soils, Brown soils, Pelosols, and Surface-water Gley soils. All these major soil groups condition the heave and shrink of infrastructure, see
Figure 4. Several surface deformation trends do not appear to follow seasonal pattern of shrink and swell. These unexpected results may be attributed to regional factors associated to the regional water regime such as intense agriculture, water abstraction, irrigation, and the presence of rivers and lakes. Direct analysis of these factors is out of the scope of this paper, yet for the Eastern study sites it should be noted that this region is under highly intensive agricultural land use, with significant drainage and irrigation, so it may not follow the expected seasonal response to soil moisture change. In such areas, variations from the expected deformation patterns are particularly evident for Brown soils (common agricultural soils) and Ground-water Gley soils in Peterborough, where a lag in infrastructure shrink is present, demonstrating a maximum subsidence in December 2016. This lag might be the result of active water management, such as irrigation and drainage from agricultural practices, which stabilises water content during summer and drains land during winter. These effects are particularly prevalent in the Fenlands (Eastern study sites) where the artificial pumping of water manages peat drainage [
26]. Moreover, upon analysis of the soil moisture content for Redmere (
Figure 2), a low soil moisture was recorded until November that year, which further explains the lagged result seen in surface deformation over soils directly affected by the often anthropogenically controlled soil moisture content of this area. Remotely sensed soil moisture measurements would enhance the understanding of the relationships between surface soil moisture change, and observed ground movement using PSI, however this was also out of scope for this paper.
In comparison, Bournemouth shows relative stability (
Figure 4) in infrastructures. The main soil groups are Podzolic soils, Brown soils, Ground-water Gley soils, and Surface-water Gley soils. The observed stability can be attributed to the freely draining soils over permeable bedrock in Bournemouth, consisting predominantly of chalk, limestone, sands, and gravels.
Variations in deformation rates are evident for Lithomorphic soils in Bath, Bristol, Grantham, Kings Lynn and Peterborough. For example, Bath, Kings Lynn, and Peterborough show minimal deformation over Lithomorphic soils whilst Grantham and Bristol show significant deformation profiles. As a major soil group, these soils are mostly very shallow and consist of seven sub-groups [
27]. Therefore, analysis of the major soil group in this case may not fully represent the area’s soil characteristics and thus the resultant infrastructure movement being observed. Further analysis of more detailed soil classes is required to fully characterise the interactions between Lithomorphic Soil types and infrastructure movement.
Despite its low sample size of just 113 PS points, infrastructure underlain by Peat soils showed subsidence rate of −7.5 mm year
−1. Peterborough is the only site to have included analysis of Peat soils, but the findings of this remain important due to the high potential impact subsidence can have on the railway network operation and safety. Rates of deformation observed in this study are slightly less than that found by the assessment in [
26] of the East Anglia Fenland wastage, in which it is noted that mean average wastage (over open fenland) can vary between 19 mm yearr
−1 and 127 mm year
−1 for thin and thick deposits of Peat soils respectively [
26]. However, Holman, I. et al. [
26,
28] makes no direct mention of the impact of infrastructure on peat wastage. The railway observed within this study is situated on a raised, highly-engineered embankment just to the west of the Holme fen nature reserve. The impact of the railway embankment compressing the peat may lead to compaction of the Peat soil, which is suggestive as to the cause of rates of subsidence observed within this study.
A validation of the PSI output was undertaken over the disused Meldon Quarry in Dartmoor National Park [
24] (
Figure 5). This test site was selected for its highly stable bedrock and coherence. No vertical movement was expected during this observation period, apart from some deposition from the weathering of the quarry walls.
Figure 5 shows minimal movement from the 1579 PS points on the quarry. However, in between March and May 2016 uplift and subsidence of approximately ±1.5 mm is observed. As this movement is consistent across the inter-quartile range of the points, and more sudden and extreme than expected, it is suggested that this movement is due to issues of the data, data cleansing, or PSI technique. This level of uncertainty must be taken into consideration when reporting these results. Given the scale of the movements considered in this study and their seasonal patterns, observations of the trend—rather than individual movement—are suggested as being appropriate. Obtaining levelling or GPS data during this study’s observation period for a number of locations in all study sites would improve the validation of the results.
The rates of deformation in this study are aligned to previous investigations which have used PSI to monitor earth surface movement in the UK [
18]. Apart from [
20,
25], there is limited work reporting investigation of the relationships between major soil group type and infrastructure movement using PSI, particularly in the UK, so limited direct comparisons can be made. Several papers have investigated infrastructure deformation using the PSI technique [
3,
8,
14], but these studies use PSI to assess the structural condition of infrastructure assets in areas of known continual ground deformation. These studies note the importance of regional deformation phenomena, such as ground-water abstraction, legacy mining works or seismic activities as key considerations to make when investigating infrastructure deformation at a network level. The rates of deformation from these studies [
3,
8,
14] are highly variable, but often much higher than those reported in this study (up to −73.3 mm year
−1) in the case of [
3].
Peduto et al. [
29] used PSInSAR to monitor the impacts of soil movement upon building damage in Rotterdam, Netherlands. Observed deformations of >10 mm year
−1 were attributed to high risk soil types such as clay and peat. Despite the observed surface deformation velocities being higher than in this current study, the high risk soils identified correlate to this present study thus increasing confidence in the findings presented. Spatial correlations of deformation were analysed, and PS observations categorized into moving/non-moving, using a 2 mm year
−1 threshold. The approach of categorizing buildings into moving/non-moving classes would help better identify at-risk areas in linear infrastructure assets which might help to prompt pro-active management by utility operators.
Previous PSI investigations of Bristol and Bath have revealed no evidence that the history of mining in this area has induced any long-term subsidence [
17]. This paper found no notable trends in mining-induced subsidence when analysing the PSI output with historic mining extents. This is aligned to the results in [
17], however the limited observation period of this study should be taken into consideration. The Terrafirma study [
17] also noted that differential compaction was evident across both Bristol and Bath, which is confirmed by this current study, which reflects the diverse range of soil types found across the Bristol and Bath basin. To our knowledge, this is the first study of its kind investigating Bournemouth, Peterborough, Kings Lynn, and Grantham using PSI, so no direct comparison of results can be made.
5. Conclusions
This study has applied a surface deformation investigation using PSI in six UK study sites to determine the impact that different soils have on the LOS deformation of roads and railways. Sentinel 1 has been shown to be effective at measuring surface deformation of these thin, linear infrastructure assets across a range of environmental settings, thus demonstrating PSI with Sentinel 1’s potential for wide scale infrastructure monitoring. By combining PSI outputs with the 1:250,000 scale National Soil Map, this study has identified, in these areas, four major soil groups which pose a ground movement risk to infrastructure networks (Brown soils, Ground-water Gley soils, Pelosols, and Surface-water Gley soils). These soils are characterised by seasonal waterlogging. The change in soil moisture is associated with volume change in clay soils. Minor and major roads showed a similar response to soil movement, whilst railways appeared to act independently, particularly when over Peat soils. Podozolic soils remained stable in this stud—for all infrastructure classes investigated—due to the permeable nature of these soils over freely draining bedrock. Further investigations are required to determine the response of Lithomorphic soils, as the results were inconclusive due to the broad taxonomic nature of this group. Major soil groups in this study can contain numerous soil series, with many different soil textures and properties. This can lead to differential ground movement even within a classified major soil group. The use of higher resolution soils data will help better explain observed deformation trends. Re-running the PSI analysis with a higher resolution soil map would allow better characterization of the observed movements to individual soil series. Furthermore, inclusion of a higher resolution DEM (such as Shuttle Radar Topography Mission (SRTM) 1 Arc-Second Global) would also help achieve better correction in the geocoding stage. The inclusion of new Sentinel 1 data to increase the length of time series would also be highly beneficial to reveal long term trends soil-related infrastructure deformation.
Furthermore, a comparison between PSInSAR and other techniques such as the Small BAseline Subset (SBAS) [
30] and Intermittent SBAS (SBAS) [
31] would help to further establish the suitability of these techniques for wide scale monitoring of infrastructure deformation. SBAS and ISBAS generate near continuous coverage of ground deformation measurements, even over vegetated areas. This could help to better identify surface deformation phenomena occurring adjacent to linear infrastructure assets, which have the potential to cause a long-term risk or embankment failure.
In the absence of In-Situ levelling data, a validation site was established within a disused quarry in Dartmoor National Park, England. The results from this exercise returned the expected result of an associated error of ±1.5 mm, which suggests a good performance of the Persistent Scatterers Interferometry technique investigating soil impacts on infrastructure.
This work contributes to an increased understanding of the risks posed by soil movement to infrastructure networks in the UK. It has helped to quantify relationships between infrastructure movement and major soil groups. This is critical for the planning and monitoring of large-scale infrastructure projects such as the UK’s planned High Speed Rail 2, for which an understanding of the soil-related risk is key to the success of the project. This paper has demonstrated the potential of PSI and Sentinel 1 to be used as a tool for remotely monitoring environmental risks to transport infrastructure networks.


