Abstract
In recent years, significant development in the domain of dense image matching (DIM) can be observed. Meanwhile, in most countries, aerial images are acquired countrywide on a regular basis with decreasing time intervals and increasing image overlaps. Therefore, aerial images represent a growing potential for digital surface model (DSM) acquisition and updating. Surface reconstruction by image matching, in most cases, requires dealing with the redundancy caused by multiple overlapping images. Many approaches considering this redundancy in the surface reconstruction process have been developed. However, there is no commonly accepted procedure for this task. From the experience of the author, it can be stated that currently applied methods show some limitations regarding DSM generation from aerial images. Therefore, it is claimed that there is room for the development of new algorithms for integration of dense image matching results from multiple stereo pairs. Methods dedicated to aerial image based DSM generation that would exploit the specificity of this task are desirable. In this paper, an approach to compute the DSM elevations from redundant elevation hypotheses derived by pairwise dense image matching is presented. The proposed approach takes into account the base-to-height (b/h) ratio of stereo pairs, the distribution of elevation hypotheses from multiple stereo pairs and the neighboring elevations. An algorithm of selection of the elevation hypotheses used for the calculation of the final DSM elevation for each grid cell was developed. The algorithm was used to generate the DSM based on two sets of aerial images having significantly different acquisition parameters. The results were compared to the models obtained from several commonly used software packages for image based DSM generation. The quality assessment was carried out by visual inspection of terrain profiles and shaded surface display as well as by the planarity control of flat parts of the terrain. The assessment of the results showed that the application of the proposed algorithm can bring some advantages and it can contribute to improving the quality of the DSM.
1. Introduction
Digital surface model (DSM) is a topographic model representing the bare earth, including all natural and manmade extruding features. It provides a valuable source of information about the environment which can be applied in many areas of human activity such as change detection in rural landscape [1,2], solar radiation modeling [3,4,5], change detection in urban areas [6,7], urban planning [8], GNSS multipath prediction [9], sound propagation modeling [10], wind flow simulation [11], power-line corridors management [12] or visibility analysis [13]. The crucial issue for the application of the DSM is its reliability. The DSM has to be characterized by completeness, adequate accuracy and level of detail. Moreover, essential for most of the applications, it has to be up-to-date.
Currently, the most common technique of data acquisition for DSM generation is airborne laser scanning (ALS or LiDAR). DSM is usually a side product generated from LiDAR data. The main motivation for LiDAR data acquisition is to obtain a detailed digital terrain model (DTM). In this field, LiDAR has a fundamental advantage over image based methods: it enables gathering information about terrain surface in areas covered by vegetation [14]. This makes LiDAR the most efficient technique of data acquisition for DTM generation.
However, in most areas, the ground surface is not changing rapidly over time and therefore the update of the DTM does not constitute a motivation for new LiDAR data acquisition. It should be considered that LiDAR data acquisition is several times more costly than aerial image acquisition. There is no economic justification for acquiring LiDAR data with an interval that would be adequate for updating DSM, which is changing relatively fast due to vegetation growth and human activity.
Meanwhile, aerial image acquisition is carried out on a regular basis mainly for the purpose of orthophoto production. The orthophoto is produced primarily to supply national and local geographic information system (GIS) databases as well as for crop monitoring. In many countries, the orthophoto is updated every few years. In Great Britain, Ordnance Survey is acquiring aerial images for 70,000 km2 yearly. The orthophoto with a ground sampling distance (GSD) of 15–25 cm is updated for the whole country in a five-year cycle [15]. A similar procedure is carried out in Poland where the orthophoto with a GSD of 25–50 cm is updated every three years for the entire country. In Czech Republic, a two-year cycle update of a 25 cm GSD orthophoto for the whole country is carried out [16]. An even lower time interval is applied for the orthophoto update in urban areas. Many cities are supplying their GIS databases with a new orthophoto every year. Observing current trends, it can be expected that the time interval of the update as well as the GSD of orthophotos will decrease in coming years.
Images acquired for orthophoto production can be used for generation of an up-to-date DSM with little additional cost if automatic image matching methods are applied. A drawback of the generation of image based DSM on large areas is the huge computational effort. Despite this, first attempts of countrywide image based DSM generation with the use of dense image matching (DIM) methods are made. A project of DSM generation by dense image matching for the entire area of Switzerland is presented by Ginzler and Hobi [17]. In the case of Switzerland, aerial images for the whole country are acquired in a six-year cycle with a GSD of 25 cm for lowlands and 50 cm for high mountain areas. The generation of a complete DSM took 320 days. Computations were carried out on 16 virtual PCs with the use of the commercial software SocetSet NGATE.
It should also be considered that image based methods potentially allow to obtain a more detailed surface reconstruction than LiDAR. Theoretically a terrain coordinate for each image pixel can be computed. This gives a density of 100 points per m2 for images with 10 cm GSD. Comparing to the density of a few or over a dozen of points per m2 obtainable from LiDAR it appears to be a significant advantage.
Therefore factors motivating the development of aerial image based surface reconstruction methods are widespread availability of up-to-date aerial images acquired on a regular basis, low cost of additional application of aerial images and potential high density of the reconstructed DSM.
Methods of automatic image matching are one of the main issues that have been developed in the field of computer vision for the last decades [18]. In recent years a significant progress in this domain was achieved. A number of new dense image matching algorithms based on global optimization with the use of smoothness constraints were elaborated [19]. The development of this kind of algorithms was made possible by the improvement of computational resources. A milestone in this area was the publication of the semi-global matching (SGM) algorithm by Hirschmuller in 2005 and 2008 [20,21]. This algorithm combines good performance with reasonable computational time. Many new dense image matching algorithms were developed based on semi-global matching. Evaluations of the efficiency of dense image matching algorithms applied to large format aerial images reported encouraging results [14,22,23,24,25].
Dense image matching algorithms were implemented in leading software packages for photogrammetric production such as Image Station (ISAE-Extended), INPHO (Match-t-DSM), and Socet Set (NGATE). A number of new programs such as SURE, PhotoScan, Pix4d, and MicMac dedicated for close range as well as aerial image processing which are including dense image matching as the core functionality appeared. An attempt to systematize the state of the art concerning the efficiency of aerial image based DSM generation with the use of different algorithms and commercial software packages was carried out by EuroSDR [26,27].
Surface reconstruction by image matching in most cases requires dealing with the redundancy caused by overlapping images. Whenever more than two images of the object of interest are acquired the reconstructed surface can be measured from multiple stereo pairs. Methods to proceed with this redundancy have to be applied.
Many approaches of matching multiple images have been developed. Some methods tend to preselect for each part of the reconstructed surface a single stereo pair or a group of stereo pairs for which an optimal accuracy can be expected. The selection is usually based on the geometry of each stereo pair and its orientation relative to the reconstructed surface [28,29,30]. Such an approach is motivated by the need to reduce the computational effort and to eliminate stereo pairs that would degrade the results. This is especially applicable to datasets of close range images where the images are usually acquired in an unordered configuration and the number of overlapping images may be so large that a preselection might be necessary. Other methods solve the issue of redundancy by performing the matching cost computation in object space with the use of a voxel structure [31,32] or a plane sweeping through the space [33,34,35].
Another group of methods perform pairwise image matching to subsequently integrate the results. Some of these methods fuse disparities (parallaxes) between base image and each of the match images to obtain final object coordinates. Usually, consistency constraints are imposed to the fused disparities [21,36,37,38]. Some others of these methods compute object coordinates from each stereo pair. Object coordinates from all stereo pairs are then integrated to obtain the final 3D or 2.5D surface model [36,39]. A different approach, based on fusing oriented depth maps derived by dense image matching to obtain a set of non-redundant 3D points, is presented by Rothermel et al. [40,41].
The presented research is based on the approach of fusing 3D points derived by pairwise image matching into a 2.5D surface model, which is in the opinion of the author suitable for topographic applications as it allows to perform filtering of the elevation hypotheses with taking into account their spatial relations in object space.
Most of the sophisticated multi-view image matching methods have been developed within the computer vision community where mainly close range images are considered. When dealing with aerial images and terrain models a particular configuration of the input dataset occurs. The acquired images usually have an ordered arrangement according to the flight planning rules. The image overlaps are constant and known as well as the distance to the object. The range of disparities is relatively low. Moreover, some general types of objects on the reconstructed surface can be expected according to the land cover of the area of interest (vegetation, building roofs, paved surface, etc.). The form of the reconstructed surface as a 2.5D DSM is suitable for most of applications related to land cover. The grid structure makes any further GIS analyses more straightforward. This specificity of aerial images entails disadvantages (relatively low overlaps and redundancy in comparison to close range images) as well as advantages—some assumptions that can enhance the efficiency of surface reconstruction can be made.
Taking into account the above, it can be suggested that methods dedicated to DSM reconstruction from aerial images exploiting the off-the shelf algorithms of dense image matching should be developed. On the one hand, some simplifications concerning the form of the reconstructed surface can be made (2.5D grid), while, on the other hand, some general rules concerning nadir aerial images can be exploited.
There are no commonly accepted standards of dealing with the redundancy of overlapping aerial images in the course of DSM generation. Methods implemented in software for aerial image processing usually tend to reduce the number of stereo pairs used or to get rid of the redundancy by splitting the area of interest into subareas reconstructed from single stereo pairs [42]. More advanced methods are implemented in SURE [36] which includes scenarios dedicated to nadir aerial images. The number of stereo pairs used for surface reconstruction is reduced by default to these with lower base-to-height (b/h) ratios but the user has the possibility to decide which stereo pairs to use by setting the range of the angle of intersection of image rays. Two methods of fusion of measurements from multiple stereo pairs are available. The first (referred to as 2.5D) fuse the 3D coordinates computed from each stereo pair by median filtering the elevations in a grid structure. The second method (referred to as 3D) performs fusing disparities between a base image and multiple match images by transforming them to depths along the base image ray, selecting consistent disparity estimations by clustering the depth measurements and computing the 3D coordinates by minimizing the reprojection error in the selected group of images. In the final step, the 3D point clouds obtained for each image used as base image are transformed into a raster representation and their elevations are fused by median filtering to derive the final 2.5D DSM [36]. Previous work of the author [43] has shown that both of the above methods have some limitations and there is room for the development of new algorithms leading to a better exploitation of the redundancy caused by overlapping stereo pairs.
In recent years, an increase of the applied overlap of aerial images can be observed. Several factors enhance this tendency. The transition to digital airborne image acquisition and the automation of photogrammetric workflow caused the cost of acquiring additional images along a flight line to be negligible [44]. The development of airborne imaging sensors, which is associated with the increase of the resolution and the field of view of the cameras, made possible the increase of the side-lap while maintaining the same cost of the flight mission. Moreover new high resolution and lightweight aerial cameras are appearing on the market. This in turn enables the use of cheaper aerial acquisition platforms such as ultralight airplanes or gyrocopters, which reduces the cost of the air time. There is also an increasing demand from customers for higher image overlaps. Based on the author’s experience in photogrammetric production it can be observed that tender specifications are imposing increasingly higher overlaps not only by explicitly defining the flight planning parameters but also, for instance, by limiting the acceptable size of occluded areas in the resulting orthophoto. All this allows expecting that the number of acquired aerial images will increase with the reduction of the cost of image acquisition. A higher number of images means higher overlaps and, consequently, a higher redundancy in the course of image based surface reconstruction. This should motivate the development of methods that would enable not only to eliminate the problem by selecting the optimal stereo pair for each part of the terrain but also to exploit this redundancy for a better quality of the reconstructed DSM.
One of the basic rules of photogrammetry is that the accuracy of stereoscopic restitution depends on the base-to-height ratio of the stereo pair. Experiments carried out by the author [25] confirmed to some extent the veracity of this assumption in the case of dense matching of aerial images. Different stereo pairs are characterized by different performance in surface reconstruction. A large base-to-height ratio is beneficial for high accuracy measurements. However such stereo pairs show good results mainly on flat horizontal surface but tend to fail on more complex structures or vegetated areas. Low base-to-height ratio values favors more complete surface reconstruction and a better quality in vegetated areas and in case of fine structures but the accuracy of the measurements is lower and the resulting surface is more noisy.
Further experiments [43] confirmed that the selection of stereo pairs and type of terrain surface are two correlated factors which have a very significant influence on the quality of the DSM. The observed relations have led to a conclusion that the application of a single method of fusing elevations hypotheses from multiple stereo pairs for each case (e.g., median, mean, or any other statistical value) is limited and cannot allow to fully exploit the redundancy provided by overlapping images.
A method that would enable to benefit from the accuracy of high b/h ratios and the quality of surface reconstruction for vegetated areas and complex structures of low b/h ratios seems to be an optimal solution. The idea of this research was to develop an algorithm that would adapt the method of fusing elevation hypotheses from multiple stereo pairs to obtain optimal results in each case. In this paper, an approach to compute the DSM elevations from redundant elevation hypotheses with taking into account the base-to-height ratio of stereo pairs, the distribution of elevation hypotheses from multiple stereo pairs and the neighboring elevations is presented.
2. Materials and Methods
In the next section, study area and datasets are described. Subsequent sections (Section 2.2, Section 2.3, Section 2.4 and Section 2.5) introduce methods that are proposed to deal with the redundancy of elevation hypotheses from multiple stereo pairs. The final algorithm of integrating the results of dense image matching of multiple stereo pairs to obtain the DSM is presented in Section 2.6. Methods of evaluation of the results as well as reference data used are described in Section 2.7.
2.1. Study Area and Datasets
The presented research was carried out with the use of two datasets. The data consist of aerial images coming from real projects. The images were not acquired for research purposes; therefore, the parameters of their acquisition were not suited for the presented work. One of the dataset (Enzersdorf) is part of a countrywide project of orthophoto production in Austria. The second dataset (Elbląg) is part of a typical project of orthophoto production for a mid-size city carried out in Poland. In both projects, Intergraph DMCII230 camera was used. The images were acquired with a GSD of 20 cm (Enzersdorf) and 5 cm (Elbląg). In both cases the forward overlap is 80% and the side-lap is 40%.
When images are acquired with 80/40 overlaps 80% of the terrain is located in the overlaps between strips. Objects in the side-lap areas are visible on 10 images. According to the binomial coefficient presented in Equation (1), where n is the number of overlapping images (10) and k is the number of images forming a stereo pair (2), it can be derived that 45 stereo combinations can be established for each part of the terrain in the side-lap area.
It should be mentioned that a side overlap of 60% would be more suited for the planned applications. In such configuration, the whole area would be covered by at least 10 images and thus a redundancy of at least 45 stereo combinations for each part of the terrain would be assured. However increasing the side overlap increases significantly the cost of the flight mission. As long as the main purpose of aerial image acquisition is the orthophoto production the application of 60% overlaps is not economically justified. Nevertheless, it can be observed that an increasing number of projects requiring a side overlap of 60% (e.g., for cadastral survey) are appearing. Hopefully, as new applications of aerial images appear and the cost of image acquisition and processing is reduced, a side overlap of 60% will become standard. In this study, in order to simulate the desired conditions, the experimental work was carried out in test fields located in the side-lap areas to enable to fully exploit the redundancy provided by the image blocks.
In the previous work of the author [45], an analysis of the influence of the form of input images on dense image matching results was carried out. According to the recommendations formulated in the cited research it is beneficial for image matching results to use the raw panchromatic image with the original bit depth without any compression. This is an important point in the context of a potential application of images acquired as part of orthophoto production projects for DSM generation because usually only RGB pan-sharpened, 8 bit, JPEG compressed images are outputted. For the presented research raw, uncompressed, 16 bit images from the panchromatic channel of the Intergraph DMCII230 camera were used.
The initial point clouds are obtained by pairwise dense image matching with the use of SURE software. Point clouds resulting from each stereo pair are transformed to grid structure by selecting the highest point falling in each cell. The cell size is set to be equal to the GSD of the images. Further procedure is carried out in grid data structure.
2.2. Using the Standard Deviation of Elevation Hypotheses Distribution as a Consistency Measure
An elevation hypothesis is the elevation of a point measured from a single stereo pair falling in a given grid cell. In theory, elevation hypotheses from multiple stereo pairs should be consistent. However, in practice, significant discrepancies may occur. The consistency of elevation hypotheses from different stereo pairs is related to the type of local terrain cover. It was observed that, for terrain types such as bare ground, grass covered areas or paved surfaces, the measurements from multiple stereo pairs are rather consistent. Previous work of the author [43] have shown that for such kind of surfaces taking into account elevation hypotheses from all available stereo pairs for the calculation of the final elevation is beneficial for the DSM accuracy. On the other hand, for areas covered with high vegetation and complex structures, the dispersion of elevation hypotheses from different stereo pairs is significantly larger. For these types of surfaces, stereo pairs of the lowest b/h ratio show better performance in the correct surface reconstruction and thus elevation hypotheses from these stereo pairs should be favored in the calculation of the DSM elevation. As a measure of consistency of elevation hypotheses from different stereo pairs standard deviation of their distribution is proposed. The standard deviation is calculated for each grid cell based on all elevation hypotheses falling in that cell.
In the issues related to image matching, the value of 1 pixel is commonly used as a threshold for various procedures. This threshold value is involved in such processes as left-right consistency check [21,36,46] consistency check within neighboring disparities [47] eliminating outliers from multi-stereo matching [21,36] or accuracy analyses when comparing to ground truth [18,48,49]. It can be assumed that discrepancies within the range of 1 pixel are random errors associated with the image resolution whereas larger values may indicate mismatched pixels.
In the presented research the value of 1 pixel is proposed as well. The threshold for the measure of consistency of elevation hypotheses is calculated as the elevation error caused by a disparity error of 1 pixel for the stereo pair having the lowest b/h ratio in the image block.
In the normal case of stereo photogrammetry, the distance to the measured surface and its error caused by the error of the disparity are calculated as follows:
where B is the base of the stereo pair, f is the principal distance of the camera and d is the disparity.
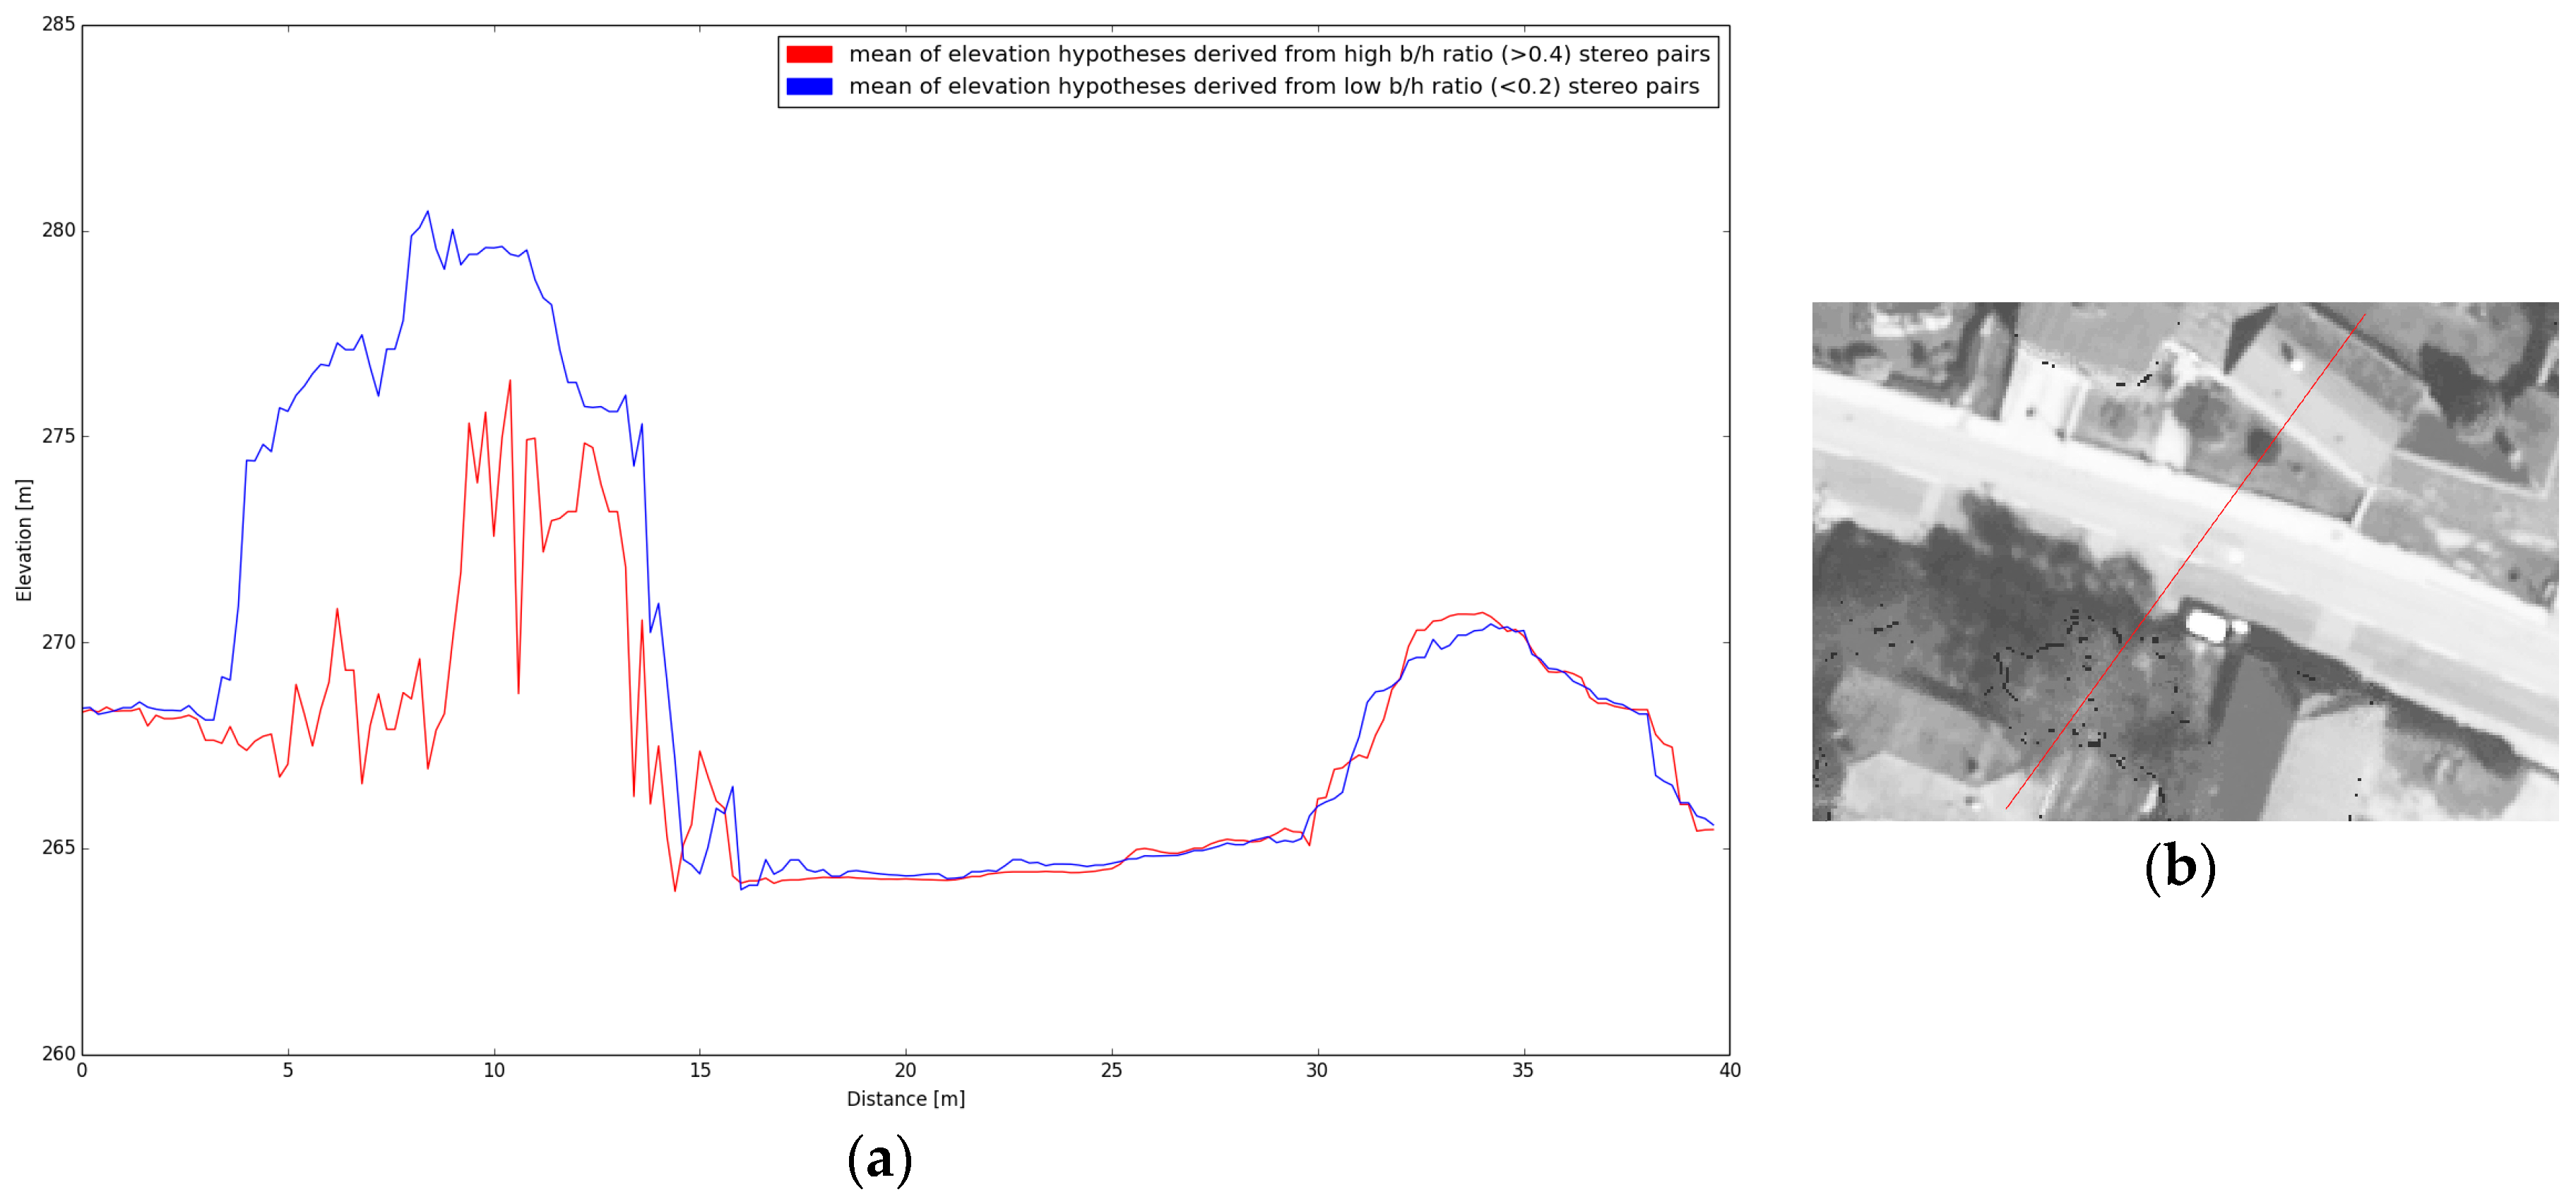
The neighboring images in the analyzed datasets form a stereo pair with a b/h ratio of 0.17. For this value of b/h ratio σZ calculated according to Equation (3) is equal to 29 cm (for a GSD of 5 cm) and 1.16 m (for a GSD of 20 cm). Figure 1 presents the distribution of elevation hypotheses and its standard deviation along a terrain profile.
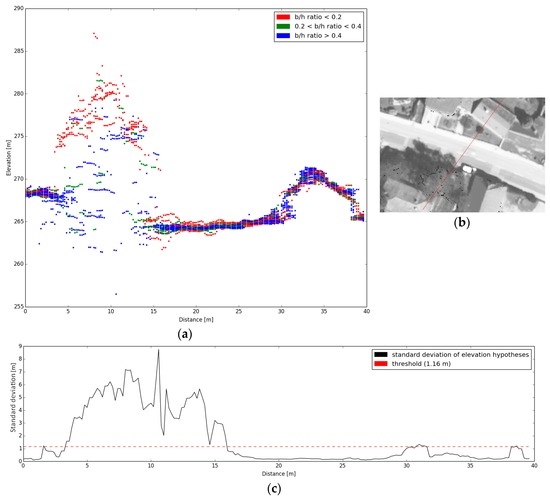
Figure 1.
(a) Elevation hypotheses along a terrain profile derived from all available stereo pairs. The b/h ratios of the stereo pairs are differentiated by color. (b) The terrain profile (red line) shown on the true orthophoto. (c) The standard deviation of the distribution of elevation hypotheses along the terrain profile (black line) and the threshold calculated according to Equation (3) for a ground sampling distance (GSD) of 20 cm (red dotted line).
In Figure 1a, it can be seen that the quality of elevation measurement is highly dependent on the b/h ratio and the type of terrain cover. On flat areas of bare terrain, elevation hypotheses from high b/h ratio stereo pairs are more consistent. On the other hand, in vegetated areas, most of the elevation hypotheses from high b/h ratio stereo pairs are outliers.
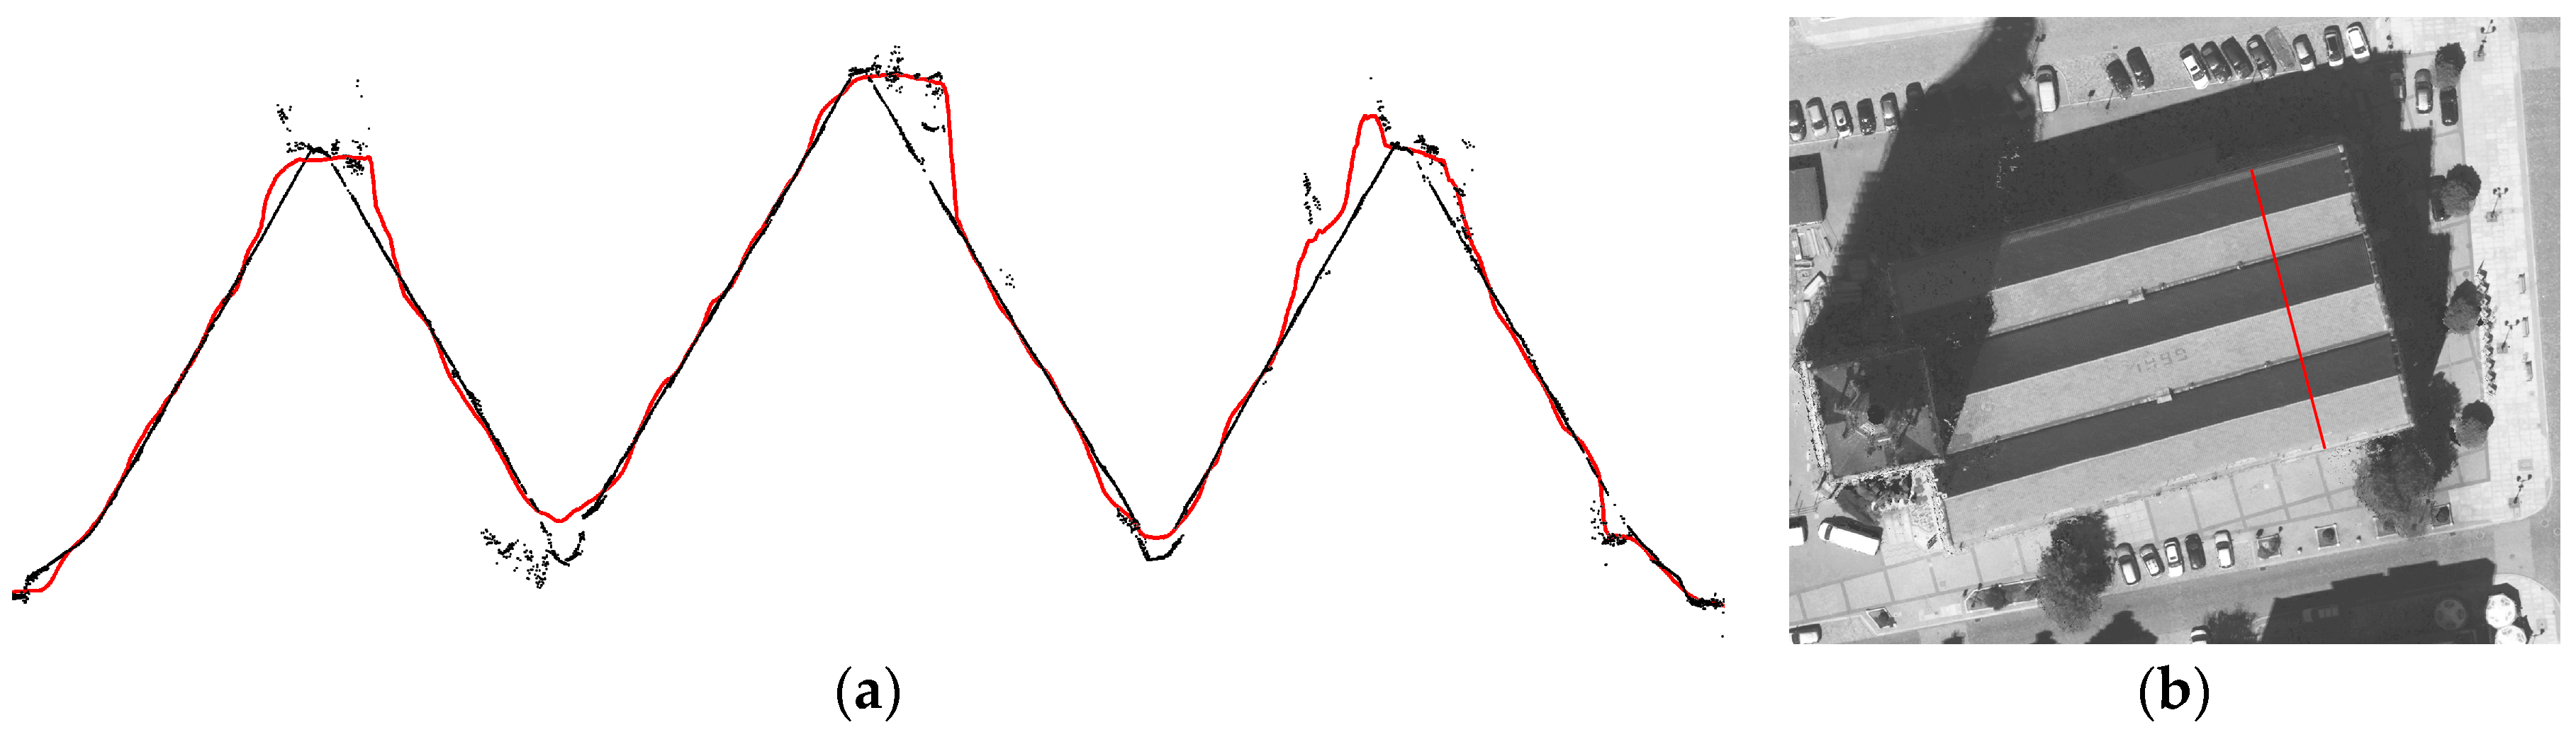
One can imagine what effect would be obtained by calculating the final elevation of the DSM by a simple mean or median of all available elevation hypotheses in a given grid cell. Still, such kinds of methods are often implemented in software for dense image matching and DSM generation (Figure 2).
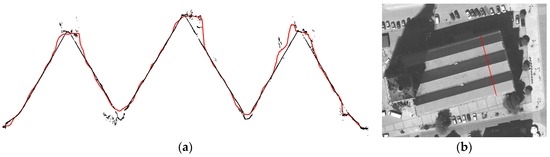
Figure 2.
(a) Profile of a point cloud (black dots) derived from multi-view dense image matching carried out with the use of Pix4d software. The red line represents the digital surface model (DSM) generated from the point cloud with the use of Pix4d software. (b) The terrain profile (red line) shown on the true orthophoto.
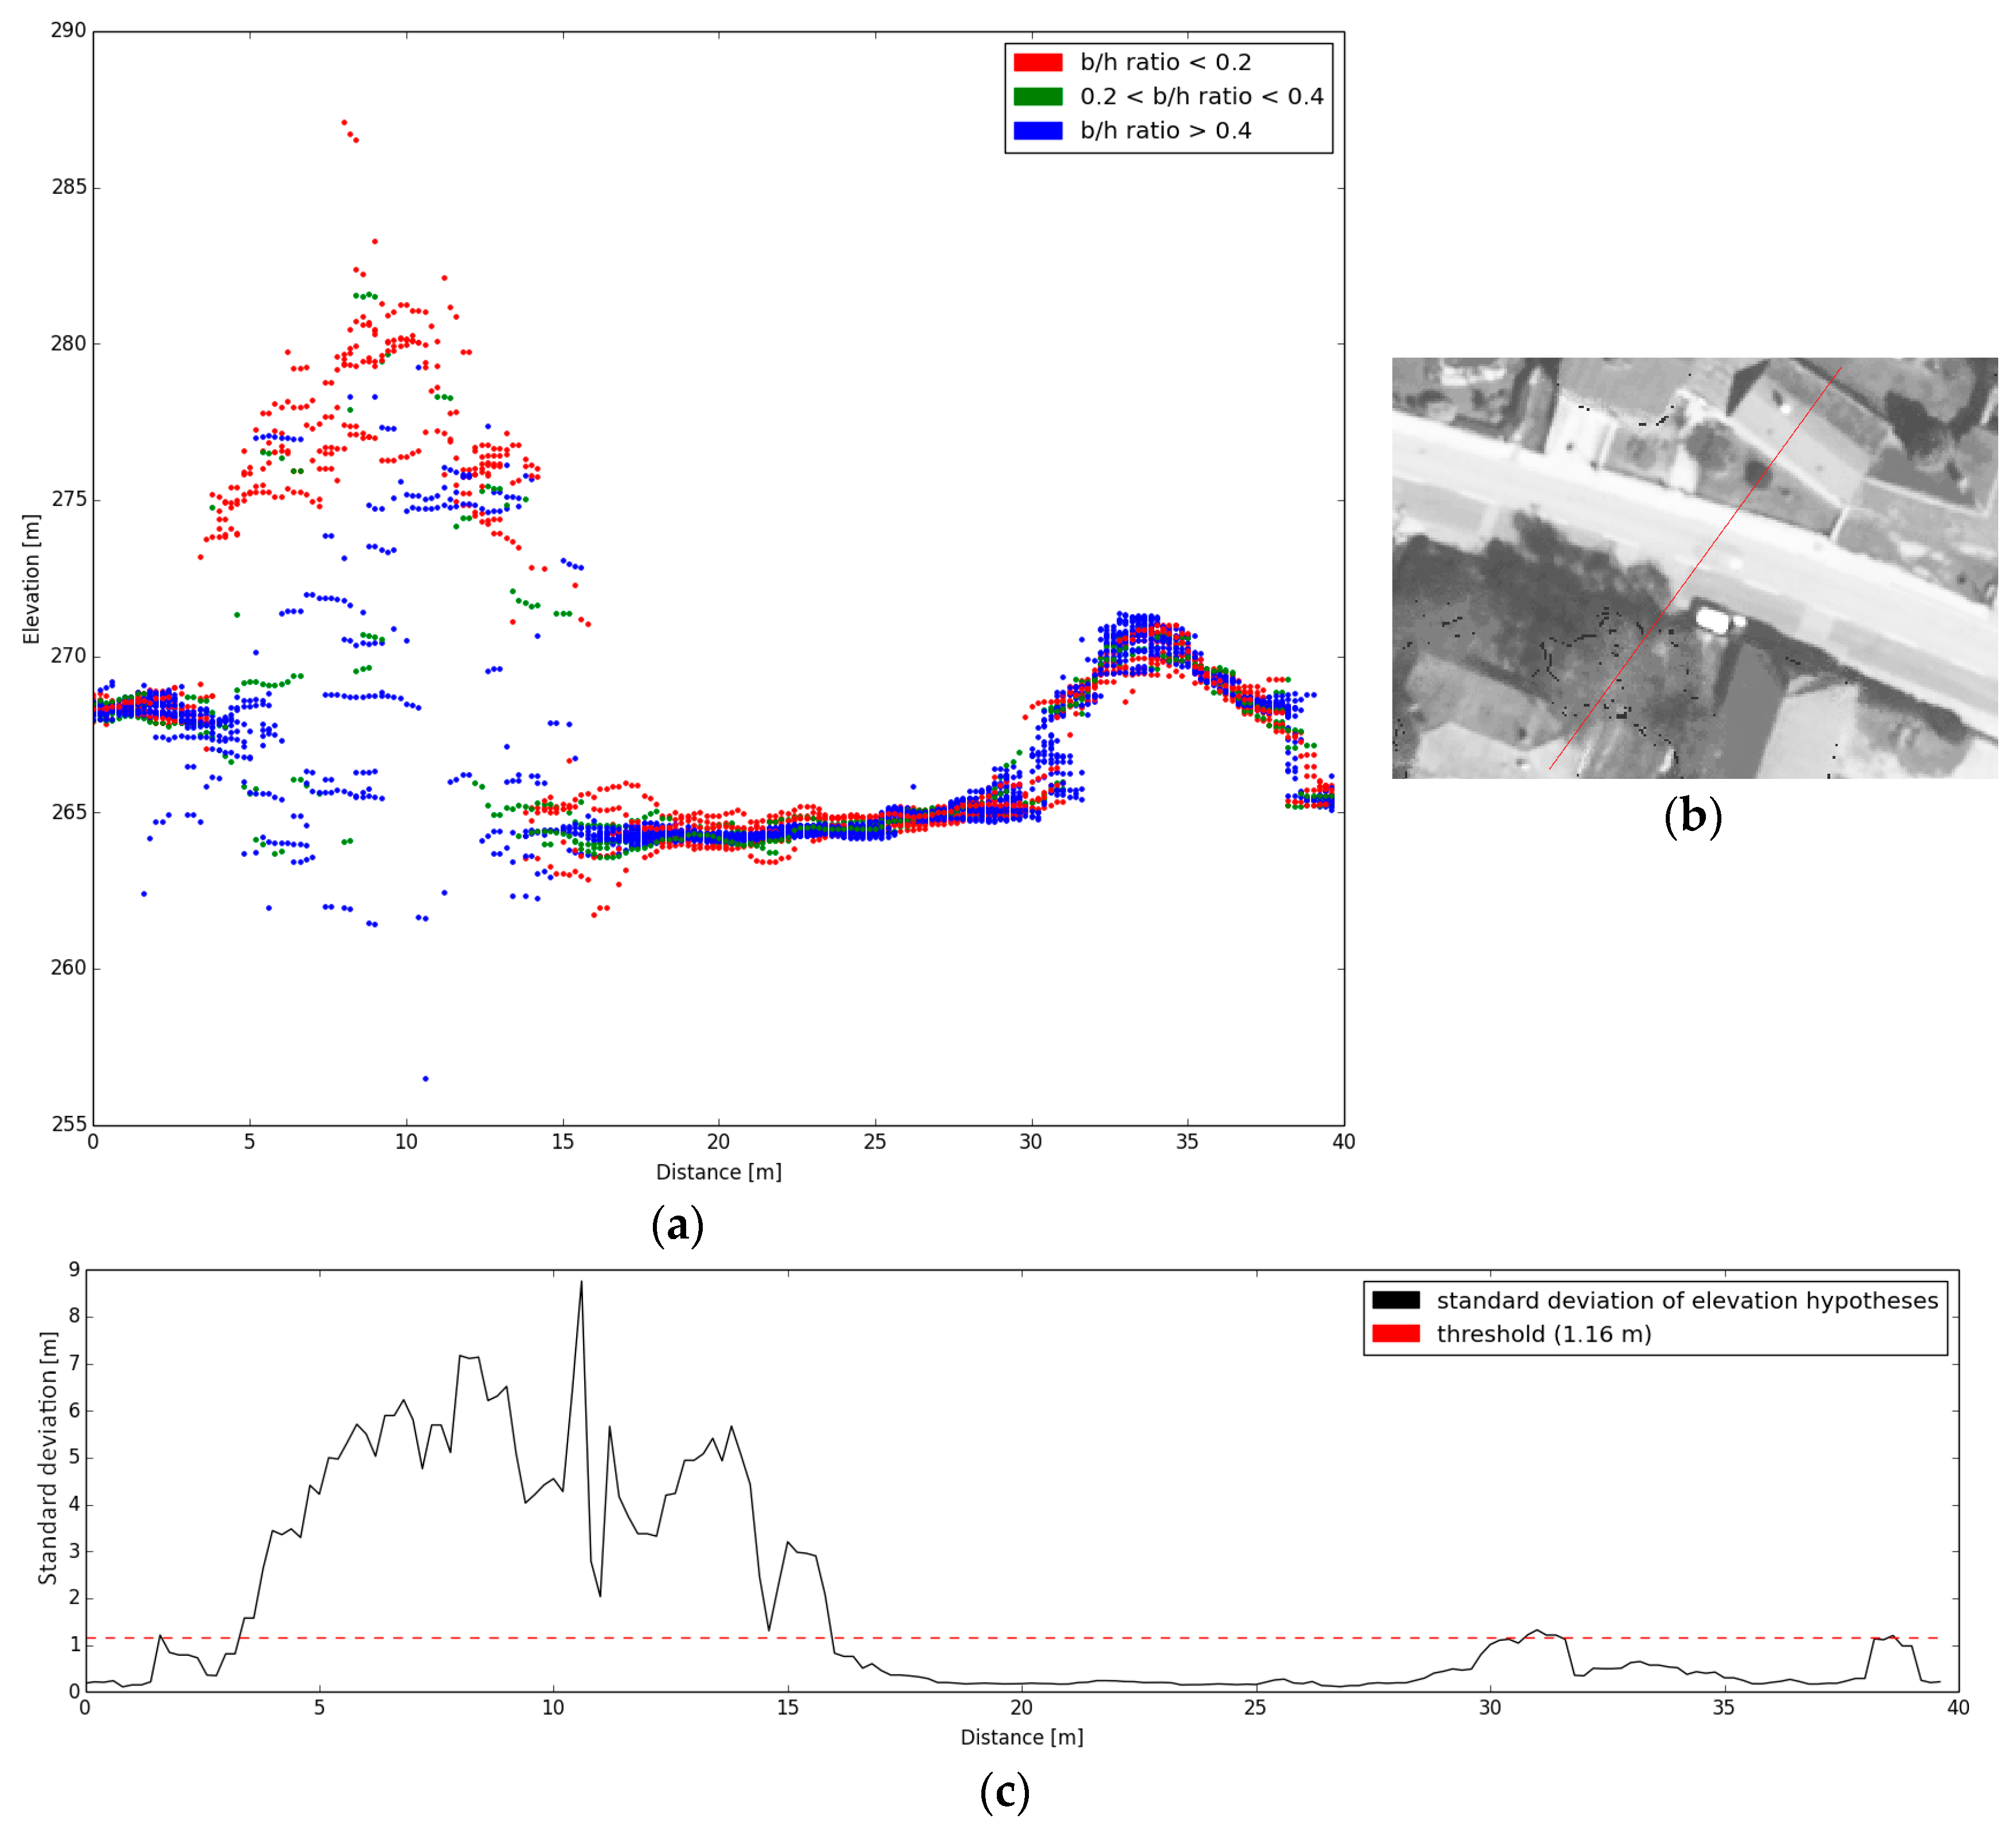
In order to emphasize how important is the selection of elevation hypotheses, and how it influences the final DSM, two scenarios were applied. In the first scenario, only elevation hypotheses derived from the lowest b/h ratio (<0.2) stereo pairs were selected, whereas, in the second scenario, elevation hypotheses derived from the highest b/h ratio (>0.4) stereo pairs were selected. In both cases, the DSM elevation was calculated as the mean of the selected group of elevation hypotheses (Figure 3).
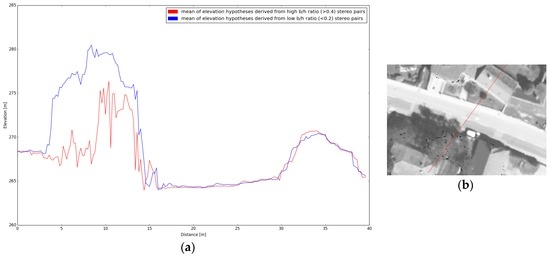
Figure 3.
(a) DSMs generated based on two groups of elevation hypotheses. It can be seen that low b/h ratio stereo pairs show better performance in vegetation reconstruction, whereas high b/h ratio stereo pairs give a smoother surface in paved areas. (b) The terrain profile (red line) shown on the true orthophoto.
Figure 3 clearly demonstrates that differentiating methods of computing the final elevation is necessary for obtaining a reliable DSM on all kind of terrain cover. The proposed criterion of standard deviation allow to distinguish types of terrain cover basing on the distribution of elevation hypotheses which can lead to apply appropriate algorithm of obtaining the final elevation for a given case.
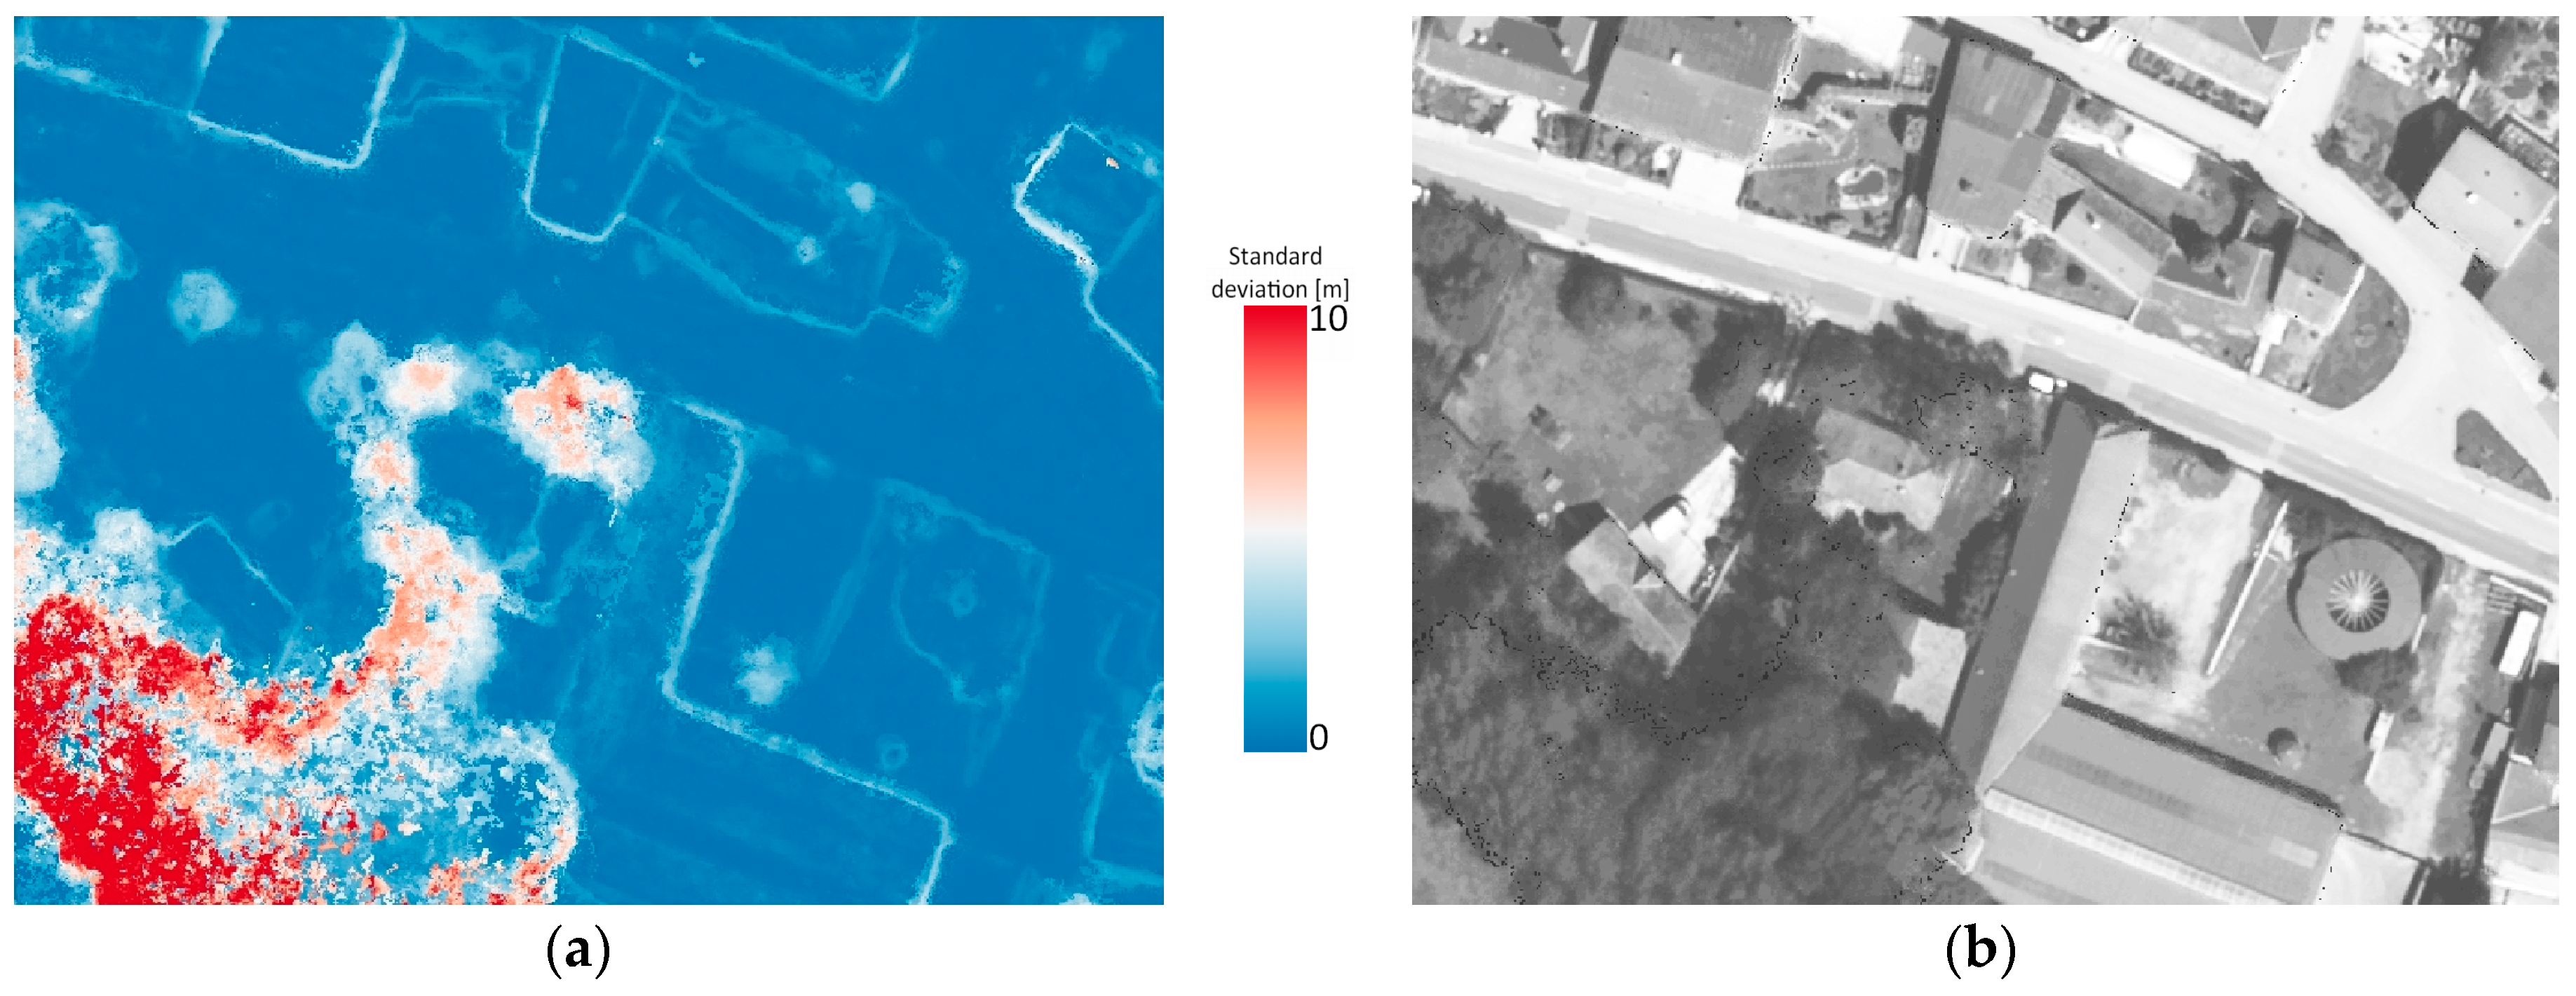
An additional advantage of the proposed computation of the standard deviation is its potential application for the assessment of the uncertainty of the DSM. This can constitute an additional input data for enhancing spatial analyses involving the DSM. A map showing the standard deviations of the distribution of elevation hypotheses is presented in Figure 4. It can be seen that higher values of the standard deviation occur mainly in vegetated areas and near building edges. The higher dispersion of elevation hypotheses can suggest a lower reliability of the DSM.

Figure 4.
(a) Map of the standard deviations of the distribution of elevation hypotheses; and (b) true orthophoto of the same area.
2.3. Using Stereo Pairs from Neighboring Images for a First Approximation of the Reconstructed Surface
According to the author’s observations, elevation hypotheses from the stereo pairs with lower b/h ratios generally better represent the overall terrain surface and, importantly, they contain significantly fewer outliers. This is because neighboring images are more similar to each other and thus finding correspondences is more efficient. Another reason is that such stereo pairs contain fewer occlusions.
Taking the above into account, it is proposed to treat elevation hypotheses from stereo pairs with the lowest b/h ratio (neighboring images along a flight line) as a first approximation of the reconstructed surface. This approximation is then used for the selection of elevation hypotheses which should be taken into account for the calculation of the final elevation of the DSM.
The first approximation is calculated as the median of elevation hypotheses from stereo pairs with the lowest b/h ratio. The value of σZ for a disparity error of 1 pixel (Equation (3)) is proposed as the threshold for the selection of elevation hypotheses. All elevation hypotheses that are above or below the first approximation within the range defined by the threshold are used for the calculation of the final elevation.
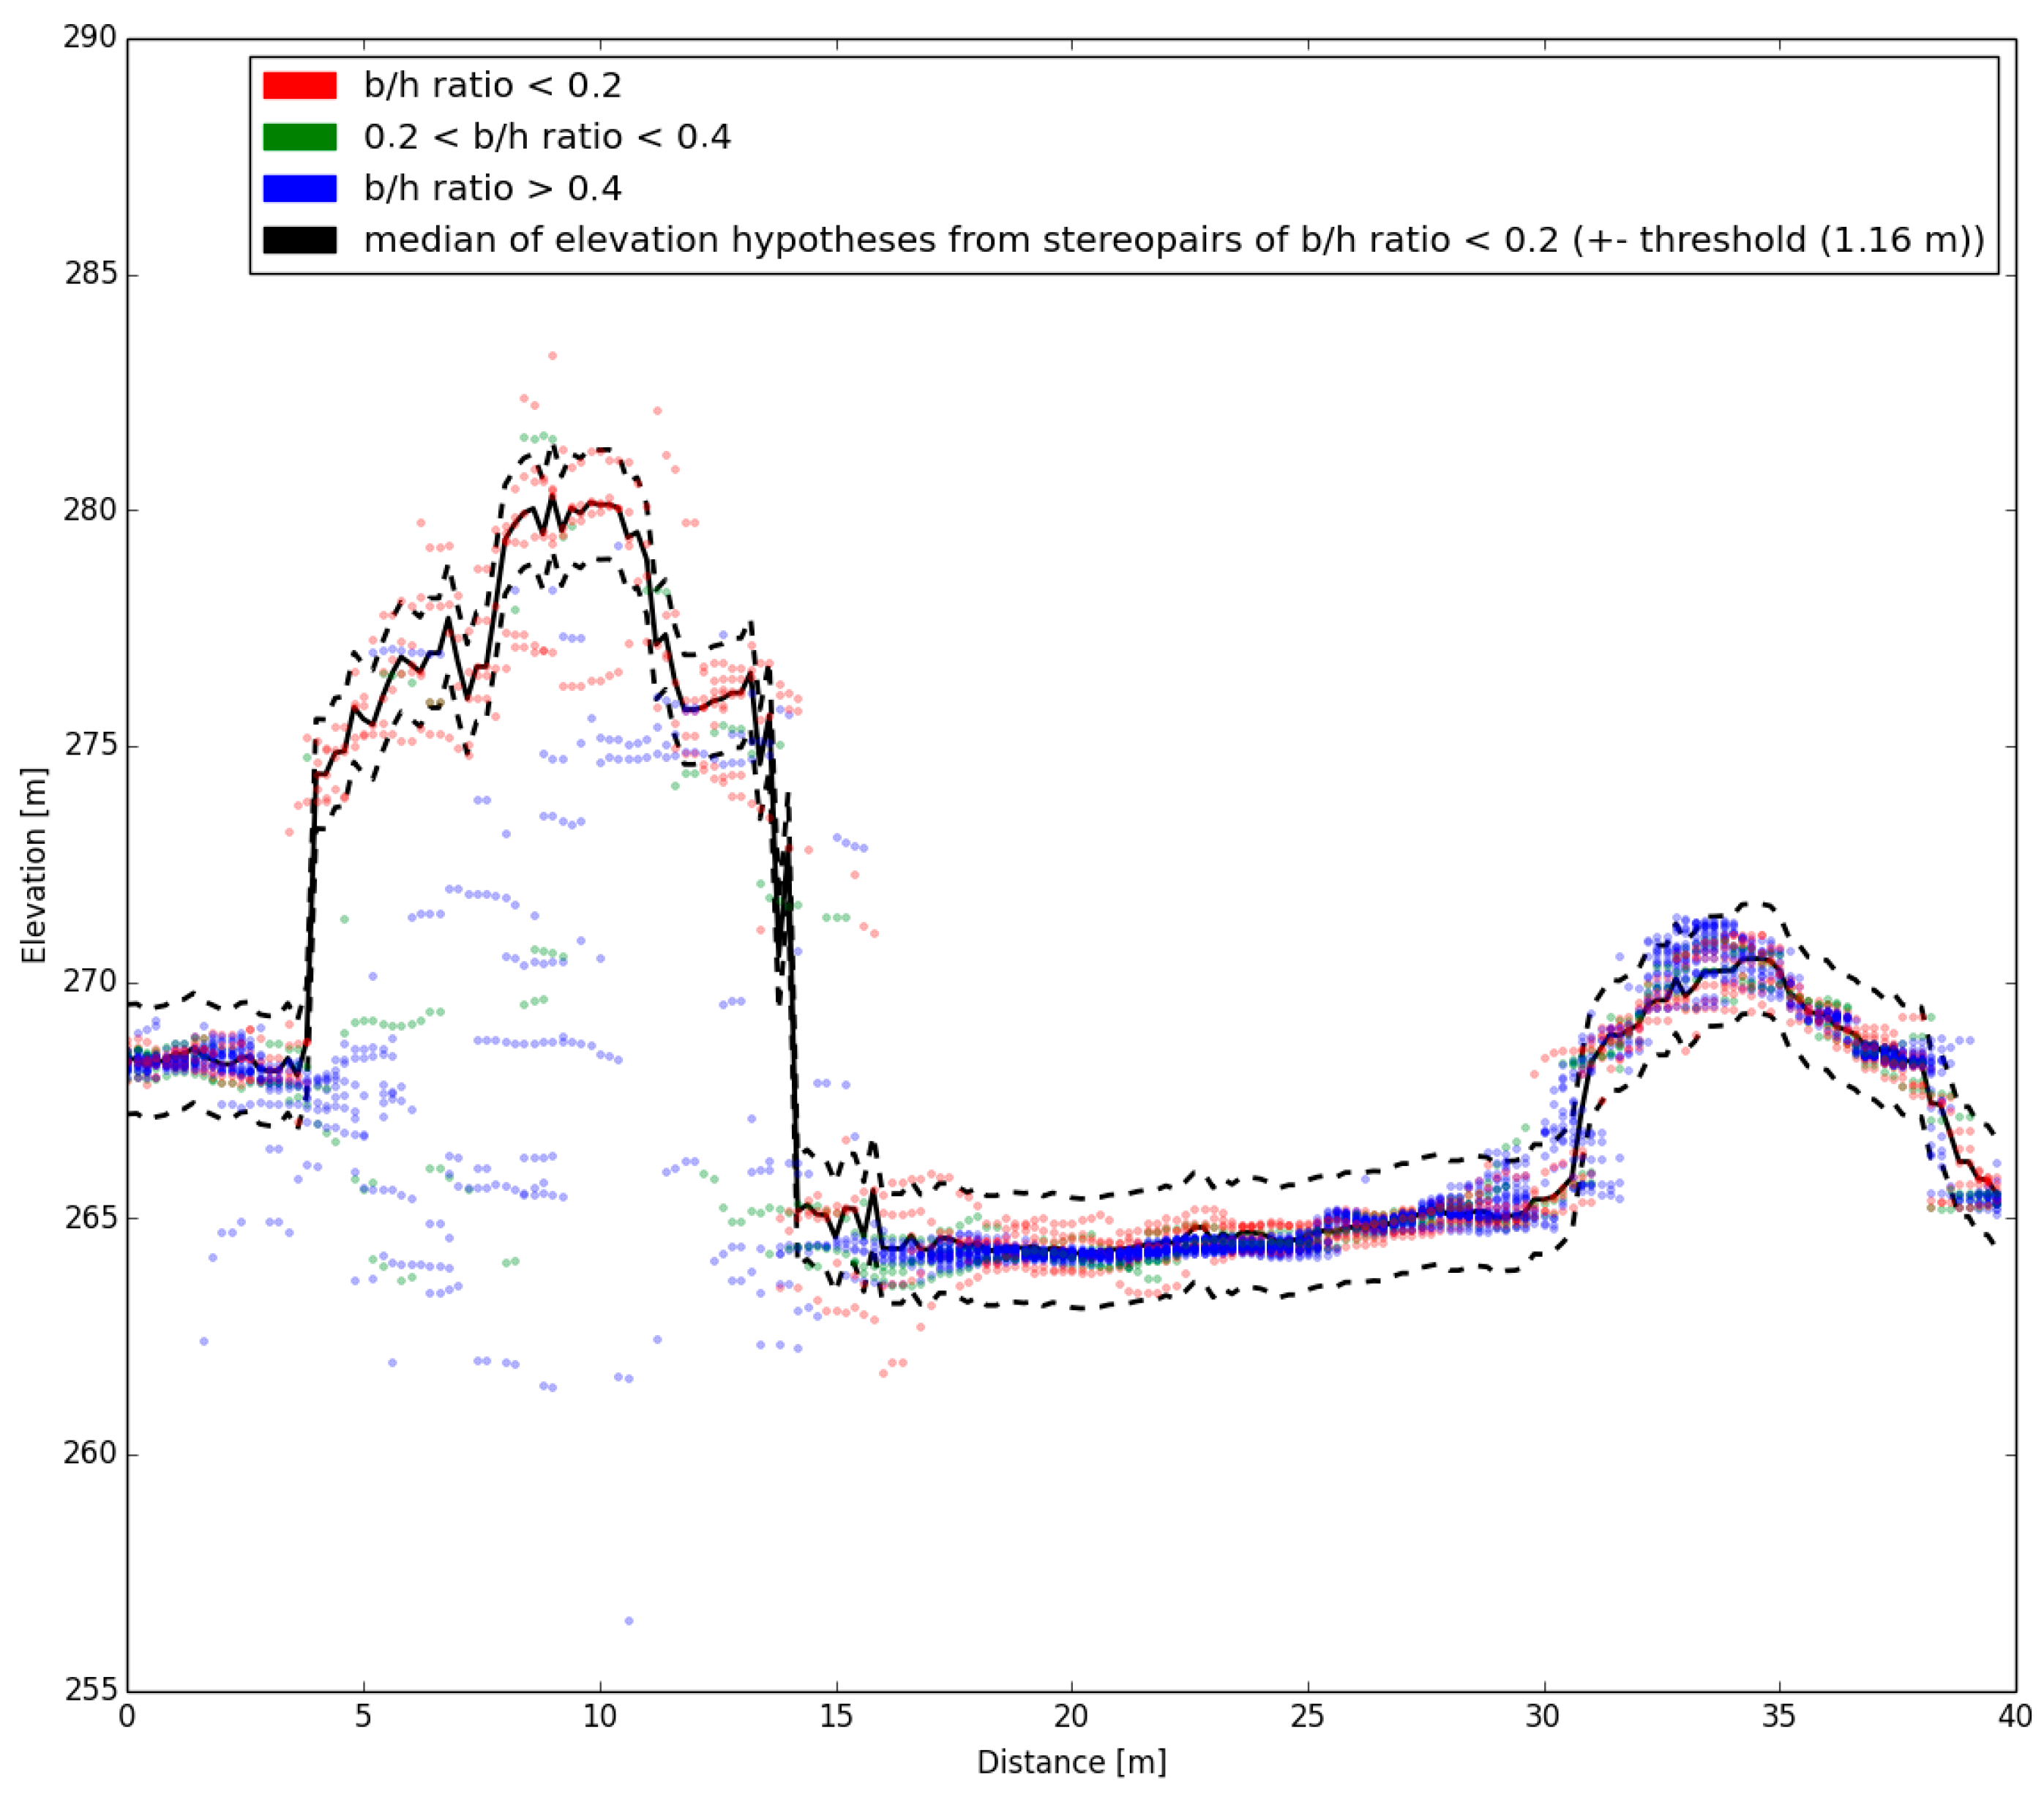
As can be seen in Figure 5, the first approximation based on stereo pairs with the lowest b/h ratio follow the expected surface on bare terrain as well as building roofs and the treetop. The defined range allows including elevation hypotheses from stereo pairs with larger b/h ratios in areas where they can improve the accuracy of the final elevation and at the same time to eliminate them in areas where they represent outliers.
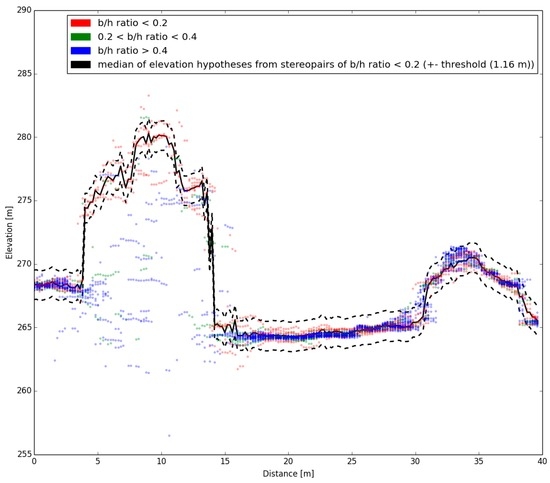
Figure 5.
Elevation hypotheses along a terrain profile derived from all available stereo pairs. The b/h ratios of the stereo pairs are differentiated by color. The black line represents the median of the elevation hypotheses from stereo pairs with the lowest b/h ratio (only neighboring images along a flight line). The dotted black lines represents the threshold calculated according to Equation (3) for a GSD of 20 cm, which is used to select the elevation hypotheses from all stereo pairs lying close to the median.
2.4. Clustering Elevation Hypotheses
In the case of complex structures usually elevation hypotheses from most stereo pairs are outliers. Therefore the methods described above would fail. A method that would allow eliminating outliers and keeping the elevation hypotheses that are close to the actual surface even if they represent the minority of the observations has to be applied. If the aim of image based surface reconstruction is to obtain the DSM in a 2.5D form some assumptions can be made. The DSM should represent the top surface of all objects, therefore favoring higher elevation hypotheses is justified. An algorithm of assigning elevation hypotheses to clusters is proposed.
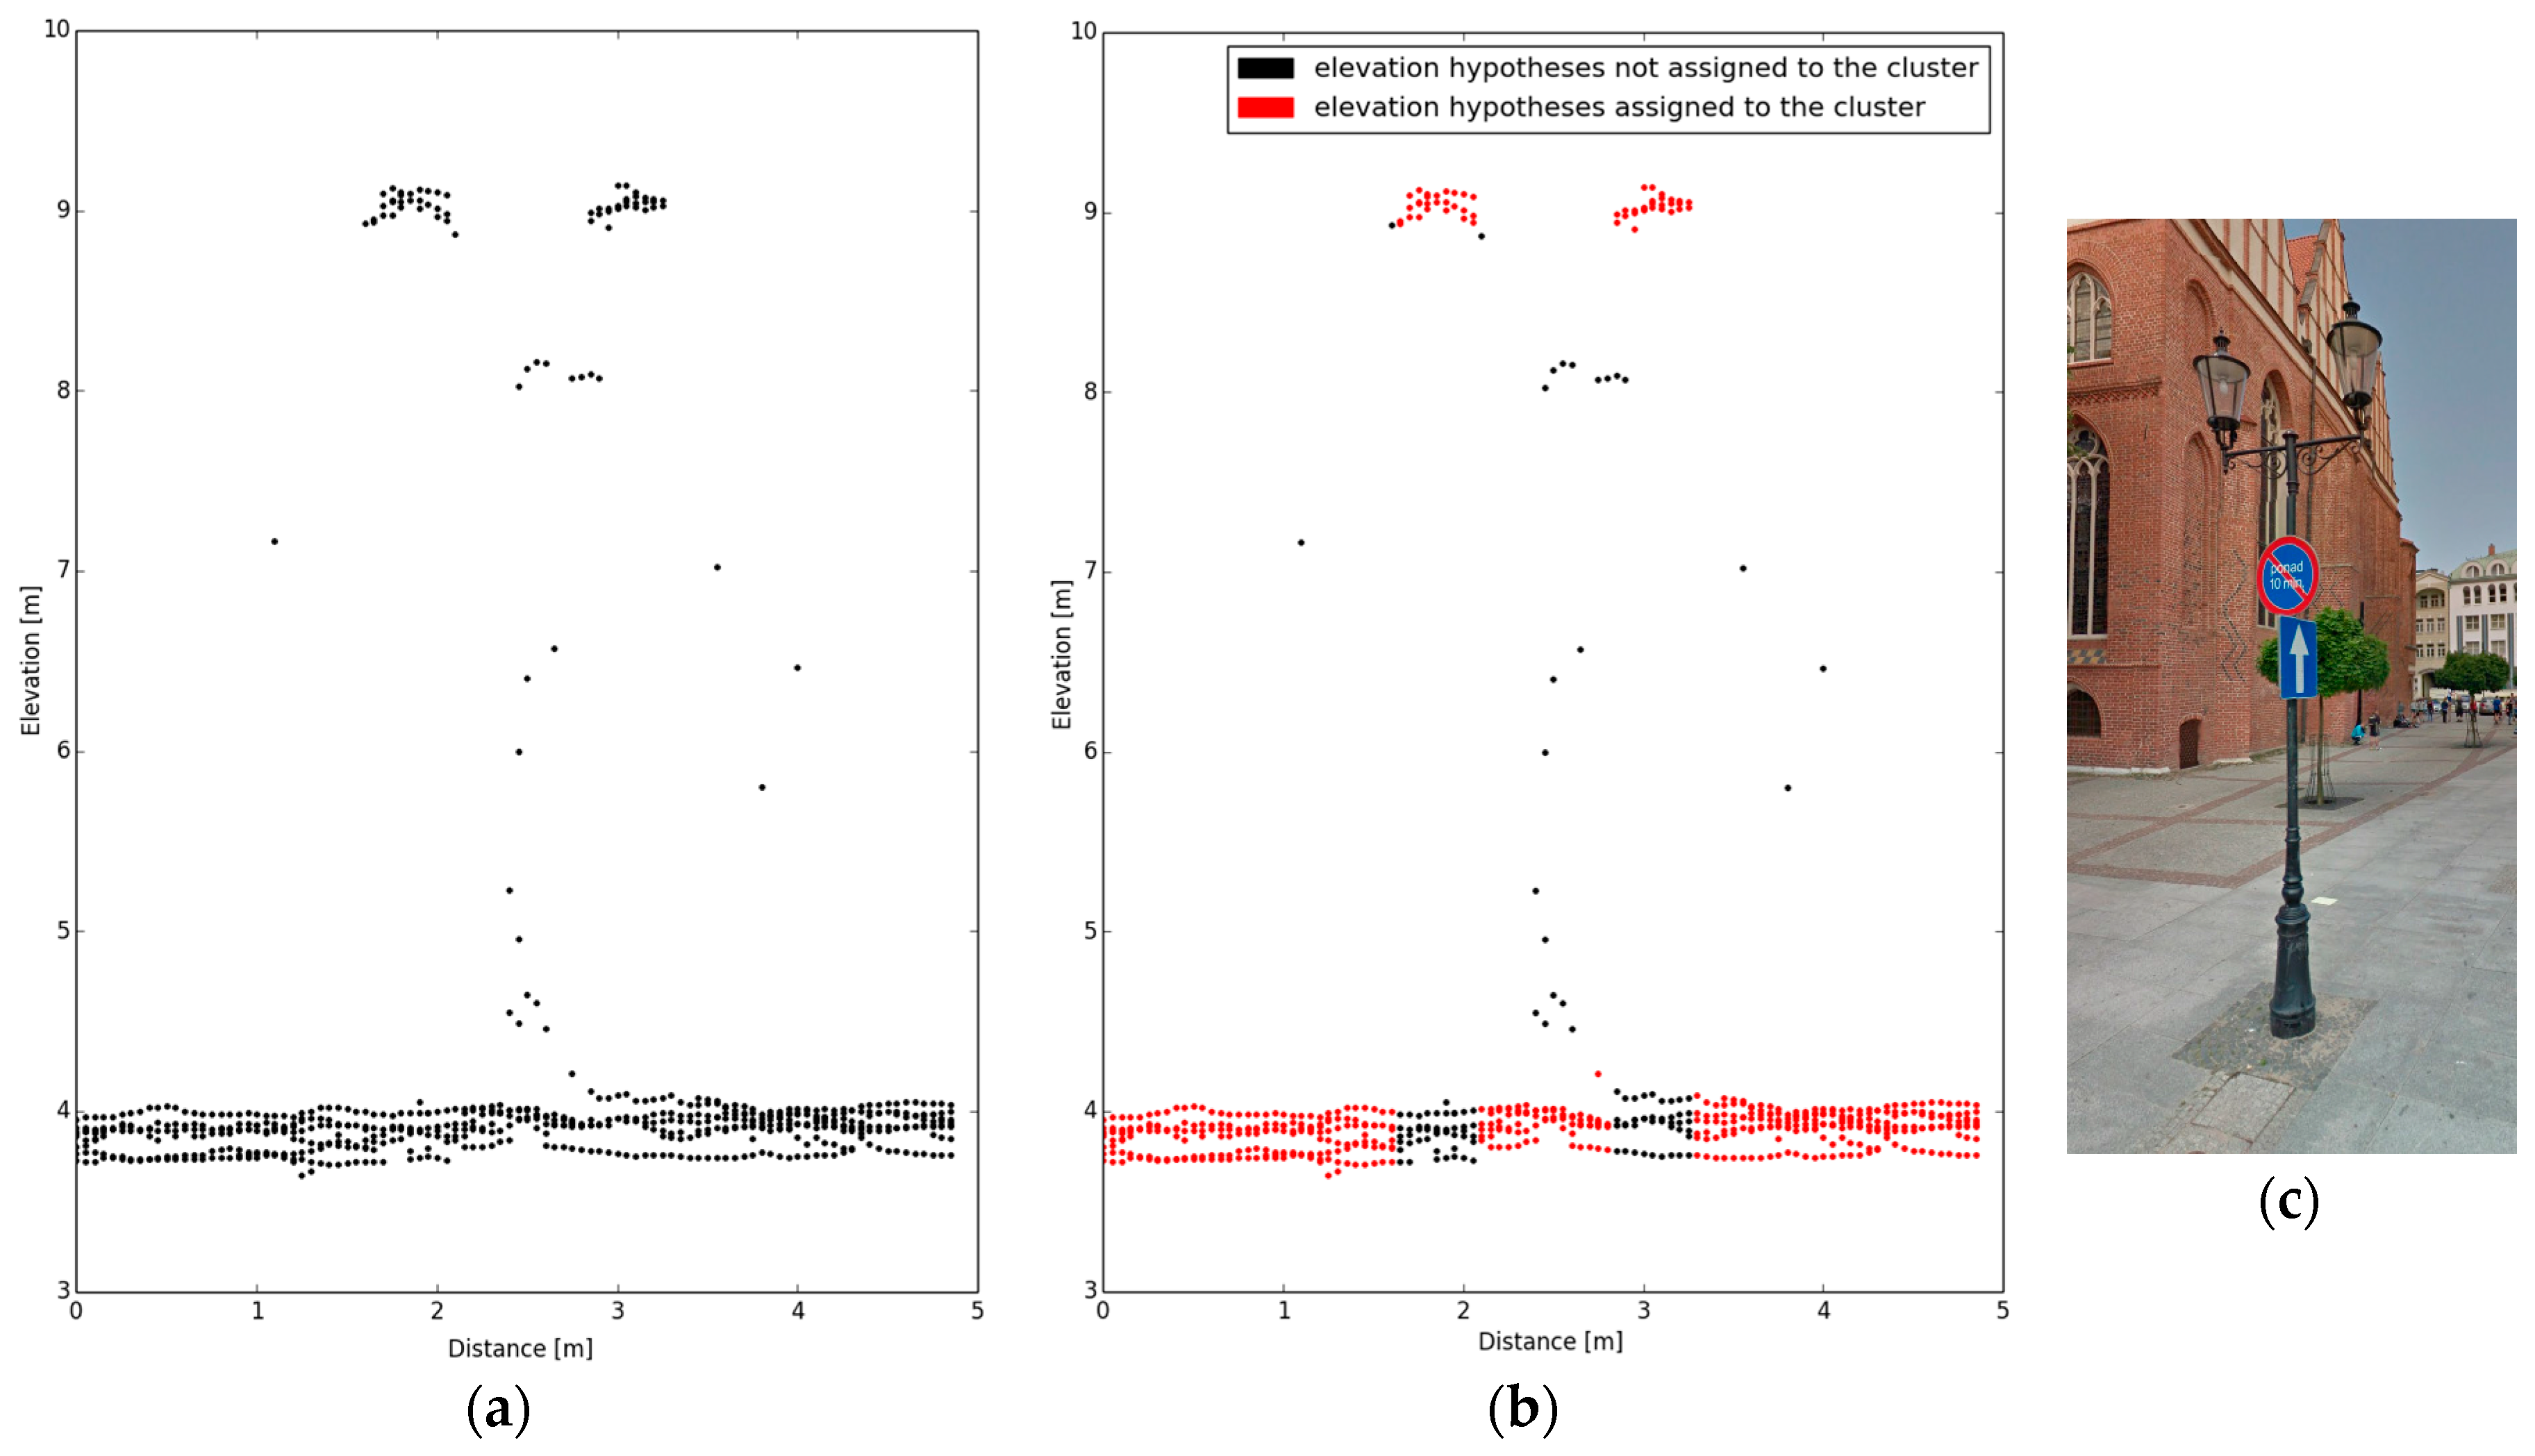
In each grid cell the elevation differences between consecutive points are checked starting from the highest point. When the algorithm meets two points with the elevation difference lower than the defined threshold it assigns them to a common cluster. Each consecutive point is added to the cluster if the elevation difference between this point and the last point added to the cluster is below the threshold. If after creating a cluster two consecutive points with an elevation difference above the threshold are found the algorithm terminates. Therefore at least two elevation hypotheses in a common grid cell with an elevation difference below the threshold are needed to create a cluster. Otherwise no cluster is created in such grid cell. Again, in this case, the value of σZ for a disparity error of 1 pixel (Equation (3)) is proposed as the threshold for the elevation difference. Sample results of the proposed clustering algorithm are presented in Figure 6.
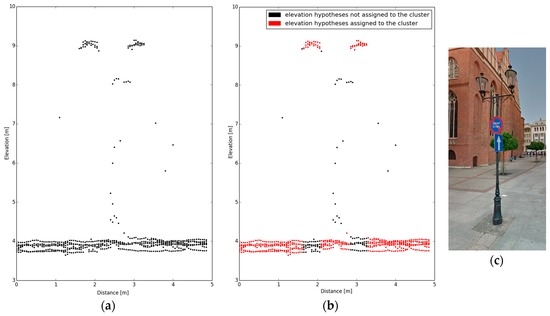
Figure 6.
(a) Elevation hypotheses derived from stereo pairs with the lowest b/h ratio (only neighboring images along a flight line). (b) Elevation hypotheses assigned to the cluster (red dots) according to the procedure described in Section 2.4. (c) Screenshot from Google Street View showing the analyzed object.
2.5. Region Growing Algorithm for Filling Grid Cells not Meeting Redundancy Criteria
If, in a given grid cell, all measurements from multiple stereo pairs are dispersed and no systematicity in their distribution can be found, it is difficult to figure out what is the elevation of the DSM basing only on the redundancy of elevation hypotheses in this cell. It should be considered that one of the elevation hypotheses may be close to the actual surface however all elevation hypotheses may be outliers as well. Highest elevation hypotheses could be favored similarly to the clustering method (Section 2.4), but this would result in the inclusion of many outliers to the final DSM. Therefore it is proposed to make use of elevations from neighboring cells to obtain an indication about which of the elevation hypotheses in an analyzed cell, if any, is likely to be correct. In each grid cell where the computation of the DSM elevation with the use of the above described methods (Section 2.2, Section 2.3 and Section 2.4) was not possible the neighborhood is analyzed. If at least one of the eight connected neighboring cells has an elevation computed with the use of the redundancy based methods it is used as an indication for finding the DSM elevation in the analyzed cell. The median of the neighboring elevations is computed. The elevation hypothesis that is closest to the median elevation from neighboring cells is taken as the DSM elevation if the elevation difference is lower than the adopted threshold. This elevation is included to the input for the next iteration where the procedure is repeated for remaining cells without DSM elevation. The algorithm shows region growing behavior. Performing many iterations leads to determine the DSM elevations for several cells laying on sloped surface if the elevation differences between consecutive cells are below the threshold (Figure 7). The value of σZ for a disparity error of 1 pixel (Equation (3)) is proposed as the threshold for the elevation difference.
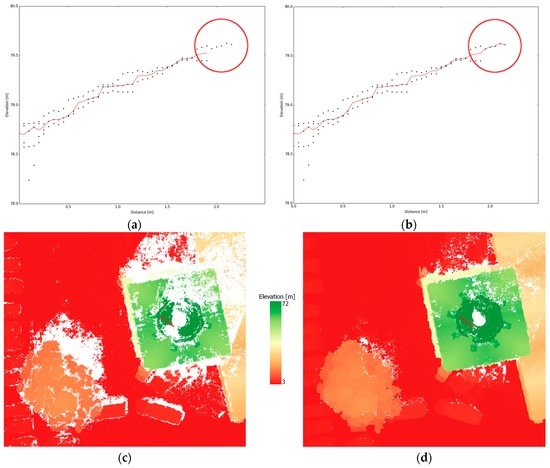
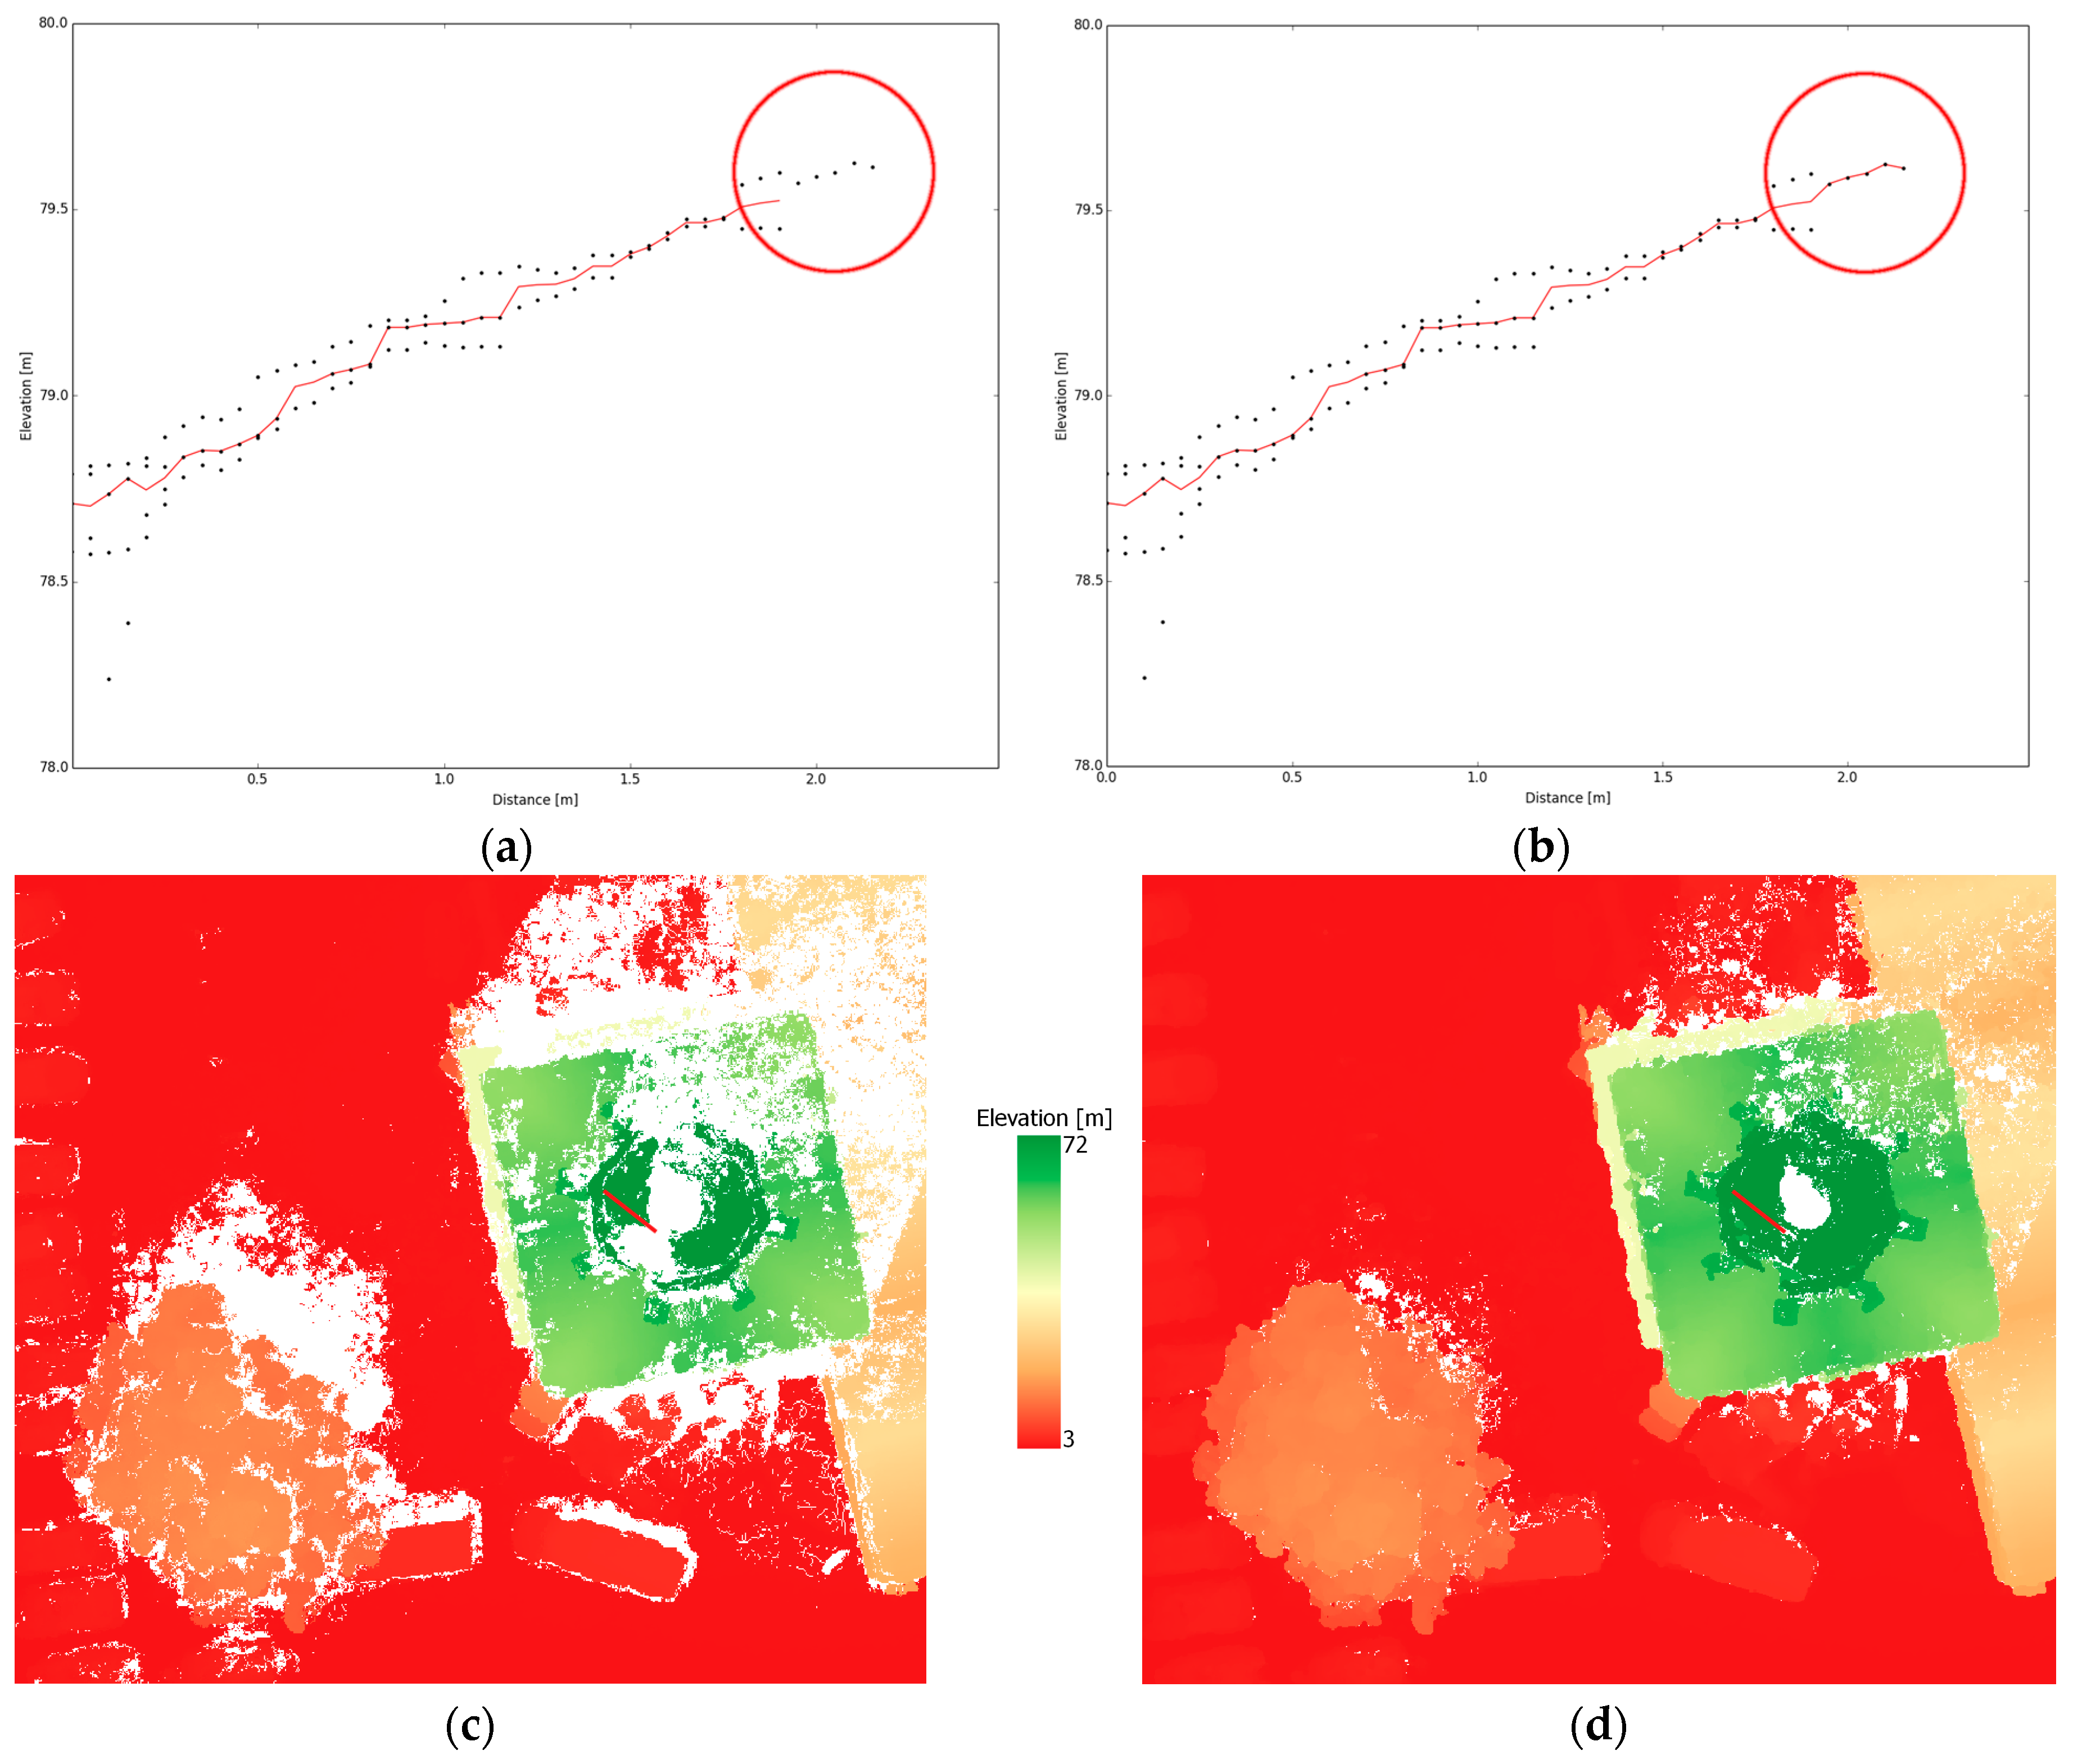
Figure 7.
(a,b) Profile showing elevation hypotheses derived from stereo pairs with the lowest b/h ratio (only neighboring images along a flight line) (black dots) and the DSM (red line): (a) generated with the use of methods described in Section 2.2, Section 2.3 and Section 2.4; and (b) after the procedure described in Section 2.5. The red circle indicates elevation hypotheses included to the DSM. (c,d) Color coded DSM of the same area: (c) generated with the use of methods described in Section 2.2, Section 2.3 and Section 2.4; and (d) after the procedure described in Section 2.5. The red line indicates the profile shown above.
2.6. Final Algorithm
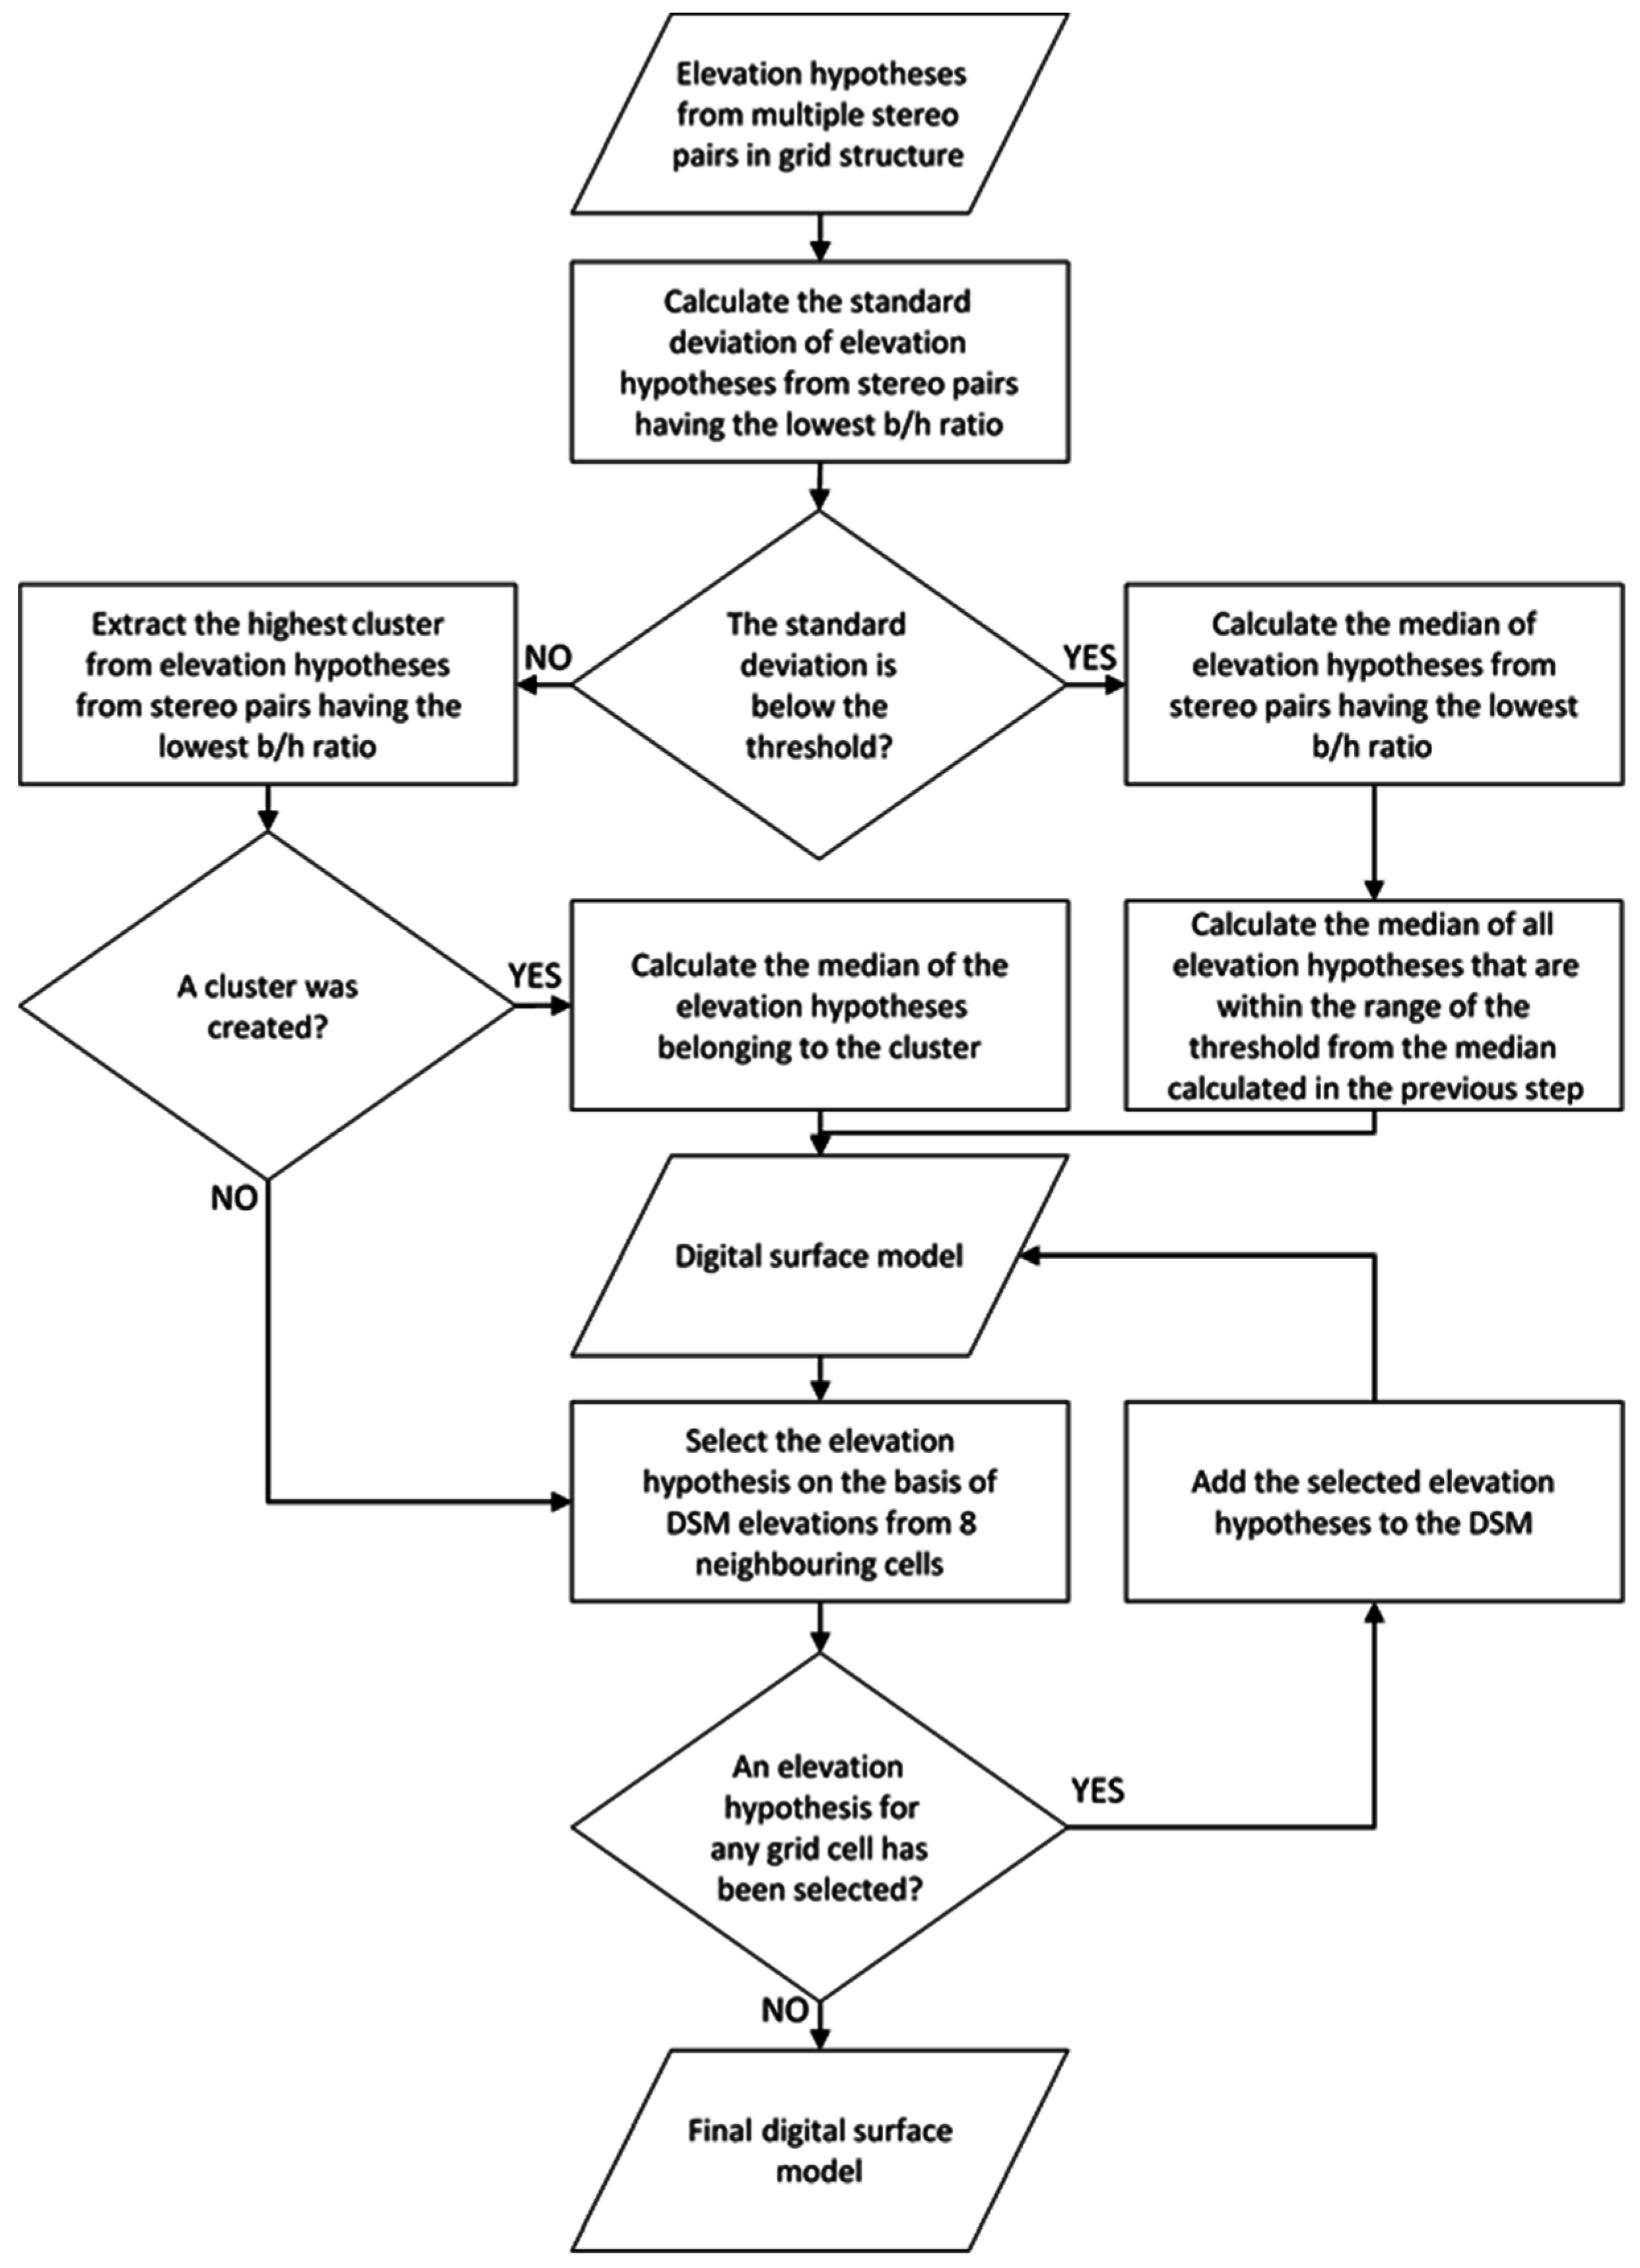
Methods presented in the preceding sections (Section 2.2, Section 2.3, Section 2.4 and Section 2.5) were used to construct the algorithm for integration of redundant elevation hypotheses from multiple stereo pairs. The algorithm is represented by a decision tree (Figure 8).
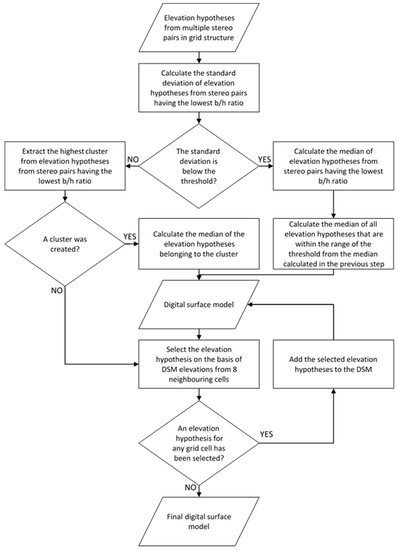
Figure 8.
Flowchart of the proposed algorithm.
Elevation hypotheses from all stereo pairs available for a given grid cell are taken as the input data. In the first steps the algorithm combines the methods described in Section 2.2 and Section 2.3. According to the assumptions that elevation hypotheses from stereo pairs with the lowest b/h ratio can be regarded as the first approximation of the reconstructed surface (Section 2.3) and that the distribution of the elevation hypotheses can serve to select the observations that should be used for the computation of the final elevation (Section 2.2), the standard deviation of elevation hypotheses from stereo pairs characterized by the lowest b/h ratio is calculated. If the value of the standard deviation is below the adopted threshold (σZ for a disparity error of 1 pixel for stereo pairs of the lowest b/h ratio (Equation (3))), the median of all elevation hypotheses from stereo pairs characterized by the lowest b/h ratio is calculated. This median elevation is then used to select the elevation hypotheses from all available stereo pairs which should be used to calculate the final elevation. It is calculated as the median of all elevation hypotheses that are within the range of the threshold from the median calculated in the previous step. This elevation is included to the final DSM.
If the standard deviation calculated in the first step is above the adopted threshold, the highest cluster extraction procedure described in Section 2.4 is carried on. Elevation hypotheses from stereo pairs having the lowest b/h ratio are used as the input to this procedure. If the cluster has been successfully extracted the final elevation is calculated as the median of the elevation hypotheses belonging to the cluster. This elevation is included to the final DSM.
If the distribution of the elevation hypotheses has not allowed extracting a cluster, the region growing algorithm described in Section 2.5 is carried on. The elevations calculated through the two paths described above are taken as the input to the procedure. After each iteration, the input for the next iteration is supplemented by the results of the previous iteration. The iterations are repeated as long as new elevations are provided. If the result of an iteration is identical to the result of the previous iteration the algorithm terminates. The result of the last iteration is the final DSM.
2.7. Methods of Results Evaluation
The presented algorithm (Section 2.6) was used to generate the DSM for both test fields (Section 2.1). To assess the performance of the proposed algorithm a quality control of the obtained DSM was carried out.
Reliable and objective quality assessment of the DSM is a difficult task. An optimal solution would be to compare the DSM to the ground truth. Unfortunately, such reference data are not available. This is because the image based DSM is true only for the moment of image acquisition. Very often LiDAR data are used as reference for the assessment of the performance of image based surface reconstruction. However, due to changes in the landscape (temporal objects, vegetation growth, building construction or demolition, changes in street infrastructure (road signs, street furniture, banners), etc.), a simple model comparison would not give reliable results. Therefore, the DSM quality assessment is usually based on visual evaluation. LiDAR point clouds can be used as supplementary data allowing to control individual elements of the DSM.
In this work, three methods of DSM quality assessment are proposed. Two are based on visual evaluation of terrain profiles (Section 3.1) and shaded surface display (Section 3.2). Terrain profiles allow inspecting selected elements of the DSM in details while the visualization of shaded surface is suitable for the assessment of the general quality of the reconstructed surface. The third method (Section 3.3) is an attempt of quantitative assessment by planarity control of flat parts of the model.
The results obtained from the proposed algorithm were compared to the results from commonly used software for dense image matching and DSM generation. It should be kept in mind that algorithms of 2.5D DSM generation implemented in commercial software are using different input data which are generated in the course of the workflow applied in a given software package. Therefore such an evaluation does not compare explicitly the performance of methods of integration of redundant image matching results. However, even though the algorithms implemented in the commercial software packages are not known exactly, their performance in image based surface reconstruction is commonly recognized and is often treated as a reference. Therefore, such a comparison can provide a quick overview of the performance of the proposed algorithm. The following software packages were used to generate the DSM based on the datasets analyzed in this study: INPHO Math-t-DSM 7.1.2, Pix4d 3.0.13, Agisoft PhotoScan 1.2.6, and SURE 1.0.9. Only the algorithms implemented in SURE are fully described in the literature [36]. The dense image matching implemented in SURE is based on the classic SGM enhanced by a hierarchical approach to limit disparity search ranges. After pairwise image matching SURE offers two methods of fusion of measurements from multiple stereo pairs which were briefly described in Section 1. In case of Math-t-DSM very limited information is provided in the software manual. According to this manual Math-t-DSM is making use of a feature-based matching method and of a pixel-wise matching method similar to the SGM. As far as Pix4d is concerned, the only information that can be found in the literature [50] is that the first 3D model is based on points derived by feature-based matching with the use of the Scale Invariant Feature Transform (SIFT) algorithm [51] with modified descriptors [52]. Then the model is densified by some sort of dense image matching method. In case of Agisoft Photoscan almost no information about the matching algorithm employed can be found in the literature. Remondino et al. [53] suggest that a stereo SGM-like method is implemented. The observation of the achievable results allows supposing that, similar to pix4d, a combination of feature-based methods and pixel-wise image matching is applied.
Each reference DSM was generated with the grid size equal to the image GSD. In case of Agisoft PhotoScan it was observed that the DSM generated in mode “high” (grid size two times bigger than the GSD) presents significantly better results in vegetated areas than the DSM from “ultrahigh” mode (grid size equal to the GSD). Therefore it was decided to include the lower resolution DSM from Agisoft Photoscan to the comparison.
SURE, unlike other compared software, offers to the user the possibility to define the number of stereo pairs used as well as the method of fusion of measurements from multiple stereo pairs (Section 1). Based on the previous research of the author [43] two scenarios in SURE were selected for this comparison: one showing the best performance in bare terrain areas and other showing better performance in vegetated areas. The first scenario (hereinafter referred to as “SURE, all stereo pairs”) involves using all available stereo pairs and applying the 2.5D method for fusing elevations from multiple stereo pairs. The second scenario (hereinafter referred to as “SURE, lowest b/h ratio stereo pairs”) consists of reducing the number of used stereo pairs to these with the lowest b/h ratio (neighboring images along a flight line) and applying the 3D method of fusing observations from multiple stereo pairs.
For one of the test fields (Elbląg) LiDAR data with a density of 10 points per m2 were available. These data were used for selecting parts of the DSM which can be assumed to be flat and served as reference for comparison of their planarity.
3. Results
3.1. Visual Assessment of Terrain Profiles
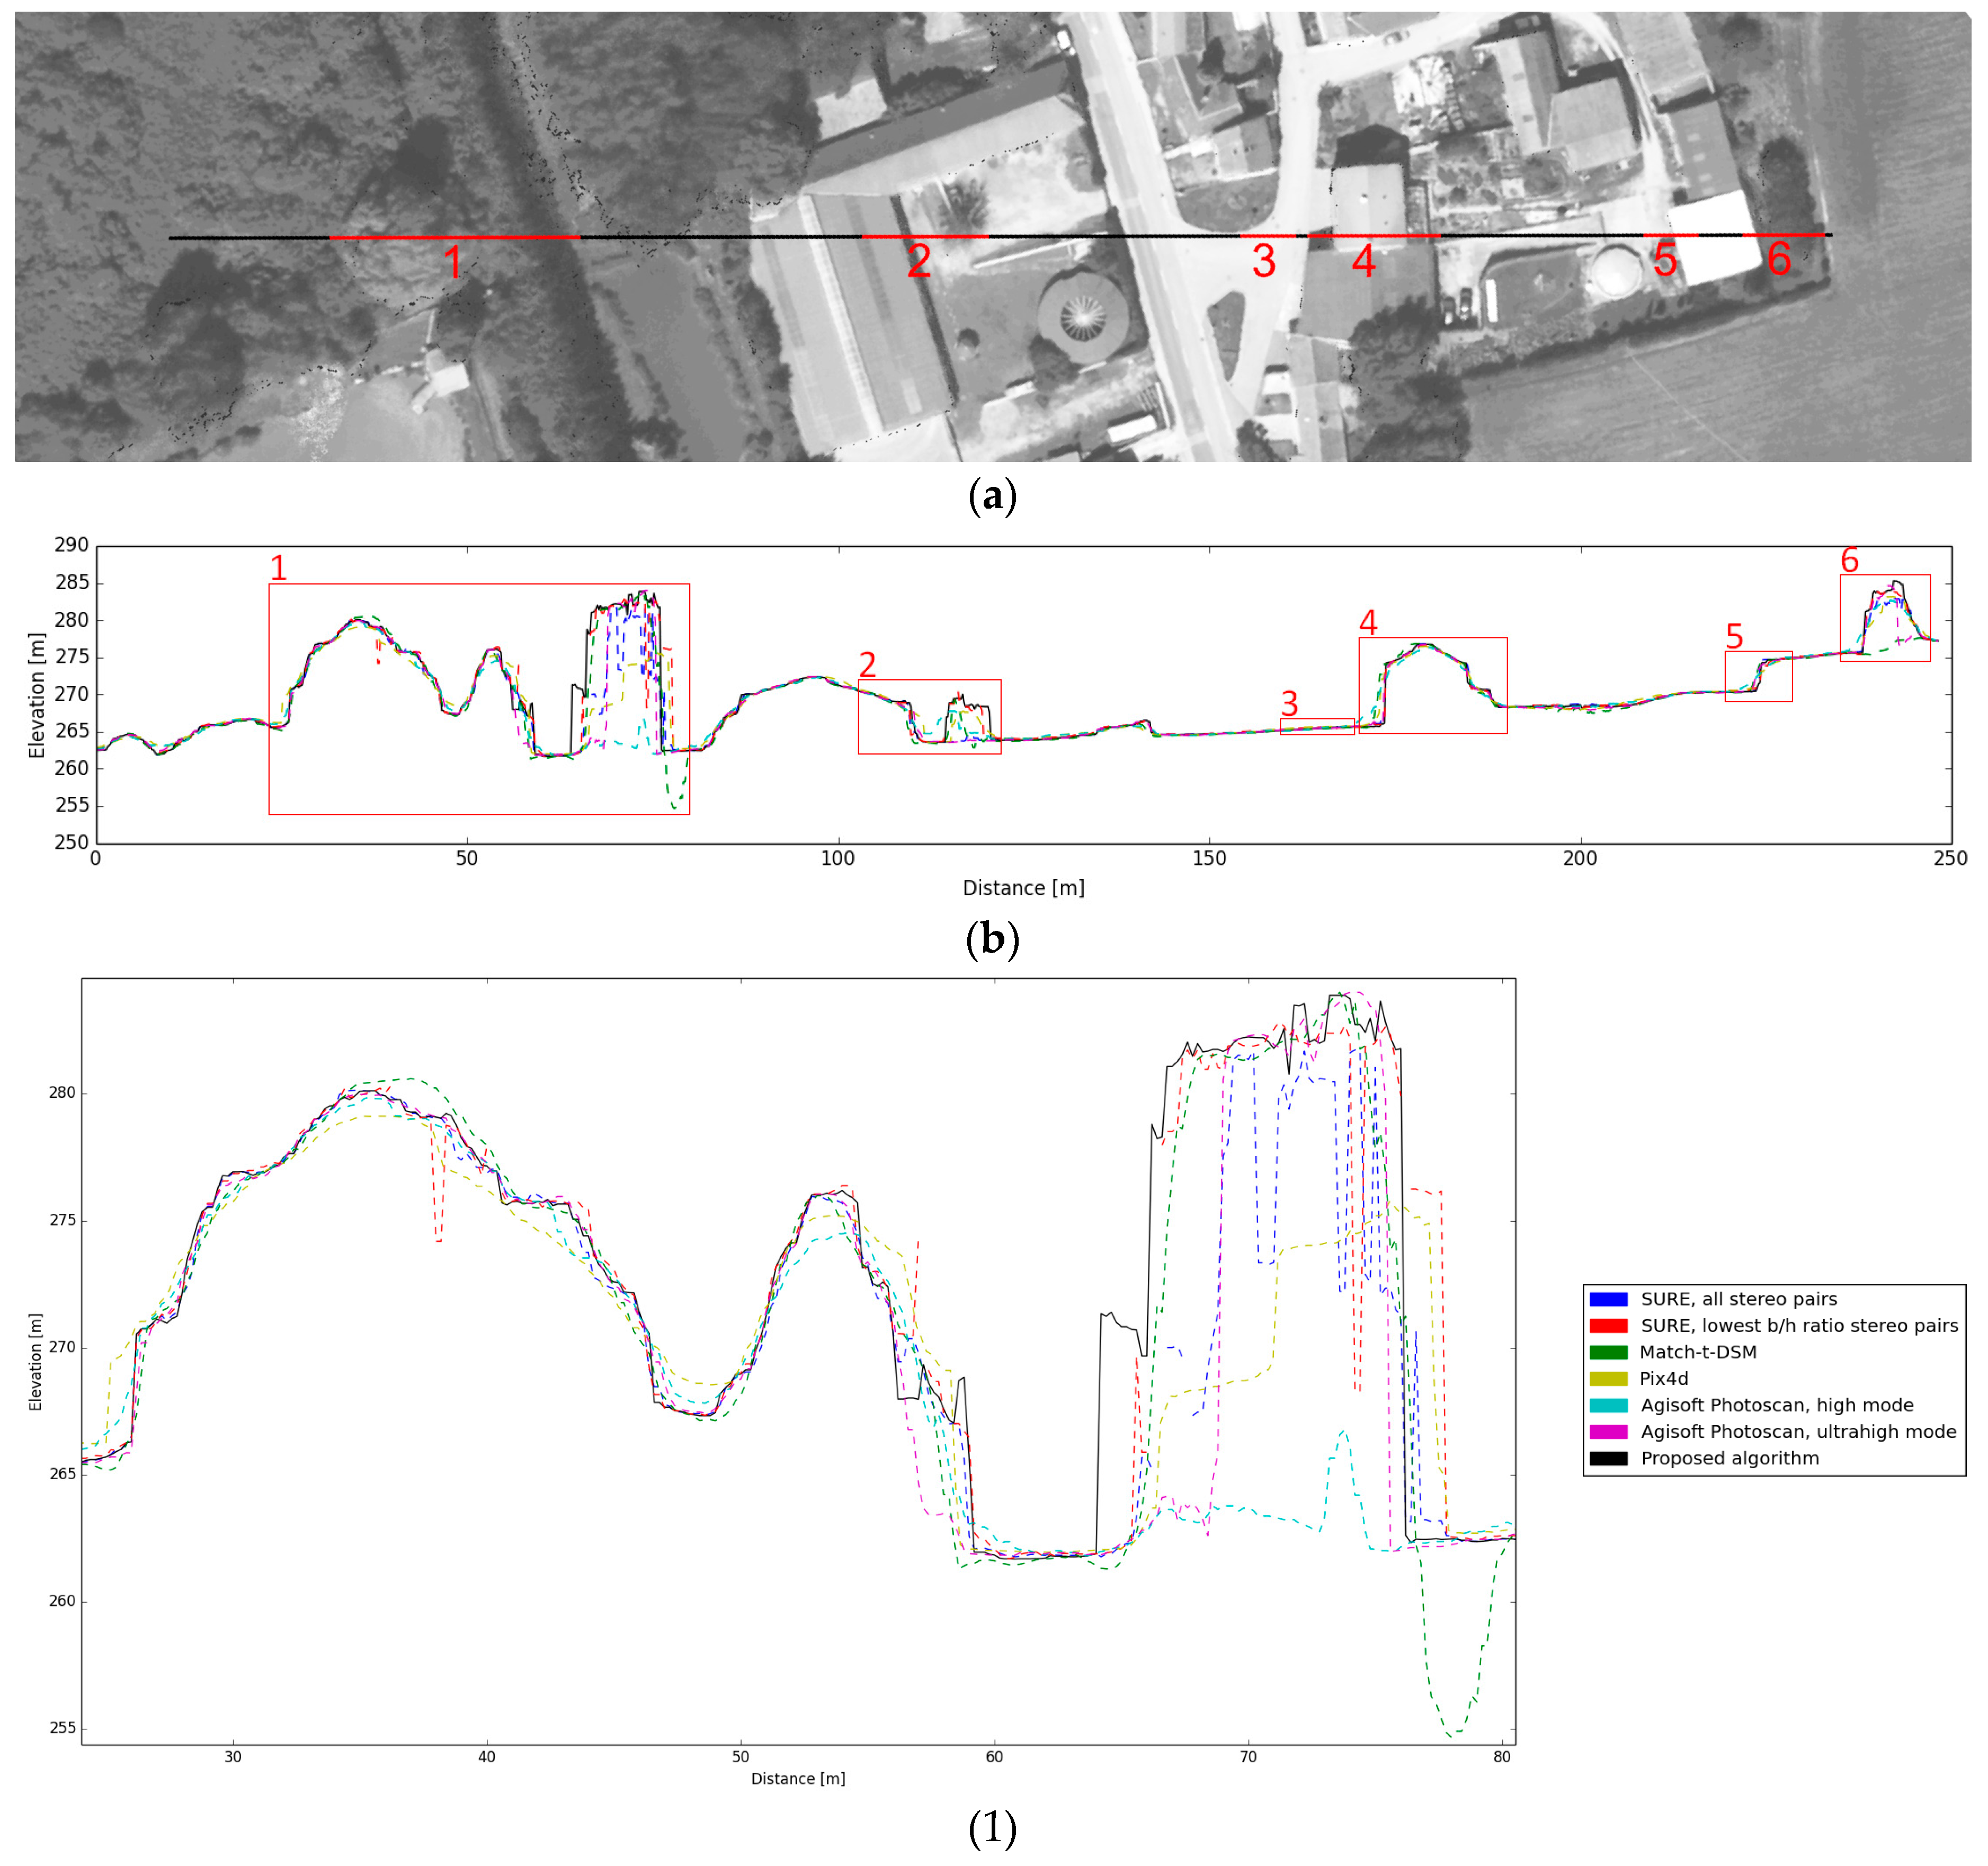
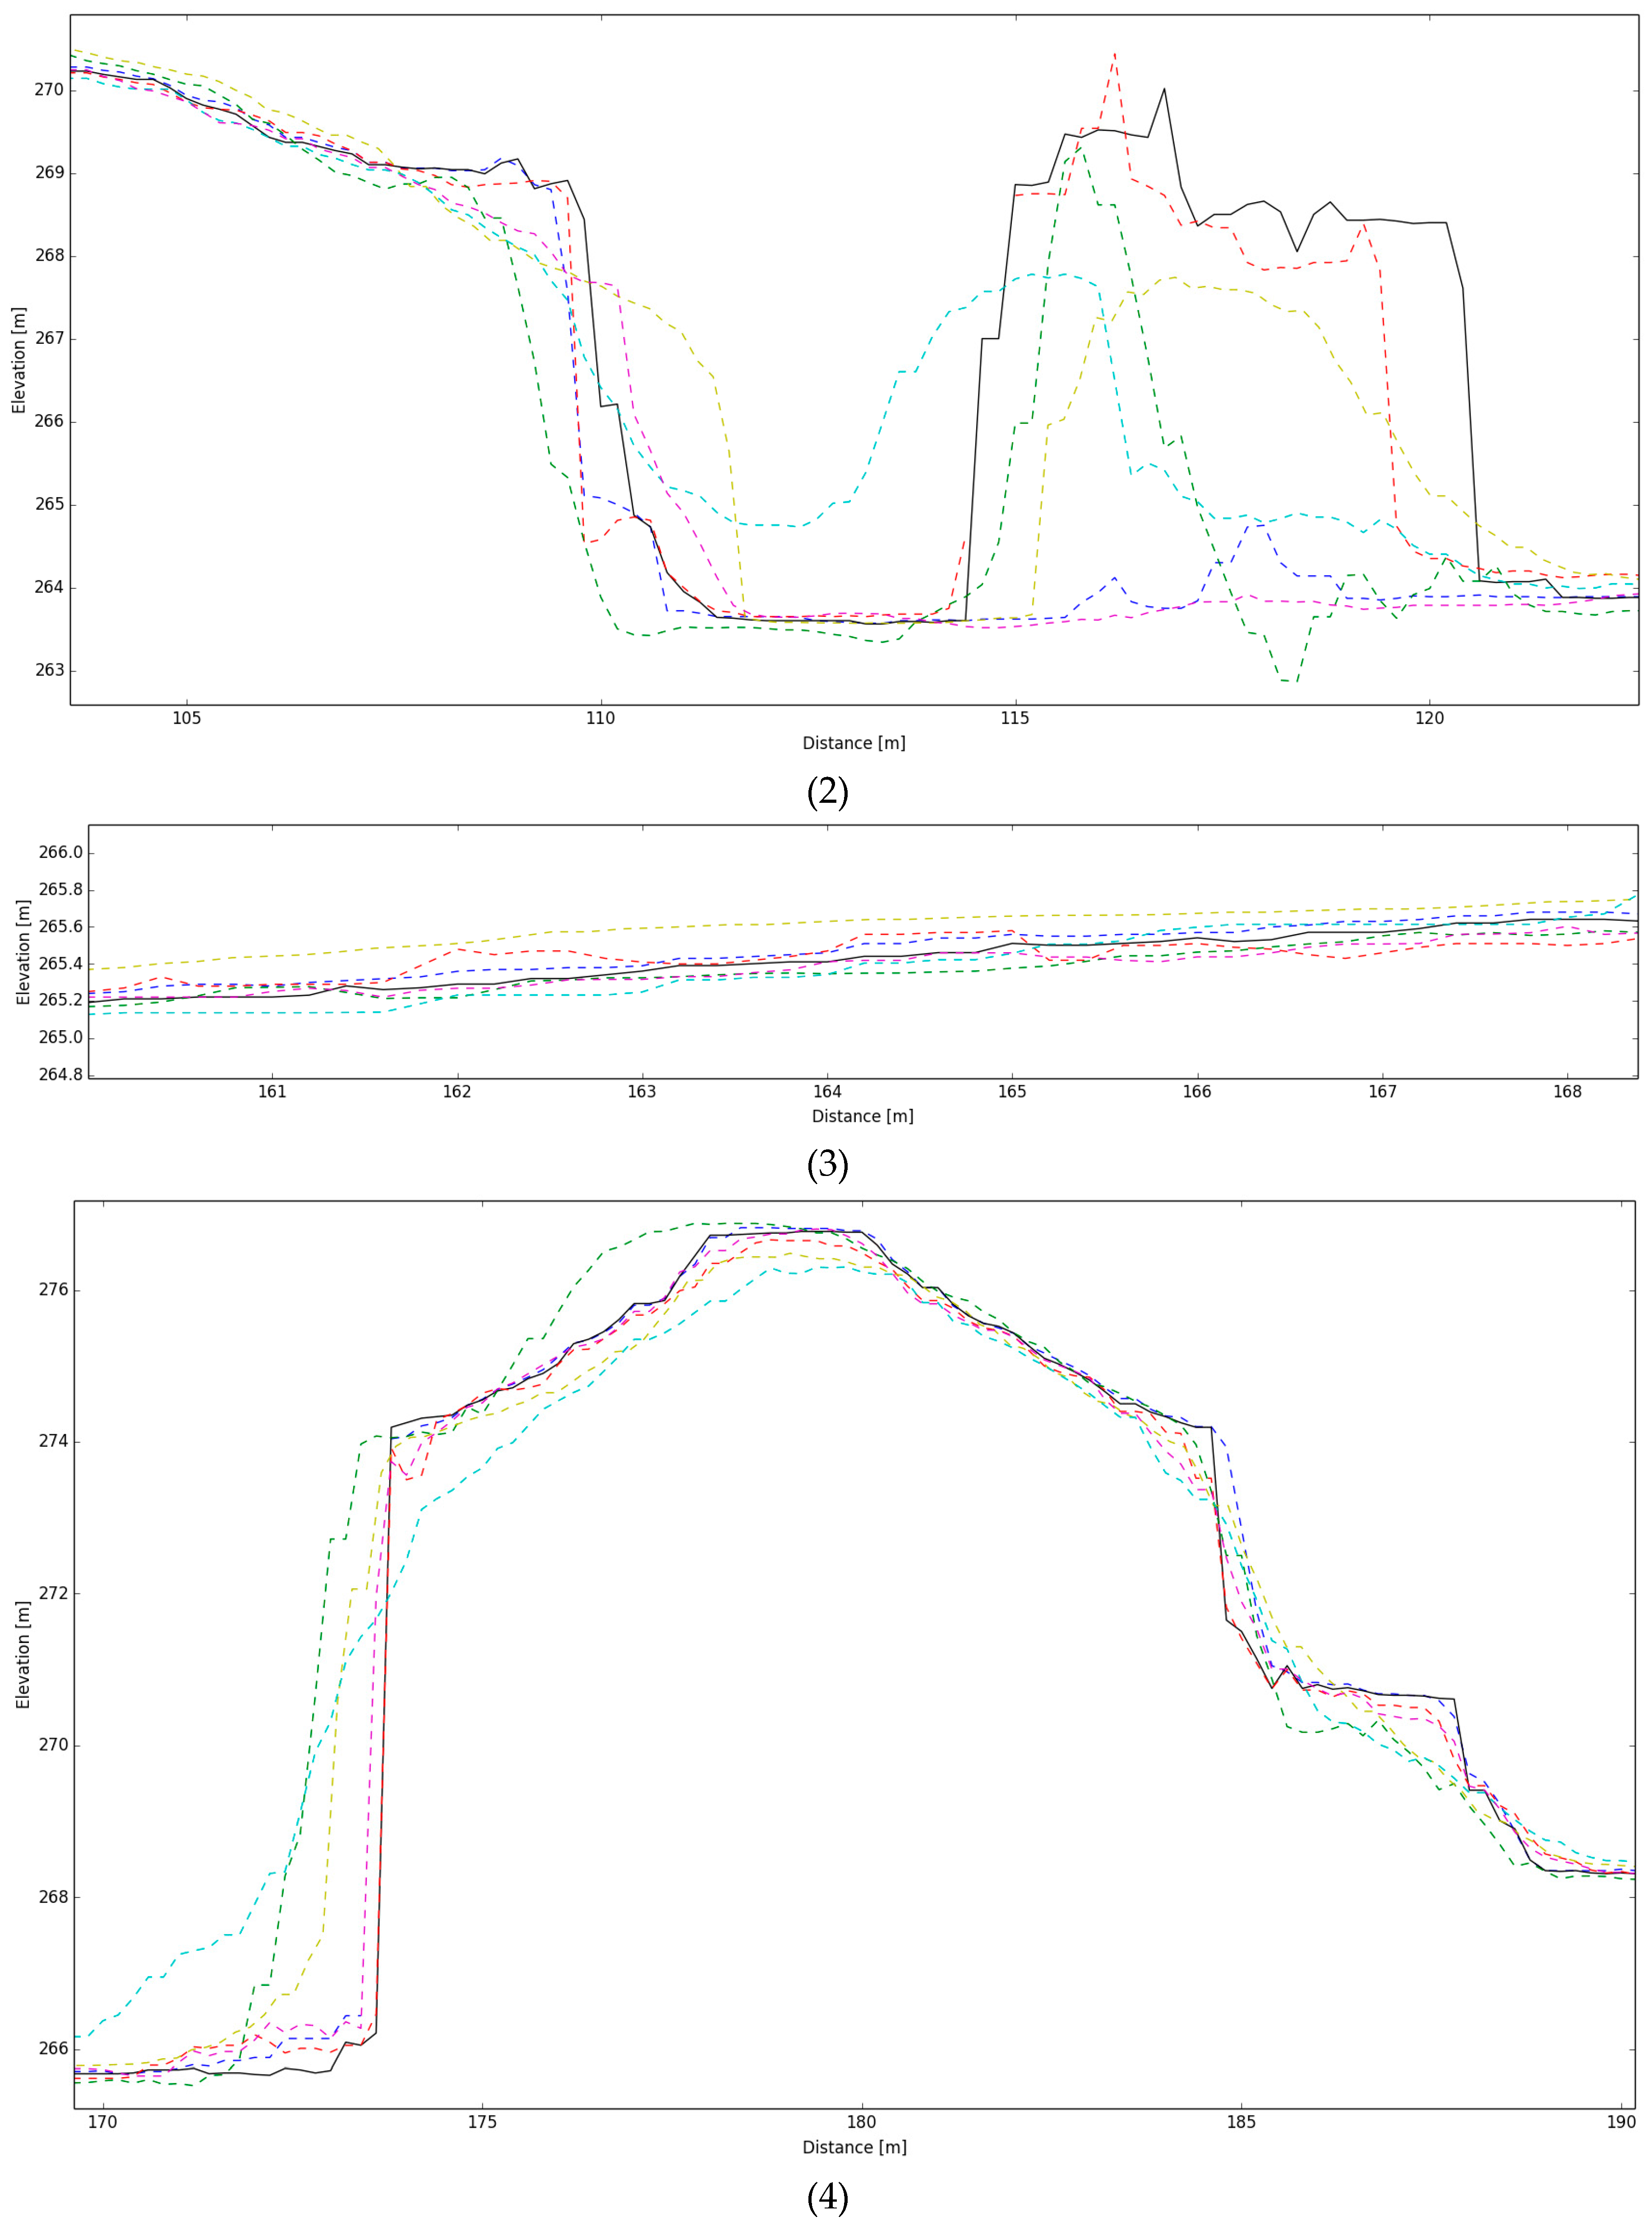
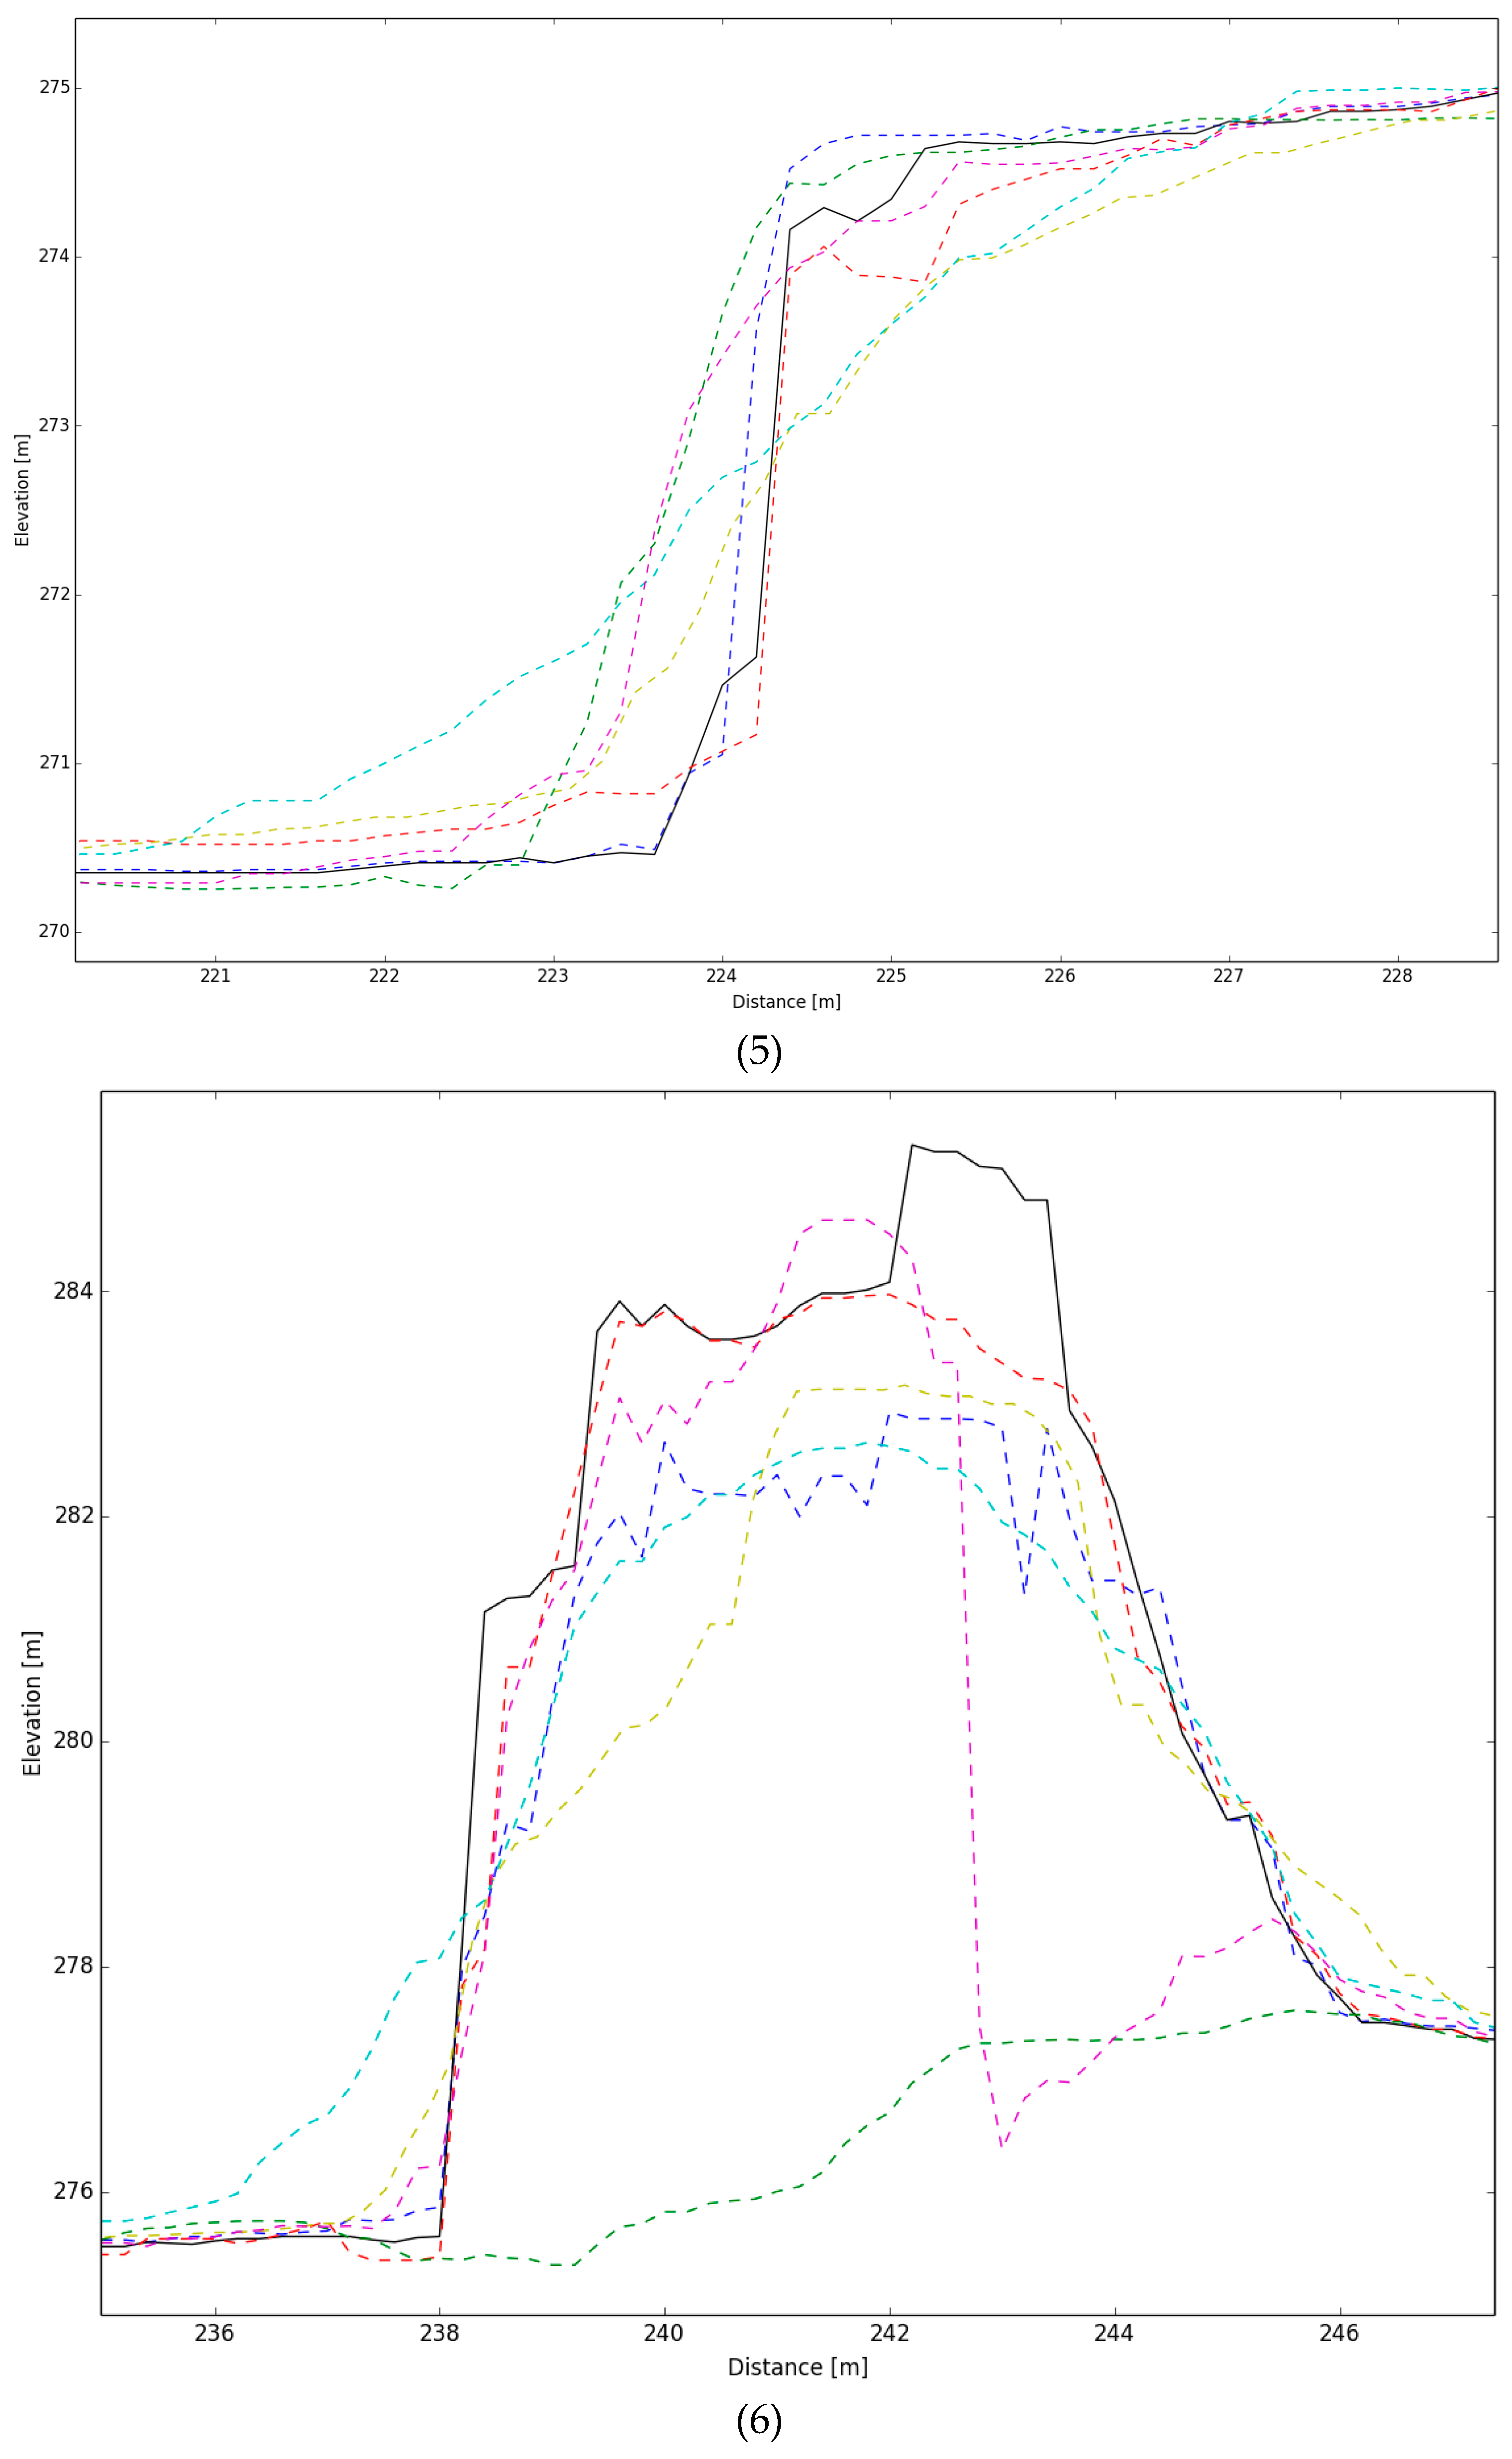
A visual analysis of many terrain profiles all over the both test fields was carried out. The analyzed profiles were selected to show different surface types and objects to fully assess the performance of the proposed algorithm in comparison to the reference data. Representative examples of terrain profiles for both datasets allow assessing the obtained results chosen to present in the paper (Figure 9 and Figure 10). In order to ensure objectivity, long profiles containing different surface types and objects were selected. Then, elements of these profiles were analyzed in detail.
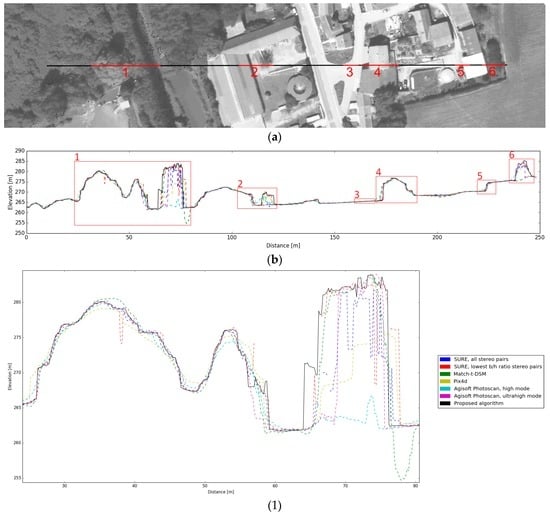
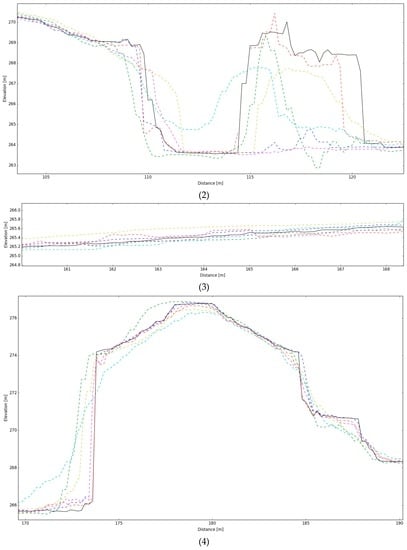
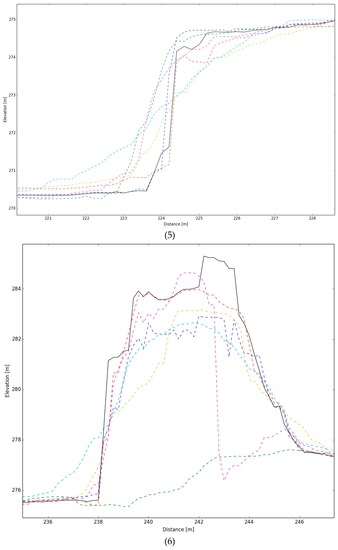
Figure 9.
Visual analysis of a terrain profile for the Enzersdorf test field (20 cm GSD). (a) Profile shown on the true orthophoto. Red lines indicate parts of the profile analyzed in detail below. (b) Overview of the compared DSMs along the profile. Red rectangles indicate parts of the profile analyzed in detail below. (1–6) Parts of the profile analyzed in detail. The DSMs derived with the use of different software solutions are differentiated by color.
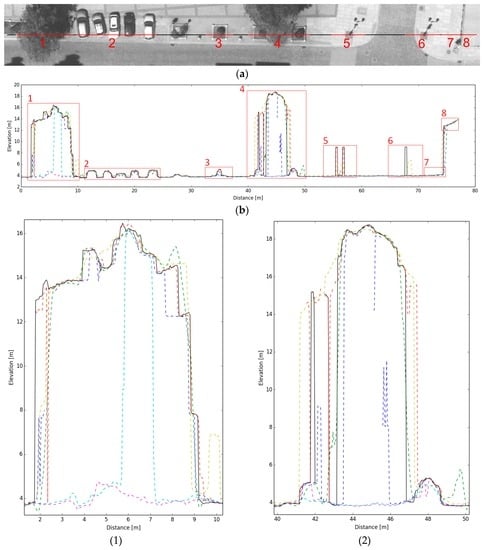
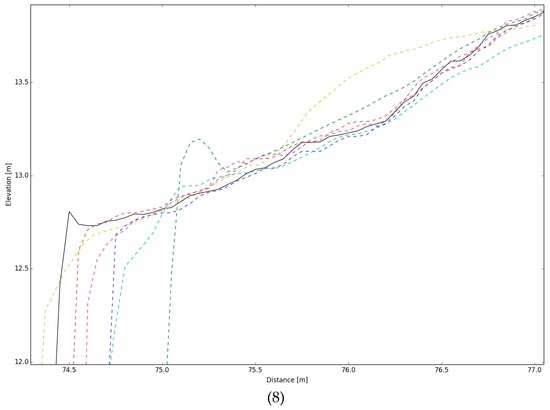
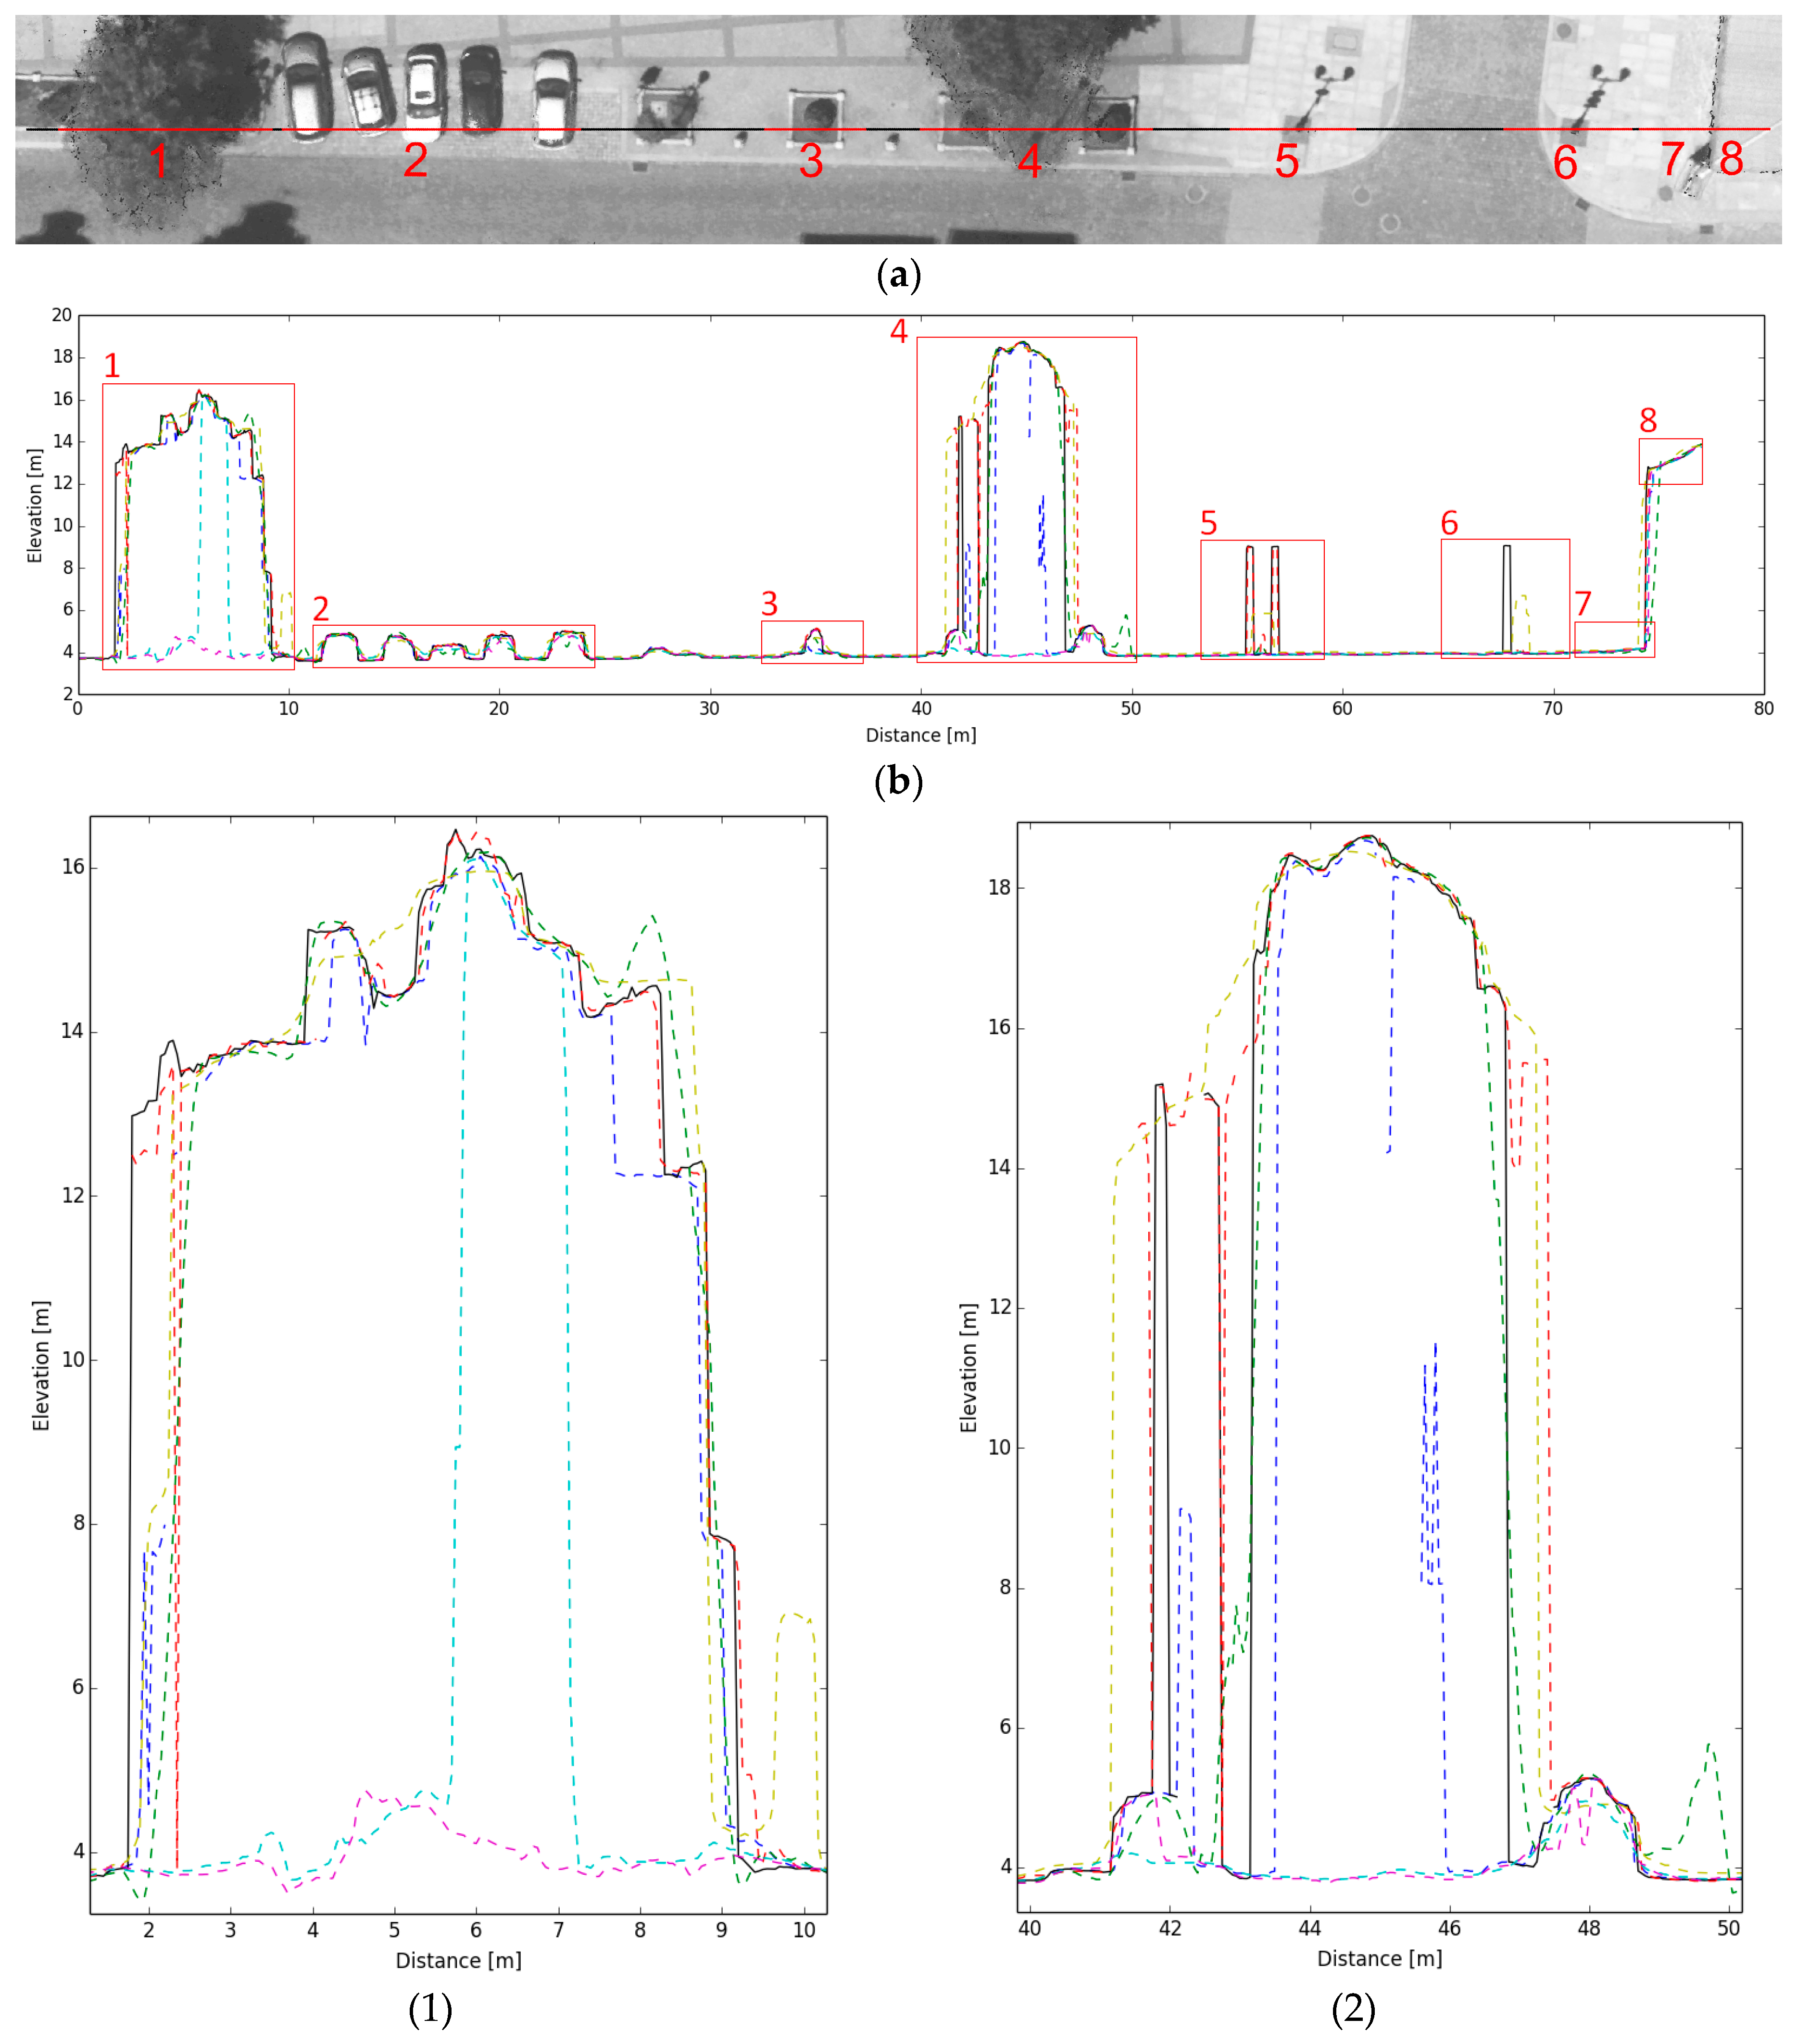
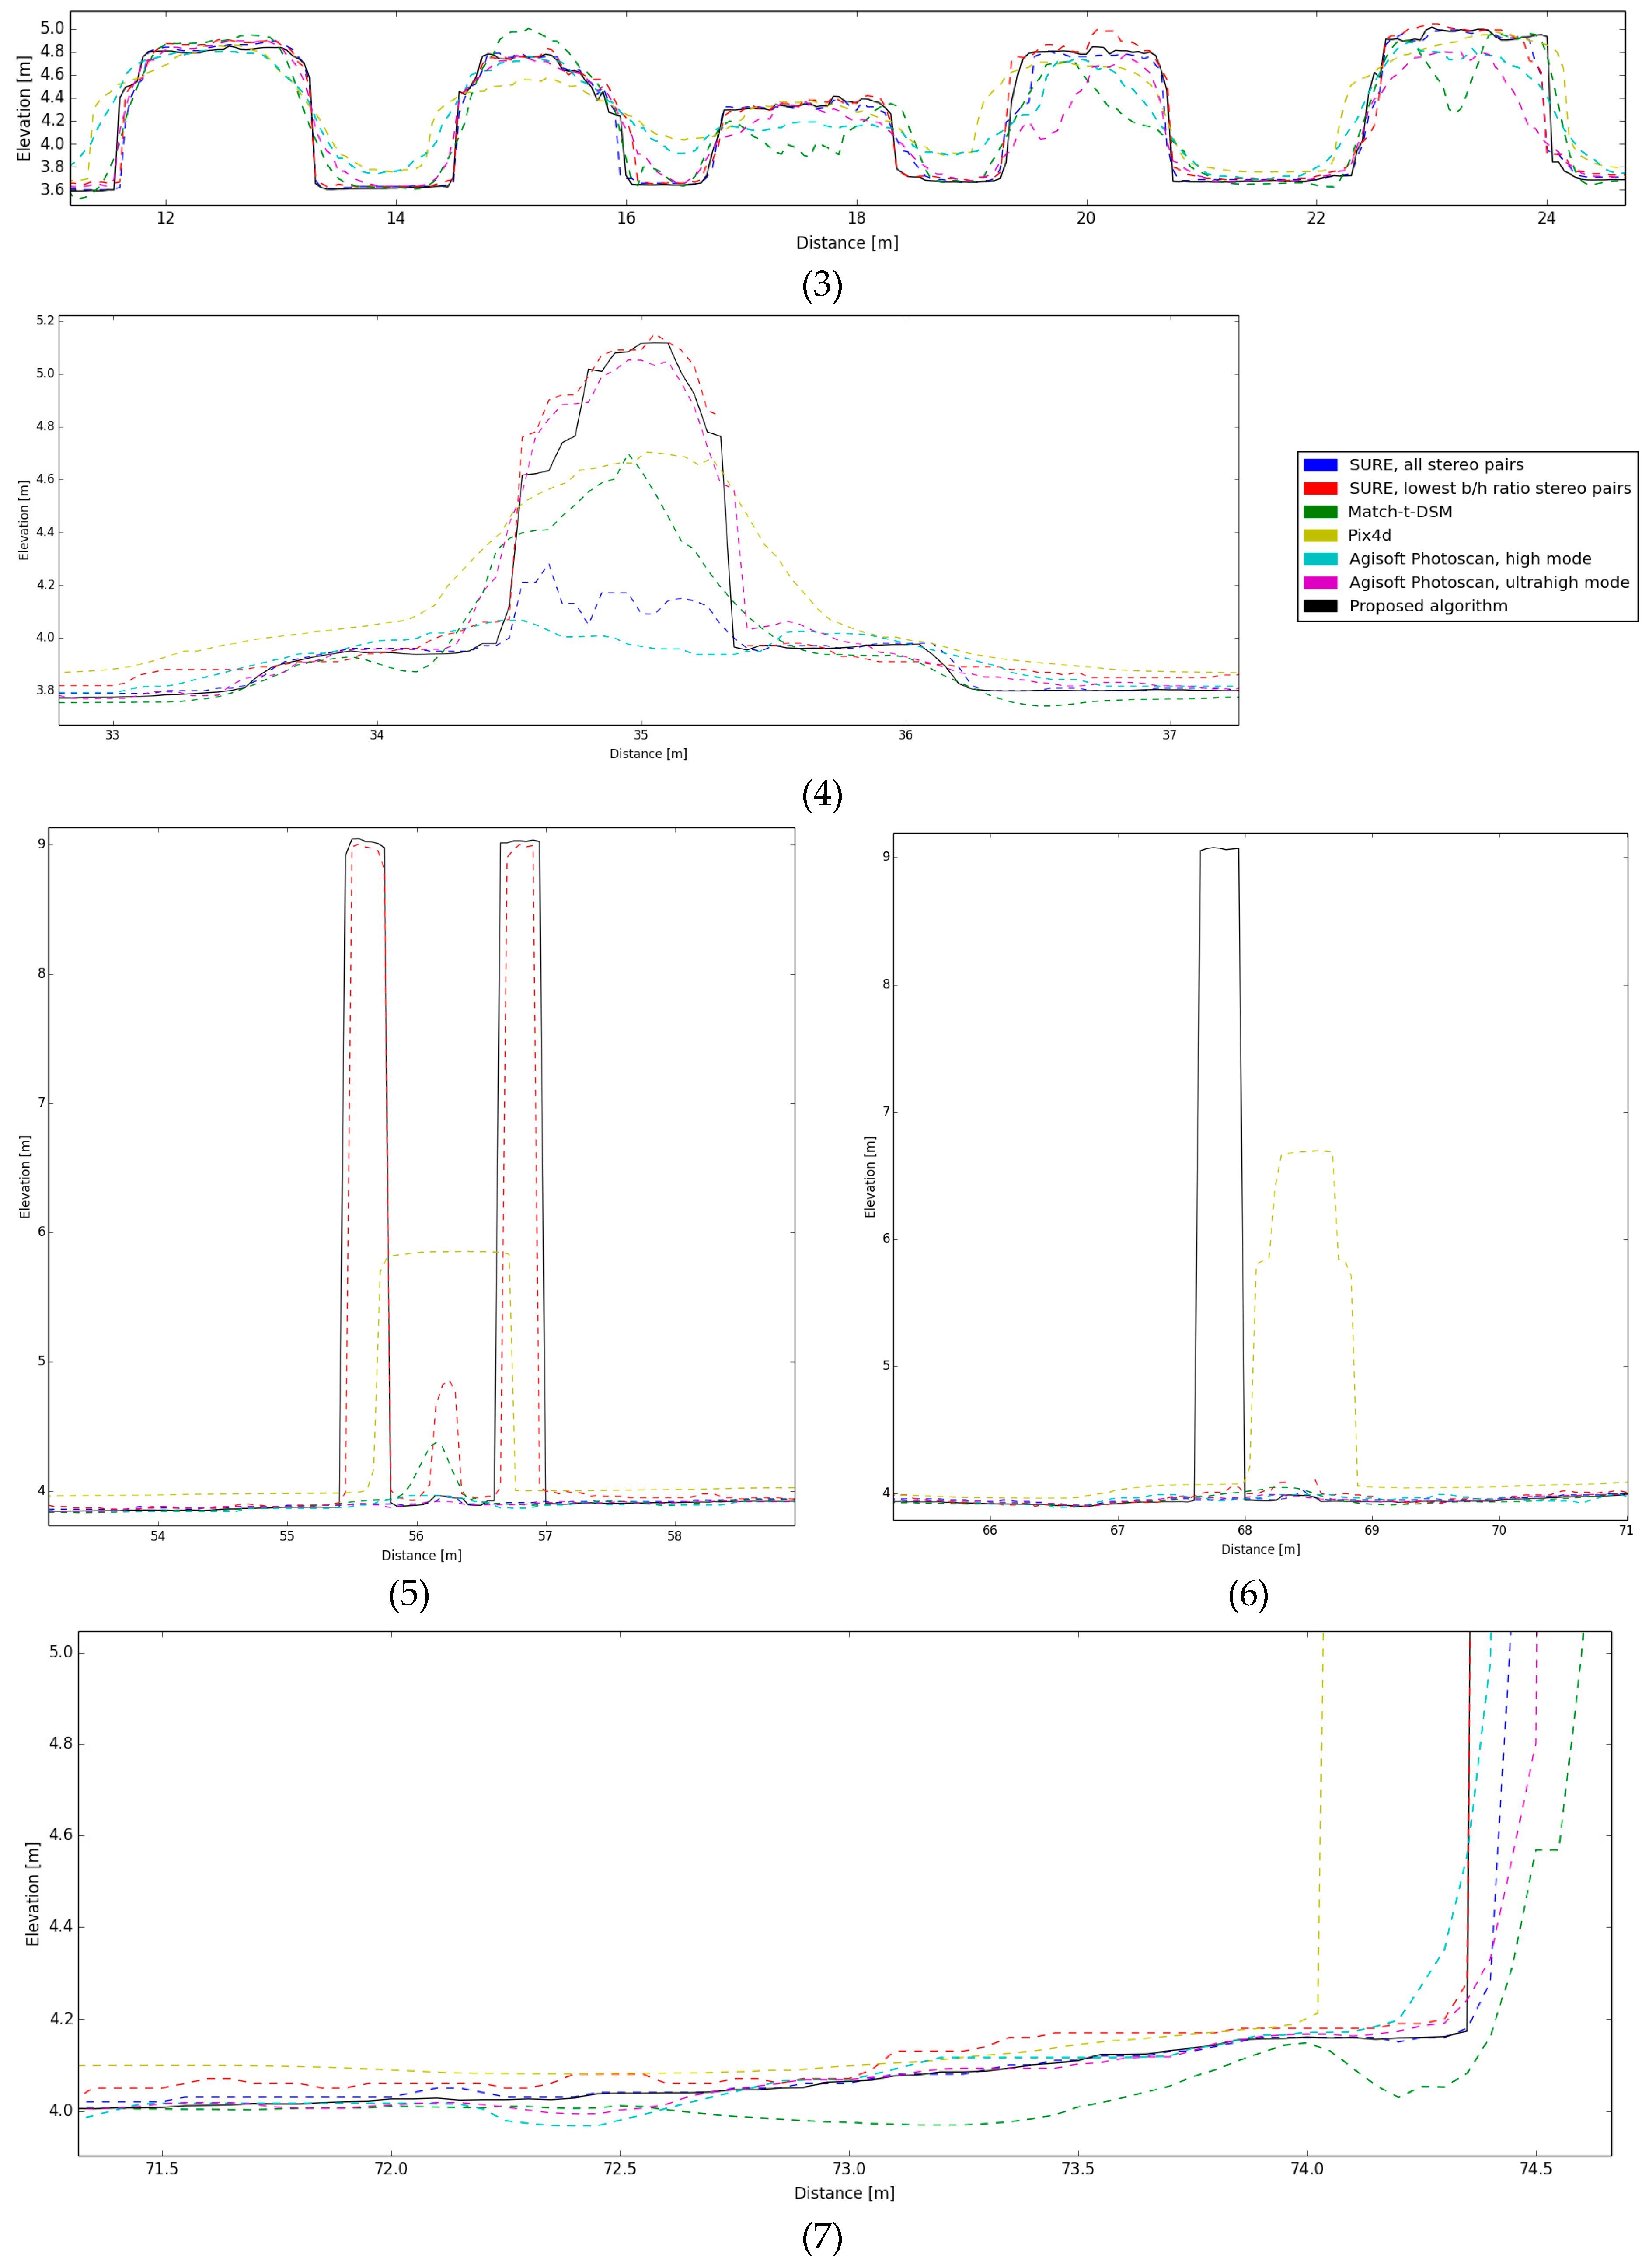
Figure 10.
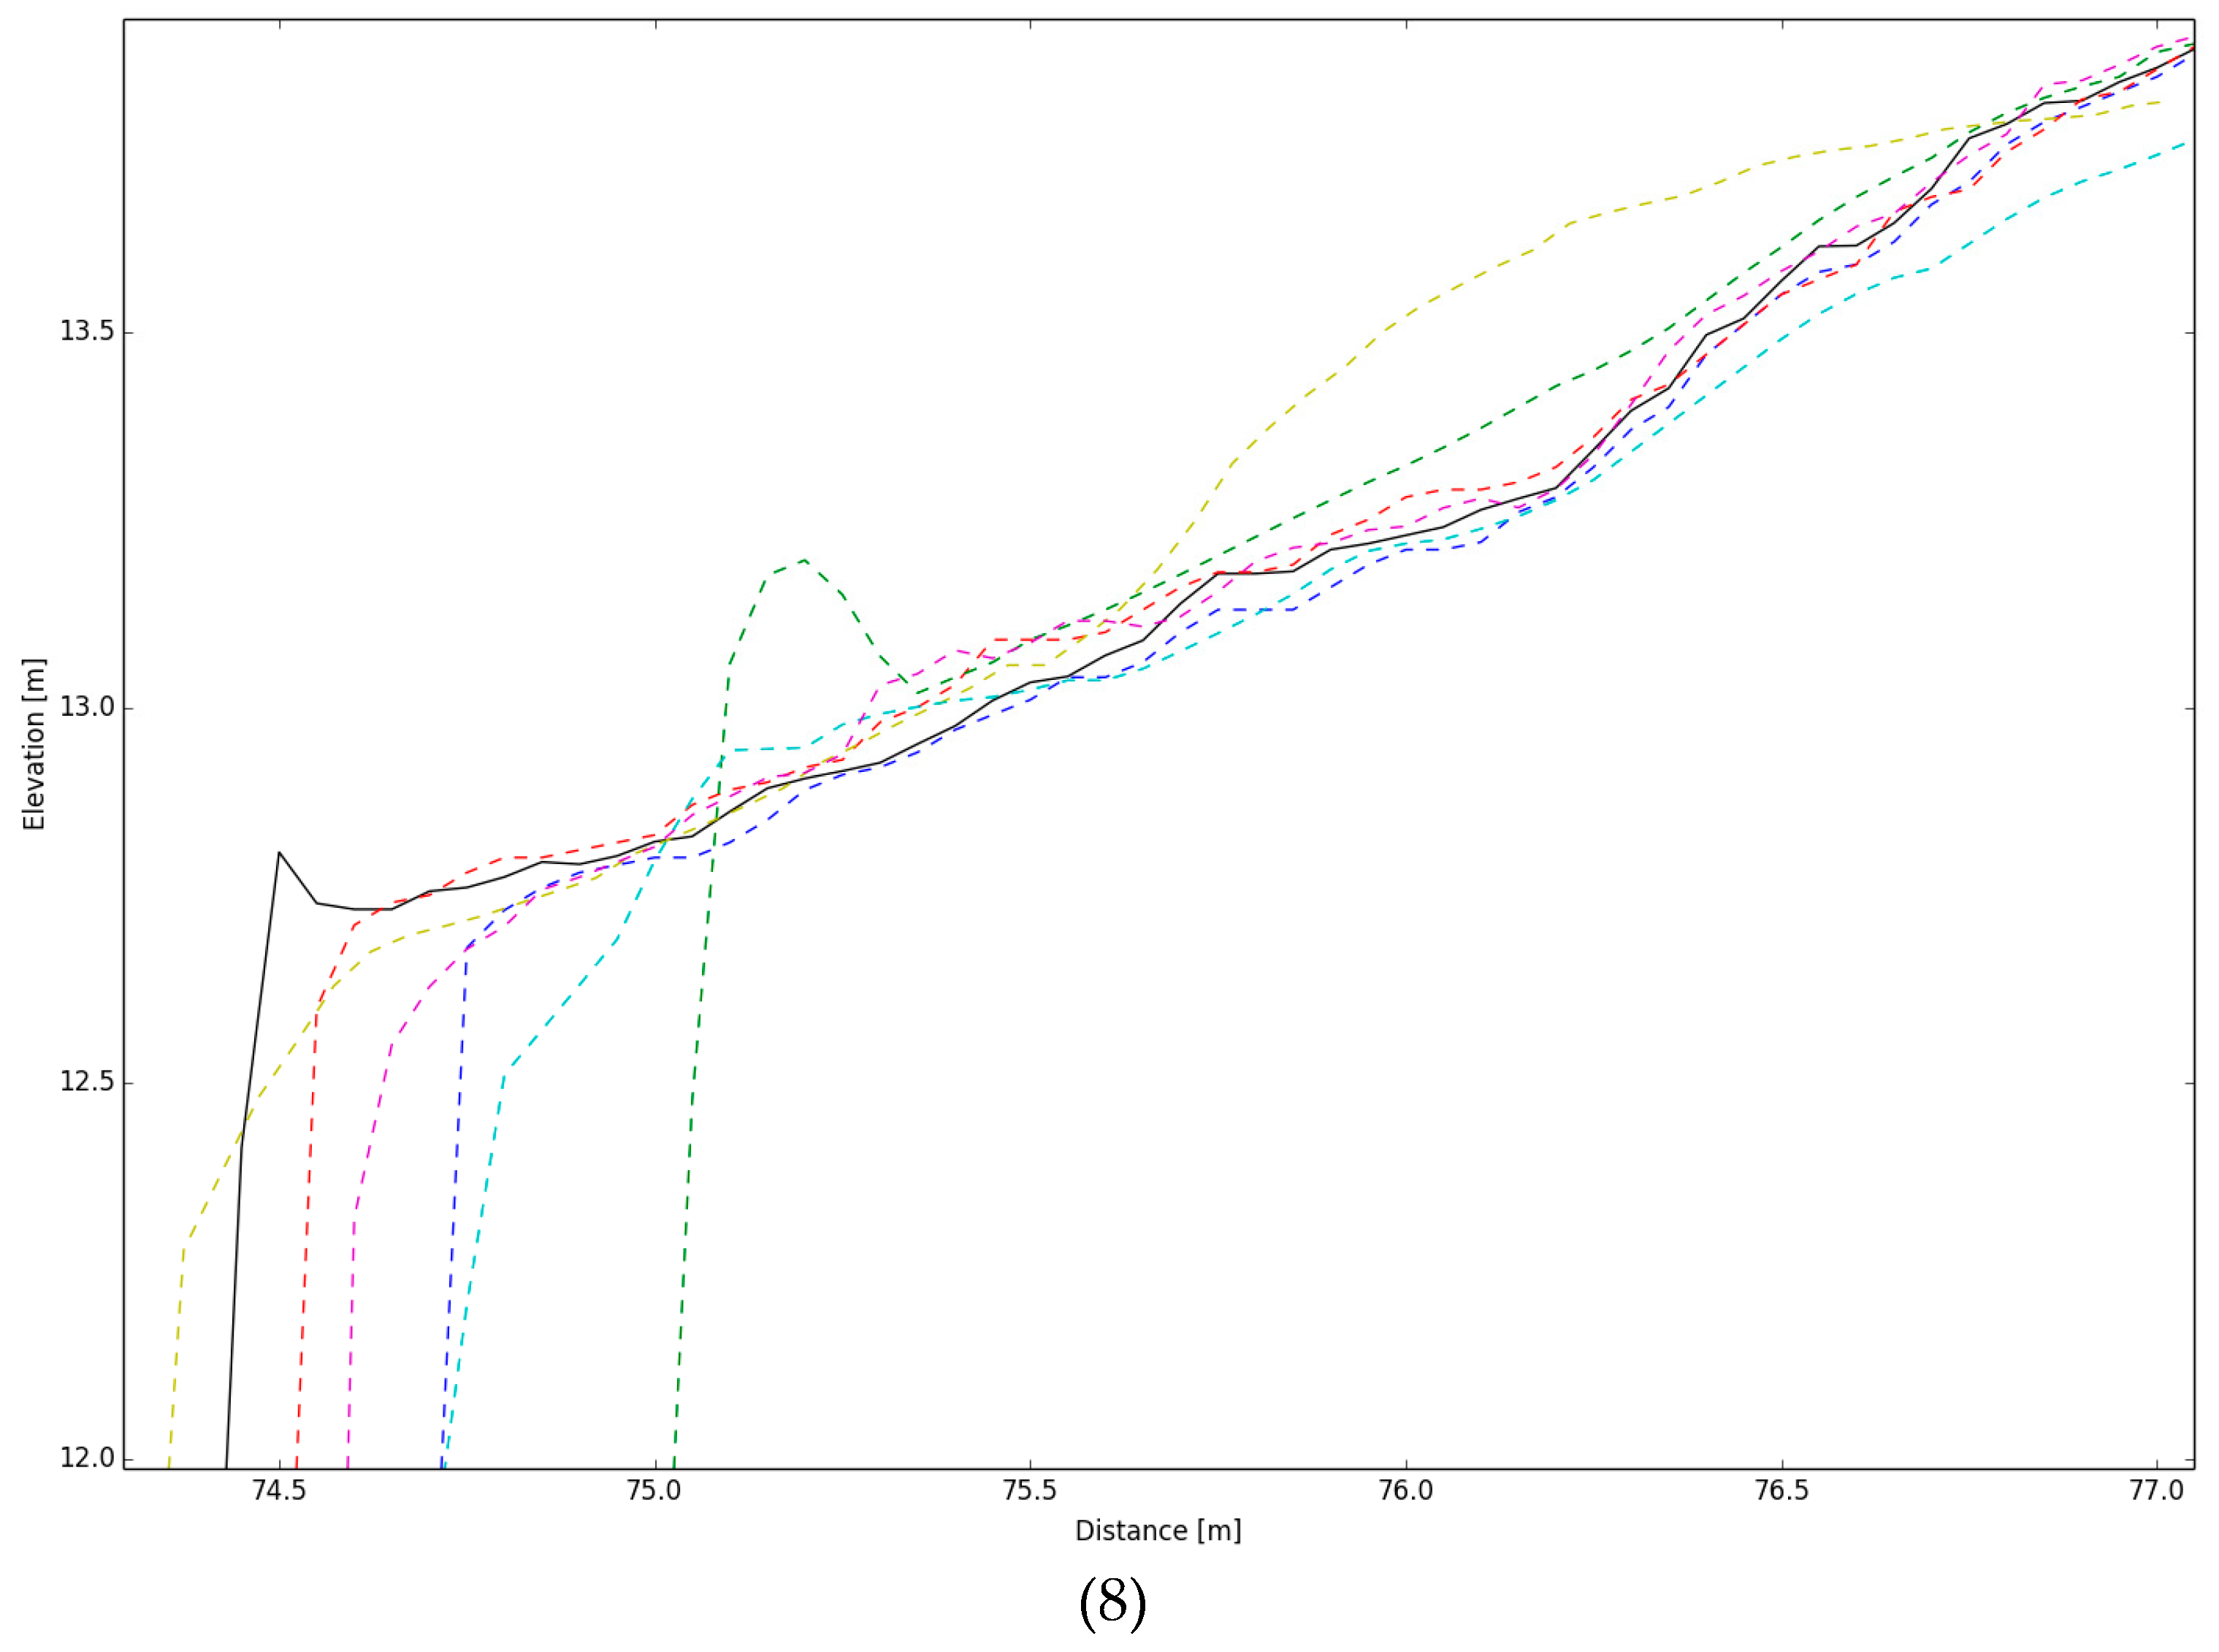
Visual analysis of a terrain profile for the Elbląg test field (5 cm GSD). (a) Profile shown on the true orthophoto. Red lines indicate parts of the profile analyzed in detail below. (b) Overview of the compared DSMs along the profile. Red rectangles indicate parts of the profile analyzed in detail below. (1–8) Parts of the profile analyzed in detail. The DSMs derived with the use of different software solutions are differentiated by color.
The presented profiles show that the DSMs obtained from SURE are in general of good quality comparing to the results from other software. It is important to note that it does not necessarily mean that the algorithm of dense image matching implemented in SURE performs better. The quality of the DSM is influenced by the dense image matching as well as by the procedure of integration of results from multiple stereo pairs to the final 2.5D surface.
The analysis of the profiles allowed to formulate some remarks presented below. Agisoft Photoscan, while giving reasonable results for building roofs, shows very poor results in vegetated areas. Match-t-DSM presents a quite good performance in general surface reconstruction but shows some unattended behavior near object edges, which significantly degrades the DSM. The surface from Pix4d is definitely too smoothed which leads to the loss of fine details and the underestimation of objects’ elevations. The DSM from SURE based on all stereo pairs represents a smooth surface in bare terrain areas as well as sharp object edges, especially for the Enzersdorf test field, however it shows lower quality in the reconstruction of trees and fine structures. In turn, the DSM from SURE based only on stereo pairs with lowest b/h ratio shows better results for fine details and vegetated areas however the reconstructed surface is more rough and noisy especially in flat areas. The proposed algorithm allows combining the advantages of the compared surfaces and results in a good surface reconstruction in vegetated areas, sharper object edges and smoother surface in bare terrain areas.
3.2. Visual Assessment of Shaded Surface
The shaded surface display allows assessing the completeness of the model (by comparing missing objects), the smoothness of the surface as well as the correct shape of the well-known types of objects (like building roofs). Representative views of the shaded surface from both test fields are presented (Figure 11 and Figure 12). The shaded surface of the DSM generated with the use of the proposed method is compared to the identical view of the models obtained with compared software.
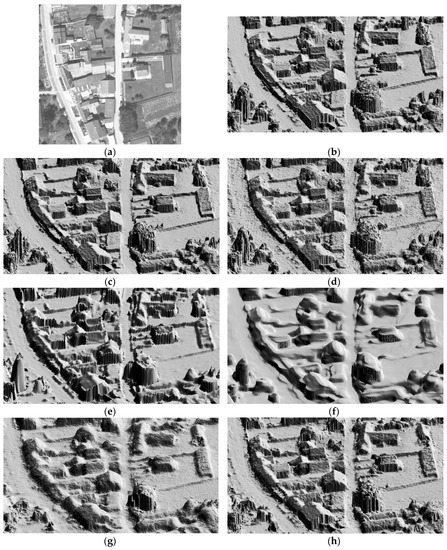
Figure 11.
Visual analysis of the shaded surface display for the Enzersdorf test field (20 cm GSD): (a) true orthophoto of the analyzed area; (b) proposed algorithm; (c) SURE, all stereo pairs; (d) SURE, lowest b/h ratio stereo pairs; (e) Match-t-DSM; (f) Pix4d; (g) Agisoft Photoscan, high mode; and (h) Agisoft Photoscan, ultrahigh mode.
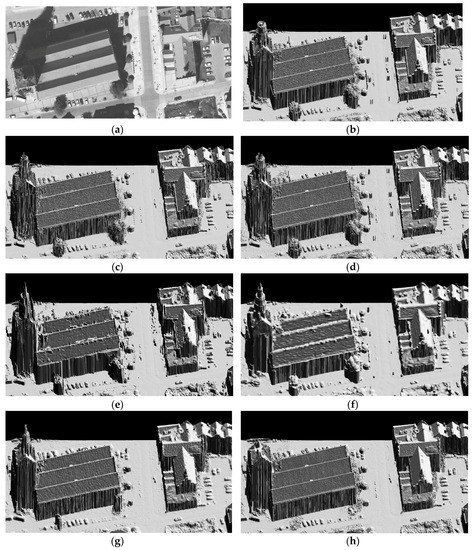
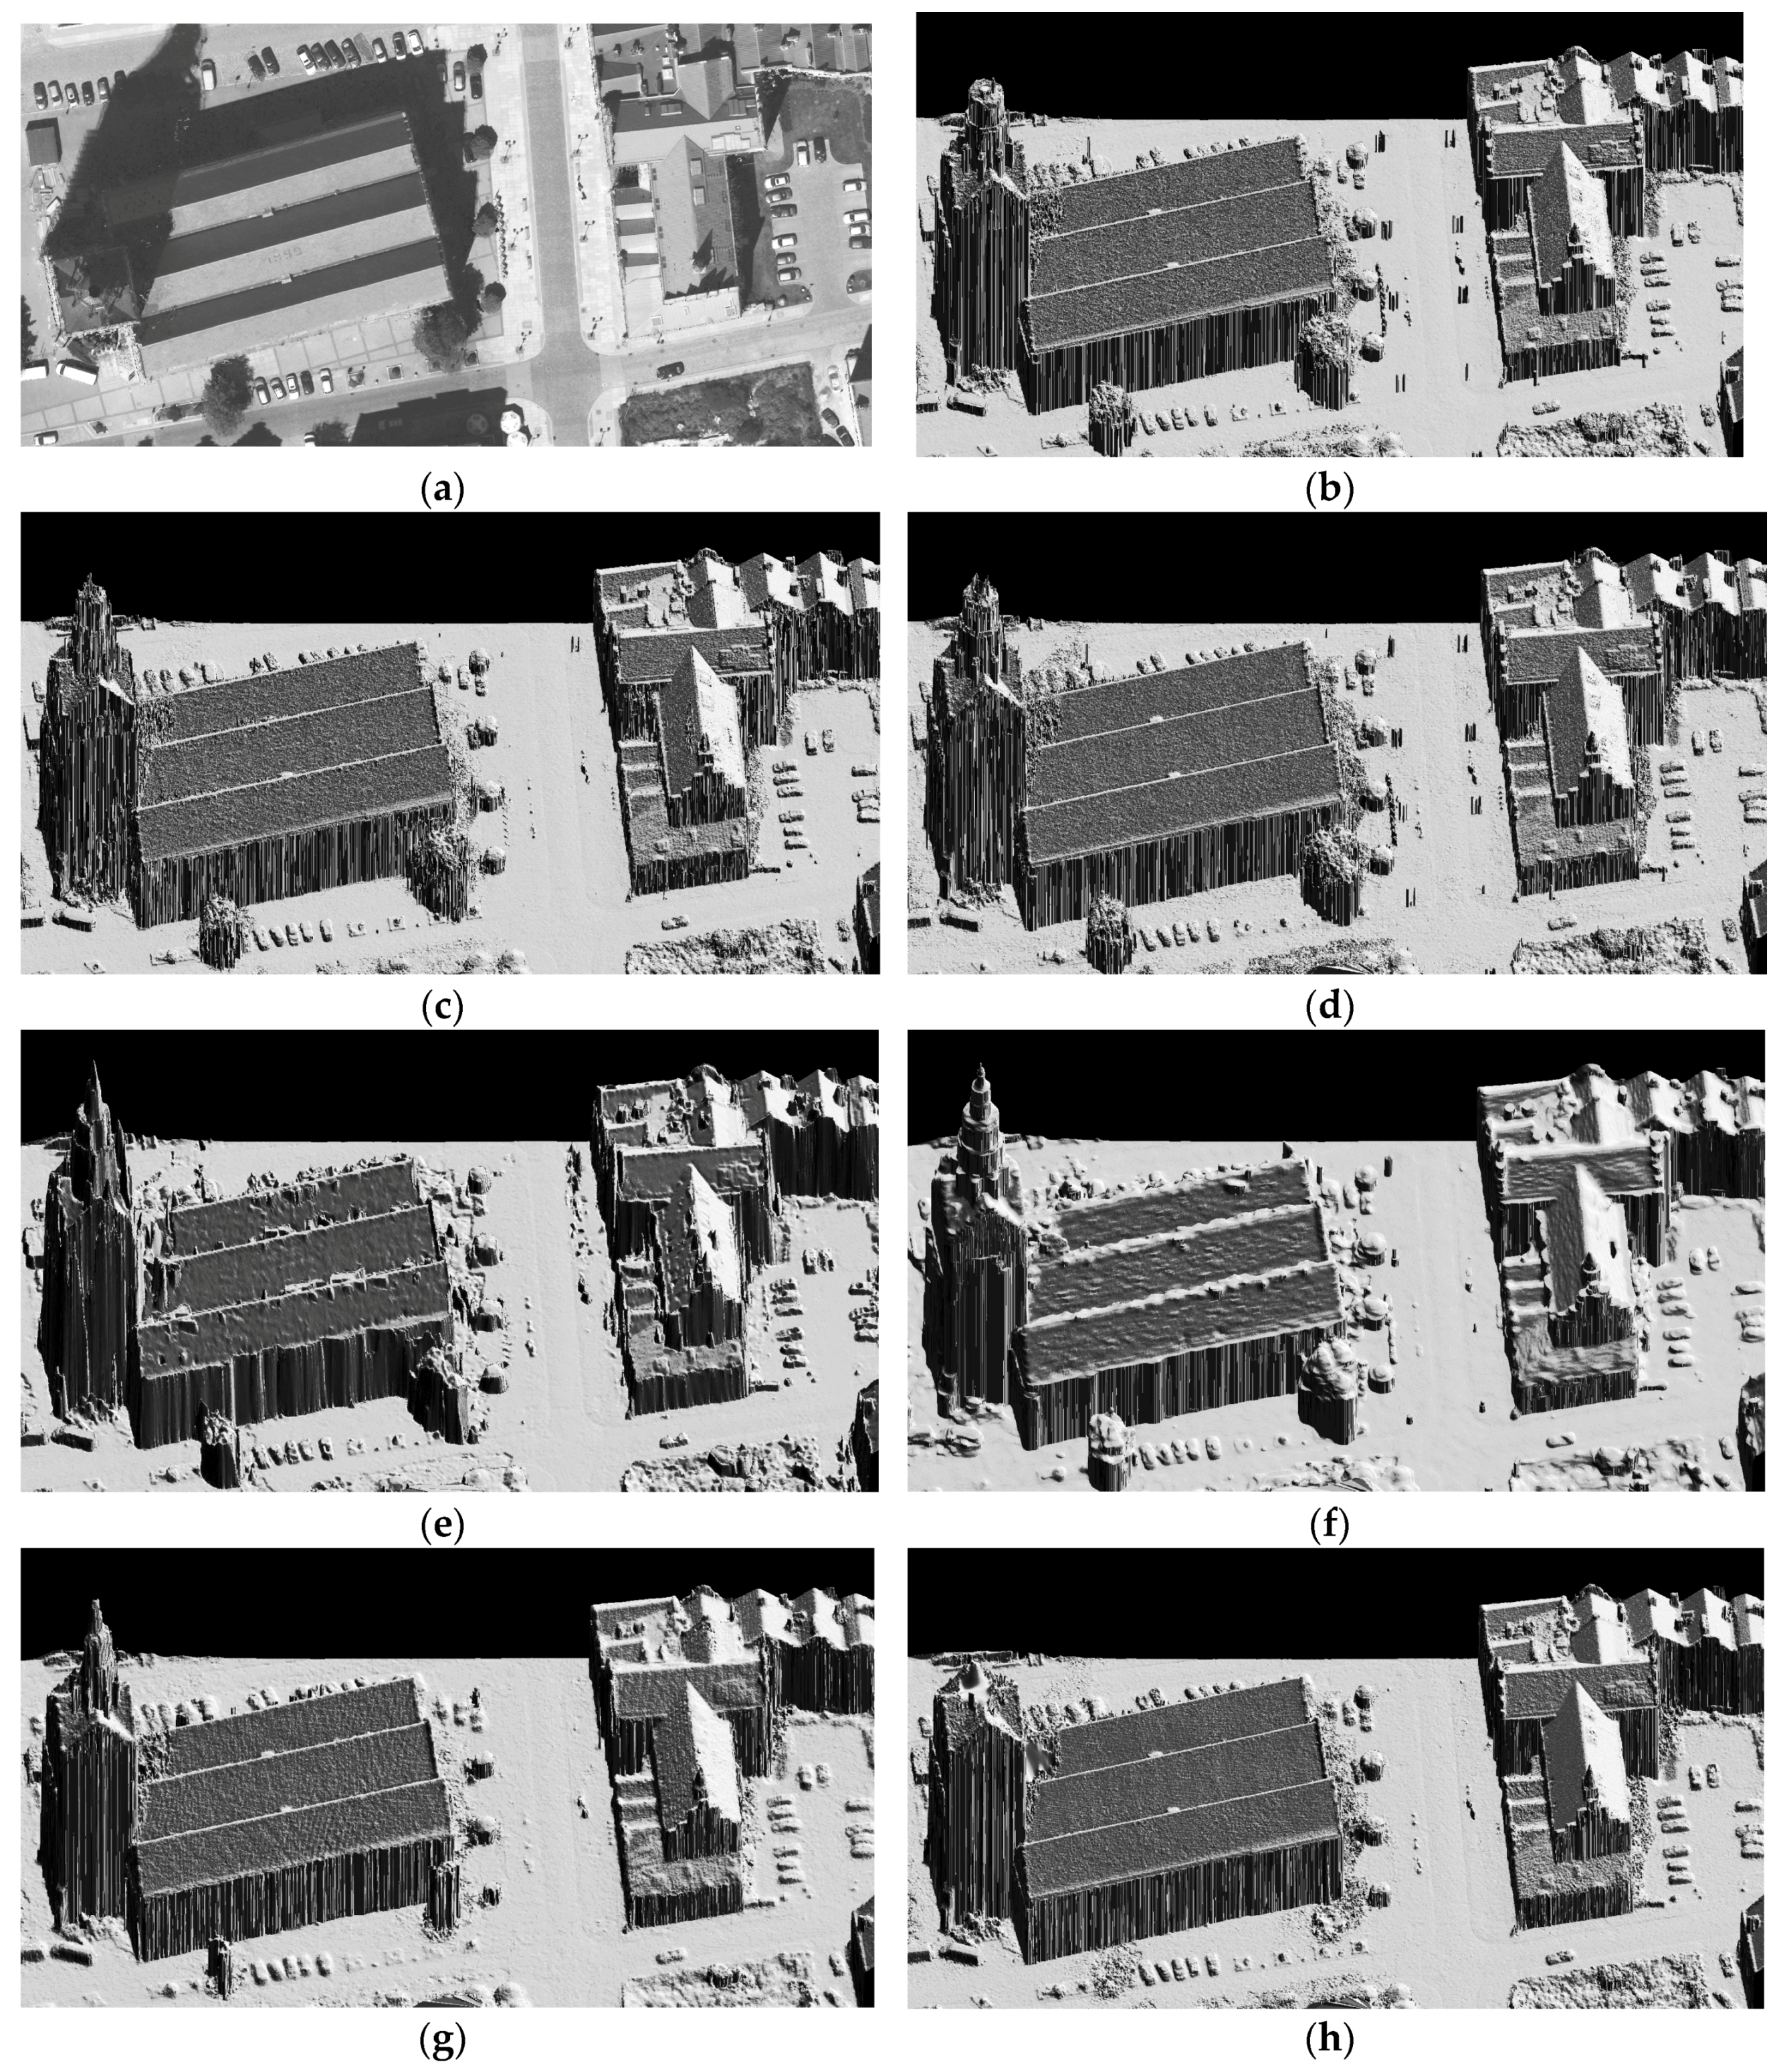
Figure 12.
Visual analysis of the shaded surface display for the Elbląg test field (5 cm GSD): (a) true orthophoto of the analyzed area; (b) proposed algorithm; (c) SURE, all stereo pairs; (d) SURE, lowest b/h ratio stereo pairs; (e) Match-t-DSM; (f) Pix4d; (g) Agisoft Photoscan, high mode; and (h) Agisoft Photoscan, ultrahigh mode.
The observation of shaded surface displays confirms the conclusion that in general SURE (Figure 12c,d) gives better results than the compared software. However some extremely difficult objects like the top of the cathedral in the Elbląg test field is reconstructed in a better way in the DSMs generated with the use of Match-t-DSM, Agisoft Photoscan and especially Pix4d (Figure 12e–g).
To compare the quality of the reconstructed surfaces for the Elbląg test field (Figure 12) one should pay attention to such features as street lanterns and other fine objects, sharpness of pavement edges, shape of the trees, smoothness of the paved areas and of shadowed surfaces, the planarity of building roofs or the sharpness of the roof edges. It can be seen that the surface generated with the use of the proposed algorithm (Figure 12b) is characterized by a high level of completeness (presence of fine objects like street lanterns), smoothness in flat areas and a good reconstruction of trees shape.
More evident differences can be observed in the case of Enzersdorf test field (Figure 11). Only the surface from Agisoft Photoscan in the mode ultrahigh (Figure 11h) is comparable to the results from SURE (Figure 11c,d) and the proposed algorithm (Figure 11b). However, the reconstruction of vegetation is significantly worse in Agisoft Photoscan (Figure 11g,h). It can be clearly seen that the proposed algorithm (Figure 11b) gives a much more smooth surface in bare ground and paved areas than the surface from SURE based on stereo pairs with lowest b/h ratio (Figure 11d). At the same time the reconstruction of vegetated areas is better than in the case of the surface from SURE based on all stereo pairs (Figure 11c) and is at least as good as in the case of the surface from SURE based on stereo pairs with lowest b/h ratio (Figure 11d). Sharper roof edges and roof ridges can be observed in the surface generated with the use of the proposed algorithm (Figure 11b).
3.3. Planarity Control of Flat Parts of the Terrain
An attempt of quantitative assessment of the results was carried out. It was decided to control the planarity of the model in parts of the terrain that can be assumed to be flat. Usually, such a control is carried out based on manually selected planar samples. However, such an approach is prone to subjectivity and the number of samples is limited. For this reason, an algorithm to automatically select the planar parts of the terrain was developed.
The Elbląg test field was divided into squares of 1 m2. It was empirically deduced that setting a threshold of 3 cm for the range of LiDAR points distances from the best fitting plane allows to select the samples representing flat parts of the terrain.
Because of the time difference in LiDAR and image data acquisition there might be situations where temporary objects are on the selected samples. Therefore additional criteria to sample selection have to be applied.
It was additionally imposed that none of the image based DSMs can have a range of distances from the best fitting plane larger than 10 cm to classify a given sample as flat. The combination of the above criteria allowed selecting a large part of the flat areas in the test field (Figure 13). For each of the compared DSMs, and for each of the selected samples, the standard deviation from the best fitting plane was computed. The means of the computed standard deviations for all compared data are presented in Table 1.
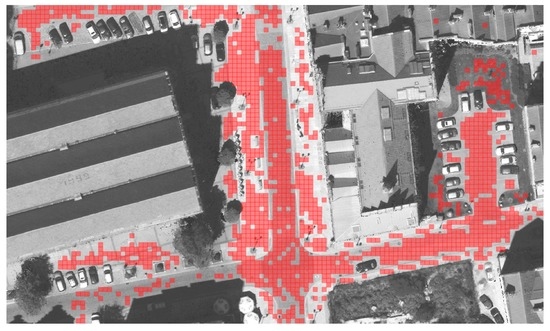
Figure 13.
Part of the selected samples (red squares) for the planarity control carried out for the Elbląg test field (5 cm GSD) shown on the true orthophoto.

Table 1.
Mean of the standard deviations from the best fitting planes for 3841 samples of 1 m2 representing flat parts of the terrain (Figure 13) over the Elbląg test field (5 cm GSD), computed for each of the compared DSMs.
As it can be seen in Table 1, the proposed algorithm allowed obtaining a DSM characterized by a superior planarity in flat areas than the majority of the compared image based models and even than the LiDAR data.
The presented planarity control cannot be a standalone DSM quality assessment method. It can be noticed that the best results in this regard are achieved by the DSM from Pix4d which have been subject to strong smoothing. However, when combined with the two above methods, the planarity control can complement the knowledge about the analyzed models and thus can enhance the overall quality assessment.
It can be noticed in Figure 13 that the imposed criteria did not allow selecting samples in shaded areas. The performance of image matching in shadows is significantly worse than in sunlit areas. This is due to the limited dynamic range of aerial cameras. The exposure time has to be set to not overexpose any part of the image. Consequently, the signal-to-noise ratio (SNR) in shaded areas is significantly lower than in sunlit areas. This makes image matching much more difficult and prone to errors.
To enable the assessment of the DSMs quality in shadows, criteria dedicated for flat sample selection in shaded areas were empirically deduced. It was imposed that the range of LiDAR points distances from the best fitting plane cannot exceed 3 cm, the median of the ranges of distances from the best fitting plane for all image based DSMs cannot exceed 25 cm and the maximum radiometric value of the true orthophoto cannot exceed 10 (unstretched 16-bit values were mapped to 8 bit in the course of true orthophoto generation by SURE). These criteria allowed selecting 165 samples in shaded areas (Figure 14). The same statistical analysis as in the previous case was carried out (Table 2).
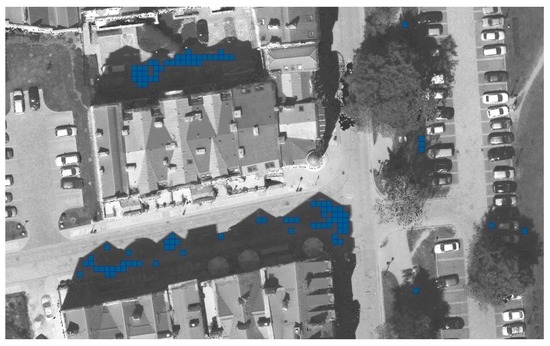
Figure 14.
Part of the selected samples (blue squares) for the planarity control in shaded areas carried out for the Elbląg test field (5 cm GSD) shown on the true orthophoto.
Table 2.
Mean of the standard deviations from the best fitting planes for 165 samples of 1 m2 representing flat parts of the terrain in shaded areas (Figure 14) over the Elbląg test field (5 cm GSD), computed for each of the compared DSMs.
The main remark regarding Table 2 is that the quality of image based DSM in shaded areas is worse than in sunlit areas by an order of magnitude. The best results in this evaluation were obtained by SURE with the use of all stereo pairs. Applying all stereo pairs and calculating the DSM elevation as the median of all elevation hypotheses allows obtaining a smoother surface, but does not preserve fine objects in the final DSM. Shadows are still a challenge for image based surface reconstruction. It should be emphasized that the prerequisite for the success in surface reconstruction is the quality of input aerial images. The presented work was carried out with the use of images acquired with the DMCII230 camera which is equipped with a CCD array. Recently the new DMCIII camera equipped with a CMOS array was released. According to the producer’s claims, although the pixel size is smaller (3.9 µm instead of 5.6 µm), the new camera offers a better image quality in shaded areas because of a significant increase in dynamic range. Evaluations involving the images from the new camera are necessary to be carried out in future to update the state of the art in this area.
4. Discussion
The presented results allow stating that the objectives of the proposed approach were achieved. The DSM obtained with the use of the developed algorithm combines the advantages of the compared models in different types of terrain cover. The proposed approach allows to obtain a smooth surface in bare ground areas, on building roofs and in paved surface areas (which is confirmed by the planarity control—Section 3.3). At the same time, satisfactory results were obtained in vegetated areas. For fine details and complex structures the quality of the obtained DSM is comparable with reference models showing the best performance in the reconstruction of such objects. An important characteristic of the DSM is the sharpness of object edges. It can be observed in the presented profiles (Section 3.2) that the DSM generated with the use of the proposed algorithm show a good quality in this area. A very important issue is that no significant outliers degrading the quality of the DSM have been observed (which is confirmed by the visual analysis of shaded surface display—Section 3.3). This allows assigning a high degree of reliability, which was claimed as one of the most important characteristic of the DSM (Section 1).
The comparison to the results obtained with the use of SURE are especially significant because the proposed algorithm is based on the input data derived by pairwise dense image matching implemented in this software. The aim was to prove that there is room for a better exploitation of the redundancy of point clouds generated from overlapping stereo pairs. The comparison to the results coming from other software packages was aimed at showing that the indicated difficulties of aerial image based surface reconstruction are not specific to the methods implemented in SURE. The presented results show that the current state of the art in image based DSM generation still has lots of room for improvement and certainly does not fully exploit the potential of highly overlapping aerial images for DSM generation.
A drawback of the proposed workflow is the extended computational effort required because dense image matching for all available stereo pairs needs to be carried out. However, in the opinion of the author, this limitation should not discourage from developing new algorithms aiming at fully exploiting the potential of dense image matching for DSM generation. The trends in the development of computational resources allow being confident that processes that are difficult to be carried out at a large scale (e.g., countrywide) will not pose a problem in the future.
Another issue is that the proposed approach is dedicated for the 2.5D form of the output DSM. The limitations of such form of the DSM are visible especially in the Elbląg test field. The 2.5D form does not allow representing the real shape of complex objects (e.g., street lanterns). The form of the DSM is an issue to discuss. The 2.5D form is a compromise between the fidelity of the model and the ease to handle and seems to be optimal for the current state of the art in spatial analysis.
The presented comparison of the DSMs revealed that pixelwise dense image matching has limitations concerning the reconstruction of very fine objects. An extreme example is the top of the cathedral in the Elbląg test field (Figure 12). The compared software packages (Match-t-DSM, Pix4d, and Agisoft Photoscan) that make use of some sort of feature based matching methods performed better in this case. The enhancement of the pixelwise matching by the feature based matching seems to be unavoidable to allow the full surface reconstruction including fine structures.
Despite the drawbacks, the author believes that the application of the proposed algorithm can bring some advantages and that it is beneficial for the overall quality of the produced DSM.
5. Conclusions
The aim of this work was to develop an algorithm that would enable a better exploitation of the redundancy of overlapping stereo pairs in the process of aerial image based digital surface model (DSM) generation. The input data for the DSM calculation consist of results of pairwise dense image matching for each stereo combination of images. The presented approach involves introducing additional factors to the process of selection of elevation hypotheses derived from different stereo pairs, which are then used to the calculation of the final elevation of the DSM. The idea was to take into account aspects related to the terrain cover characteristics and stereo pair geometry. According to this thought, the process of calculation of the DSM elevation was set to be dependent on the distribution of elevation hypotheses from different stereo pairs and the base-to-height (b/h) ratio of stereo pairs. Such an approach gives the possibility to exploit the advantages of large b/h ratios (high accuracy) together with low b/h ratios (better surface reconstruction in vegetated areas and for complex structures) in a single process.
The developed algorithm was used to generate the DSM based on two sets of aerial images having significantly different acquisition parameters. The efficiency of the proposed algorithm was investigated by the comparison of the obtained DSM to the results from commonly used software packages. Visual assessment as well as the planarity control of flat parts of the model showed that the application of the proposed algorithm can bring some advantages and it can contribute to improving the quality of the DSM.
The presented study demonstrated that the redundancy of overlapping stereo pairs has potential. There is room for developing methods of exploiting this potential for optimizing the surface reconstruction based on dense image matching.
It is believed that the presented work can contribute to highlight the issue of the transformation of dense image matching based point clouds to 2.5D DSM. While point clouds are a product perfectly suitable for visualization purposes, applications related to spatial analysis require unambiguous information about the elevation of the terrain cover at a given place. This is why the transition from point clouds to DSM is an important element of the workflow and efforts should be made to extract the proper information about terrain and objects’ elevation from the point clouds.
The paper aimed at proposing one of the possible solutions for dealing with the redundancy caused by overlapping aerial images which could constitute a suggestion for further development and for the implementation of more efficient tools in the software for aerial image based DSM generation.
Exploitation of the redundancy of overlapping images is, in the opinion of the author, one of the important directions for development in the area of automatic data extraction from aerial images. Future work should consider further exploration of the potential of high image overlaps by looking for additional factors and dependencies allowing to take advantage of this redundancy in the process of aerial image based DSM generation.
Acknowledgments
This publication was financed by the Faculty of Geodesy and Cartography, Warsaw University of Technology. All data used in the study were acquired by OPEGIEKA Sp. Z. o. o., Poland.
Conflicts of Interest
The author declares no conflict of interest.
References
- Nebiker, S.; Lack, N.; Deuber, M. Building change detection from historical aerial photographs using dense image matching and object-based image analysis. Remote Sens. 2014, 6, 8310–8336. [Google Scholar] [CrossRef]
- Holland, D.; Gladstone, C.; Sargent, I.; Horgan, J.; Gardiner, A.; Freeman, M. Automating the photogrammetric workflow in a national mapping agency. ISPRS Ann. Photogramm. Remote Sens. Spat. Inf. Sci. 2012, 1, 83–88. [Google Scholar] [CrossRef]
- Agugiaro, G.; Nex, F.; Remondino, F.; de Filippi, R.; Droghetti, S.; Furlanello, C. Solar radiation estimation on building roofs and web-based solar cadastre. ISPRS Ann. Photogramm. Remote Sens. Spat. Inf. Sci. 2012, 1, 177–182. [Google Scholar] [CrossRef]
- Tooke, T.R.; Coops, N.C.; Voogt, J.A. Assessment of urban tree shade using fused lidar and high spatial resolution imagery. In Proceedings of the 2009 IEEE Joint Urban Remote Sensing Event, Shanghai, China, 20–22 May 2009; pp. 1–6. [Google Scholar]
- Tolt, G.; Shimoni, M.; Ahlberg, J. A shadow detection method for remote sensing images using vhr hyperspectral and lidar data. In Proceedings of the IEEE Geoscience and Remote Sensing Symposium, Vancouver, BC, Canada, 24–29 July 2011; pp. 4423–4426. [Google Scholar]
- Guerin, C.; Binet, R.; Pierrot-Deseilligny, M. Automatic detection of elevation changes by differential dsm analysis: Application to urban areas. IEEE J. Sel. Top. Appl. Earth Obs. Remote Sens. 2014, 7, 4020–4037. [Google Scholar] [CrossRef]
- Stal, C.; Tack, F.; de Maeyer, P.; de Wulf, A.; Goossens, R. Airborne photogrammetry and lidar for dsm extraction and 3D change detection over an urban area—A comparative study. Int. J. Remote Sens. 2013, 34, 1087–1110. [Google Scholar] [CrossRef]
- Czynska, K. Application of lidar data and 3D-city models in visual impact simulations of tall buildings. Int. Arch. Photogramm. Remote Sens. Spat. Inf. Sci. 2015, 40, 1359. [Google Scholar] [CrossRef]
- Li, J.; Taylor, G.; Kidner, D.; Ware, M. Prediction and visualization of gps multipath signals in urban areas using lidar digital surface models and building footprints. Int. J. Geogr. Inf. Sci. 2008, 22, 1197–1218. [Google Scholar] [CrossRef]
- Oshima, T.; Imano, M.; Hiraguri, Y.; Kamoshida, Y. Linearized euler simulations of sound propagation with wind effects over a reconstructed urban terrain using digital geographic information. Appl. Acoust. 2013, 74, 1354–1366. [Google Scholar] [CrossRef]
- Villanueva, J.K.S.; Ang, M.R.C.O.; Inocencio, L.C.V.; Rejuso, M.V.D.; Tolentino, J.T. Urban wind flow simulation of lidar-extracted building geometry in up diliman, quezon city, philippines using computational fluid dynamics model. In Proceedings of the 36rd Asian Conference on Remote Sensing, Quezon, Philippines, 19–23 October 2015. [Google Scholar]
- Mills, S.J.; Castro, M.P.G.; Li, Z.; Cai, J.; Hayward, R.; Mejias, L.; Walker, R.A. Evaluation of aerial remote sensing techniques for vegetation management in power-line corridors. IEEE Trans. Geosci. Remote Sens. 2010, 48, 3379–3390. [Google Scholar] [CrossRef]
- Chmielewski, S.; Lee, D. Gis-based 3d visibility modeling of outdoor advertising in urban areas. In Proceedings of the 15th SGEM GeoConference on Informatics, Geoinformatics and Remote Sensing, Flamingo Grand Congress Center, Albena, Bulgaria, 16–25 June 2015; pp. 923–930. [Google Scholar]
- Ressl, C.; Brockmann, H.; Mandlburger, G.; Pfeifer, N. Dense image matching vs. Airborne laser scanning–comparison of two methods for deriving terrain models. Photogramm. Fernerkund. 2016, 2016, 57–73. [Google Scholar] [CrossRef]
- Gladstone, C.; Gardiner, A.; Holland, D. A semi-automatic method for detecting changes to ordnance survey topographic data in rural environments. In Proceedings of the 4th International Conference on GEographic Object Based Image Analysis, Rio de Janeiro, Brazil, 7–9 May 2012; 2012; pp. 7–9. [Google Scholar]
- Geoportal Cuzk. Available online: http://geoportal.cuzk.cz (accessed on 19 February 2017).
- Ginzler, C.; Hobi, M.L. Countrywide stereo-image matching for updating digital surface models in the framework of the swiss national forest inventory. Remote Sens. 2015, 7, 4343–4370. [Google Scholar] [CrossRef]
- Scharstein, D.; Szeliski, R. A taxonomy and evaluation of dense two-frame stereo correspondence algorithms. Int. J. Comput. Vis. 2002, 47, 7–42. [Google Scholar] [CrossRef]
- Szeliski, R. Computer Vision: Algorithms and Applications; Springer Science & Business Media: New York, NY, USA, 2010. [Google Scholar]
- Hirschmuller, H. Accurate and efficient stereo processing by semi-global matching and mutual information. In Proceedings of the 2005 IEEE Computer Society Conference on Computer Vision and Pattern Recognition, Washington, DC, USA, 20–25 June 2005; pp. 807–814. [Google Scholar]
- Hirschmuller, H. Stereo processing by semiglobal matching and mutual information. IEEE Trans. Pattern Anal. Mach. Intell. 2008, 30, 328–341. [Google Scholar] [CrossRef] [PubMed]
- Hirschmüller, H.; Bucher, T. Evaluation of Digital Surface Models by Semi-Global Matching. Available online: http://elib.dlr.de/66923/ (accessed on 10 May 2017).
- Rothermel, M.; Haala, N. Potential of dense matching for the generation of high quality digital elevation models. In Proceedings of the ISPRS Hannover Workshop 2011 High-Resoultion Earth Imaging for Geospatial Information, Hannover, Germany, 14–17 June 2011; pp. 331–343. [Google Scholar]
- Haala, N.; Rothermel, M. Dense multi-stereo matching for high quality digital elevation models. Photogramm. Fernerkund. 2012, 2012, 331–343. [Google Scholar] [CrossRef]
- Dominik, W. Porównanie właściwości chmury punktów wygenerowanej metodą dopasowania obrazów zdjęć lotniczych z danymi z lotniczego skanowania laserowego. AFKIT 2014, 26, 53–56. [Google Scholar]
- Haala, N. Dense Image Matching; Final Report; EuroSDR Publication Series; Official Publication; Buchdruckerei Ernst Becvar: Vienna, Austria, 2014; pp. 115–145. [Google Scholar]
- Haala, N. The landscape of dense image matching algorithms. In Proceedings of the 54th Photogrammetric Week, Stuttgart, Germany, 9–13 September 2013; pp. 271–284. [Google Scholar]
- Wenzel, K.; Rothermel, M.; Fritsch, D.; Haala, N. Image acquisition and model selection for multi-view stereo. Int. Arch. Photogramm. Remote Sens. Spat. Inf. Sci. 2013, 40, 251–258. [Google Scholar] [CrossRef]
- Shen, S. Depth-map merging for multi-view stereo with high resolution images. In Proceedings of the 21st IEEE International Conference on Pattern Recognition, Chengdu, China, 5–7 November 2012; pp. 788–791. [Google Scholar]
- Shen, S.; Hu, Z. How to select good neighboring images in depth-map merging based 3D modeling. IEEE Trans. Image Process. 2014, 23, 308–318. [Google Scholar] [CrossRef] [PubMed]
- Bethmann, F.; Luhmann, T. Semi-global matching in object space. Int. Arch. Photogram. Rem. Sens. Spat. Inf. Sci. 2015, 40, 23. [Google Scholar] [CrossRef]
- Vogiatzis, G.; Esteban, C.H.; Torr, P.H.; Cipolla, R. Multiview stereo via volumetric graph-cuts and occlusion robust photo-consistency. IEEE Trans. Pattern Anal. Mach. Intell. 2007, 29, 2241–2246. [Google Scholar] [CrossRef] [PubMed]
- Collins, R.T. A space-sweep approach to true multi-image matching. In Proceedings of the IEEE Computer Society Conference on Computer Vision and Pattern Recognition, Washington, DC, USA, 18–20 June 1996; pp. 358–363. [Google Scholar]
- Irschara, A.; Rumpler, M.; Meixner, P.; Pock, T.; Bischof, H. Efficient and globally optimal multi view dense matching for aerial images. ISPRS Ann. Photogramm. Remote Sens. Spat. Inf. Sci. 2012, I-3, 227–232. [Google Scholar] [CrossRef]
- Rumpler, M.; Wendel, A.; Bischof, H. Probabilistic range image integration for dsm and true-orthophoto generation. In Proceedings of the Scandinavian Conference on Image Analysis, Copenhagen, Denmark, 15–17 June 2013; Springer: Berlin/Heidelberg, Germany, 2013; pp. 533–544. [Google Scholar]
- Rothermel, M.; Wenzel, K.; Fritsch, D.; Haala, N. Sure: Photogrammetric surface reconstruction from imagery. In Proceedings of the LC3D Workshop, Berlin, Germany, 1–31 December 2012. [Google Scholar]
- Rumpler, M.; Irschara, A.; Bischof, H. Multi-view stereo: Redundancy benefits for 3D reconstruction. In Proceedings of the 35th Workshop of the Austrian Association for Pattern Recognition, Graz, Austria, 26–27 May 2011. [Google Scholar]
- Tola, E.; Strecha, C.; Fua, P. Efficient large-scale multi-view stereo for ultra high-resolution image sets. Mach. Vis. Appl. 2012, 1–18. [Google Scholar] [CrossRef]
- Lemaire, C. Aspects of the dsm production with high resolution images. Int. Arch. Photogramm. Remote Sens. Spat. Inf. Sci. 2008, 37, 1143–1146. [Google Scholar]
- Rothermel, M.; Haala, N.; Fritsch, D. Generating oriented pointsets from redundant depth maps using restricted quadtrees. Int. Arch. Photogramm. Remote Sens. Spat. Inf. Sci. 2014, 40, 281. [Google Scholar] [CrossRef]
- Rothermel, M.; Haala, N.; Fritsch, D. A median-based depthmap fusion strategy for the generation of oriented points. ISPRS Ann. Photogramm. Remote Sens. Spat. Inf. Sci. 2016, III-3, 115–122. [Google Scholar] [CrossRef]
- Gülch, E. Advanced matching techniques for high precision surface and terrain models. In Proceedings of the 52nd Photogrammetric Week, Stuttgart, Germany, 7–11 September 2009; pp. 303–315. [Google Scholar]
- Dominik, W. Selection of optimal strategy for dsm generation from multi-view dense image matching. In Proceedings of the 15th SGEM GeoConference on Informatics, Geoinformatics and Remote Sensing, Albena, Bulgaria, 16–25 June 2015; pp. 1127–1134. [Google Scholar]
- Leberl, F.; Gruber, M.; Ponticelli, M.; Wiechert, A. The ultracam story. Int. Arch. Photogramm. Remote Sens. Spat. Inf. Sci 2012, 39, 39–44. [Google Scholar] [CrossRef]
- Dominik, W. Assessment of the influence of aerial image radiometry on the quality of point clouds generated by semi-global matching. In Proceedings of the 14th SGEM GeoConference on Informatics, Geoinformatics and Remote Sensing, Albena Resort, Bulgaria, 17–26 June 2014; pp. 43–54. [Google Scholar]
- D’Angelo, P. Image matching and outlier removal for large scale dsm generation. In Proceedings of the Geomatics Conference and Symposium of Commission I, ISPRS Convergence in Geomatics (CGC & ISPRS), Calgary, AB, Canada, 15–18 June 2010; pp. 1–5. [Google Scholar]
- Szeliski, R.; Zabih, R. An experimental comparison of stereo algorithms. In Proceedings of the International Workshop on Vision Algorithms, Corfu, Greece, 21–22 September 1999. [Google Scholar]
- Kolmogorov, V.; Zabih, R. Computing visual correspondence with occlusions using graph cuts. In Proceedings of the International Conference on Computer Vision, Vancouver, BC, Canada, 7–14 July 2001; pp. 508–515. [Google Scholar]
- Strecha, C.; Fransens, R.; van Gool, L. Combined depth and outlier estimation in multi-view stereo. In Proceedings of the IEEE Conference on Computer Society Conference on Computer Vision and Pattern Recognition, New York, NY, USA, 17–23 June 2006; pp. 2394–2401. [Google Scholar]
- Strecha, C.; Fletcher, A.; Lechner, A.; Erskine, P.; Fua, P. Developing species specific vegetation maps using multi-spectral hyperspatial imagery from unmanned aerial vehicles. ISPRS Ann. Photogramm. Remote Sens. Spat. Inf. Sci 2012, 3, 311–316. [Google Scholar] [CrossRef]
- Lowe, D.G. Distinctive image features from scale-invariant keypoints. Int. J. Comput. Vis. 2004, 60, 91–110. [Google Scholar] [CrossRef]
- Strecha, C.; Bronstein, A.; Bronstein, M.; Fua, P. Ldahash: Improved matching with smaller descriptors. IEEE Trans. Pattern Anal. Mach. Intell. 2012, 34, 66–78. [Google Scholar] [CrossRef] [PubMed]
- Remondino, F.; Spera, M.G.; Nocerino, E.; Menna, F.; Nex, F. State of the art in high density image matching. Photogramm. Rec. 2014, 29, 144–166. [Google Scholar] [CrossRef]


© 2017 by the author. Licensee MDPI, Basel, Switzerland. This article is an open access article distributed under the terms and conditions of the Creative Commons Attribution (CC BY) license (http://creativecommons.org/licenses/by/4.0/).