Hyperspectral Imaging: A Review on UAV-Based Sensors, Data Processing and Applications for Agriculture and Forestry

 ,
,  ,
,  ,
,  and
and
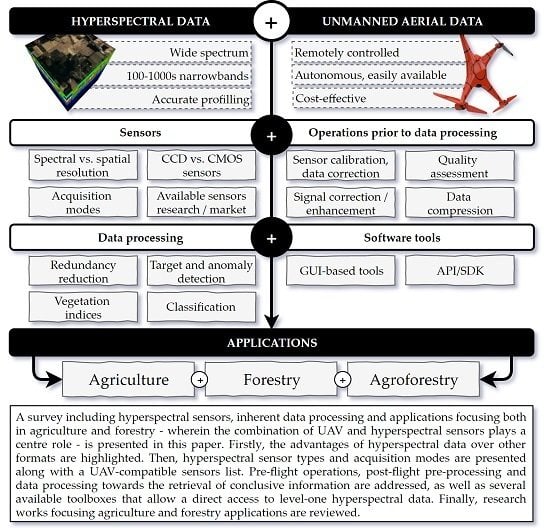
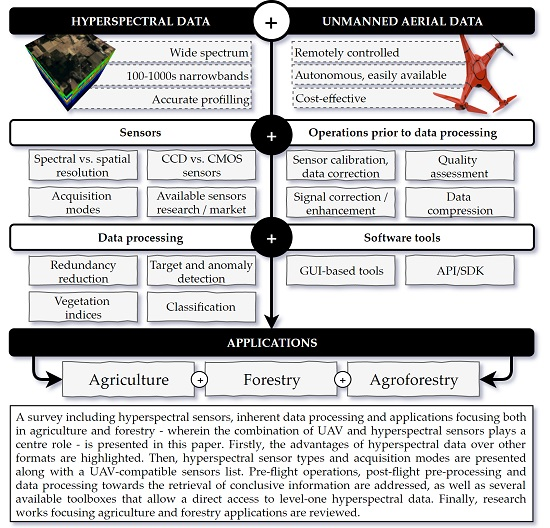
Abstract
1. Introduction
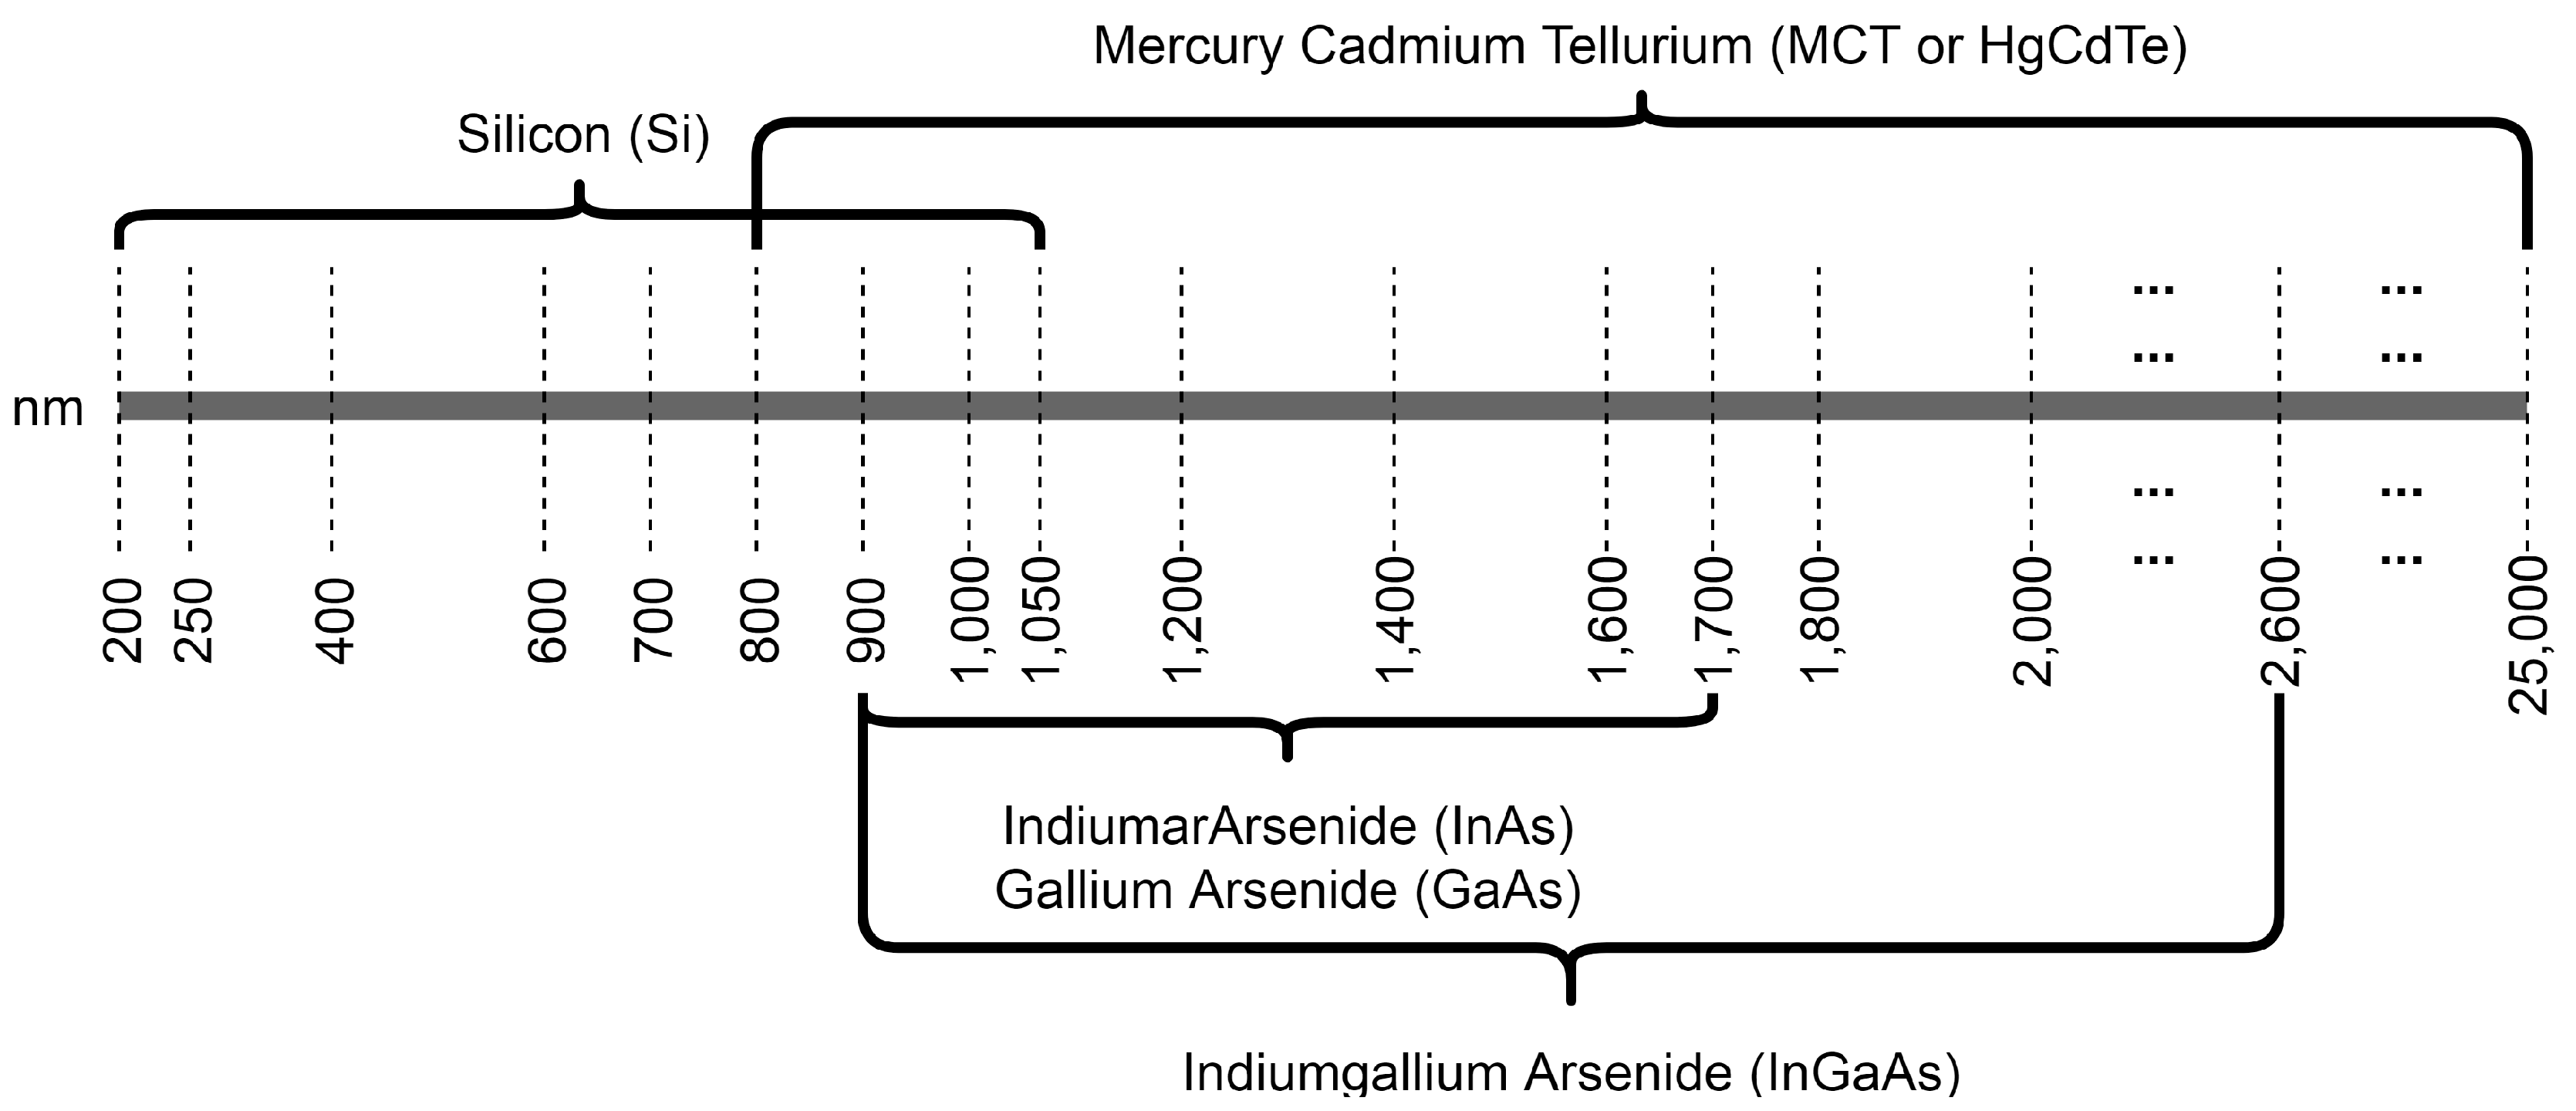
2. Hyperspectral Sensors
3. Operations Prior to Flight and Post-Acquisition Data Pre-Processing
4. Data Processing and Analysis
4.1. Dimension Reduction
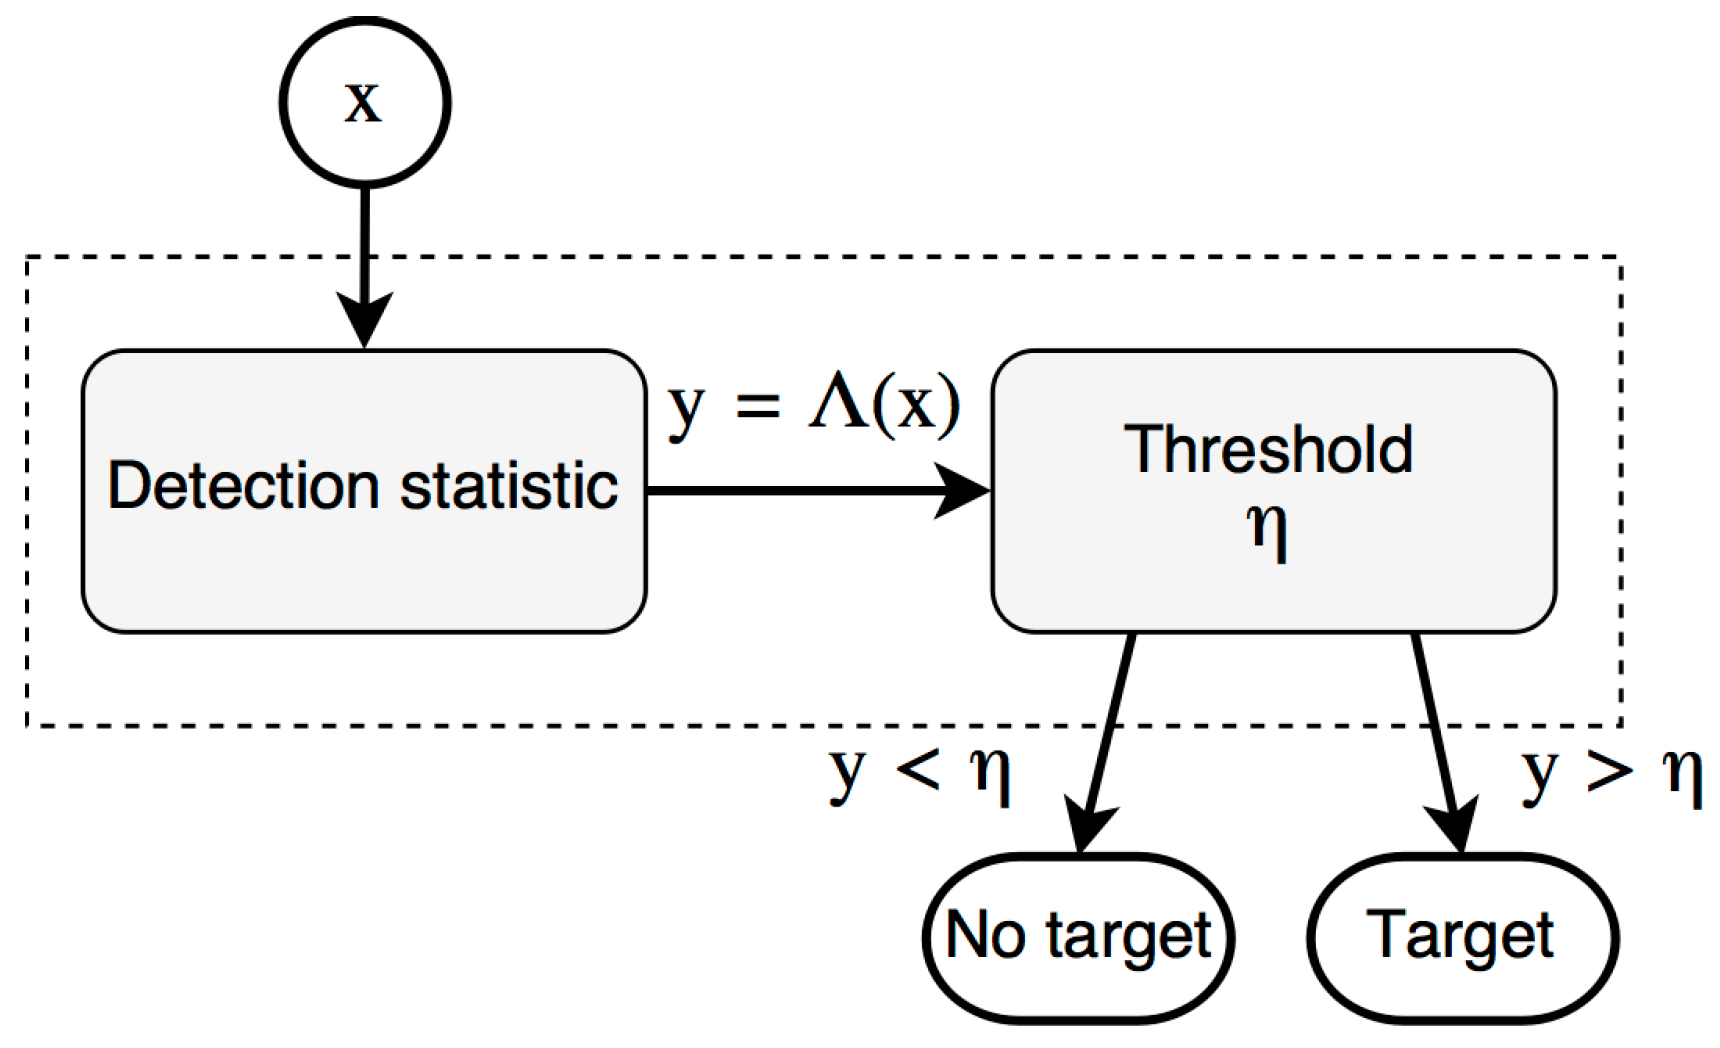
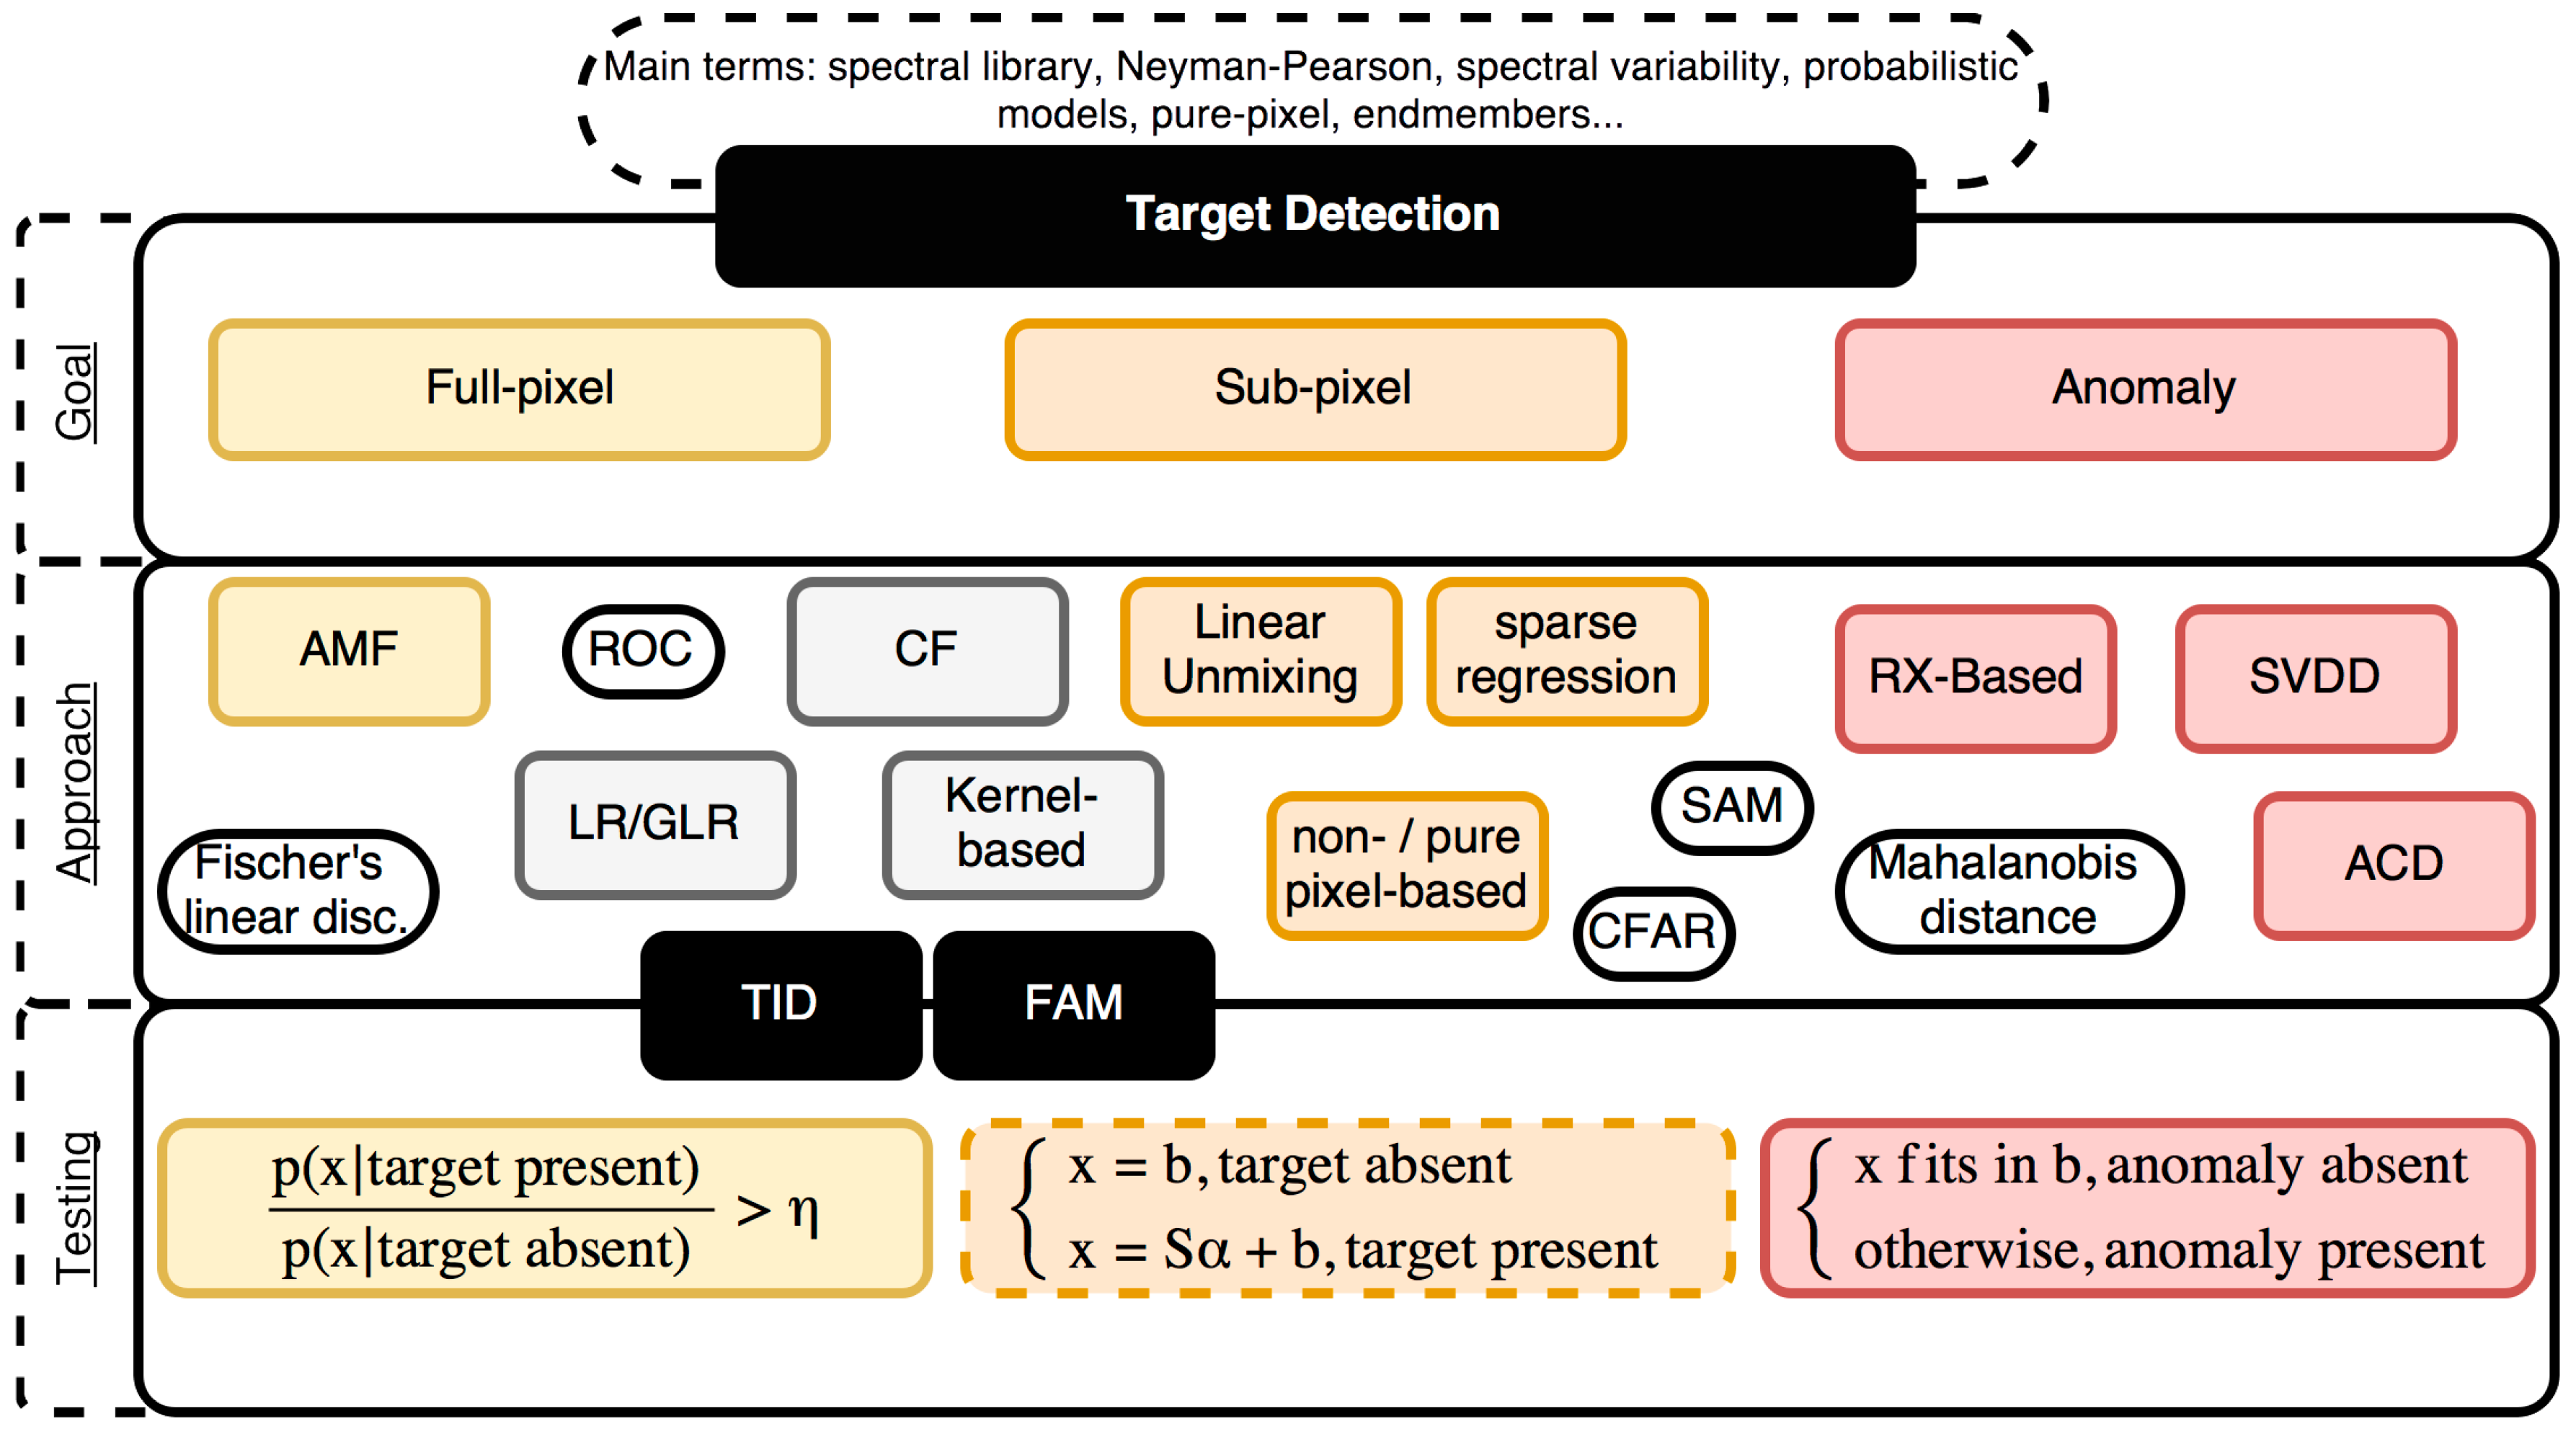
4.2. Target and Anomaly Detection
- geometrically: uses a subspace of the spectra in which the matrix defining the variability of the subspace can be a spectra signatures library (on data or even vectors), obtained from statistical techniques;
- statistically: spectral variability is described accordingly with probability distribution models. Calculus such as mean vector and covariance matrix are applied in different moments under a multivariate normal distribution assumption. Thus, variability can be measured from a uniform distribution of the data space.
- Probability Density Models: this kind of models consist in a scatter set of the reflectance values for a range of spectral bands that aims to identify different spectral classes in a scene using clustering algorithms (e.g., k-means) and classification methods (e.g., color attribution);
- Subspace models: are applied to analyze the variability within an M-dimensional band space, from a K-dimensional set, where M < K. PCA is one of the approaches within this probabilistic model;
- Linear spectral mixing models: are used to estimate the composition of the image’s pixels in those cases wherein there are pixels composed of a small number of unique spectral signatures corresponding to different components (endmembers).
4.2.1. Full Pixel Detection
4.2.2. Subpixel Target Detection
4.3. Other Classification Methods
4.4. Vegetation Indices
5. Software and Libraries for Dealing with Hyperspectral Data
6. Applications in Agriculture and Forestry Areas
6.1. Agriculture
6.2. Forestry
6.3. Agroforestry
7. Conclusions
Acknowledgments
Author Contributions
Conflicts of Interest
Appendix A
| ACD | Anomalous Change Detection |
| AIS | Airborne Imaging Spectrometer |
| AMF | Adaptive Matched Filters |
| API | Application Programming Interface |
| AVIRIS | Airborne Visible/Infrared Imaging Spectrometer |
| BBA | Bundle Block Adjustment |
| BIL | Band-Interleaved-by-Line |
| BIP | Band-Interleaved-by-Pixel |
| BSQ | Band Sequential |
| CARI | Chlorophyll Absorption Ratio Index |
| CCD | Charge-Coupled Device |
| CF | Continuum Fusion |
| CFAR | Constant False Alarm Rate |
| CMOS | Complementary Metal-Oxide-Semiconductor |
| CNN | Convolutional Neural Networks |
| DAFE | Decision Boundary Feature Matrix |
| DBFE | Decision Boundary Feature Extraction |
| DL | Deep Learning |
| DN | Digital Numbers |
| DSM | Digital Surface Model |
| ENVI | ENvironment for Visualizing Images |
| ERDAS | Earth Resource Data Analysis System |
| ESWIR | Early Short-Wave InfraRed |
| FAM | False Alarm Mitigation |
| FLD | Fraunhofer Line Depth |
| FNIR | Far Near InfraRed |
| FPI | Fabry-Perot Interferometer |
| FSWIR | Far Short-Wave InfraRed |
| FWHM | Full Width At Half Maximum |
| GaAs | Gallium Arsenide |
| GCP | Ground Control Point |
| GI | Greenness Index |
| GI | Greenness Index |
| GLR | Generalized Likelihood Ratio |
| GLRT | Generalized Likelihood Ratio Test |
| GNSS | Global Navigation Satellite Systems |
| GPL | General Public License |
| GPS | Global Positioning System |
| GVI | Greenness Vegetation Index |
| HIAT | Hyperspectral Image Analysis Toolbox |
| HSI | Hyperspectral Imaging |
| H-SSC | Hydrological Soil Surface Characteristics |
| HypPy | Hyperspectral Python |
| ICA | Independent Component Analysis |
| IMU | Inertial Measurement Unit |
| InAs | Indium Arsenide |
| InGaAs | Indium Gallium Arsenide |
| INS | Inertial Navigation Systems |
| k-NN | k-Nearest Neighbor |
| LIDAR | LIght Detection And Ranging |
| LMM | Linear Mixed Models |
| LR | Likelihood Ratio |
| MCARI | Modified Chlorophyll Absorption Ratio Index |
| MCR | Multivariate Curve Resolution |
| MCT, HgCdTe | Mercury Cadmium Tellurium |
| mNDVI | Modified Normalized Difference Vegetation Index |
| MNF | Maximum Noise Fraction |
| MSAVI | Modified Soil-Adjusted Vegetation Index |
| MVSR | Modified Vegetation Stress Ratio |
| NASA/JPL | National Aeronautics and Space Administration Jet Propulsion Laboratory |
| NDVI | Normalized Difference Vegetation Index |
| NIR | Near InfraRed |
| NPCI | Normalized Pigment Chlorophyll Index |
| OSAVI | Optimized Soil-Adjusted Vegetation Index |
| PCA | Principal Component Analysis |
| Pd | Probability of detection |
| Pfa | Probability of false alarm |
| PRI | Photochemical Reflectance Index |
| RADAR | RAdio Detection/Direction And Ranging |
| RBF | Radial Basis Function |
| RDI | Regulated Deficit Irrigation |
| RE | Red-Edge |
| RGB | Red Green Blue |
| ROC | Receiving Operating Characteristic |
| RTT | Radiative Transfer Theory |
| RX | Reed-Xiaoli |
| SAM | Spectral Angle Mapper |
| Si | Silicon |
| SMARTS | Simple Model Of The Atmospheric Radiative Transfer Of Sunshine |
| SNR | Signal-To-Noise Ratio |
| SPy | Spectral Python |
| SR | Simple Ratio |
| SRPI | Simple Ratio Pigment Index |
| SVDD | Support Vector Data Description |
| SVM | Support Vector Machines |
| TCARI | Transformed Chlorophyll Absorption Ratio Index |
| THOR | Tactical Hyperspectral Operations Resource |
| THz | submillimeter radiation |
| TID | Target IDentification |
| TSVM | Transductive Support Vector Machines |
| TVI | Triangular Vegetation Index |
| UAS | Unmanned Aircraft Systems |
| UASI | Unmanned Aerial System Innovations |
| UAV | Unmanned Aerial Vehicle |
| UV-Vis | Ultraviolet-Visible |
| VI | Vegetation Index |
| VNIR | Visible and Near-Infrared |
References
- Pádua, L.; Vanko, J.; Hruška, J.; Adão, T.; Sousa, J.J.; Peres, E.; Morais, R. UAS, sensors, and data processing in agroforestry: A review towards practical applications. Int. J. Remote Sens. 2017, 38, 2349–2391. [Google Scholar] [CrossRef]
- Park, S.; Nolan, A.; Ryu, D.; Fuentes, S.; Hernandez, E.; Chung, H.; O’Connell, M. Estimation of crop water stress in a nectarine orchard using high-resolution imagery from unmanned aerial vehicle (UAV). In Proceedings of the 21st International Congress on Modelling and Simulation, Gold Coast, Australia, 29 November–4 December 2015; pp. 1413–1419. [Google Scholar]
- Primicerio, J.; Gennaro, S.F. D.; Fiorillo, E.; Genesio, L.; Lugato, E.; Matese, A.; Vaccari, F.P. A flexible unmanned aerial vehicle for precision agriculture. Precis. Agric. 2012, 13, 517–523. [Google Scholar] [CrossRef]
- Bendig, J.; Yu, K.; Aasen, H.; Bolten, A.; Bennertz, S.; Broscheit, J.; Gnyp, M.L.; Bareth, G. Combining UAV-based plant height from crop surface models, visible, and near infrared vegetation indices for biomass monitoring in barley. Int. J. Appl. Earth Obs. Geoinf. 2015, 39, 79–87. [Google Scholar] [CrossRef]
- Calderón, R.; Navas-Cortés, J.A.; Zarco-Tejada, P.J. Early Detection and Quantification of Verticillium Wilt in Olive Using Hyperspectral and Thermal Imagery over Large Areas. Remote Sens. 2015, 7, 5584–5610. [Google Scholar] [CrossRef]
- Getzin, S.; Wiegand, K.; Schöning, I. Assessing biodiversity in forests using very high-resolution images and unmanned aerial vehicles. Methods Ecol. Evol. 2012, 3, 397–404. [Google Scholar] [CrossRef]
- Merino, L.; Caballero, F.; Martínez-de-Dios, J.R.; Maza, I.; Ollero, A. An Unmanned Aircraft System for Automatic Forest Fire Monitoring and Measurement. J. Intell. Robot. Syst. 2012, 65, 533–548. [Google Scholar] [CrossRef]
- Smigaj, M.; Gaulton, R.; Barr, S.L.; Suárez, J.C. Uav-Borne Thermal Imaging for Forest Health Monitoring: Detection of Disease-Induced Canopy Temperature Increase. ISPRS Int. Arch. Photogramm. Remote Sens. Spat. Inf. Sci. 2015, XL-3/W3, 349–354. [Google Scholar] [CrossRef]
- Horcher, A.; Visser, R.J. Unmanned aerial vehicles: Applications for natural resource management and monitoring. In Proceedings of the 2004 Council on Forest Engineering (COFE) Conference: “Machines and People, The Interface”, Hot Springs, AR, Canada, 27–30 April 2004. [Google Scholar]
- Coulter, D.; Hauff, P.L.; Kerby, W.L. Airborne Hyperspectral Remote Sensing. In Proceedings of the Exploration 07: Fifth Decennial International Conference on Mineral Exploration, Toronto, ON, Canada, 9–12 September 2007; pp. 375–386. [Google Scholar]
- Qin, J.; Chao, K.; Kim, M.S.; Lu, R.; Burks, T.F. Hyperspectral and multispectral imaging for evaluating food safety and quality. J. Food Eng. 2013, 118, 157–171. [Google Scholar] [CrossRef]
- Thenkabail, P.S.; Gumma, M.K.; Teluguntla, P.; Mohammed, I.A. Hyperspectral Remote Sensing of Vegetation and Agricultural Crops. Photogramm. Eng. Remote Sens. 2014, 80, 697–723. [Google Scholar]
- Park, B.; Lu, R. Hyperspectral Imaging Technology in Food and Agriculture; Food Engineering Series; Springer: New York, NY, USA, 2015; ISBN 978-1-4939-2836-1. [Google Scholar]
- Multispectral vs. Hyperspectral Imagery Explained. Available online: http://gisgeography.com/multispectral-vs-hyperspectral-imagery-explained/ (accessed on 15 September 2017).
- Proctor, C.; He, Y. Workflow for Building A Hyperspectral Uav: Challenges And Opportunities. ISPRS Int. Arch. Photogramm. Remote Sens. Spat. Inf. Sci. 2015, XL-1/W4, 415–419. [Google Scholar] [CrossRef]
- Manolakis, D.; Marden, D.; Shaw, G.A. Hyperspectral image processing for automatic target detection applications. Linc. Lab. J. 2003, 14, 79–116. [Google Scholar]
- AVIRIS—Airborne Visible/Infrared Imaging Spectrometer—Imaging Spectroscopy. Available online: https://aviris.jpl.nasa.gov/aviris/imaging_spectroscopy.html (accessed on 9 October 2017).
- Sahoo, R. Hyperspectral Remote Sensing (Sahoo’s Report); Indian Agricultural Statistics Research Institute: New Delhi, India, 2013; pp. 848–859. [Google Scholar]
- Goetz, A.F. H. Three decades of hyperspectral remote sensing of the Earth: A personal view. Remote Sens. Environ. 2009, 113, S5–S16. [Google Scholar] [CrossRef]
- Sabins, F.F. Remote sensing for mineral exploration. Ore Geol. Rev. 1999, 14, 157–183. [Google Scholar] [CrossRef]
- Maathuis, B.H.P.; van Genderen, J.L. A review of satellite and airborne sensors for remote sensing based detection of minefields and landmines. Int. J. Remote Sens. 2004, 25, 5201–5245. [Google Scholar] [CrossRef]
- Teke, M.; Deveci, H.S.; Haliloğlu, O.; Gürbüz, S.Z.; Sakarya, U. A short survey of hyperspectral remote sensing applications in agriculture. In Proceedings of the 2013 6th International Conference on Recent Advances in Space Technologies (RAST), Istanbul, Turkey, 12–14 June 2013; pp. 171–176. [Google Scholar]
- Mather, P.M. (Ed.) TERRA-1: Understanding the Terrestrial Environment, the Role of Earth Observations from Space; CRC Press: Boca Raton, FL, USA, 1992. [Google Scholar]
- Lin, J.; Singer, P.W. China to Launch Powerful Civilian Hyperspectral Satellite. Available online: http://www.popsci.com/china-to-launch-worlds-most-powerful-hyperspectral-satellite (accessed on 18 April 2017).
- Mulla, D.J. Twenty five years of remote sensing in precision agriculture: Key advances and remaining knowledge gaps. Biosyst. Eng. 2013, 114, 358–371. [Google Scholar] [CrossRef]
- Datt, B.; McVicar, T.R.; Niel, T.G.V.; Jupp, D.L.B.; Pearlman, J.S. Preprocessing EO-1 Hyperion hyperspectral data to support the application of agricultural indexes. IEEE Trans. Geosci. Remote Sens. 2003, 41, 1246–1259. [Google Scholar] [CrossRef]
- Moharana, S.; Dutta, S. Spatial variability of chlorophyll and nitrogen content of rice from hyperspectral imagery. ISPRS J. Photogramm. Remote Sens. 2016, 122, 17–29. [Google Scholar] [CrossRef]
- Clark, M.L.; Kilham, N.E. Mapping of land cover in northern California with simulated hyperspectral satellite imagery. ISPRS J. Photogramm. Remote Sens. 2016, 119, 228–245. [Google Scholar] [CrossRef]
- Zhang, N.; Wang, M.; Wang, N. Precision agriculture—A worldwide overview. Comput. Electron. Agric. 2002, 36, 113–132. [Google Scholar] [CrossRef]
- Pölönen, I.; Saari, H.; Kaivosoja, J.; Honkavaara, E.; Pesonen, L. Hyperspectral imaging based biomass and nitrogen content estimations from light-weight UAV. In Proceedings of the SPIE Remote Sensing, Dresden, Germany, 16 October 2013. [Google Scholar]
- WorldView-3 WorldView-3 Satellite Sensor|Satellite Imaging Corp. Available online: http://www.satimagingcorp.com/satellite-sensors/worldview-3/ (accessed on 19 April 2017).
- ESA Spatial-Resolutions-Sentinel-2 MSI—User Guides—Sentinel Online. Available online: https://earth.esa.int/web/sentinel/user-guides/sentinel-2-msi/resolutions/spatial (accessed on 19 April 2017).
- AVIRIS—Airborne Visible/Infrared Imaging Spectrometer. Available online: https://aviris.jpl.nasa.gov/ (accessed on 1 August 2017).
- Pajares, G. Overview and Current Status of Remote Sensing Applications Based on Unmanned Aerial Vehicles (UAVs). Photogramm. Eng. Remote Sens. 2015, 81, 281–329. [Google Scholar] [CrossRef]
- Aasen, H. The Acquisition of Hyperspectral Digital Surface Models of Crops from UAV Snapshot Cameras. Ph.D. Thesis, Universität zu Köln, Köln, Germany, 2016. [Google Scholar]
- Sullivan, J.M. Evolution or revolution? The rise of UAVs. IEEE Technol. Soc. Mag. 2006, 25, 43–49. [Google Scholar] [CrossRef]
- Pappalardo, J. Unmanned Aircraft “Roadmap” Reflects Changing Priorities. Available online: http://www.nationaldefensemagazine.org/articles/2005/3/31/2005april-unmanned-aircraft-roadmap-reflects-changing-priorities (accessed on 1 September 2017).
- Colomina, I.; Molina, P. Unmanned aerial systems for photogrammetry and remote sensing: A review. ISPRS J. Photogramm. Remote Sens. 2014, 92, 79–97. [Google Scholar] [CrossRef]
- Bock, C.H.; Poole, G.H.; Parker, P.E.; Gottwald, T.R. Plant Disease Severity Estimated Visually, by Digital Photography and Image Analysis, and by Hyperspectral Imaging. Crit. Rev. Plant Sci. 2010, 29, 59–107. [Google Scholar] [CrossRef]
- Zarco-Tejada, P.J.; Guillén-Climent, M.L.; Hernández-Clemente, R.; Catalina, A.; González, M.R.; Martín, P. Estimating leaf carotenoid content in vineyards using high resolution hyperspectral imagery acquired from an unmanned aerial vehicle (UAV). Agric. For. Meteorol. 2013, 171–172, 281–294. [Google Scholar] [CrossRef]
- Corbane, C.; Jacob, F.; Raclot, D.; Albergel, J.; Andrieux, P. Multitemporal analysis of hydrological soil surface characteristics using aerial photos: A case study on a Mediterranean vineyard. Int. J. Appl. Earth Obs. Geoinf. 2012, 18, 356–367. [Google Scholar] [CrossRef]
- Zarco-Tejada, P.J.; Catalina, A.; González, M.R.; Martín, P. Relationships between net photosynthesis and steady-state chlorophyll fluorescence retrieved from airborne hyperspectral imagery. Remote Sens. Environ. 2013, 136, 247–258. [Google Scholar] [CrossRef]
- Wu, D.; Sun, D.-W. Advanced applications of hyperspectral imaging technology for food quality and safety analysis and assessment: A review—Part I: Fundamentals. Innov. Food Sci. Emerg. Technol. 2013, 19, 1–14. [Google Scholar] [CrossRef]
- Sellar, R.G.; Boreman, G.D. Classification of imaging spectrometers for remote sensing applications. Opt. Eng. 2005, 44, 13602. [Google Scholar] [CrossRef]
- Carrère, J.P.; Place, S.; Oddou, J.P.; Benoit, D.; Roy, F. CMOS image sensor: Process impact on dark current. In Proceedings of the 2014 IEEE International on Reliability Physics Symposium, Waikoloa, HI, USA, 1–5 June 2014; pp. 3C.1.1–3C.1.6. [Google Scholar]
- Hagen, N.; Kudenov, M.W. Review of snapshot spectral imaging technologies. Opt. Eng. 2013, 52, 090901. [Google Scholar] [CrossRef]
- Uto, K.; Seki, H.; Saito, G.; Kosugi, Y.; Komatsu, T. Development of a Low-Cost Hyperspectral Whiskbroom Imager Using an Optical Fiber Bundle, a Swing Mirror, and Compact Spectrometers. IEEE J. Sel. Top. Appl. Earth Obs. Remote Sens. 2016, 9, 3909–3925. [Google Scholar] [CrossRef]
- Fowler, J.E. Compressive pushbroom and whiskbroom sensing for hyperspectral remote-sensing imaging. In Proceedings of the 2014 IEEE International Conference on Image Processing, Paris, France, 27–30 October 2014; pp. 684–688. [Google Scholar]
- Lucieer, A.; Malenovský, Z.; Veness, T.; Wallace, L. HyperUAS-Imaging Spectroscopy from a Multirotor Unmanned Aircraft System: HyperUAS-Imaging Spectroscopy from a Multirotor Unmanned. J. Field Robot. 2014, 31, 571–590. [Google Scholar] [CrossRef]
- Uto, K.; Seki, H.; Saito, G.; Kosugi, Y. Characterization of Rice Paddies by a UAV-Mounted Miniature Hyperspectral Sensor System. IEEE J. Sel. Top. Appl. Earth Obs. Remote Sens. 2013, 6, 851–860. [Google Scholar] [CrossRef]
- Uto, K.; Seki, H.; Saito, G.; Kosugi, Y.; Komatsu, T. Development of a Low-Cost, Lightweight Hyperspectral Imaging System Based on a Polygon Mirror and Compact Spectrometers. IEEE J. Sel. Top. Appl. Earth Obs. Remote Sens. 2016, 9, 861–875. [Google Scholar] [CrossRef]
- Rozas, G.; Jusserand, B.; Fainstein, A. Fabry-Pérot-multichannel spectrometer tandem for ultra-high resolution Raman spectroscopy. Rev. Sci. Instrum. 2014, 85, 13103. [Google Scholar] [CrossRef] [PubMed]
- Honkavaara, E.; Hakala, T.; Kirjasniemi, J.; Lindfors, A.; Mäkynen, J.; Nurminen, K.; Ruokokoski, P.; Saari, H.; Markelin, L. New light-weight stereosopic spectrometric airborne imaging technology for high-resolution environmental remote sensing case studies in water quality mapping. Int. Arch. Photogramm. Remote Sens. Spat. Inf. Sci. 2013, 1, W1. [Google Scholar] [CrossRef]
- Bioucas-Dias, J.M.; Plaza, A.; Camps-Valls, G.; Scheunders, P.; Nasrabadi, N.; Chanussot, J. Hyperspectral Remote Sensing Data Analysis and Future Challenges. IEEE Geosci. Remote Sens. Mag. 2013, 1, 6–36. [Google Scholar] [CrossRef]
- Habib, A.; Xiong, W.; He, F.; Yang, H.L.; Crawford, M. Improving Orthorectification of UAV-Based Push-Broom Scanner Imagery Using Derived Orthophotos From Frame Cameras. IEEE J. Sel. Top. Appl. Earth Obs. Remote Sens. 2017, 10, 262–276. [Google Scholar] [CrossRef]
- Photonics, Headwall VNIR. Available online: http://www.headwallphotonics.com/spectral-imaging/hyperspectral/vnir (accessed on 2 April 2017).
- Duan, S.-B.; Li, Z.-L.; Tang, B.-H.; Wu, H.; Ma, L.; Zhao, E.; Li, C. Land Surface Reflectance Retrieval from Hyperspectral Data Collected by an Unmanned Aerial Vehicle over the Baotou Test Site. PLoS ONE 2013, 8, e66972. [Google Scholar] [CrossRef]
- Jakob, S.; Zimmermann, R.; Gloaguen, R. The Need for Accurate Geometric and Radiometric Corrections of Drone-Borne Hyperspectral Data for Mineral Exploration: MEPHySTo—A Toolbox for Pre-Processing Drone-Borne Hyperspectral Data. Remote Sens. 2017, 9, 88. [Google Scholar] [CrossRef]
- Hruska, R.; Mitchell, J.; Anderson, M.; Glenn, N.F. Radiometric and Geometric Analysis of Hyperspectral Imagery Acquired from an Unmanned Aerial Vehicle. Remote Sens. 2012, 4, 2736–2752. [Google Scholar] [CrossRef]
- Chen, H.S. Remote Sensing Calibration Systems: An Introduction; A. Deepak: Oakland, CA, USA, 1997; ISBN 978-0-937194-38-6. [Google Scholar]
- Richter, R.; Schlapfer, D.; Muller, A. Operational Atmospheric Correction for Imaging Spectrometers Accounting for the Smile Effect. IEEE Trans. Geosci. Remote Sens. 2011, 49, 1772–1780. [Google Scholar] [CrossRef]
- Mendez-Rial, R.; Calvino-Cancela, M.; Martin-Herrero, J. Accurate Implementation of Anisotropic Diffusion in the Hypercube. IEEE Geosci. Remote Sens. Lett. 2010, 7, 870–874. [Google Scholar] [CrossRef]
- Qian, S.E.; Chen, G. Enhancing Spatial Resolution of Hyperspectral Imagery Using Sensor’s Intrinsic Keystone Distortion. IEEE Trans. Geosci. Remote Sens. 2012, 50, 5033–5048. [Google Scholar] [CrossRef]
- Alparone, L.; Wald, L.; Chanussot, J.; Thomas, C.; Gamba, P.; Bruce, L.M. Comparison of Pansharpening Algorithms: Outcome of the 2006 GRS-S Data-Fusion Contest. IEEE Trans. Geosci. Remote Sens. 2007, 45, 3012–3021. [Google Scholar] [CrossRef]
- Herrero, R.; Cadirola, M.; Ingle, V.K. Preprocessing and compression of Hyperspectral images captured onboard UAVs. In Proceedings of the SPIE 9647, Unmanned/Unattended Sensors and Sensor Networks XI; and Advanced Free-Space Optical Communication Techniques and Applications, Toulouse, France, 13 October 2015; p. 964705. [Google Scholar]
- Burger, J.; Gowen, A. Data handling in hyperspectral image analysis. Chemom. Intell. Lab. Syst. 2011, 108, 13–22. [Google Scholar] [CrossRef]
- Landgrebe, D. Hyperspectral image data analysis. IEEE Signal Process. Mag. 2002, 19, 17–28. [Google Scholar] [CrossRef]
- Du, Q.; Raksuntorn, N. Hyperspectral image analysis using noise-adjusted principal component transform. In Proceedings of the SPIE Algorithms and Technologies for Multispectral, Hyperspectral, and Ultraspectral Imagery XII, Orlando, FL, USA, 4 May 2006. [Google Scholar]
- Chen, C. Comparison of principal components analysis and minimum noise fraction transformation for reducing the dimensionality of hyperspectral imagery. Geogr. Res. 2000, 163–178. [Google Scholar]
- Nasrabadi, N.M. Hyperspectral Target Detection : An Overview of Current and Future Challenges. IEEE Signal Process. Mag. 2014, 31, 34–44. [Google Scholar] [CrossRef]
- Manolakis, D.; Shaw, G. Detection algorithms for hyperspectral imaging applications. IEEE Signal Process. Mag. 2002, 19, 29–43. [Google Scholar] [CrossRef]
- Kay, S.M. Fundamentals of Statistical Signal Processing; Prentice-Hall: Englewood Cliffs, NJ, USA, 1998. [Google Scholar]
- Shippert, P. Introduction to hyperspectral image analysis. Online J. Space Commun. 2003, 3, 13. [Google Scholar]
- Bioucas-Dias, J.M.; Plaza, A.; Dobigeon, N.; Parente, M.; Du, Q.; Gader, P.; Chanussot, J. Hyperspectral Unmixing Overview: Geometrical, Statistical, and Sparse Regression-Based Approaches. IEEE J. Sel. Top. Appl. Earth Obs. Remote Sens. 2012, 5, 354–379. [Google Scholar] [CrossRef]
- Keshava, N.; Mustard, J.F. Spectral unmixing. IEEE Signal Process. Mag. 2002, 19, 44–57. [Google Scholar] [CrossRef]
- Richmond, C.D. Derived PDF of maximum likelihood signal estimator which employs an estimated noise covariance. IEEE Trans. Signal Process. 1996, 44, 305–315. [Google Scholar] [CrossRef]
- Kelly, E.J. An Adaptive Detection Algorithm. IEEE Trans. Aerosp. Electron. Syst. 1986, AES-22, 115–127. [Google Scholar] [CrossRef]
- Kelly, E.J. Adaptive Detection in Non-Stationary Interference, Part III; MIT Lincoln Laboratory: Lexington, MA, USA, 1987. [Google Scholar]
- Reed, I.S.; Yu, X. Adaptive multiple-band CFAR detection of an optical pattern with unknown spectral distribution. IEEE Trans. Acoust. Speech Signal Process. 1990, 38, 1760–1770. [Google Scholar] [CrossRef]
- Kraut, S.; Scharf, L.L. The CFAR adaptive subspace detector is a scale-invariant GLRT. In Proceedings of the Ninth IEEE Signal on Workshop on Statistical Signal and Array Processing, Portland, OR, USA, 14–16 September 1998; pp. 57–60. [Google Scholar]
- Kraut, S.; Scharf, L.L.; McWhorter, L.T. Adaptive subspace detectors. IEEE Trans. Signal Process. 2001, 49, 1–16. [Google Scholar] [CrossRef]
- Scharf, L.L.; Friedlander, B. Matched subspace detectors. IEEE Trans. Signal Process. 1994, 42, 2146–2157. [Google Scholar] [CrossRef]
- Manolakis, D.; Siracusa, C.; Shaw, G. Hyperspectral subpixel target detection using the linear mixing model. IEEE Trans. Geosci. Remote Sens. 2001, 39, 1392–1409. [Google Scholar] [CrossRef]
- Goldberg, H.; Nasrabadi, N.M. A comparative study of linear and nonlinear anomaly detectors for hyperspectral imagery. In Proceedings of the SPIE Algorithms and Technologies for Multispectral, Hyperspectral, and Ultraspectral Imagery XIII, Orlando, FL, USA, 9–13 April 2007; p. 656504. [Google Scholar]
- Kwon, H.; Nasrabadi, N.M. Kernel RX-algorithm: A nonlinear anomaly detector for hyperspectral imagery. IEEE Trans. Geosci. Remote Sens. 2005, 43, 388–397. [Google Scholar] [CrossRef]
- Banerjee, A.; Burlina, P.; Diehl, C. A support vector method for anomaly detection in hyperspectral imagery. IEEE Trans. Geosci. Remote Sens. 2006, 44, 2282–2291. [Google Scholar] [CrossRef]
- Pieper, M.; Manolakis, D.; Truslow, E.; Cooley, T.; Brueggeman, M.; Weisner, A.; Jacobson, J. Comparison of hyperspectral change detection algorithms. In Proceedings of the SPIE Optical Engineering + Applications, San Diego, CA, USA, 9–13 August 2015; p. 96110Z. [Google Scholar]
- Robey, F.C.; Fuhrmann, D.R.; Kelly, E.J.; Nitzberg, R. A CFAR adaptive matched filter detector. IEEE Trans. Aerosp. Electron. Syst. 1992, 28, 208–216. [Google Scholar] [CrossRef]
- Harsanyi, J.C.; Chang, C.I. Hyperspectral image classification and dimensionality reduction: An orthogonal subspace projection approach. IEEE Trans. Geosci. Remote Sens. 1994, 32, 779–785. [Google Scholar] [CrossRef]
- Scholkopf, B.; Smola, A.J. Learning with Kernels: Support Vector Machines, Regularization, Optimization, and Beyond; MIT Press: Cambridge, MA, USA, 2001; ISBN 978-0-262-19475-4. [Google Scholar]
- Schaum, A. Continuum fusion: A theory of inference, with applications to hyperspectral detection. Opt. Express 2010, 18, 8171–8181. [Google Scholar] [CrossRef] [PubMed]
- Manolakis, D.; Truslow, E.; Pieper, M.; Cooley, T.; Brueggeman, M. Detection Algorithms in Hyperspectral Imaging Systems: An Overview of Practical Algorithms. IEEE Signal Process. Mag. 2014, 31, 24–33. [Google Scholar] [CrossRef]
- DiPietro, R.S.; Manolakis, D.; Lockwood, R.B.; Cooley, T.; Jacobson, J. Hyperspectral matched filter with false-alarm mitigation. Opt. Eng. 2012, 51, 16202. [Google Scholar] [CrossRef]
- Pieper, M.L.; Manolakis, D.; Truslow, E.; Cooley, T.; Brueggeman, M. False alarm mitigation techniques for hyperspectral target detection. In Proceedings of the SPIE Defense, Security, and Sensing, Baltimore, MD, USA, 29 April–3 May 2013; p. 874304. [Google Scholar] [CrossRef]
- Burr, T.; Fry, H.; McVey, B.; Sander, E.; Cavanaugh, J.; Neath, A. Performance of Variable Selection Methods in Regression Using Variations of the Bayesian Information Criterion. Commun. Stat. Simul. Comput. 2008, 37, 507–520. [Google Scholar] [CrossRef]
- Keshava, N. Distance metrics and band selection in hyperspectral processing with applications to material identification and spectral libraries. IEEE Trans. Geosci. Remote Sens. 2004, 42, 1552–1565. [Google Scholar] [CrossRef]
- Matteoli, S.; Diani, M.; Corsini, G. A tutorial overview of anomaly detection in hyperspectral images. IEEE Aerosp. Electron. Syst. Mag. 2010, 25, 5–28. [Google Scholar] [CrossRef]
- Kwon, H.; Nasrabadi, N.M. A Comparative Analysis of Kernel Subspace Target Detectors for Hyperspectral Imagery. EURASIP J. Adv. Signal Process. 2006, 2007, 29250. [Google Scholar] [CrossRef]
- Richards, J.A.; Jia, X. Remote Sensing Digital Image Analysis: An Introduction; Springer: New York, NY, USA, 1990. [Google Scholar]
- Plaza, A.; Benediktsson, J.A.; Boardman, J.W.; Brazile, J.; Bruzzone, L.; Camps-Valls, G.; Chanussot, J.; Fauvel, M.; Gamba, P.; Gualtieri, A.; et al. Recent advances in techniques for hyperspectral image processing. Remote Sens. Environ. 2009, 113 (Suppl. S1), S110–S122. [Google Scholar] [CrossRef]
- Boser, B.E.; Guyon, I.M.; Vapnik, V.N. A Training Algorithm for Optimal Margin Classifiers. In Proceedings of the Fifth Annual Workshop on Computational Learning Theory, New York, NY, USA, 27–29 July 1992; pp. 144–152. [Google Scholar]
- Mercier, G.; Lennon, M. Support vector machines for hyperspectral image classification with spectral-based kernels. In Proceedings of the 2003 IEEE International Conferences on Geoscience and Remote Sensing Symposium, Toulouse, France, 21–25 July 2003; pp. 288–290. [Google Scholar]
- Chi, M.; Bruzzone, L. Semisupervised Classification of Hyperspectral Images by SVMs Optimized in the Primal. IEEE Trans. Geosci. Remote Sens. 2007, 45, 1870–1880. [Google Scholar] [CrossRef]
- Kasetkasem, T.; Arora, M.K.; Varshney, P.K. Super-resolution land cover mapping using a Markov random field based approach. Remote Sens. Environ. 2005, 96, 302–314. [Google Scholar] [CrossRef]
- Chen, Y.; Wang, G.; Dong, S. Learning with progressive transductive support vector machine. Pattern Recognit. Lett. 2003, 24, 1845–1855. [Google Scholar] [CrossRef]
- Tadjudin, S.; Landgrebe, D. Classification of High Dimensional Data with Limited Training Samples. Available online: http://docs.lib.purdue.edu/ecetr/56/ (accessed on 20 March 2017).
- Appice, A.; Guccione, P.; Malerba, D. A novel spectral-spatial co-training algorithm for the transductive classification of hyperspectral imagery data. Pattern Recognit. 2017, 63, 229–245. [Google Scholar] [CrossRef]
- Bandos, T.V.; Bruzzone, L.; Camps-Valls, G. Classification of Hyperspectral Images with Regularized Linear Discriminant Analysis. IEEE Trans. Geosci. Remote Sens. 2009, 47, 862–873. [Google Scholar] [CrossRef]
- Camps-Valls, G.; Marsheva, T.V. B.; Zhou, D. Semi-Supervised Graph-Based Hyperspectral Image Classification. IEEE Trans. Geosci. Remote Sens. 2007, 45, 3044–3054. [Google Scholar] [CrossRef]
- Agapiou, A.; Hadjimitsis, D.G.; Alexakis, D.D. Evaluation of Broadband and Narrowband Vegetation Indices for the Identification of Archaeological Crop Marks. Remote Sens. 2012, 4, 3892–3919. [Google Scholar] [CrossRef]
- Stagakis, S.; Markos, N.; Sykioti, O.; Kyparissis, A. Monitoring canopy biophysical and biochemical parameters in ecosystem scale using satellite hyperspectral imagery: An application on a Phlomis fruticosa Mediterranean ecosystem using multiangular CHRIS/PROBA observations. Remote Sens. Environ. 2010, 114, 977–994. [Google Scholar] [CrossRef]
- Haboudane, D.; Miller, J.R.; Pattey, E.; Zarco-Tejada, P.J.; Strachan, I.B. Hyperspectral vegetation indices and novel algorithms for predicting green LAI of crop canopies: Modeling and validation in the context of precision agriculture. Remote Sens. Environ. 2004, 90, 337–352. [Google Scholar] [CrossRef]
- Zarco-Tejada, P.; Berjon, A.; Lopezlozano, R.; Miller, J.; Martin, P.; Cachorro, V.; Gonzalez, M.; Defrutos, A. Assessing vineyard condition with hyperspectral indices: Leaf and canopy reflectance simulation in a row-structured discontinuous canopy. Remote Sens. Environ. 2005, 99, 271–287. [Google Scholar] [CrossRef]
- Lin, P.; Qin, Q.; Dong, H.; Meng, Q. Hyperspectral vegetation indices for crop chlorophyll estimation: Assessment, modeling and validation. In Proceedings of the 2012 IEEE International conferences on Geoscience and Remote Sensing Symposium, Munich, Germany, 22–27 July 2012; pp. 4841–4844. [Google Scholar]
- Liang, L.; Qin, Z.; Zhao, S.; Di, L.; Zhang, C.; Deng, M.; Lin, H.; Zhang, L.; Wang, L.; Liu, Z. Estimating crop chlorophyll content with hyperspectral vegetation indices and the hybrid inversion method. Int. J. Remote Sens. 2016, 37, 2923–2949. [Google Scholar] [CrossRef]
- Thenkabail, P.S.; Lyon, J.G. Hyperspectral Remote Sensing of Vegetation; CRC Press: Boca Raton, FL, USA, 2016; ISBN 978-1-4398-4538-7. [Google Scholar]
- Din, M.; Zheng, W.; Rashid, M.; Wang, S.; Shi, Z. Evaluating Hyperspectral Vegetation Indices for Leaf Area Index Estimation of Oryza sativa L. at Diverse Phenological Stages. Front. Plant Sci. 2017, 8. [Google Scholar] [CrossRef] [PubMed]
- Zhao, W.; Du, S. Spectral-Spatial Feature Extraction for Hyperspectral Image Classification: A Dimension Reduction and Deep Learning Approach. IEEE Trans. Geosci. Remote Sens. 2016, 54, 4544–4554. [Google Scholar] [CrossRef]
- Wang, Q.; Lin, J.; Yuan, Y. Salient Band Selection for Hyperspectral Image Classification via Manifold Ranking. IEEE Trans. Neural Netw. Learn. Syst. 2016, 27, 1279–1289. [Google Scholar] [CrossRef] [PubMed]
- Zhong, Z.; Li, J.; Luo, Z.; Chapman, M. Spectral-Spatial Residual Network for Hyperspectral Image Classification: A 3-D Deep Learning Framework. IEEE Trans. Geosci. Remote Sens. 2017, PP, 1–12. [Google Scholar] [CrossRef]
- Aptoula, E.; Ozdemir, M.C.; Yanikoglu, B. Deep Learning With Attribute Profiles for Hyperspectral Image Classification. IEEE Geosci. Remote Sens. Lett. 2016, 13, 1970–1974. [Google Scholar] [CrossRef]
- Li, W.; Wu, G.; Du, Q. Transferred Deep Learning for Anomaly Detection in Hyperspectral Imagery. IEEE Geosci. Remote Sens. Lett. 2017, 14, 597–601. [Google Scholar] [CrossRef]
- Hexagon Geospatial Erdas Imagine® 2016 Product Features and Comparisons. Available online: http://www.hexagongeospatial.com/technical-documents/product-descriptions-2016/erdas-imagine-2016-product-description (accessed on 9 October 2017).
- Harris Geospatial ENVI Software Platform. Available online: http://www.harrisgeospatial.com/ (accessed on 29 March 2017).
- Image Lab Software Bio-Rad. Available online: http://www.bio-rad.com/en-us/product/image-lab-software (accessed on 29 March 2017).
- Brandywine Photonics Hyperspectral Imaging and CMOS Image Sensors. Available online: http://brandywinephotonics.com/ (accessed on 29 March 2017).
- Resonon Inc. SpectrononPro Manual (Release 5.0). Available online: http://docs.resonon.com/spectronon/pika_manual/SpectrononProManual.pdf (accessed on 29 March 2017).
- Welcome to Spectral Python (SPy)—Spectral Python 0.18 documentation. Available online: http://www.spectralpython.net/ (accessed on 29 March 2017).
- Jelmer Oosthoek Hyperspectral Python (HypPy). Available online: https://www.itc.nl/personal/bakker/hyppy.html (accessed on 29 March 2017).
- Rosario-Torres, S.; Arzuaga-Cruz, E.; Velez-Reyes, M.; Jimenez-Rodriguez, L.O. An update on the MATLAB hyperspectral image analysis toolbox. In Proceedings of the Defense and Security, Orlando, FL, USA, 1 June 2005; pp. 743–752. [Google Scholar]
- Isaac Gerg Matlab Hyperspectral Toolbox. Available online: https://github.com/isaacgerg/matlabHyperspectralToolbox (accessed on 29 March 2017).
- Landgrebe, D.; Biehl, L. An Introduction & Reference for MultiSpec. Available online: ftp://bsa.bf.lu.lv/pub/TIS/atteelu_analiize/MultiSpec/Intro9_11.pdf (accessed on 29 March 2017).
- TensorFlow. Available online: https://www.tensorflow.org/ (accessed on 16 August 2017).
- Welcome—Theano 0.9.0 Documentation. Available online: http://deeplearning.net/software/theano/ (accessed on 16 August 2017).
- Yamada, N.; Fujimura, S. Nondestructive measurement of chlorophyll pigment content in plant leaves from three-color reflectance and transmittance. Appl. Opt. 1991, 30, 3964–3973. [Google Scholar] [CrossRef] [PubMed]
- Honkavaara, E.; Saari, H.; Kaivosoja, J.; Pölönen, I.; Hakala, T.; Litkey, P.; Mäkynen, J.; Pesonen, L. Processing and Assessment of Spectrometric, Stereoscopic Imagery Collected Using a Lightweight UAV Spectral Camera for Precision Agriculture. Remote Sens. 2013, 5, 5006–5039. [Google Scholar] [CrossRef]
- Zarco-Tejada, P.J.; González-Dugo, V.; Berni, J.A. J. Fluorescence, temperature and narrow-band indices acquired from a UAV platform for water stress detection using a micro-hyperspectral imager and a thermal camera. Remote Sens. Environ. 2012, 117, 322–337. [Google Scholar] [CrossRef]
- Calderón, R.; Navas-Cortés, J.A.; Lucena, C.; Zarco-Tejada, P.J. High-resolution airborne hyperspectral and thermal imagery for early detection of Verticillium wilt of olive using fluorescence, temperature and narrow-band spectral indices. Remote Sens. Environ. 2013, 139, 231–245. [Google Scholar] [CrossRef]
- Burkart, A.; Aasen, H.; Alonso, L.; Menz, G.; Bareth, G.; Rascher, U. Angular Dependency of Hyperspectral Measurements over Wheat Characterized by a Novel UAV Based Goniometer. Remote Sens. 2015, 7, 725–746. [Google Scholar] [CrossRef]
- Mitchell, J.J.; Glenn, N.F.; Anderson, M.O.; Hruska, R.C.; Halford, A.; Baun, C.; Nydegger, N. Unmanned aerial vehicle (UAV) hyperspectral remote sensing for dryland vegetation monitoring. In Proceedings of the 2012 4th Workshop on Hyperspectral Image and Signal Processing: Evolution in Remote Sensing (WHISPERS), Shanghai, China, 4–7 June 2012; pp. 1–10. [Google Scholar]
- Kaivosoja, J.; Pesonen, L.; Kleemola, J.; Pölönen, I.; Salo, H.; Honkavaara, E.; Saari, H.; Mäkynen, J.; Rajala, A. A case study of a precision fertilizer application task generation for wheat based on classified hyperspectral data from UAV combined with farm history data. In Proceedings of the SPIE Remote Sensing, Dresden, Germany, 15 October 2013. [Google Scholar]
- Aasen, H.; Burkart, A.; Bolten, A.; Bareth, G. Generating 3D hyperspectral information with lightweight UAV snapshot cameras for vegetation monitoring: From camera calibration to quality assurance. ISPRS J. Photogramm. Remote Sens. 2015, 108, 245–259. [Google Scholar] [CrossRef]
- Näsi, R.; Honkavaara, E.; Lyytikäinen-Saarenmaa, P.; Blomqvist, M.; Litkey, P.; Hakala, T.; Viljanen, N.; Kantola, T.; Tanhuanpää, T.; Holopainen, M. Using UAV-Based Photogrammetry and Hyperspectral Imaging for Mapping Bark Beetle Damage at Tree-Level. Remote Sens. 2015, 7, 15467–15493. [Google Scholar] [CrossRef]
- Kotsiantis, S.B. Supervised Machine Learning: A Review of Classification Techniques. Informatica 2007, 31. [Google Scholar]
- Berveglieri, A.; Tommaselli, A.M.G. Exterior Orientation of Hyperspectral Frame Images Collected with Uav for Forest Applications. ISPRS Int. Arch. Photogramm. Remote Sens. Spat. Inf. Sci. 2016, XL-3/W4, 45–50. [Google Scholar] [CrossRef]
- Saari, H.; Pellikka, I.; Pesonen, L.; Tuominen, S.; Heikkilä, J.; Holmlund, C.; Mäkynen, J.; Ojala, K.; Antila, T. Unmanned Aerial Vehicle (UAV) operated spectral camera system for forest and agriculture applications. In Proceedings of the SPIE Remote Sensing for Agriculture, Ecosystems, and Hydrology XIII, Prague, Czech Republic, 15 October 2011; Volume 8174. [Google Scholar]
- Honkavaara, E.; Kaivosoja, J.; Mäkynen, J.; Pellikka, I.; Pesonen, L.; Saari, H.; Salo, H.; Hakala, T.; Marklelin, L.; Rosnell, T. Hyperspectral Reflectance Signatures and Point Clouds for Precision Agriculture by Light Weight Uav Imaging System. ISPRS Ann. Photogramm. Remote Sens. Spat. Inf. Sci. 2012, 7, 353–358. [Google Scholar] [CrossRef]
- Salamí, E.; Barrado, C.; Pastor, E. UAV Flight Experiments Applied to the Remote Sensing of Vegetated Areas. Remote Sens. 2014, 6, 11051–11081. [Google Scholar] [CrossRef]
- Adão, T.; Peres, E.; Pádua, L.; Hruška, J.; Sousa, J.J.; Morais, R. UAS-based hyperspectral sensing methodology for continuous monitoring and early detection of vineyard anomalies. In Proceedings of the Small Unmanned Aerial Systems for Environmental Research, Vila Real, Portugal, 28–30 June 2017. [Google Scholar]


| Spectral Information | Spatial Information | |
|---|---|---|
| Hyperspectral Imaging | ••• | ••• |
| Multispectral Imaging | •• | ••• |
| Spectroscopy | ••• | • |
| RGB Imagery | • | ••• |
| Manuf. | Sensor | Spectral Range (nm) | No. Bands | Spectral Resol. (nm) | Spatial Resol. (px) | Acquis. Mode | Weight (g) |
|---|---|---|---|---|---|---|---|
| BaySpec | OCI-UAV-1000 | 600–1000 | 100 | <5 b | 2048 d | P | 272 |
| Brandywine Photonics | CHAI S-640 | 825–2125 | 260 | 5 c | 640 × 512 | P | 5000 |
| CHAI V-640 | 350–1080 | 256 | 2.5 c | 640 × 512 | P | 480 | |
| 5 c | |||||||
| 10 c | |||||||
| Cubert GmbH | S 185—FIREFLEYE SE | 450–950 | 125 | 4 c | 50 × 50 | S | 490 |
| S 485—FIREFLEYE XL | 355–750 | 125 | 4.5 c | 70 × 70 | S | 1200 | |
| 450–950 | |||||||
| 550–1000 | |||||||
| Q 285—FIREFLEYE QE | 450–950 | 125 | 4 c | 50 × 50 | S | 3000 | |
| Headwall Photonics Inc., Fitchburg, MA, USA | Nano HyperSpec | 400–1000 | 270 | 6 b | 640 d | P | 1200 e |
| Micro Hyperspec VNIR | 380–1000 | 775 837 923 | 2.5 b | 1004 d 1600 d | P | ≤3900 | |
| HySpex | VNIR-1024 | 400–1000 | 108 | 5.4 c | 1024 d | P | 4000 |
| Mjolnir V-1240 | 400–1000 | 200 | 3 c | 1240 d | P | 4200 | |
| HySpex SWIR-384 | 1000–2500 | 288 | 5.45 c | 384 d | P | 5700 | |
| MosaicMill | Rikola | 500–900 | 50 a | 10 b | 1010 × 1010 | S | 720 |
| NovaSol | vis-NIR microHSI | 400–800 400–1000 380–880 | 120 180 150 | 3.3 c | 680 d | P | <450 |
| Alpha-vis micro HSI | 400–800 350–1000 | 40 60 | 10 c | 1280 d | P | <2100 | |
| SWIR 640 microHSI | 850–1700 600–1700 | 170 200 | 5 c | 640 d | P | 3500 | |
| Alpha-SWIR microHSI | 900–1700 | 160 | 5 c | 640 d | P | 1200 | |
| Extra-SWIR microHSI | 964–2500 | 256 | 6 c | 320 d | P | 2600 | |
| PhotonFocus | MV1-D2048x1088-HS05-96-G2 | 470–900 | 150 | 10-12 b | 2048 × 1088 | P | 265 |
| Quest Innovations | Hyperea 660 C1 | 400–1000 | 660 | - | 1024 d | P | 1440 |
| Resonon | Pika L | 400–1000 | 281 | 2.1 c | 900 d | P | 600 |
| Pika XC2 | 400–1000 | 447 | 1.3 c | 1600 d | P | 2200 | |
| Pika NIR | 900–1700 | 164 | 4.9 c | 320 d | P | 2700 | |
| Pika NUV | 350–800 | 196 | 2.3 c | 1600 d | P | 2100 | |
| SENOP | VIS-VNIR Snapshot | 400–900 | 380 | 10 b | 1010 × 1010 | S | 720 |
| SPECIM | SPECIM FX10 | 400–1000 | 224 | 5.5 b | 1024 d | P | 1260 |
| SPECIM FX17 | 900–1700 | 224 | 8 b | 640 d | P | 1700 | |
| Surface Optics Corp., San Diego, CA, USA | SOC710-GX | 400–1000 | 120 | 4.2 c | 640 d | P | 1250 |
| XIMEA | MQ022HG-IM-LS100-NIR | 600–975 | 100+ | 4 c | 2048 × 8 | P | 32 |
| MQ022HG-IM-LS150-VISNIR | 470–900 | 150+ | 3 c | 2048 × 5 | P | 300 |
© 2017 by the authors. Licensee MDPI, Basel, Switzerland. This article is an open access article distributed under the terms and conditions of the Creative Commons Attribution (CC BY) license (http://creativecommons.org/licenses/by/4.0/).
Share and Cite
Adão, T.; Hruška, J.; Pádua, L.; Bessa, J.; Peres, E.; Morais, R.; Sousa, J.J. Hyperspectral Imaging: A Review on UAV-Based Sensors, Data Processing and Applications for Agriculture and Forestry. Remote Sens. 2017, 9, 1110. https://doi.org/10.3390/rs9111110
Adão T, Hruška J, Pádua L, Bessa J, Peres E, Morais R, Sousa JJ. Hyperspectral Imaging: A Review on UAV-Based Sensors, Data Processing and Applications for Agriculture and Forestry. Remote Sensing. 2017; 9(11):1110. https://doi.org/10.3390/rs9111110
Chicago/Turabian StyleAdão, Telmo, Jonáš Hruška, Luís Pádua, José Bessa, Emanuel Peres, Raul Morais, and Joaquim João Sousa. 2017. "Hyperspectral Imaging: A Review on UAV-Based Sensors, Data Processing and Applications for Agriculture and Forestry" Remote Sensing 9, no. 11: 1110. https://doi.org/10.3390/rs9111110
APA StyleAdão, T., Hruška, J., Pádua, L., Bessa, J., Peres, E., Morais, R., & Sousa, J. J. (2017). Hyperspectral Imaging: A Review on UAV-Based Sensors, Data Processing and Applications for Agriculture and Forestry. Remote Sensing, 9(11), 1110. https://doi.org/10.3390/rs9111110