Seasonal and Spatial Characteristics of Urban Heat Islands (UHIs) in Northern West Siberian Cities


Abstract

1. Introduction
2. Materials and Methods
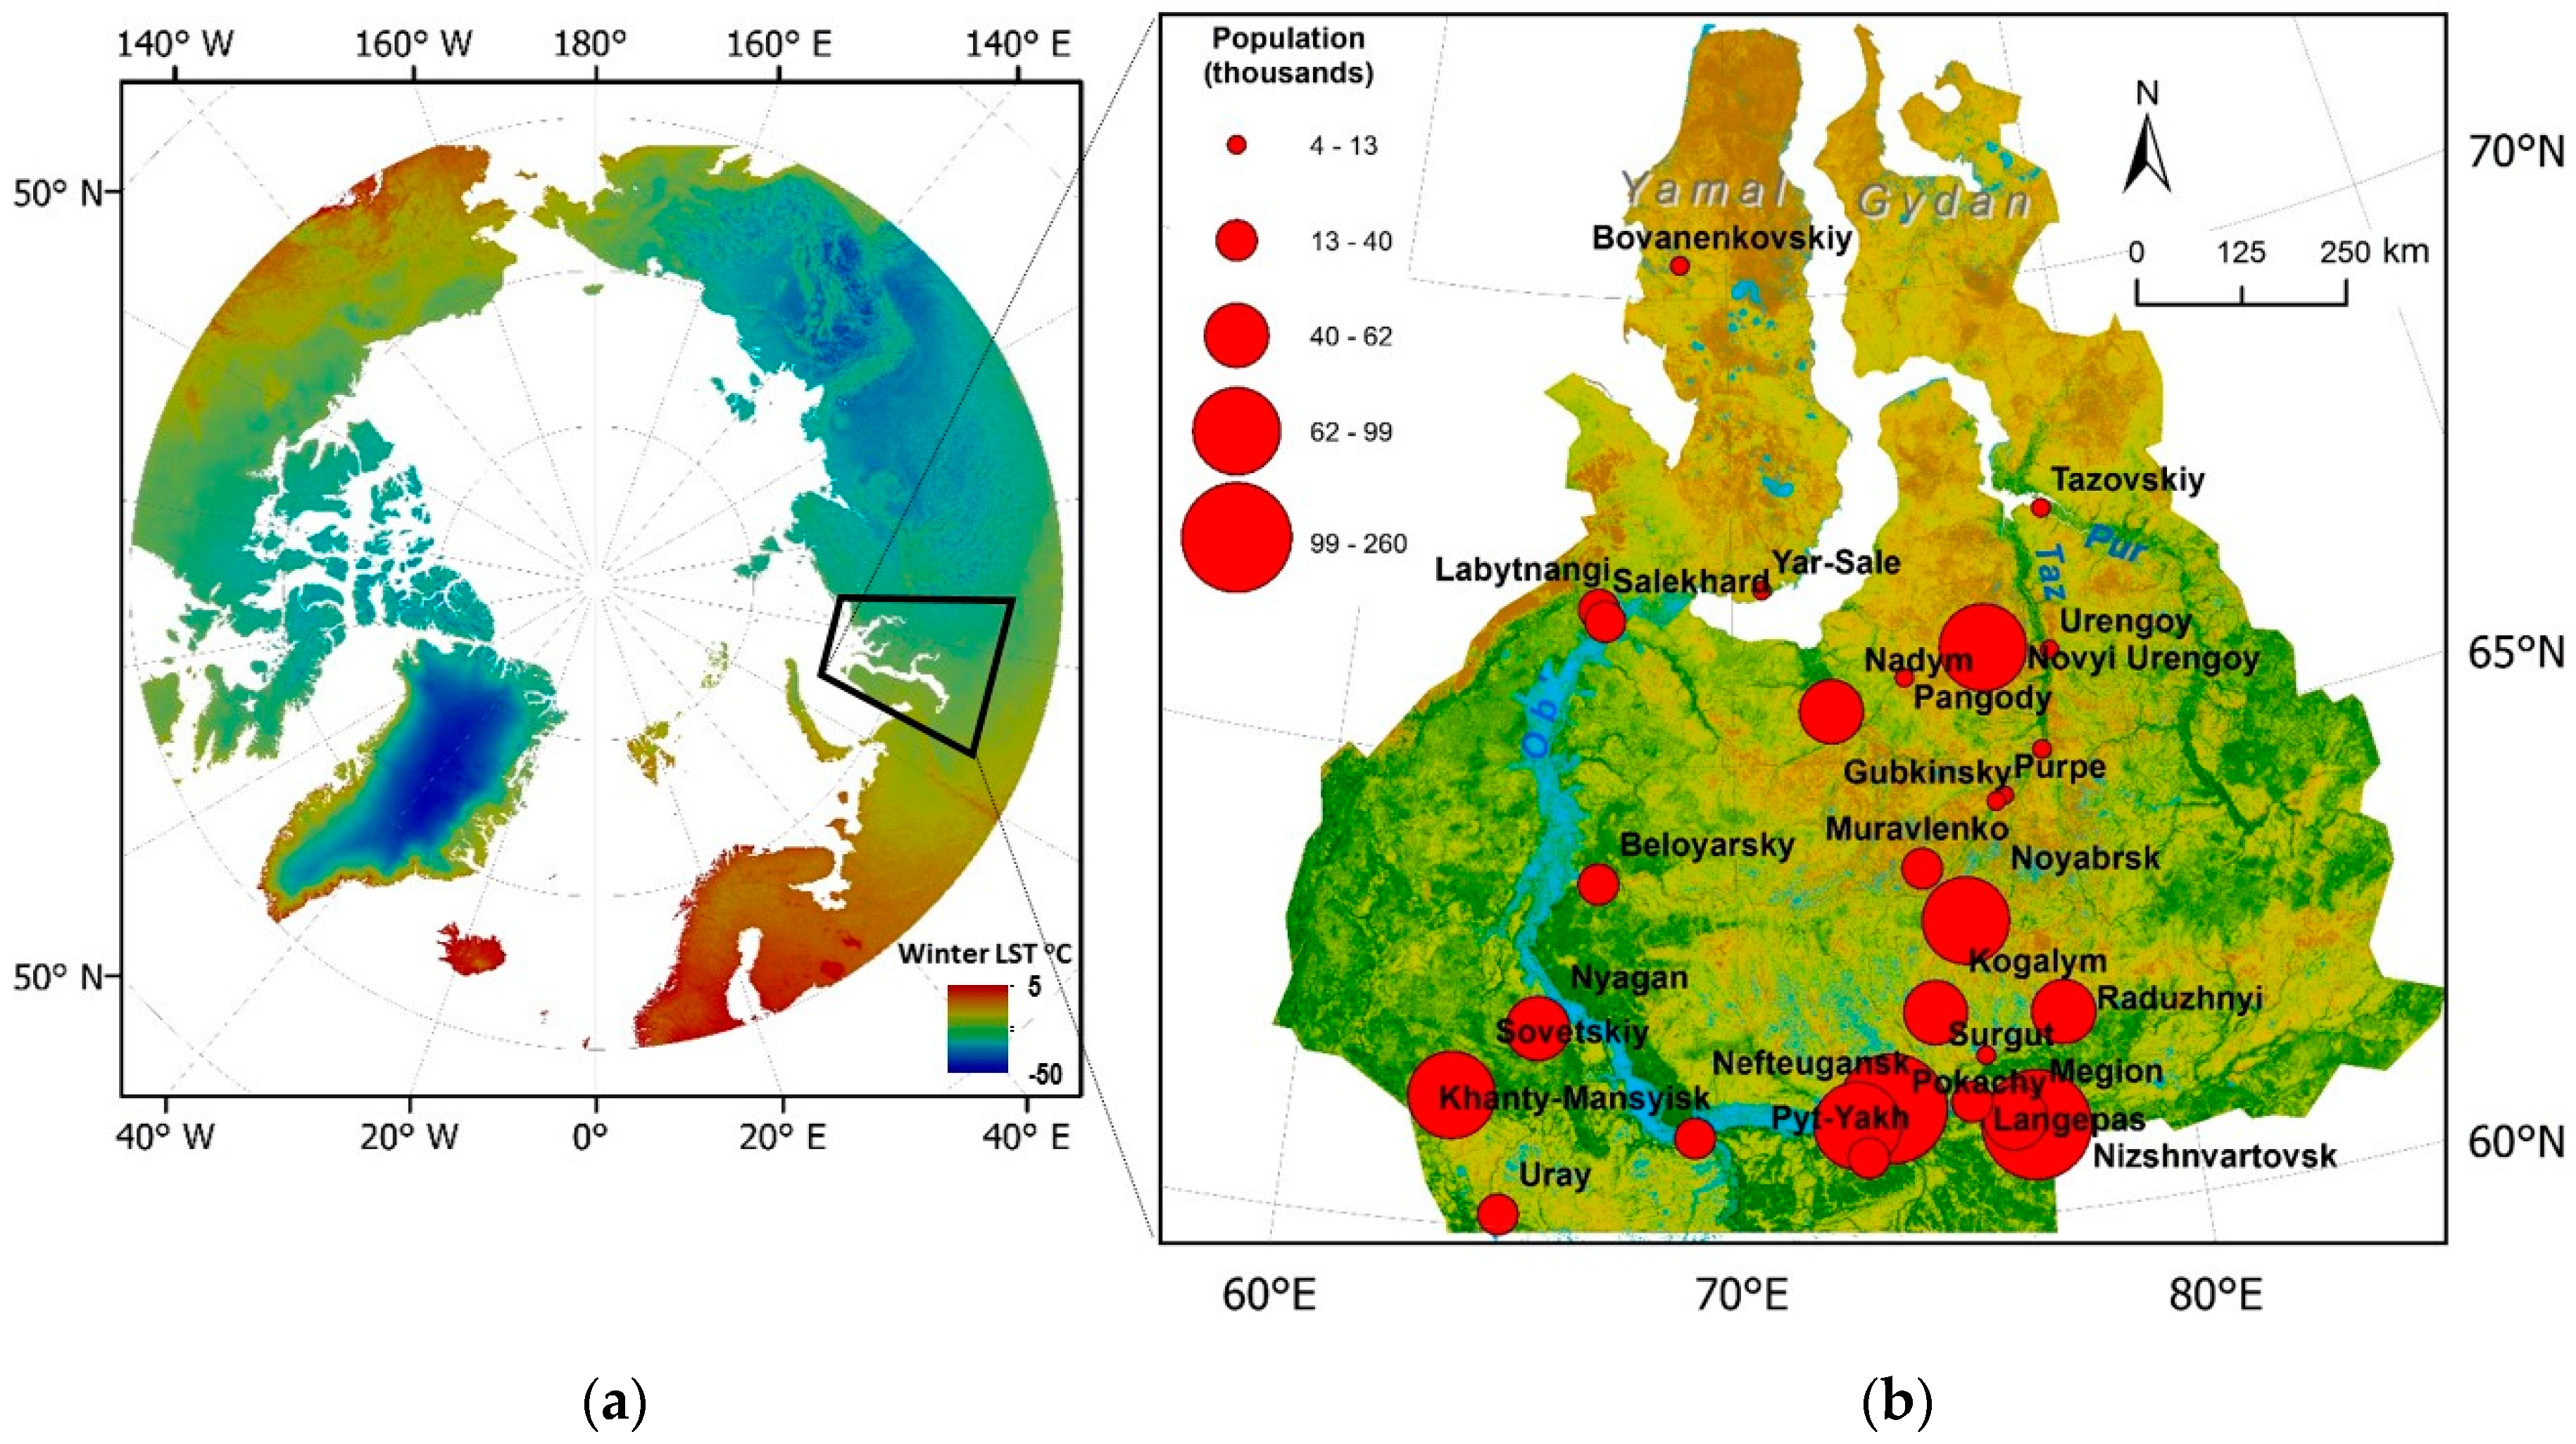
2.1. Study Area
2.2. Data and Methods
3. Results
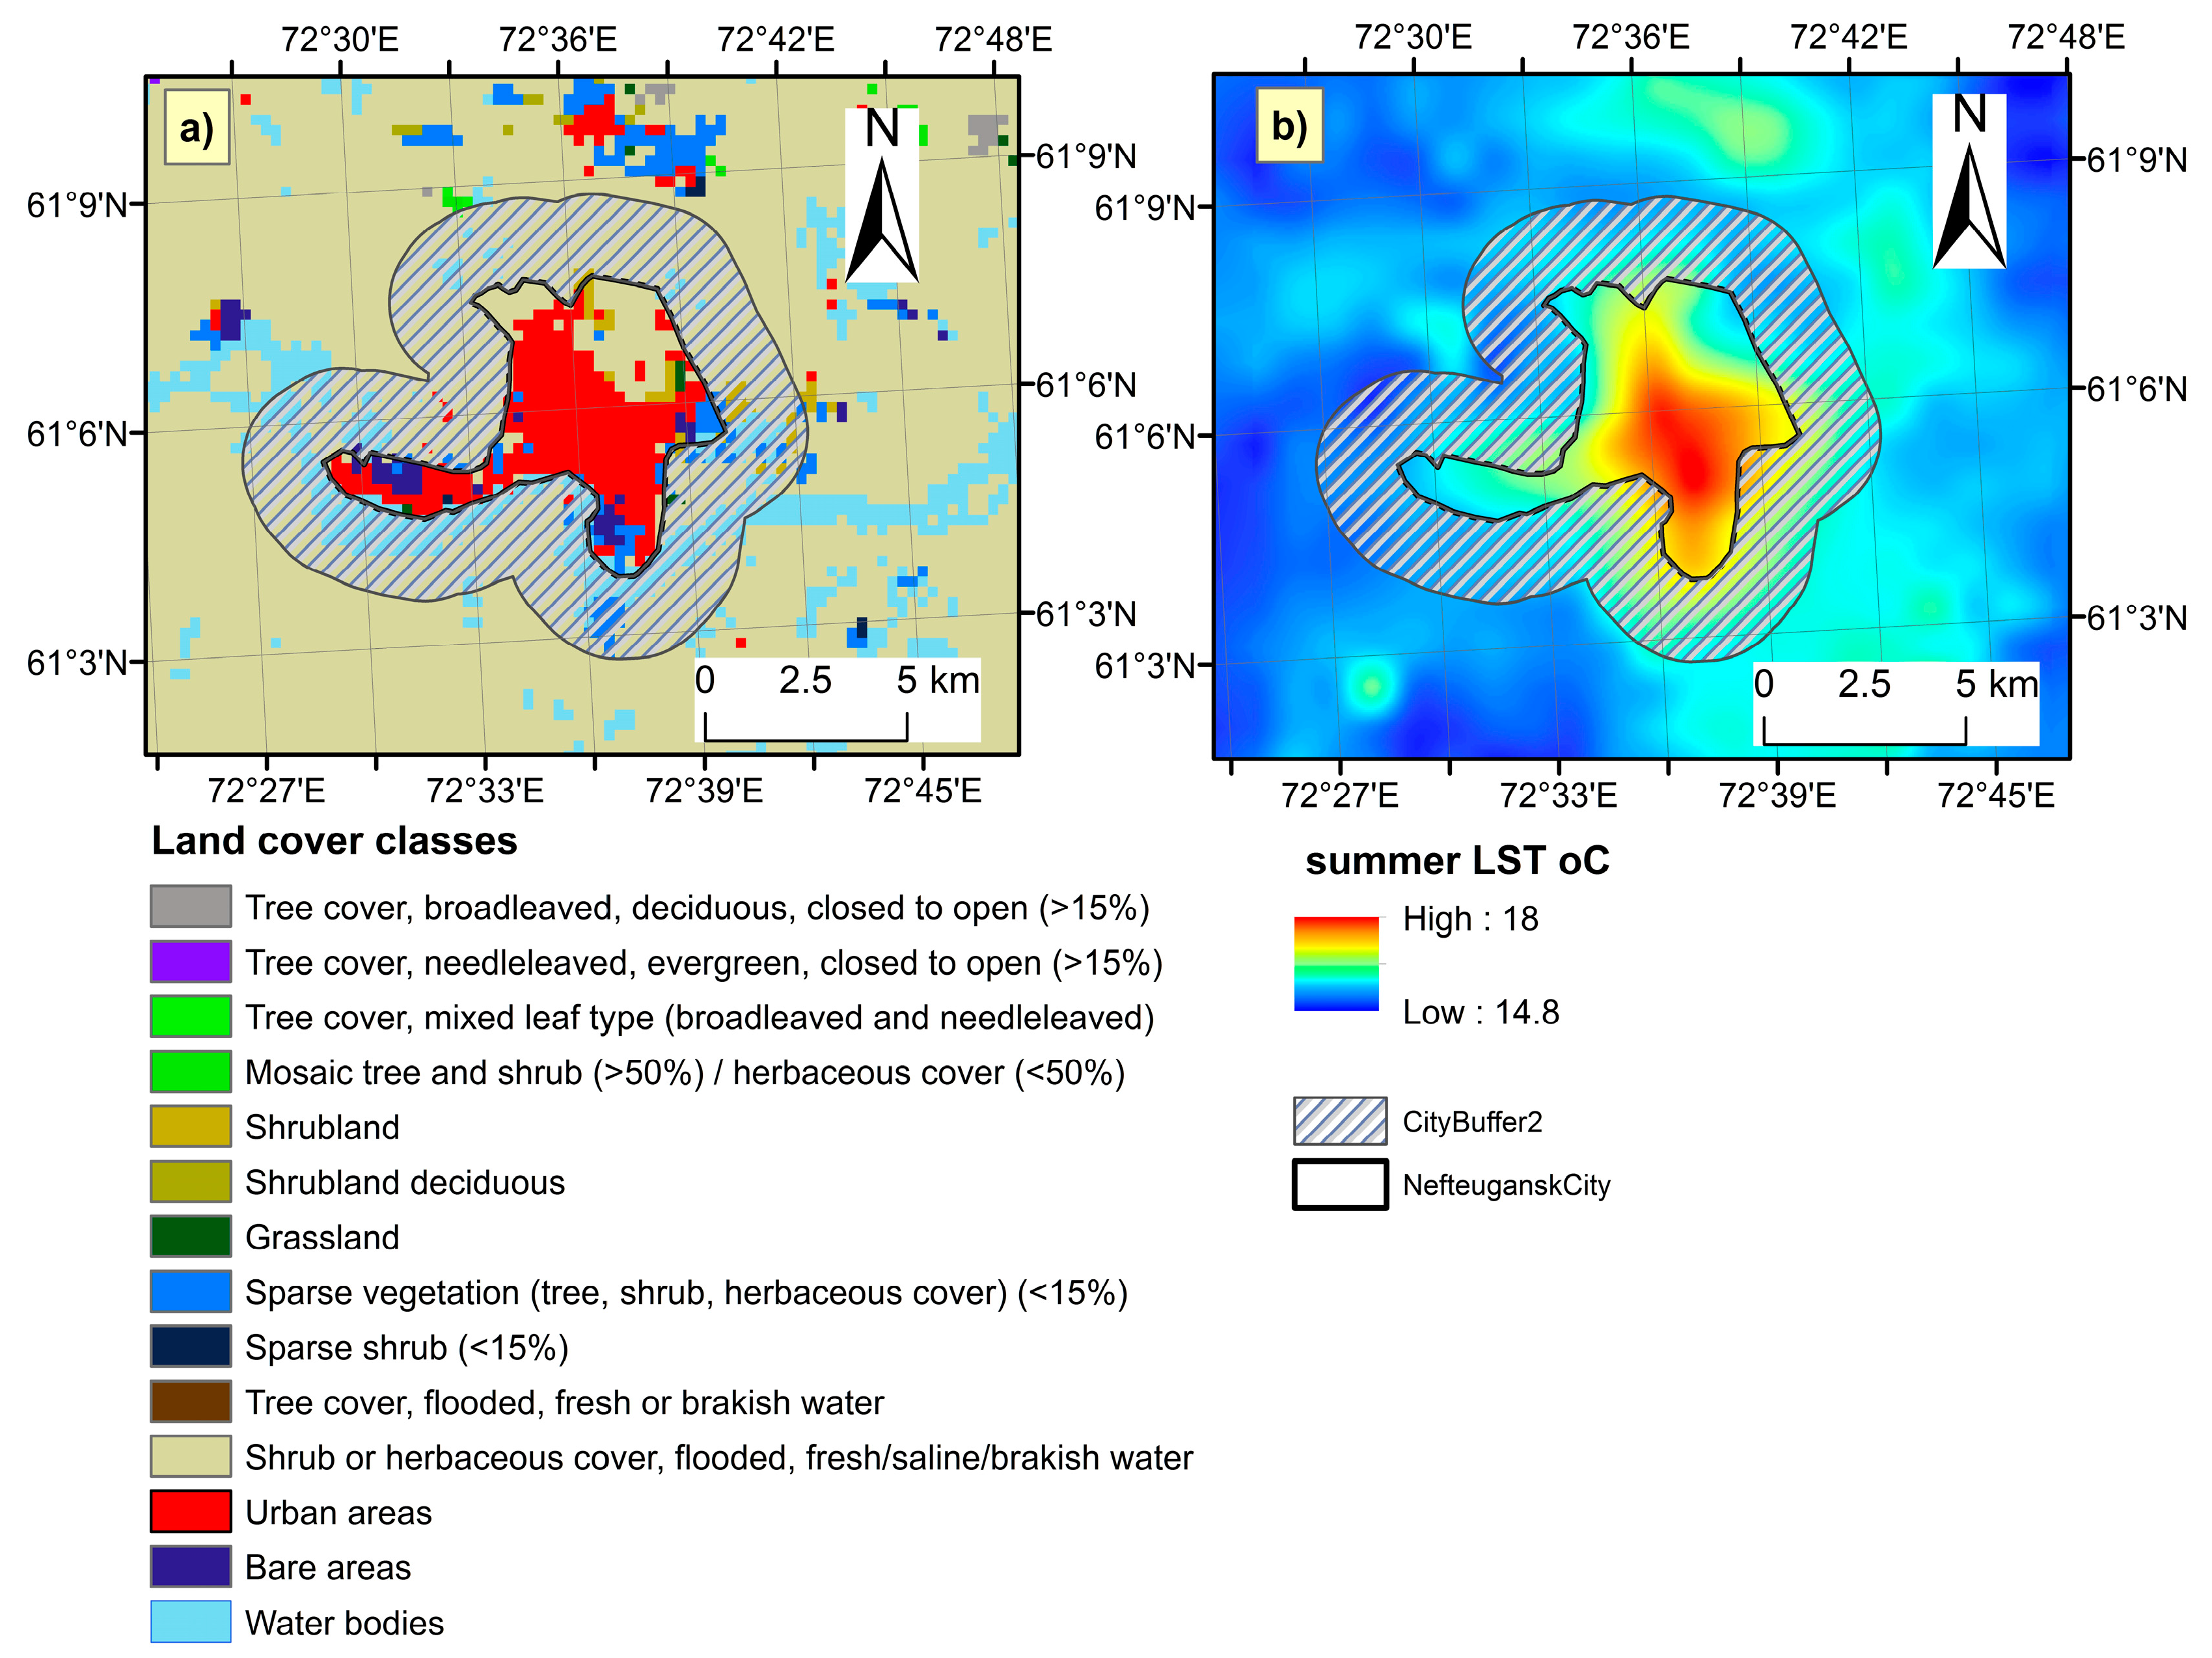
3.1. Urban Heat Island
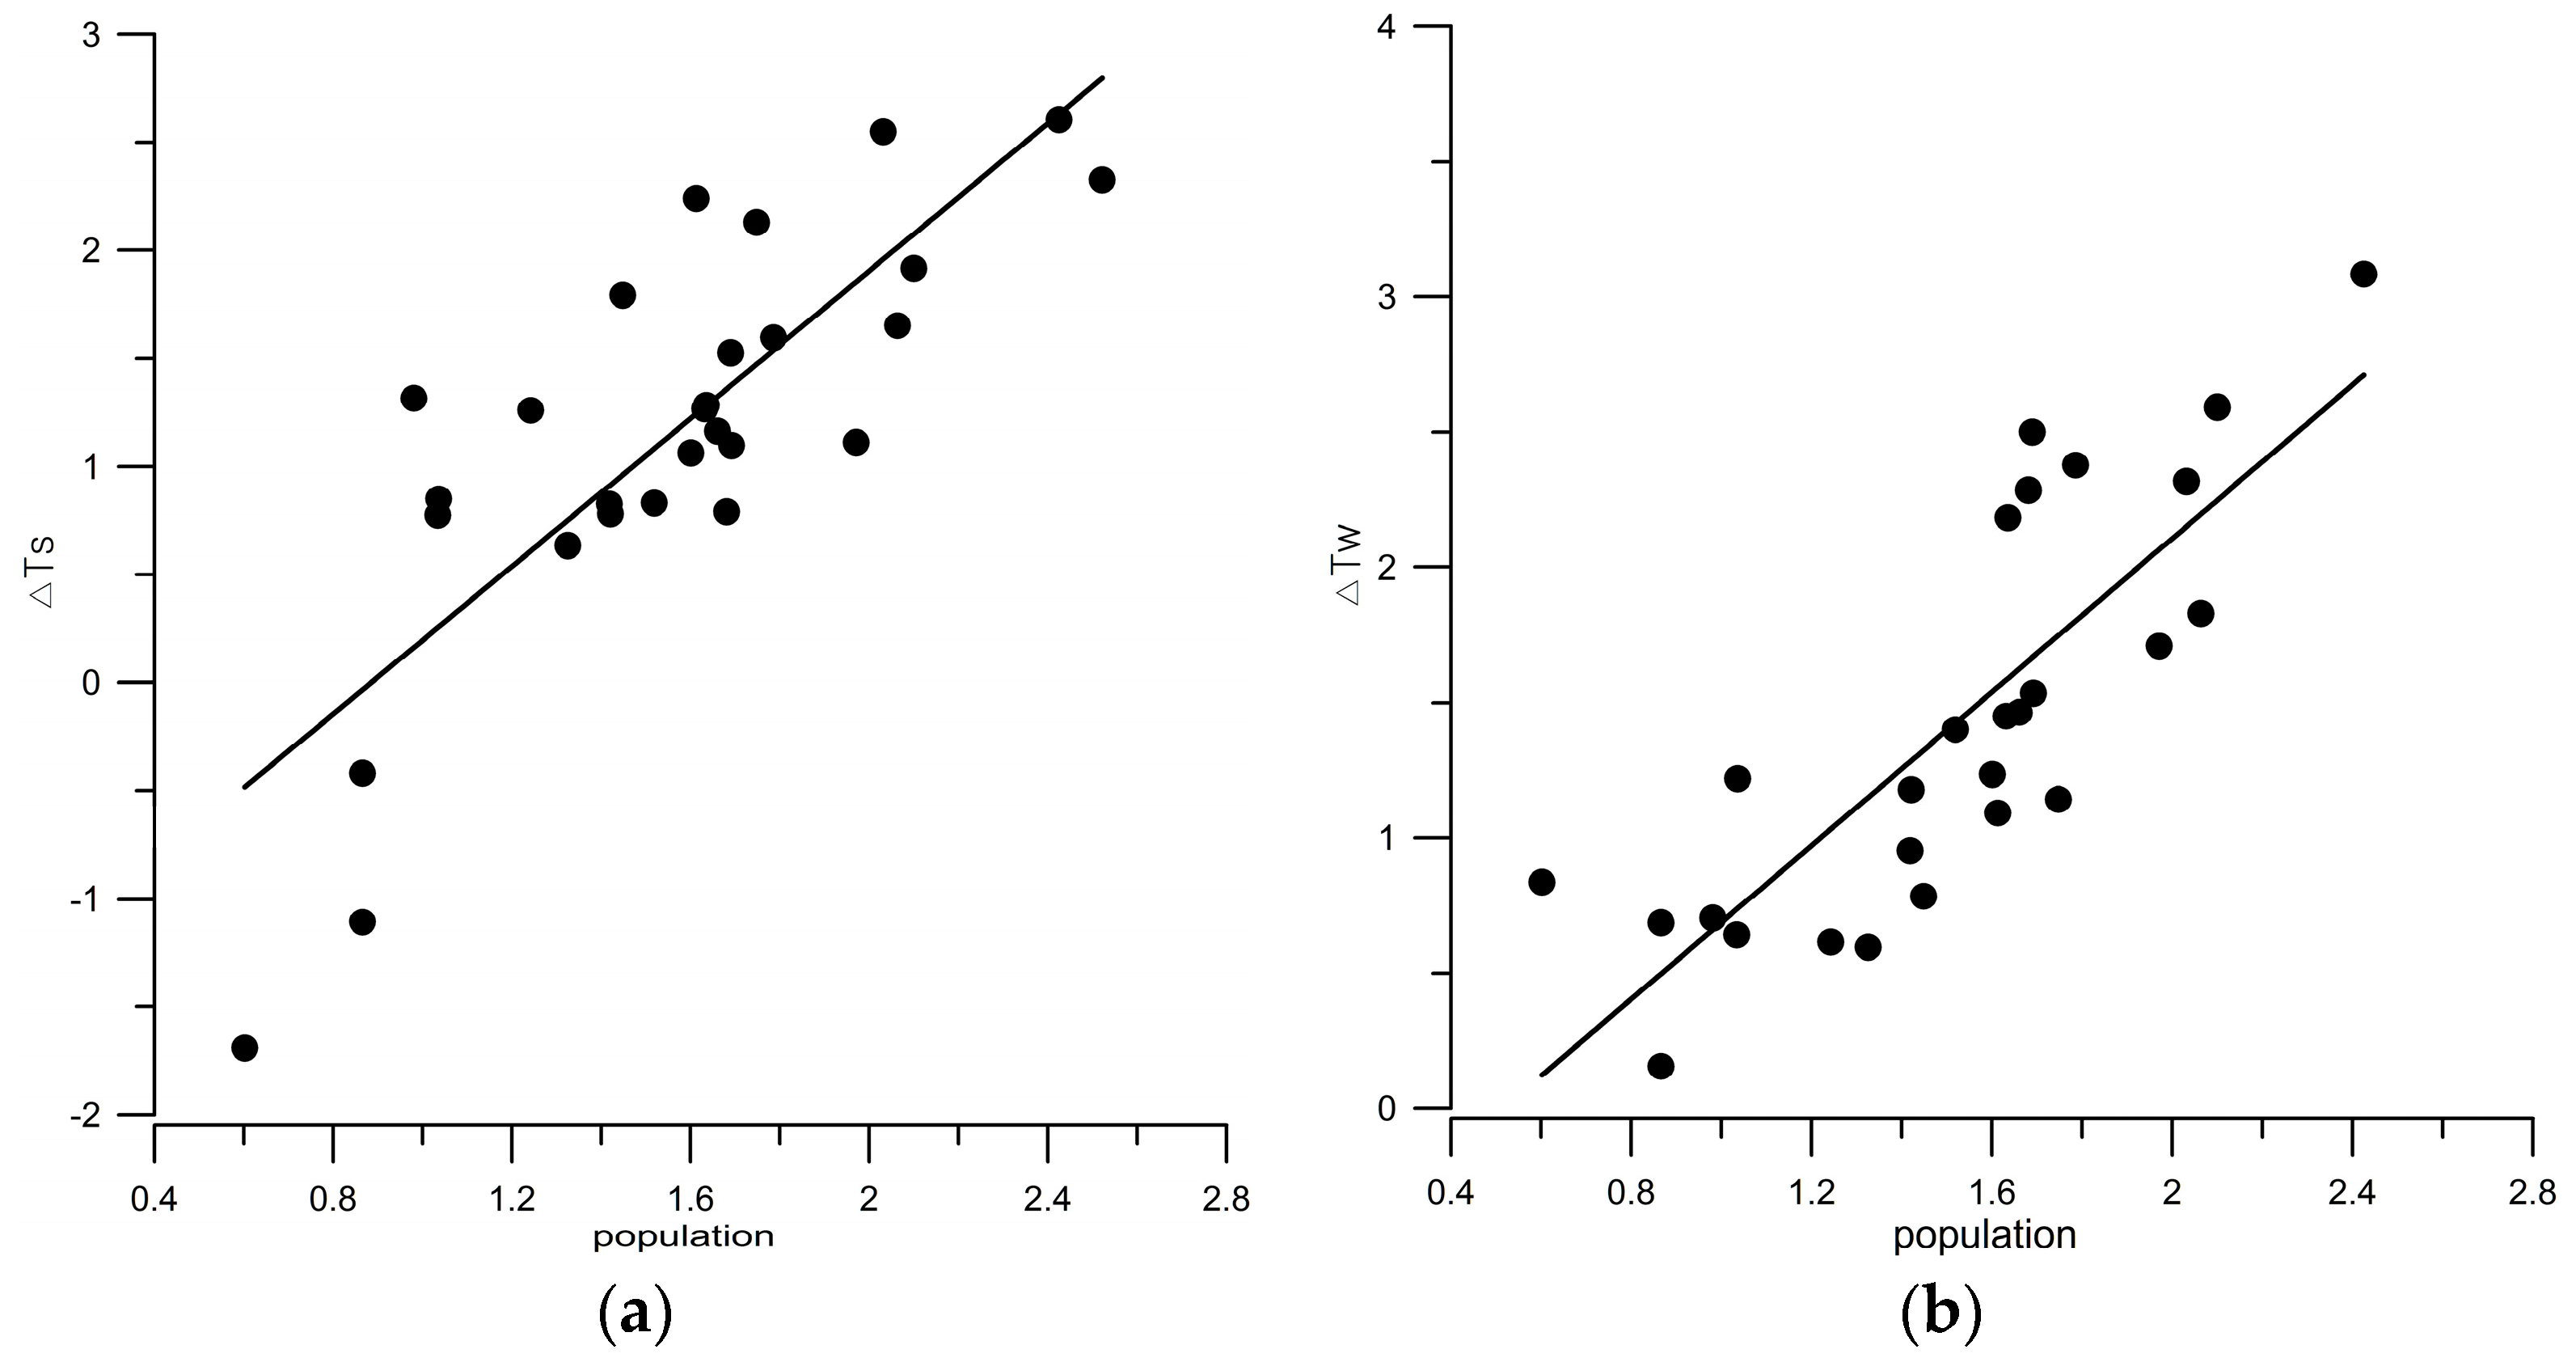
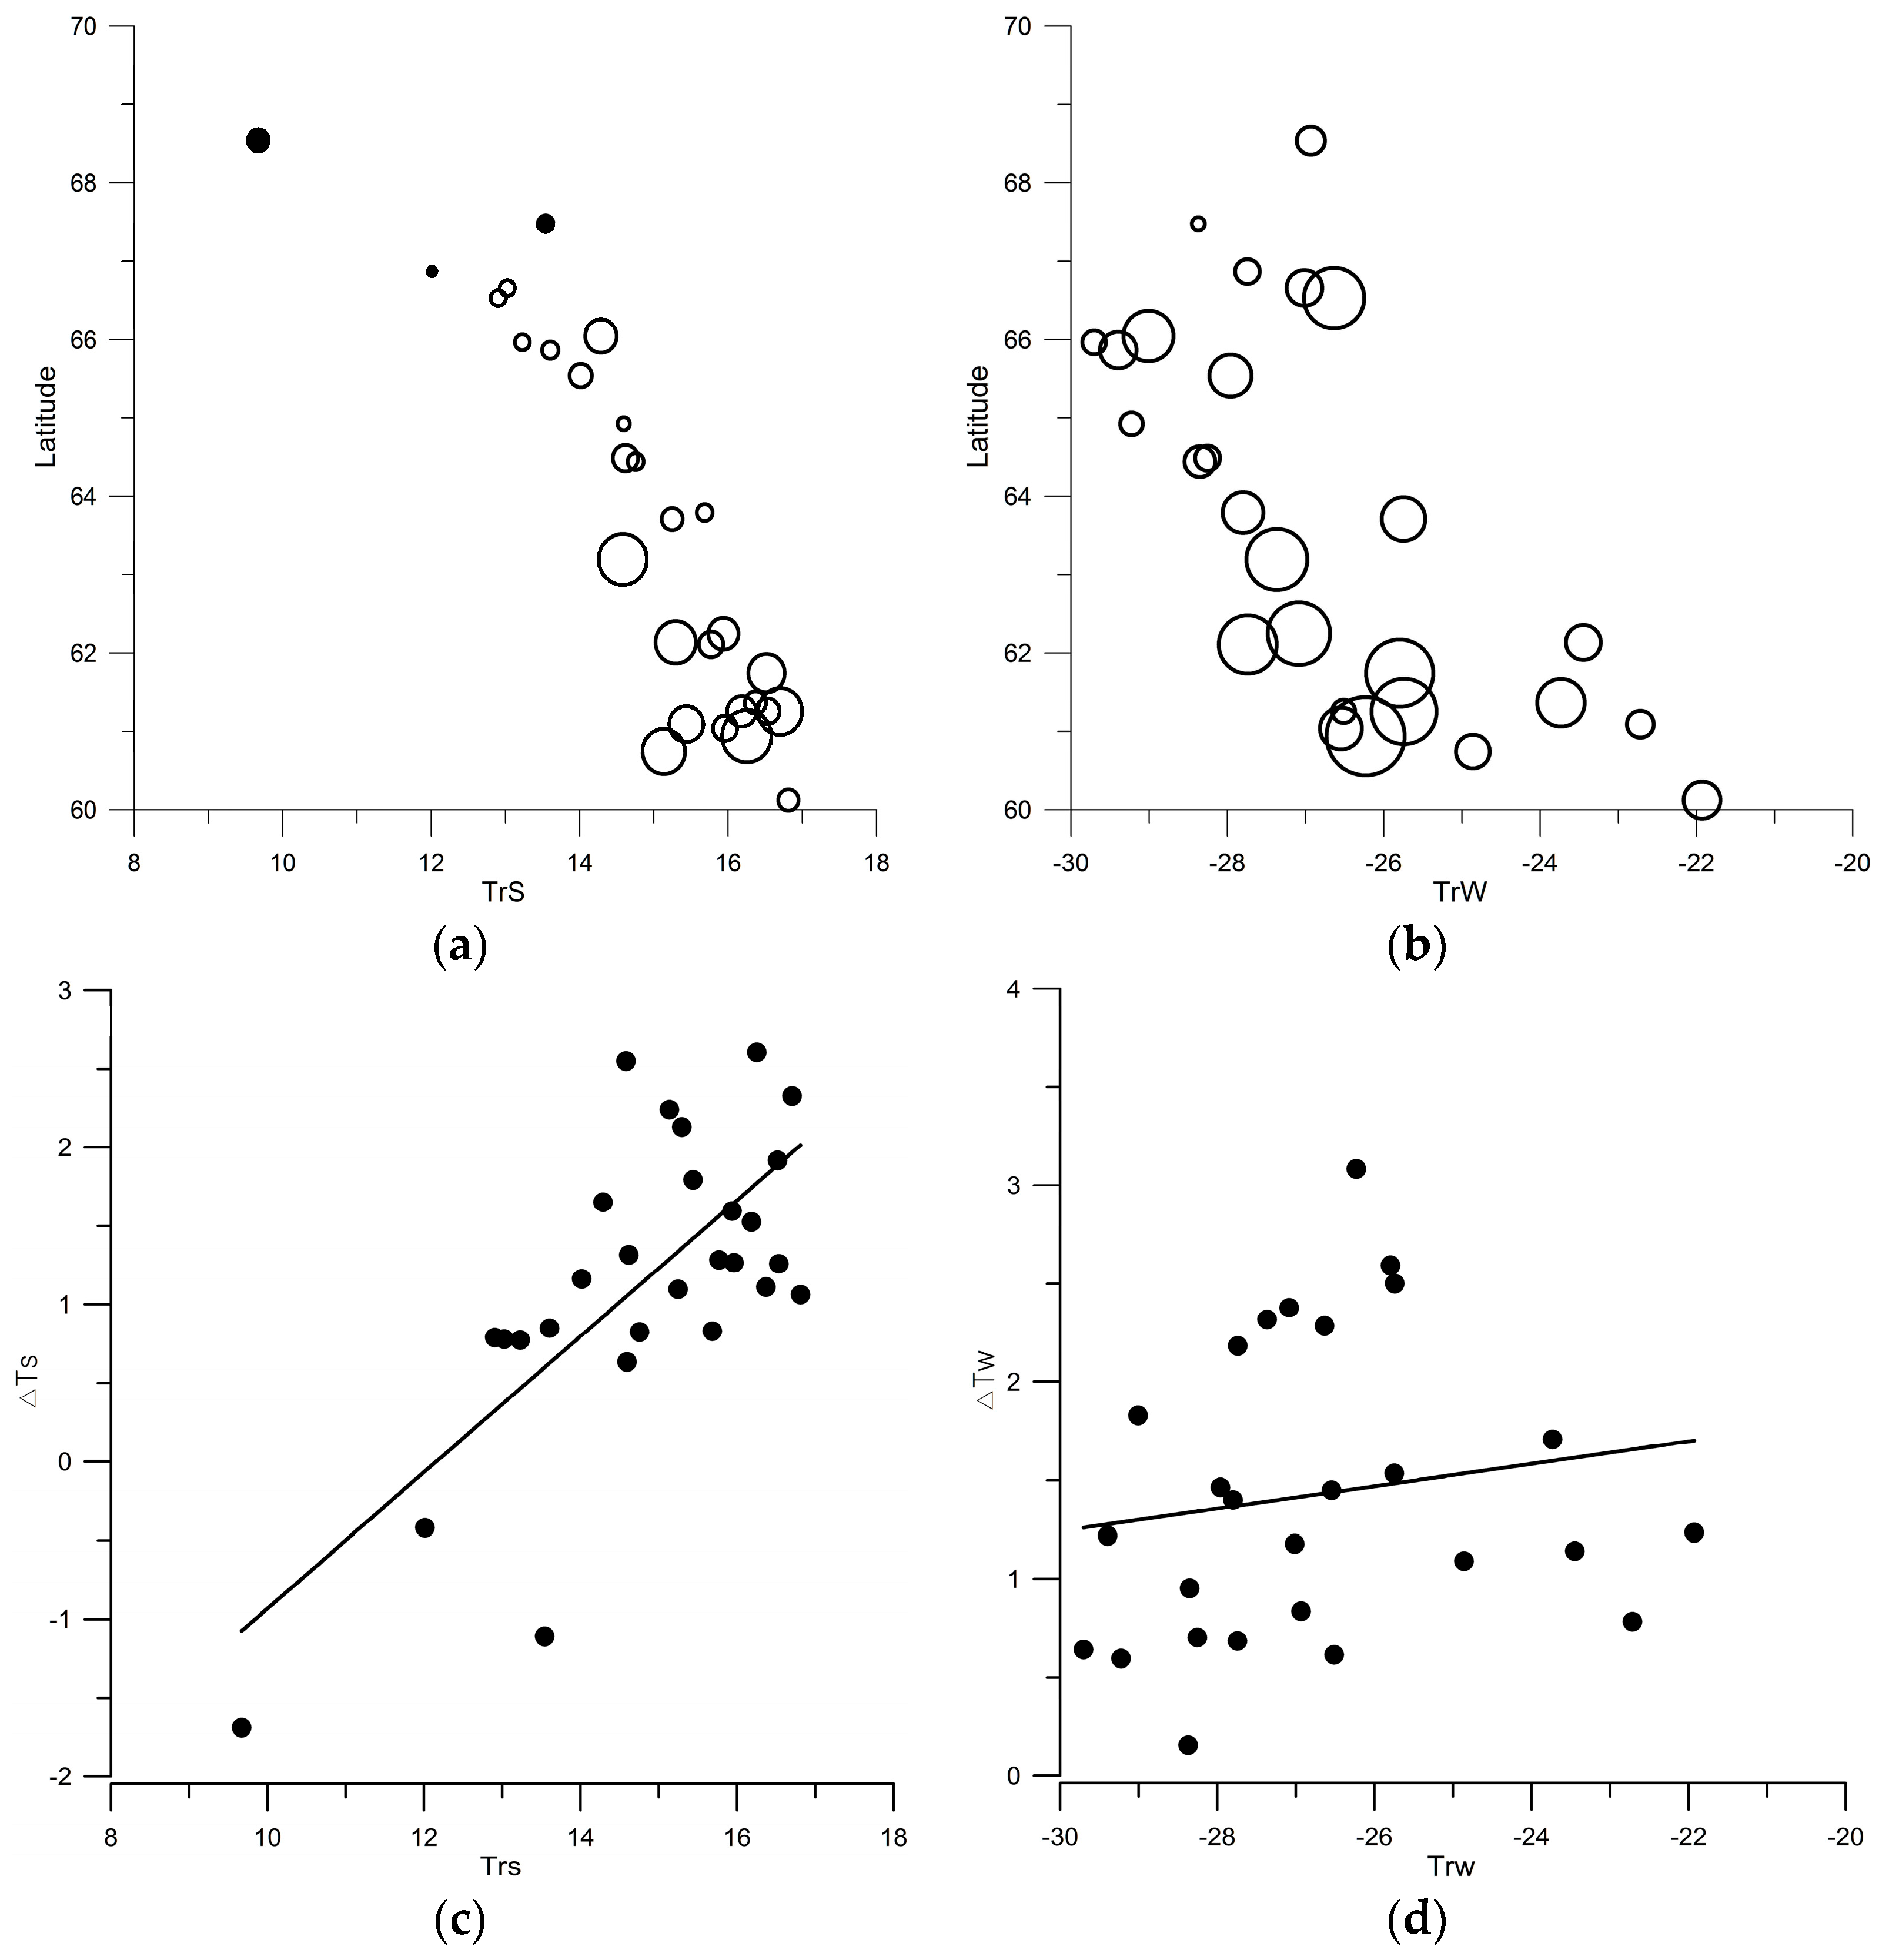
3.2. Correlation and Regression Analysis
3.2.1. Correlation Analysis
3.2.2. Regression Analysis
4. Discussion
5. Conclusions
- (1).
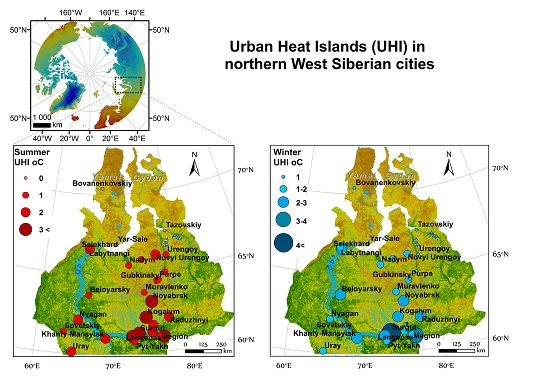
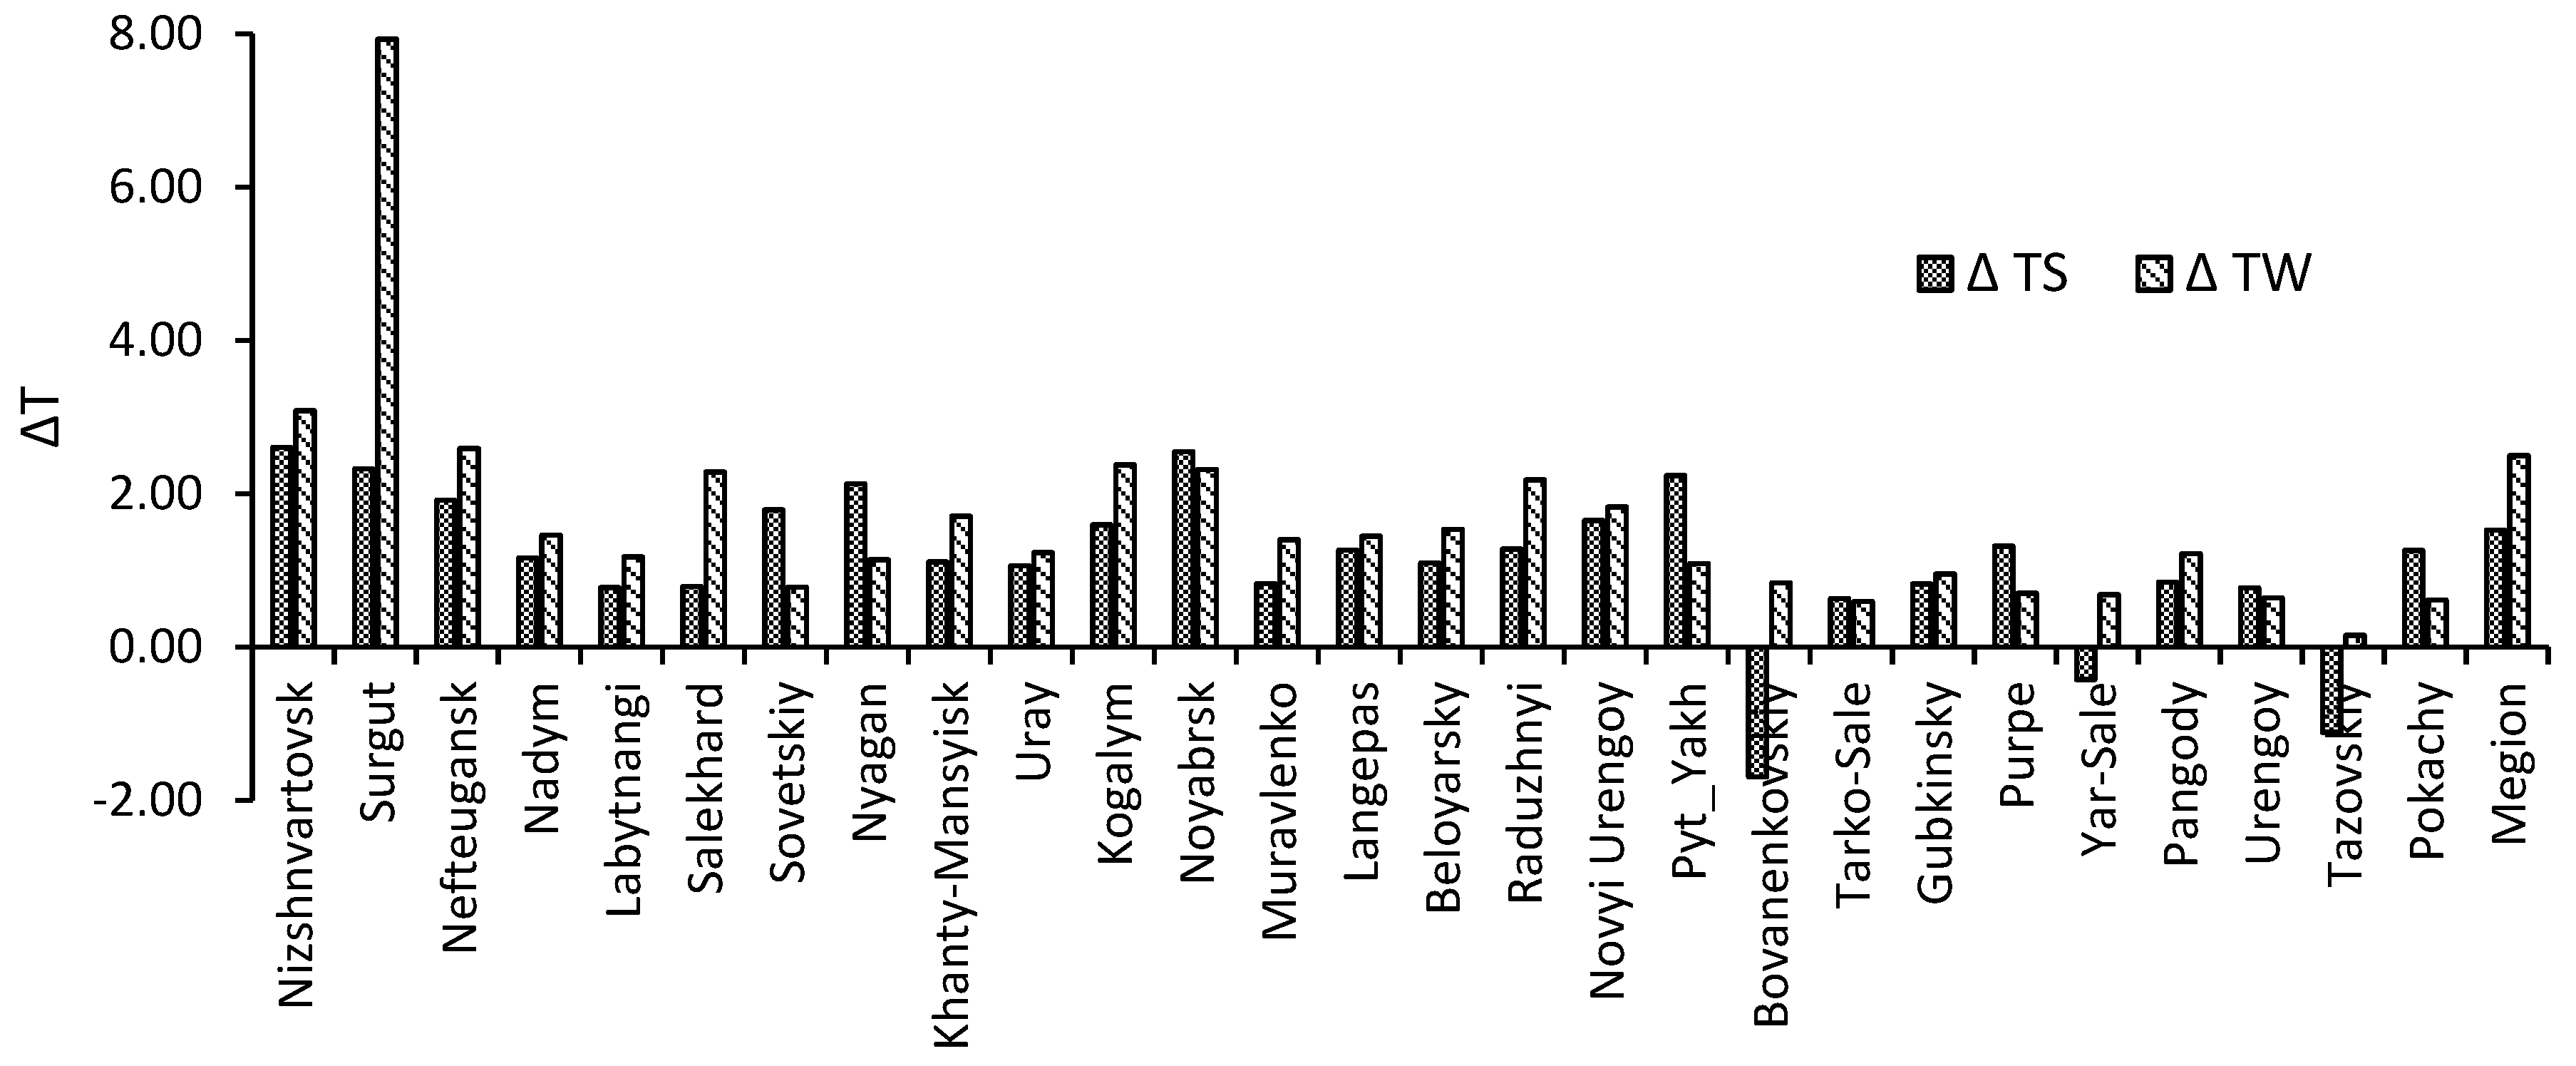
- The analysis of the MODIS LST data products for 2000–2015 in this study revealed that all 28 NWS cities exhibit persistent UHIs. The UHI intensity is seasonally dependent. The seasonal mean is maximal in the winter UHI (1.6 °C). Northern settlements show a smaller UHI (average ΔTw of 1.4 °C and ΔTs of 0.3 °C) compared to the cities in the southern part of the area (average ΔTw of 1.9 °C and ΔTs of 1.1 °C).
- (2).
- The analysis suggested different dominant driving factors for the UHI. In summertime, with its long days, the UHI intensity is mainly determined by surface albedo, reduced evaporation and the amount of incoming solar radiation. In wintertime, with its low temperatures and small amount of solar radiation, the UHI intensity is determined by anthropogenic heat pollution. A special case here is Surgut, which is an extreme example of the release of a huge amount of anthropogenic heat causing a large UHI in winter.
- (3).
- Correlation and regression analyses found the strongest relationships between the UHI (ΔT) and population (log P). Regression models using log P alone can explain 65–67% of the variability of the UHI in the region. Additional explanatory power—at least in summer—is provided by the surrounding background temperatures, which themselves are strongly correlated with latitude. The performed regression analyses thus confirmed the important role of the surrounding temperature in explaining spatial–temporal variation in the UHI intensity. These findings suggest a climatological basis for these phenomena and, given the importance of climatic warming, this aspect deserves future study.
- (4).
- The LC classification was used to distinguish between the urban and rural surfaces following the popular urban buffer approach. This study utilized the SHEI index to measure the surface heterogeneity. The SHEI index is only moderate (max value of 0.6) in NWS. The highest values were found in the northern part, where the land surface around the cities is less anthropogenically modified. The study did not reveal any statistically significant linear relations between ΔT and SHEI. However, a strong non-linearity of any such relations should be expected, as the response is likely to be amplified for certain scales of the surface heterogeneity.
- (5).
- The study found an inverse UHI in the three northernmost cities. To discover the role of different land surface types in UHI formation, further exploration of land surface variables as a predictor for UHI intensity should be pursued in future studies.
Acknowledgments
Author Contributions
Conflicts of Interest
References
- Sailor, D.J.; Lu, L. A top-down methodology for developing diurnal and seasonal anthropogenic heating profiles for urban areas. Atmos. Environ. 2004, 38, 2737–2748. [Google Scholar] [CrossRef]
- Kalnay, E.; Cai, M. Impact of urbanization and land-use change on climate. Nature 2003, 423, 528–531. [Google Scholar] [CrossRef] [PubMed]
- Zhao, L.; Lee, X.; Smith, R.B.; Oleson, K. Strong contributions of local background climate to urban heat islands. Nature 2014, 511, 214–219. [Google Scholar] [CrossRef] [PubMed]
- Zipper, S.C.; Schatz, J.; Singh, A.; Kucharik, C.J.; Townsend, P.A.; Loheide, S.P. Urban heat island impacts on plant phenology: Intra-urban variability and response to land cover. Environ. Res. Lett. 2016, 11, 054023. [Google Scholar] [CrossRef]
- Knapp, S.; Kuhn, I.; Stolle, J.; Klotz, S. Changes in the functional composition of a Central European urban flora over three centuries. Perspectives in Plant Ecology. Evol. Syst. 2010, 12, 235–244. [Google Scholar]
- Alcoforado, M.J.; Andrade, H. Global warming and the urban heat island. In Urban Ecology; Springer US: New York, NY, USA, 2008; pp. 249–262. [Google Scholar]
- Wienert, U.; Kuttler, W. The dependence of the urban heat island intensity on latitude—A statistical approach. Meteorol. Z. 2005, 14, 677–686. [Google Scholar] [CrossRef] [PubMed]
- Hinkel, K.M.; Nelson, F.E. Anthropogenic heat island at Barrow. Alaska, during winter: 2001–2005. J. Geophys. Res. 2007, 112, D06118. [Google Scholar] [CrossRef]
- Konstantinov, P.I.; Grishchenko, M.Y.; Varentsov, M.I. Mapping Urban Heat Islands of Arctic Cities Using Combined Data on Field Measurements and Satellite Images Based on the Example of the City of Apatity (Murmansk Oblast). Izvestiya. Atmos. Ocean. Phys. 2015, 51, 992–998. [Google Scholar] [CrossRef]
- Streletskiy, D.A.; Shiklomanov, N.; Grebenets, V. Changes of foundation bearing capacity due to climate warming in northwest Siberia. Earth Cryosphere 2012, 16, 22–32. [Google Scholar]
- Shiklomanov, N.I.; Streletskiy, D.A.; Swales, T.W.; Kokorev, V.A. Climate change and stability of urban infrastructure in Russian permafrost regions: Prognostic assessment based on GCM climate projections. Geogr. Rev. 2016, 107, 1–18. [Google Scholar] [CrossRef]
- Zhang, X.; Friedl, M.A.; Schaaf, C.B.; Strahler, A.H. Climate controls on vegetation phenological patterns in northern mid- and high latitudes inferred from MODIS data. Glob. Chang. Biol. 2004, 10, 1133–1145. [Google Scholar] [CrossRef]
- Miles, V.; Esau, I. Spatial heterogeneity of greening and browning between and within bioclimatic zones in northern West Siberia. Environ. Res. Let. 2016, 11, 115002. [Google Scholar] [CrossRef]
- Taha, H. Urban climates and heat islands: Albedo, evapotranspiration and anthropogenic heat. Energy Build 1997, 25, 99–103. [Google Scholar] [CrossRef]
- McCarthy, M.P.; Best, M.J.; Betts, R.A. Climate change in cities due to global warming and urban effects. Geophys. Res. Lett. 2010, 37, L09705. [Google Scholar] [CrossRef]
- Imhoff, M.L.; Zhang, P.; Wolfe, R.E.; Bounoua, L. Remote sensing of the urban heat island effect across biomes in the continental USA. Remote Sens. Environ. 2010, 114, 504–513. [Google Scholar] [CrossRef]
- Li, Y.; Zhao, M.; Motesharrei, S.; Mu, Q.; Kalnay, E.; Li, S. Local cooling and warming effects of forests based on satellite observations. Nat. Commun. 2015, 6, 6603. [Google Scholar] [CrossRef] [PubMed]
- Zhou, B.; Rybski, D.; Kropp, J.P. On the statistics of urban heat island intensity. Geophys. Res. Lett. 2013, 40, 5486–5491. [Google Scholar] [CrossRef]
- Oke, T.R. City size and the urban heat island. Atmos. Environ. 1973, 7, 769–779. [Google Scholar] [CrossRef]
- Christen, A.; Vogt, R. Energy and radiation balance of a central European city. Int. J. Climatol. 2004, 24, 1395–1421. [Google Scholar] [CrossRef]
- Voogt, J.A. Urban Heat Island: Hotter Cities. 2004. ActionBioscience.org. Available online: http://www.actionbioscience.org/environment/voogt.html (accessed on 28 August 2017).
- Huang, W.; Li, J.; Guo, Q.; Mansaray, L.R.; Li, X.; Huang, J. A Satellite-Derived Climatological Analysis of Urban Heat Island over Shanghai during 2000–2013. Remote Sens. 2017, 9, 641. [Google Scholar] [CrossRef]
- Peng, S.; Piao, S.; Ciais, P.; Friedlingstein, P.; Ottle, C.; Bréon, F.-M.; Nan, H.; Zhou, L.; Myneni, R.B. Surface Urban Heat Island Across 419 Global Big Cities. Environ. Sci. Technol. 2012, 46, 696–703. [Google Scholar] [CrossRef] [PubMed]
- Hu, L.; Brunsell, N.A. A new perspective to assess the urban heat island through remotely sensed atmospheric profiles. Remote Sens. Environ. 2015, 158, 393–406. [Google Scholar] [CrossRef]
- Bosilovich, M.G. A comparison of MODIS land surface temperature with in situ observations. Geophys. Res. Lett. 2006, 233, L20112. [Google Scholar] [CrossRef]
- Wang, W.; Liang, S.; Meyers, T. Validating MODIS land surface temperature products using long-term nighttime ground measurements. Remote Sens. Environ. 2008, 112, 623–635. [Google Scholar] [CrossRef]
- Clinton, N.; Gong, P. MODIS detected surface urban heat islands and sinks: Global locations and controls. Remote Sens. Environ. 2013, 134, 294–304. [Google Scholar] [CrossRef]
- Davy, R.; Esau, I. Differences in the efficacy of climate forcings explained by variations in atmospheric boundary layer depth. Nat. Commun. 2016, 7, 11690. [Google Scholar] [CrossRef] [PubMed]
- Davy, R.; Esau, I.; Chernokulsky, A.; Outten, S.; Zilitinkevich, S. Diurnal asymmetry to the observed global warming. Int. J. Climatol. 2017, 37, 79–93. [Google Scholar] [CrossRef]
- Kottek, M.; Grieser, J.; Beck, C.; Rudolf, B.; Rubel, F. World Map of the Köppen-Geiger climate classification updated. Meteorol. Z. 2006, 15, 259–263. [Google Scholar] [CrossRef]
- Li, Z.-L.; Tang, B.-H.; Wu, H.; Ren, H.; Yan, G.; Wan, Z.; Trigo, I.F.; Sobrino, J.A. Satellite-derived land surface temperature: Current status and perspectives. Remote Sens. Environ. 2013, 131, 14–37. [Google Scholar] [CrossRef]
- Hachem, S.; Duguay, C.R.; Allard, M. Comparison of MODIS-derived land surface temperatures with ground surface and air temperature measurements in continuous permafrost terrain. Cryosphere 2012, 6, 51–69. [Google Scholar] [CrossRef]
- Schwarz, N.; Lautenbach, S.; Seppelt, R. Exploring indicators for quantifying surface urban heat islands of European cities with MODIS land surface temperatures. Remote Sens. Environ. 2011, 115, 3175–3186. [Google Scholar] [CrossRef]
- Tan, M.; Quantifying, X.L. The effects of settlement size on urban heat islands in fairly uniform geographic areas. Habitat Int. 2015, 49, 100e106. [Google Scholar] [CrossRef]
- Wang, C.; Myint, S.W.; Wang, Z.; Song, J. Spatio-temporal modeling of the urban heat island in the Phoenix metropolitan area: Land use change implications. Remote Sens. 2016, 8, 185. [Google Scholar] [CrossRef]
- Shannon, C. A mathematical theory of communication. Bell Syst. Tech. J. 1948, 27, 379–423. [Google Scholar] [CrossRef]
- Esau, I.; Miles, V.; Davy, R.; Miles, M.; Kurchatova, A. Trends in normalized difference vegetation index (NDVI) associated with urban development in northern West Siberia. Atmos. Chem. Phys. 2016, 16, 9563–9577. [Google Scholar] [CrossRef]
- Esau, I.; Miles, V. Warmer urban climates for development of green spaces in northern Siberian cities. Geogr. Environ. Sustain. 2016, 9, 48–62. [Google Scholar] [CrossRef]
- Brunsell, N.A.; Mechem, D.B.; Anderson, M.C. Surface heterogeneity impacts on boundary layer dynamics via energy balance partitioning. Atmos. Chem. Phys. 2011, 11, 3403–3416. [Google Scholar] [CrossRef]
- Li, D.; Bou-Zeid, E. Synergistic Interactions between Urban Heat Islands and Heat Waves: The Impact in Cities Is Larger than the Sum of Its Parts. J. Appl. Meteorol. Climatol. 2013, 52, 2051–2064. [Google Scholar] [CrossRef]
- Li, D.; Katul, G.G.; Zilitinkevich, S.S. Revisiting the Turbulent Prandtl Number in an Idealized Atmospheric Surface Layer. J. Atmos. Sci. 2015, 72, 2394–2410. [Google Scholar] [CrossRef]
- Oleson, K. Contrasts between Urban and Rural Climate in CCSM4 CMIP5 Climate Change Scenarios. J. Clim. 2012, 25, 1390–1412. [Google Scholar] [CrossRef]
- Beck, P.; Goetz, S. Satellite observations of high northern latitude vegetation productivity changes between 1982 and 2008: Ecological variability and regional differences. Environ. Res. Lett. 2011, 6, 045501. [Google Scholar] [CrossRef]
- Esau, I. Amplification of turbulent exchange over wide Arctic leads: Large-eddy simulation study. J. Geophys. Res. 2007, 112, D08109. [Google Scholar] [CrossRef]
- Van Heerwaarden, C.C.; Mellado, J.P.; Lozar, A.D. Scaling Laws for the Heterogeneously Heated Free Convective Boundary Layer. J. Atmos. Sci. 2014, 71, 3975–4000. [Google Scholar] [CrossRef]
- Oke, T.R. The energetic basis of the urban heat island. Q. J. R. Meteorol. Soc. 1982, 108, 1–24. [Google Scholar] [CrossRef]
- Memon, R.A.; Dennis, L.; Liu, C. A review on the generation, determination and mitigation of Urban Heat Island. J. Environ. Sci. 2008, 20, 120–128. [Google Scholar]
- Zhou, D.; Zhao, S.; Zhang, L.; Sun, G.; Liu, Y. The footprint of urban heat island effect in China. Sci. Rep. 2015, 5, 11160. [Google Scholar] [CrossRef] [PubMed]
- Steeneveld, G.J.; Koopmans, S.; Heusinkveld, B.G.; van Hove, L.W. A.; Holtslag, A.A.M. Quantifying urban heat island effects and human comfort for cities of variable size and urban morphology in the Netherlands. J. Geophys. Res. 2011, 116, D20129. [Google Scholar] [CrossRef]
- Stroppiana, D.; Antoninetti, M.; Brivio, P.A. Seasonality of MODIS LST over Southern Italy and correlation with land cover, topography and solar radiation. Eur. J. Remote Sens. 2014, 47, 133–152. [Google Scholar] [CrossRef]
- Cheval, S.; Dumitrescu, A. The summer surface urban heat island of Bucharest (Romania) retrieved from MODIS images. Theor. Appl. Climatol. 2015, 121, 631–640. [Google Scholar] [CrossRef]
- Tomlinson, C.J.; Chapman, L.; Thornes, J.E.; Baker, C.J. Derivation of Birmingham’s summer surface urban heat island from MODIS satellite images. Int. J. Climatol. 2012, 32, 214–224. [Google Scholar] [CrossRef]


| Value | Label |
|---|---|
| 20 | Mosaic cropland (50–70%)/vegetation (grassland/shrubland/forest; 20–50%) |
| 30 | Mosaic vegetation (grassland/shrubland/forest; 50–70%)/cropland (20–50%) |
| 40 | Closed to open (>15%) broad-leaved evergreen or semi-deciduous forest (>5 m) |
| 50 | Closed (>40%) broad-leaved deciduous forest (>5 m) |
| 60 | Open (15–40%) broad-leaved deciduous forest/woodland (>5 m) |
| 70 | Closed (>40%) needle-leaved evergreen forest (>5 m) |
| 90 | Open (15–40%) needle-leaved deciduous or evergreen forest (>5 m) |
| 100 | Closed to open (>15%) mixed broad-leaved and needle-leaved forest (>5 m) |
| 110 | Mosaic forest or shrubland (50–70%)/grassland (20–50%) |
| 120 | Mosaic grassland (50–70%)/forest or shrubland (20–50%) |
| 130 | Closed to open (>15%) (broad- or needle-leaved, evergreen or deciduous) shrubland (<5 m) |
| 140 | Closed to open (>15%) herbaceous vegetation (grassland, or lichens/mosses) |
| 150 | Sparse (<15%) vegetation |
| 170 | Closed (>40%) broad-leaved forest or shrubland permanently flooded |
| 180 | Closed to open (>15%) grassland or woody vegetation on regularly flooded or waterlogged soil water |
| 190 | Artificial surfaces and associated areas (urban areas >50%) |
| 200 | Bare areas |
| 210 | Water bodies |
| (a) Summer | |||||
| Trs | ΔTs | SHEI | log(P) | Area (km2) | |
| |ϕ| | –0.93 | –0.77 | 0.44 | –0.63 | –0.38 |
| Trs | 0.73 | –0.44 | 0.67 | 0.40 | |
| ΔTs | –0.25 | 0.81 | 0.50 | ||
| SHEI | –0.36 | –0.30 | |||
| log(P) | 0.61 | ||||
| (b) Winter | |||||
| Trw | ΔTw | SHEI | log(P) | Area (km2) | |
| |ϕ| | –0.63 | –0.39 | 0.47 | –0.62 | –0.36 |
| Trw | 0.15 | –0.28 | 0.35 | 0.01 | |
| ΔTw | –0.52 | 0.82 | 0.64 | ||
| SHEI | –0.45 | –0.32 | |||
| log(P) | 0.60 | ||||
© 2017 by the authors. Licensee MDPI, Basel, Switzerland. This article is an open access article distributed under the terms and conditions of the Creative Commons Attribution (CC BY) license (http://creativecommons.org/licenses/by/4.0/).
Share and Cite
Miles, V.; Esau, I. Seasonal and Spatial Characteristics of Urban Heat Islands (UHIs) in Northern West Siberian Cities. Remote Sens. 2017, 9, 989. https://doi.org/10.3390/rs9100989
Miles V, Esau I. Seasonal and Spatial Characteristics of Urban Heat Islands (UHIs) in Northern West Siberian Cities. Remote Sensing. 2017; 9(10):989. https://doi.org/10.3390/rs9100989
Chicago/Turabian StyleMiles, Victoria, and Igor Esau. 2017. "Seasonal and Spatial Characteristics of Urban Heat Islands (UHIs) in Northern West Siberian Cities" Remote Sensing 9, no. 10: 989. https://doi.org/10.3390/rs9100989
APA StyleMiles, V., & Esau, I. (2017). Seasonal and Spatial Characteristics of Urban Heat Islands (UHIs) in Northern West Siberian Cities. Remote Sensing, 9(10), 989. https://doi.org/10.3390/rs9100989