Article

Wake Component Detection in X-Band SAR Images for Ship Heading and Velocity Estimation

by
Maria Daniela Graziano
1,*,
Marco D’Errico
2 and
Giancarlo Rufino
1
1
Department of Industrial Engineering, University of Naples “Federico II”, Piazzale Tecchio, 80, 80125 Naples, Italy
2
Department of Industrial and Information Engineering, Second University of Naples, via Roma, 29, 81031 Aversa, Italy
*
Author to whom correspondence should be addressed.
Remote Sens. 2016, 8(6), 498; https://doi.org/10.3390/rs8060498
Submission received: 27 January 2016 / Revised: 25 May 2016 / Accepted: 7 June 2016 / Published: 14 June 2016

Abstract

:
A new algorithm for ship wake detection is developed with the aim of ship heading and velocity estimation. It exploits the Radon transform and utilizes merit indexes in the intensity domain to validate the detected linear features as real components of the ship wake. Finally, ship velocity is estimated by state-of-the-art techniques of azimuth shift and Kelvin arm wavelength. The algorithm is applied to 13 X-band SAR images from the TerraSAR-X and COSMO/SkyMed missions with different polarization and incidence angles. Results show that the vast majority of wake features are correctly detected and validated also in critical situations, i.e., when multiple wake appearances or dark areas not related to wake features are imaged. The ship route estimations are validated with truth-at-sea in seven cases. Finally, it is also verified that the algorithm does not detect wakes in the surroundings of 10 ships without wake appearances.

Graphical Abstract

1. Introduction

Maritime traffic monitoring is gaining great advantages from spaceborne SAR imagery. Several international projects are investigating an operational ship monitoring system [1,2,3,4], and many experimental results are available on ship detection in SAR images [5,6,7,8,9,10]. In this ambit, ship wake detection not only has strong interest as the validation of ship presence, but also generates data useful for ship route estimation. In fact, if wake direction provides information about ship heading, methodologies have also been developed to derive ship velocity from additional wake-based information [11,12,13,14,15,16].
The typical ship-wake appearance in high-resolution SAR images exhibits the assessed structures detailed in [17]. A central dark line is the signature of the turbulent wake, which is aligned with the ship longitudinal axis. Two bright linear features (narrow-V wakes) can be seen within a half-angle ranging from 1.5° to 4° with respect to the turbulent dark line. The most external couple of wakes are representative of the Kelvin arms, which develop in an angle with an aperture of ±19.5° with respect to the turbulent dark line. Finally, it is rarely possible to observe the alternating dark and bright wave pattern roughly parallel to the ship track, called internal wave wakes [17]. However, as it is more apparent in L-band rather than in X-band or in C-band for the longer L-band Bragg waves’ persistence [17], it is not included in the proposed wake detection process.
Since wakes appear in SAR images as dark or bright straight lines, the existing algorithms for wake detection exploit the classical linear feature detection methods, such as Radon [18] or Hough [19] transforms, which convert bright (dark) lines in the input domain into peaks (troughs) in the transformed domain. It has been shown that the Hough transform is unsuited for wake detection due to a too heavy preprocessing phase [20], and the Radon transform utilization [21] is encouraged by the low computational cost of the inverse transform, which can be performed by FFT. Some authors [15,22,23] proposed techniques to enhance the peaks of the wake features and applied thresholding techniques to detect such peaks. Tunaley [22] identifies the portion of Radon transform interested by the wake feature under analysis as the area in the Radon domain comprised within two sinusoidal curves. Rey et al. [23] suggest to manually size the subsets of the SAR image accordingly to the wake length. Zilmann et al. [15] identify a region in the Radon domain where the transform is characterized by constant grey, i.e., intermediate level, and its mean value is used to detect troughs and peaks whose values are respectively below and above the mean value of the background domain.
With reference to ship route estimation, the most used and assessed technique is based on the evaluation of the azimuth displacement between ship and ship-wake vertex [11,12,13]. A conventional SAR processor, in fact, erroneously focuses on moving targets, focused with an azimuth offset with respect to their true position, which depends on the target-radar radial velocity [12]. Results on 250 wakes extracted from medium to low resolution SAR data (Radarsat-1, ERS, Seasat) [14] show that the accuracy of the computed velocity is within about ±15 percent of the true speed for most of the images, provided that the wakes exhibit a clear appearance and are not closely aligned with the azimuth direction. A more recent technique is based on the analysis of the Kelvin arms, which exhibit a dark/bright pattern whose wavelength depends on the gravity acceleration and on the ship velocity [15,16].
In this paper, a wake detection algorithm based on the Radon transform is presented. Differently from the literature, the bright/dark dots in the transformed domain are detected considering their angular distance as foreseen by hydrodynamics [17]. In addition, they are validated as representative of the ship wake components by means of novel merit indexes in the intensity domain. State-of-the-art techniques for heading and velocity estimation are also incorporated in the processing. Algorithm validation is performed on 13 X-band SAR images from the TerraSAR-X and COSMO/SkyMed missions, with different polarization and incidence angles.

2. Wake-Based Method for Ship Heading and Velocity Estimation

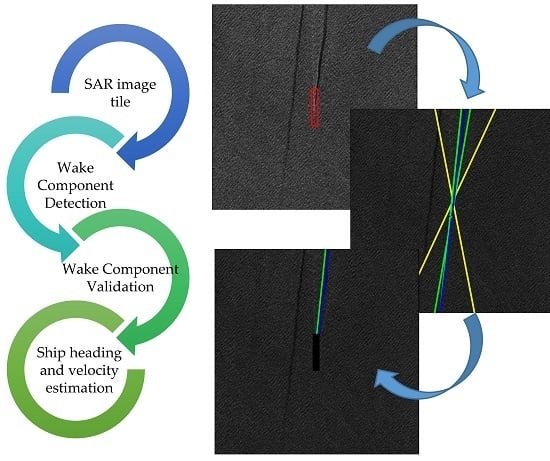
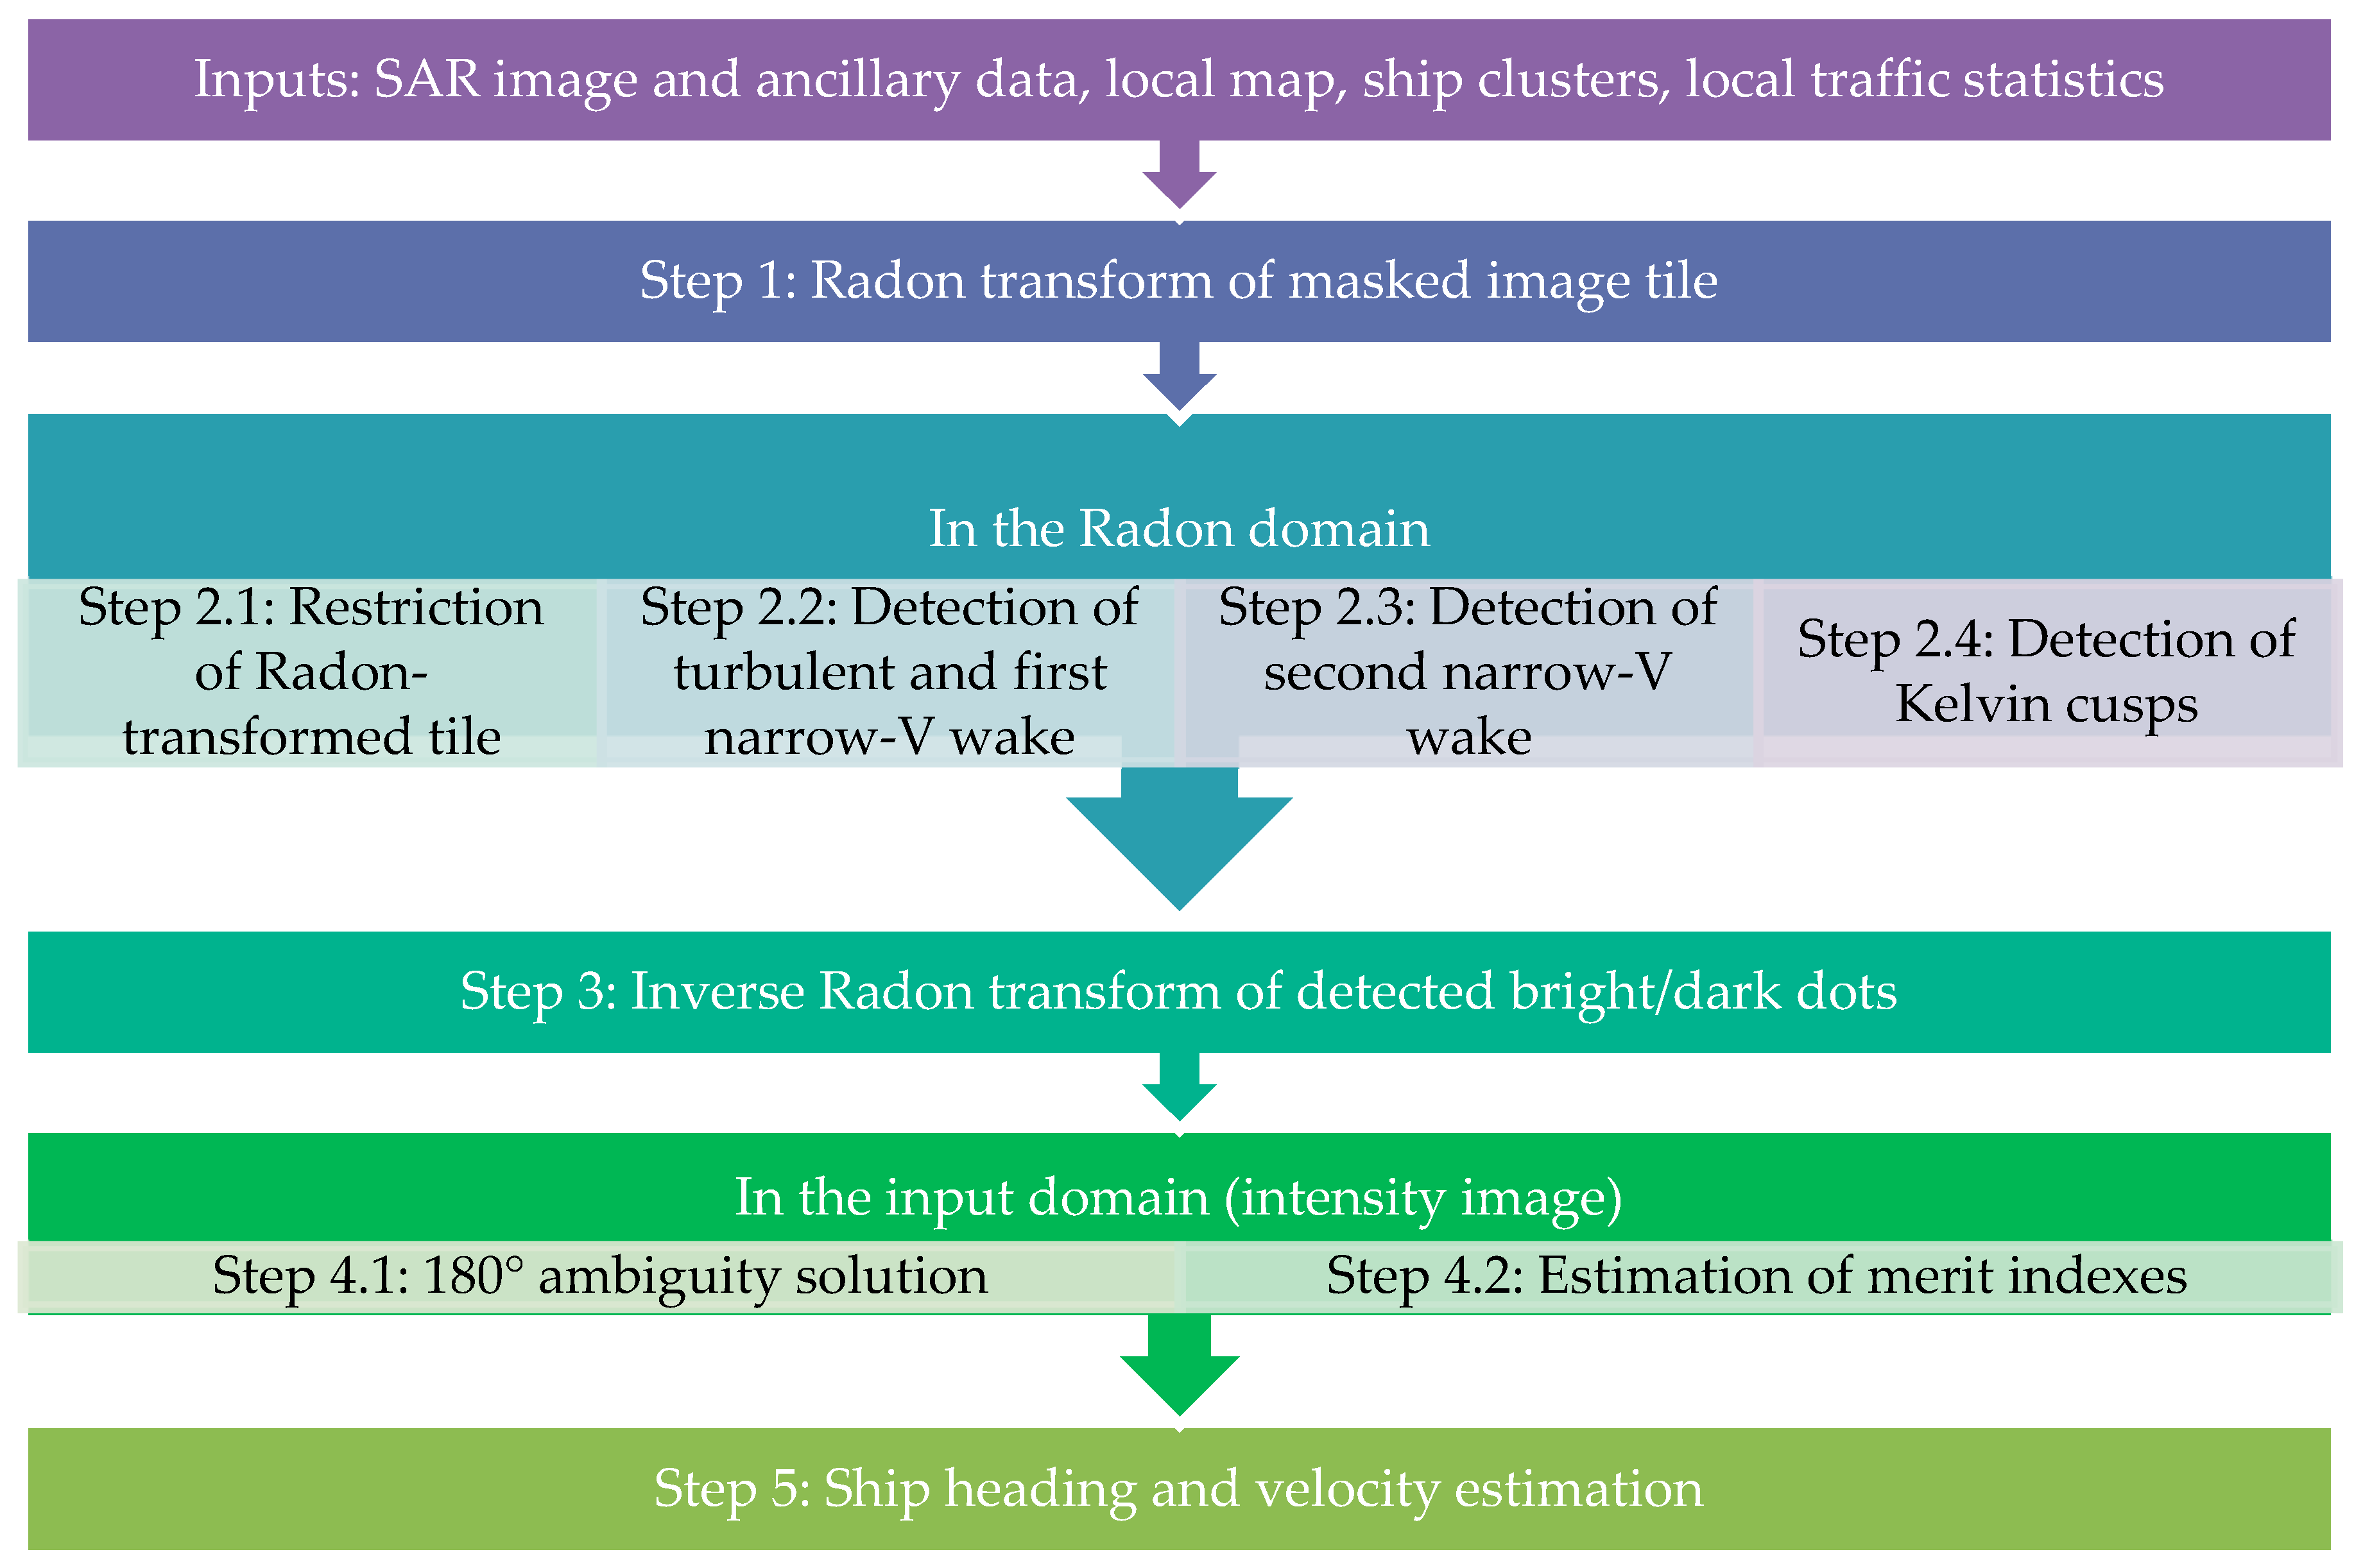
2.1. Algorithm Overview and Objectives

The algorithm herein presented is aimed at estimating ship heading and velocity. In addition, solutions reducing the efforts of human operators are pursued, in view of fully-automatic procedures for future inclusion in a potentially operational environment. In this respect, the presented algorithm is designed to look for a wake structure, always formed by: one central dark line (turbulent wake), two pairs of bright linear features (narrow-V wake and Kelvin arms), with an azimuth offset between ship and wake vertex. Since it is well known that wake appearance can, in practice, have less features imaged than the above five ones, a successive analysis is devoted to the confirmation (rejection) of the identified linear structures as real (false) components of the ship wake.
The proposed algorithm introduces evolutions with respect the state-of-the-art in both the detection and the confirmation phases. In particular, detection is performed considering the angular relations among the components of the wake structures as foreseen by hydrodynamics theory [17]. The confirmation phase is designed in order to mitigate the main limitations of state-of-the-art algorithms, such as the utilization of thresholding techniques [14,15,23]. For low threshold levels, in fact, many peaks can come up, mostly caused by the integration of a noisy clutter (which some authors [21,22] try to mitigate with image preprocessing). If the threshold is set high, weak structures can be masked if: (1) shorter than image/subset dimension and/or (3) fainter than the noisy clutter. In addition, thresholding techniques typically require intense customization, which is difficult to automate.
The algorithm herein developed (Figure 1) still follows a wake-based approach because of its maturity and assessed capability. First, a Radon-based detection phase identifies a single trough relative to the turbulent wake and two pairs of peaks, representative of narrow-V and Kelvin wakes. Then, both dark and bright dots are validated as representative of real wake structures by merit indexes.
It is worth noting that a Radon domain point only identifies a line. Therefore, the above five lines also extend before the bow, while the wake features are half-lines starting from the ship’s true position; hence, the so-called 180° ambiguity in ship heading results and has to be solved (see Section 2.3 and Section 3 for details). After wake component identification and validation, ship velocity is estimated by both techniques of azimuth shift and Kelvin pattern wavelength.
The presented main algorithm originalities are:
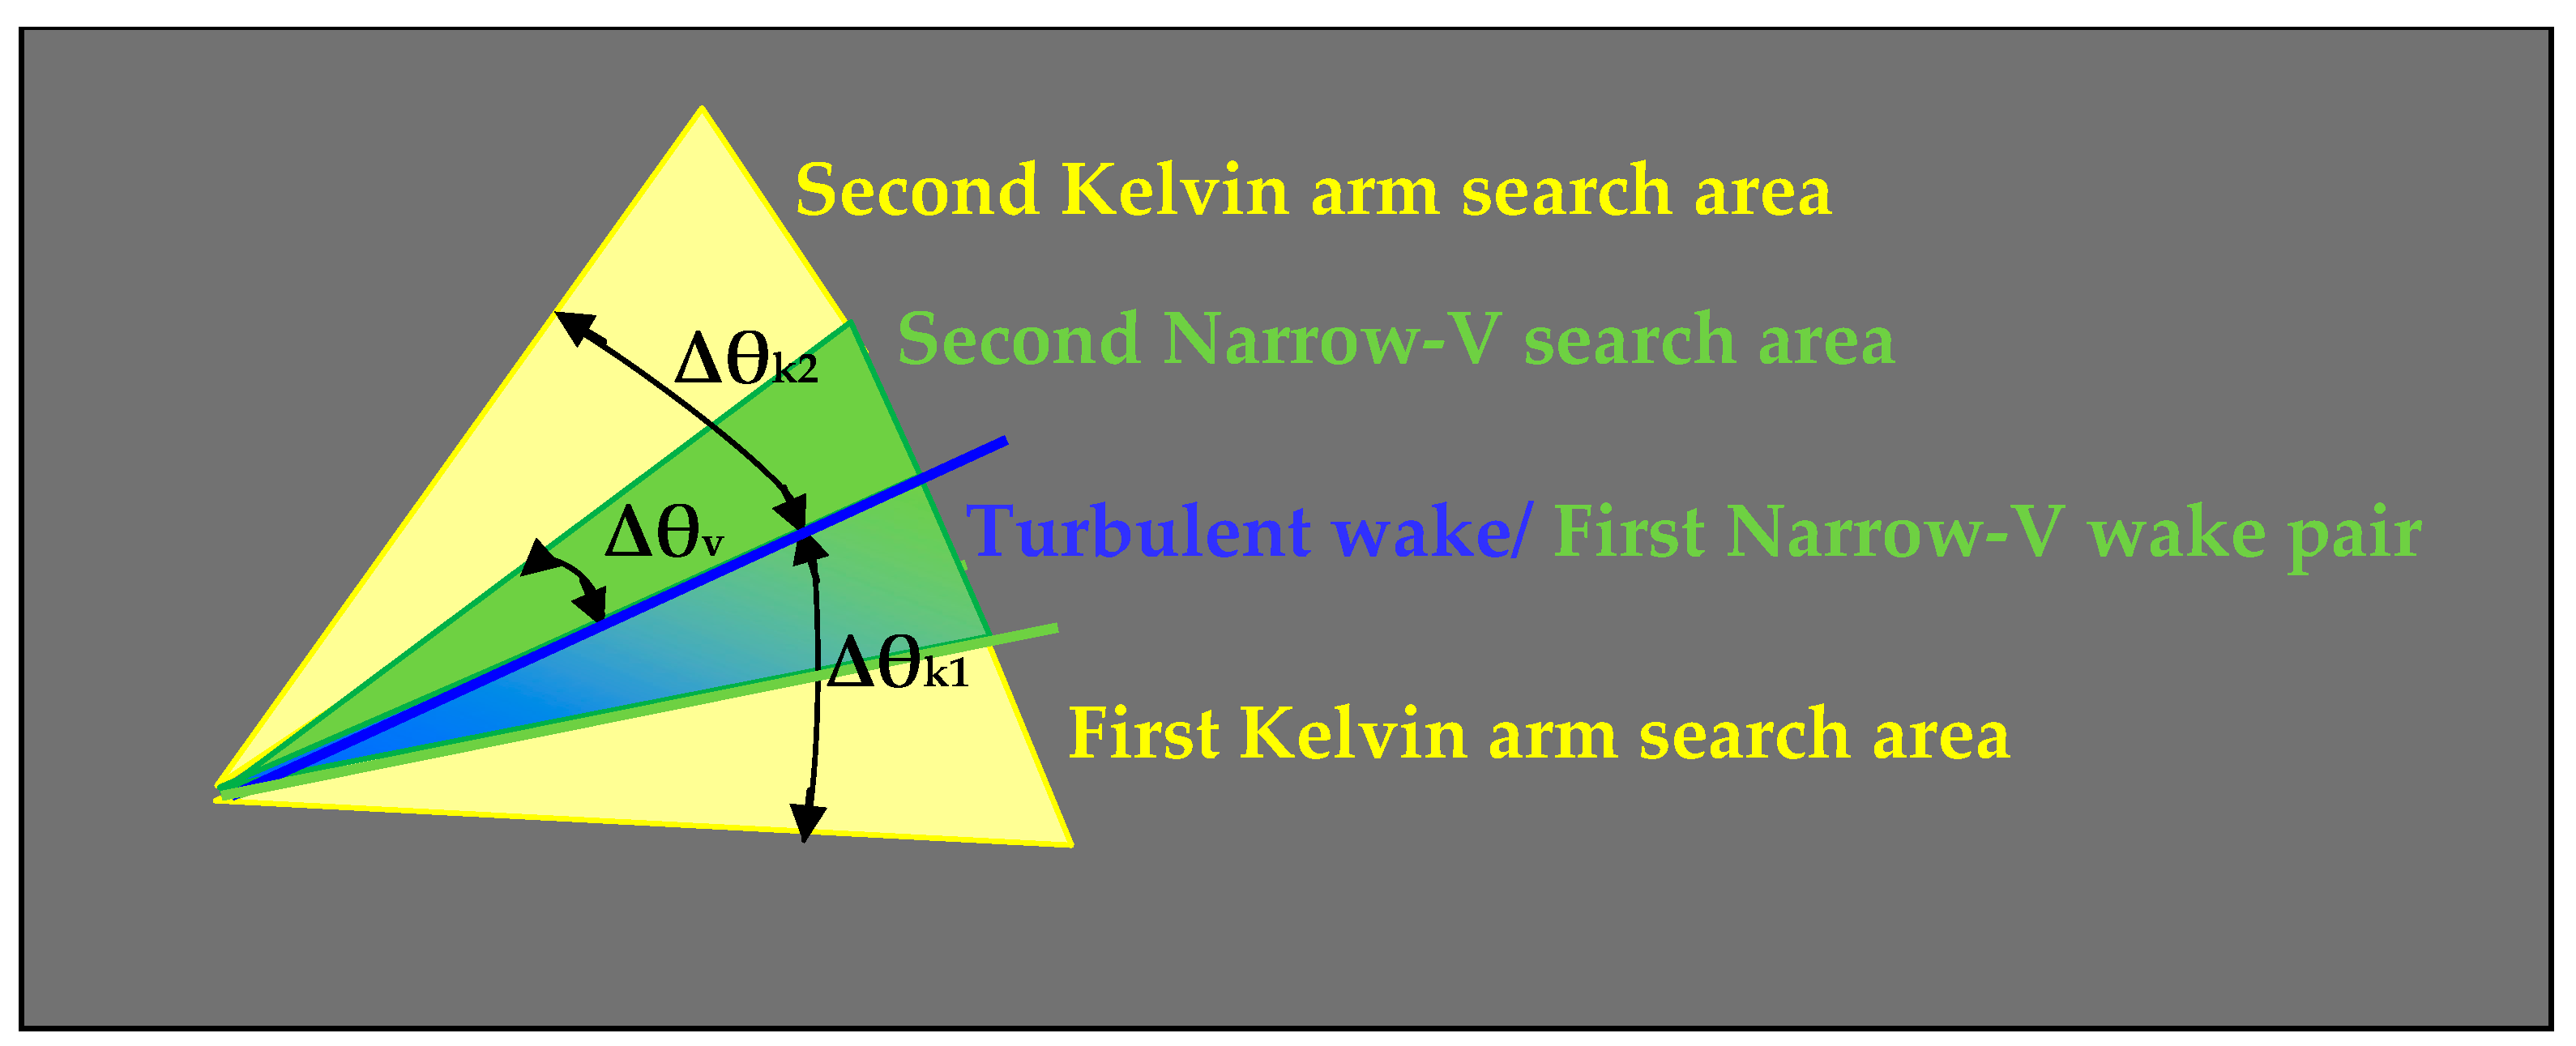
  • in the Radon domain, peaks and troughs corresponding to the typical five wake components are searched and always identified according to the hydrodynamic theory [17] (no threshold logic), exploiting the physical characteristics in terms of relative angular distance;
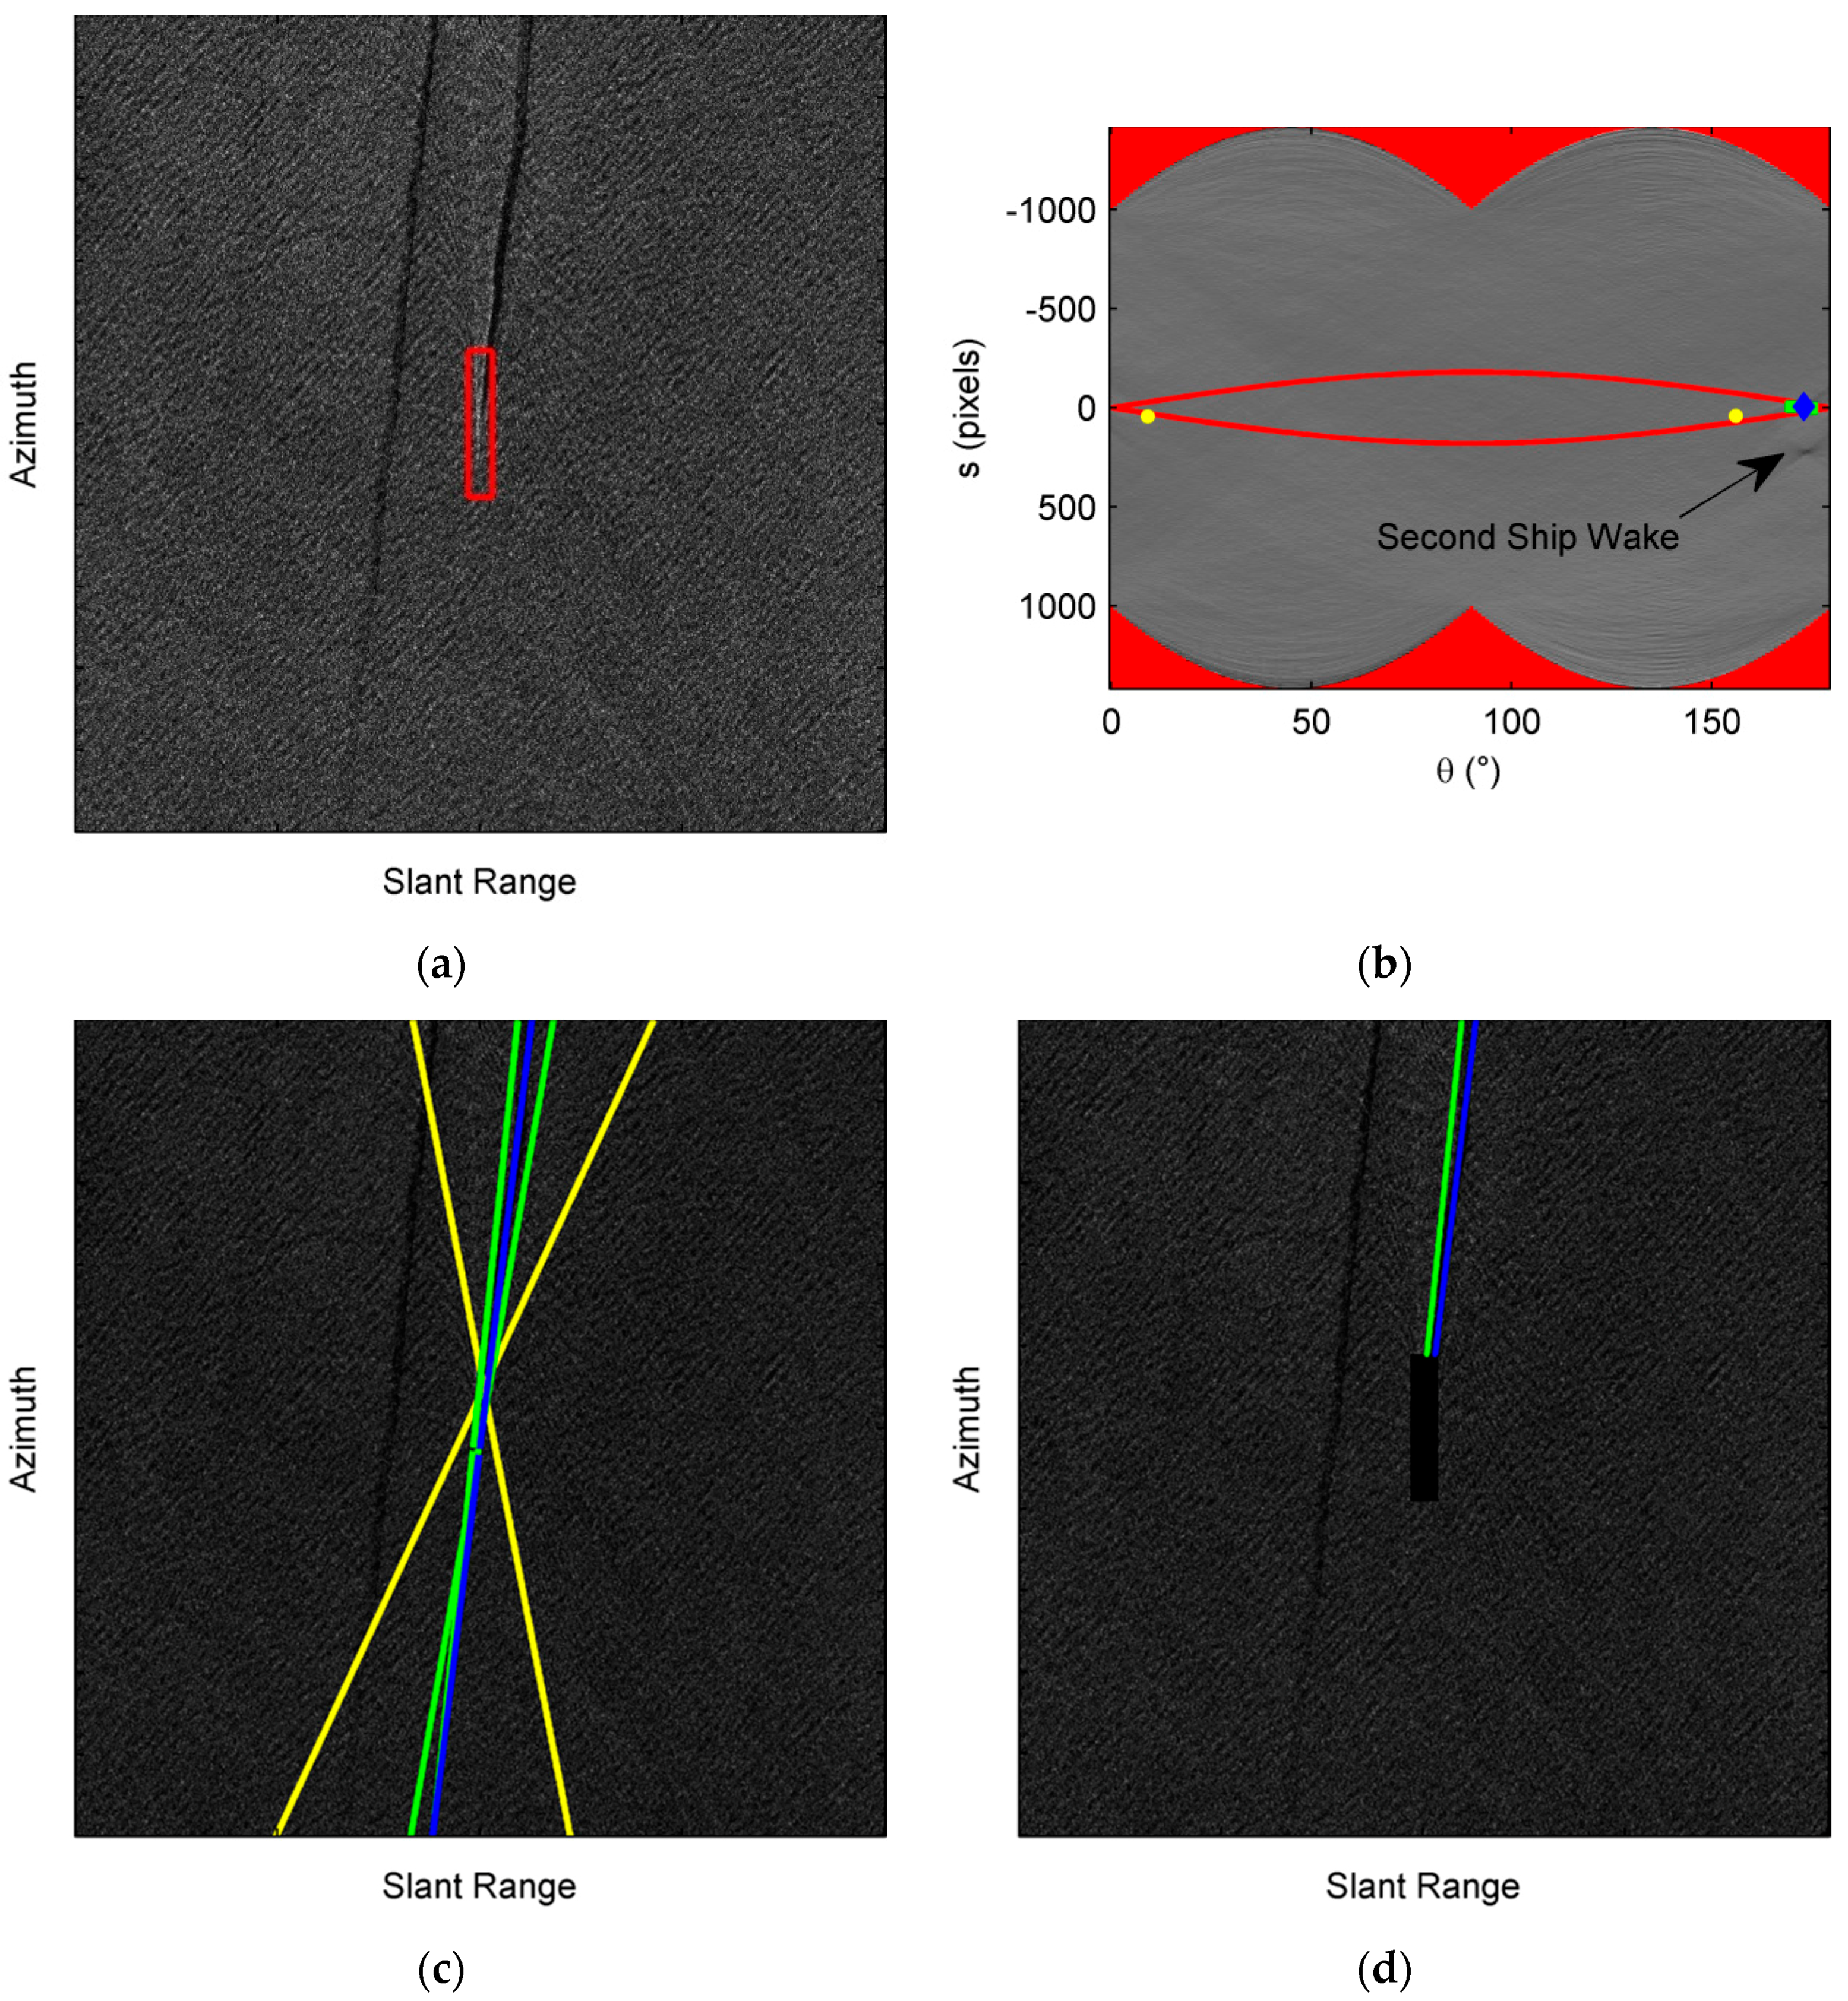
  • ship signature is masked and not summed in the Radon integral;
  • the turbulent and one narrow-V wakes are contemporaneously identified as a pair;
  • merit indexes are defined in the intensity domain and are utilized to get the final confirmation of the detected wake features.

2.2. Wake Component Detection

The ship locations are known as the center of the cluster of bright pixels affected by ship returns, which can be detected by the ship detection techniques [7]. Here, the constant false alarm rate (CFAR) approach [24,25] has been applied. The algorithm input is a ship-centered tile, selected from the entire image whose sizes are set with reference to the physical expected length of wakes (3 to 5 km for the turbulent wake [19]) or less if the ship is closer to image borders.
The ship-centered tile shows the bright pixels not only relative to the ship return pixels, but also to the land signature, as well as the bright disturbances due to ship propellers, typically imaged within a distance of about one ship length aft [26]. Such bright returns have to be removed. Differently from Rey et al. [23], who propose to detect ship bright returns by setting a threshold value and to replace them with the mean value of the amplitude distribution, hereinafter, the tile is masked with a rectangular area comprised between [−δrmax, δrmax] (range) and [−δamax, δamax] (azimuth), where δrmax is 1.5-times the length of the ship cluster projected onto the range direction and δamax is the maximum expected azimuth shift, computed from Equation (1) [12].
δ a = R V v r = R V v g cos α cos β i
where R is the slant range, V the SAR antenna velocity, vg and vr are the ship velocity along the ground and slant range, respectively, βi the local incidence angle and α the angle between the ship route and ground range direction. To calculate δamax, the maximum registered ship speed (vgmax) in the area is assumed, as provided by the information [27] on the typical local maritime traffic, whereas R, V and βi are retrieved from the ancillary data.
The Radon transform [18] is then applied to the ship-centered, masked image tile (Step 1 in Figure 1). The Radon transform integrates image brightness along straight lines identified by their distance(s) from the origin of the image reference frame and by the angle (θ) between the normal to the straight line and the image x-axis. Therefore, one bright (dark) line-shaped feature in the input image leads to one peak (trough) in the Radon domain (θ,s), whose extent in (θ,s) depends on the line’s width. Hereinafter, the Radon transform is computed for any (θ,s) by summing the intensity values of unmasked pixels only. Consequently, the integration path length usually considered in the standard Radon operator is not applicable for the lines passing through the mask. To take this effect into account, each summation is divided by the actual length of the integration path (portion of the line outside the mask) so that masked pixels contribute neither to summation, nor to path length. Finally, the Radon domain is restricted (Step 2.1 in Figure 1) between two sine curves [14] to only detect peaks relative to the wake of the ship under investigation (δa ≤ δamax), imposing: |s| ≤ δamaxsinθ.
The algorithm core consists of a sequential procedure to identify 4 peaks and one trough corresponding to the 5 potentially imaged wake structures of interest: the turbulent wake (the trough), the two narrow-V wakes and the two Kelvin arms. The peaks/trough are only searched where they are expected to be, opportunely limiting the search area in terms of (θ,s). First, a trough/peak pair is searched, corresponding to the turbulent wake and one narrow-V wake (herein defined as “first narrow-V wake”), which must be within a 4° θ-interval (Figure 2 and Step 2.2 in Figure 1). To this end, the whole tile is scanned by a window sized with ∆θv = 4° + δθ and ∆sv1 = δamax + δs, where δθ accounts for the angular discretization step in Radon transform derivation, and δs includes both the linear discretization step and the width of the wake. The trough/peak pair is selected as the one that maximizes their difference.
When the turbulent wake direction (θt, st) and the first narrow-V wake direction (θv1, sv1) are known, the second narrow-V wake is identified (Figure 2 and Step 2.3 in Figure 1) as the peak in (θv2, sv2) within Δθv from θt on the opposite side with respect to the first narrow-V wake. Depending on θt, sv2 can be smaller or larger than st. In particular, sv2 is searched either from st to st + Δsv2 or from st − Δsv2 to st, from st − Δsv2 to st + Δsv2, otherwise, with Δsv2 = stΔθv/tanθt + δs, according to the value of θt, as shown in Table 1. For the sake of clarity, being sv2 = δa·sinθv2, if θv2 is counterclockwise with respect to θt, sv2 is smaller than st if θt < 90°, sv2 is larger than st if θt > 90° + Δθ and sv2 is comprised between st − Δsv2 and st + Δsv2 if 90° < θt < 90° + Δθ.
Finally, in order to detect the Kelvin boundaries directions (θk1, sk1) and (θk2, sk2), it is assumed that the first (second) Kelvin arm is found clockwise (counterclockwise) with respect to the turbulent wake (Figure 2 and Step 2.4 in Figure 1). In terms of θk1k2), the Kelvin arm is identified by the peak within Δθk = 19.5° + δθ from θt clockwise (counterclockwise). In terms of sk1 (sk2), it has to be searched similarly to sv2 and according to Table 2 with Δsk = stΔθk/tanθt + δs.

2.3. Wake Component Validation

The results of the previous peaks/trough detection phase are five points in the Radon domain, each one identified by the coordinates (θ,s) and representing a candidate component of the typical wake appearance, which must be validated as a real wake arm. The validation phase has been introduced to: (1) assess whether the identified line-shaped features refer to the image of a wake structure; (2) define a merit index for the confirmed wake features. Validation is performed in the input domain (intensity image).
The five points are converted into five lines in the input image by the inverse Radon transform (Step 3 in Figure 1), and the 180° ambiguity in ship heading must be solved (Step 4.1 in Figure 1). To this end, the lines of the wake features are intersected with the constant-range line passing through the focused ship location. Then, the turbulent wake is identified as the half-line with lower mean intensity. The narrow-V and Kelvin arm half-lines are identified as the ones within 90° from the unambiguous turbulent wake half-line.
The validation phase is carried out by means of merit indexes. Here, only the merit index in the intensity domain is included, since merit indexes in the Radon domain [28] have shown worse performance in terms of confirmation/rejection of wake components. For bright features, the merit index FI indicates to what extent the considered half-line is brighter than the mean intensity of the masked image subset. The merit index is calculated along each detected half-line representing narrow-V and Kelvin wakes, discarding the 5% brighter pixels of the half-line to filter out the effect of localized brighter spots along dimmer lines. It is estimated by Equation (2).
F I = CDF 1 ( 0.95 ) 0.95 · n halfline I ¯ 1
where CDF(xi), the cumulative distribution function of the image intensity (xi) along the identified half-line, is calculated as the summation between x0 and xi of the histogram of the intensity along the half-line. CDF−1(0.95) is the intensity value (xi), which corresponds to CDF = 0.95. In addition, nhalfline is the number of pixels of the half-line, and I ¯ is the intensity mean value over the whole, masked tile.
As defined, the merit index limits the erroneous confirmation of the identified line-shaped features, which could show a mean value larger than the mean intensity of the masked image subset only because of the effect of passing through a bright cluster of pixels. It is worth noting that it has been chosen to discard the 5% brighter pixels as a compromise between the erroneous confirmations of features not related to wakes and the erroneous no-confirmation of bright, but short line-shaped features related to wakes.
A peak in the Radon domain is assumed to be representative of a real wake feature depending on its FI value. In Section 2.4, it will be clear that, for the narrow-V wakes (and for the turbulent wake, discussed later in this section), it is desirable to avoid missed confirmations, even if some false confirmations could arise. Therefore, a narrow-V wake arm is retained as part of the wake and defined as a “confirmed wake feature” if FI is positive and FI is used as a merit index. Otherwise, the line-shaped feature is discarded. On the contrary, it is better to limit the possibility to attain false confirmations of Kelvin wake arms. Therefore, a margin of 33% is assumed: a Kelvin arm is confirmed if FI > 0.33.
Differently, for the turbulent wake, the merit index F t I defines to what extent the half-line is darker than the mean intensity of the masked image subset. In particular, since the 95% cutting strategy does not make sense for the turbulent, dark wake, because it would lead to optimistic estimation, the following parameter is used:
F t I = I ¯ t I ¯ 1
where I ¯ t is the intensity mean value over the turbulent half-line. A trough is assumed to be representative of a real wake feature and defined as a “confirmed wake feature” if F t I is negative.
If the estimated turbulent and the first narrow-V wake are not confirmed, the whole wake structure is considered as not imaged, and the procedure is stopped. In details, for all of the ships whose wakes are not visible in the image, the algorithm should exclude wake appearances, providing positive F t I and/or negative FI relative to the first narrow-V wake.

2.4. Ship Heading and Velocity

The last algorithm module is performed to estimate ship heading and velocity. The former one is known when the turbulent wake direction is calculated, the azimuth direction w.r.t. the True North being included in ancillary data; whereas, ship velocity is estimated by state-of-the-art techniques of azimuth shift [11,12,13] and Kelvin pattern wavelength.
A procedure is herein introduced for wake vertex estimation with the aim of improving the accuracy of the azimuth displacement computation. In detail, the proposed merit index-based weighting strategy aims to mitigate the influence on the vertex position of wakes with low merit index. First of all, since the wake structures visible in SAR images develop after 1.5 ship lengths, the constant range line is selected at range δrmax before the ship cluster center. Then, its intersections with the confirmed wake structures are determined. The wake vertex is then estimated by means of the weighted least squares approach, where merit indexes are used as weights. Finally, ship velocity slant-range component vr and/or ground component vg is obtained from Equation (1), where δa is now the imaged azimuth displacement, i.e., the distance between the estimated wake vertex and the ship (corresponding to the center of the tile) along the azimuth direction.
Moreover, another wake-based technique to estimate ship velocity exploits the measurements of the wavelength of the Kelvin waves. In particular, it can be derived that ship velocity is related to the wavelength of the Kelvin waves [14,15]:
v g = q g λ 2 π
where g is gravity acceleration and q = 1 for Kelvin transverse waves [14] or q = 3 / 2 for cusp waves [15]. In [15], Fourier analysis is performed along the Kelvin arms to calculate λ as the wavelength at the spectrum peak, and finally, the velocity is derived through Equation (4), averaging three spectrograms along three parallel cuts (the middle one coincides with Kelvin arms detected by the Radon analysis) with 1-pixel separation. The application of the method showed that the velocity can be estimated with accuracy typically ranging from 4% to 9%.
It is worth underlining that false confirmations with low merit indexes do not pose serious drawbacks on velocity estimation based on the azimuth displacement method because they slightly impact wake vertex estimation thanks to the index-based weighting strategy. Nonetheless, false confirmations of Kelvin wake arms determine misleading velocity estimations based on the wavelength method because the merit index does not have any beneficial effect in this case. Consequently, it the above-mentioned margin of 33% on the merit index of Kelvin arms has been assumed (Section 2.3).

3. Results and Discussion

The algorithm has been tested over 13 SAR images of the Gulf of Naples, Italy, from COSMO/SkyMed (Table 3) and TerraSAR-X orbiting SARs (Table 4). The COSMO/SkyMed images are Stripmap products in HH or VV polarizations and with three-meter ground range, three-meter azimuth resolutions. The TerraSAR-X images are “TanDEM-X Co-registered Single Look Slant Range Complex Experimental bistatic acquisitions”. The VV polarization, monostatic products only are used, whose geometric resolutions (1.2-meter slant range, 6.6-meter azimuth) coincide with those of the standard TerraSAR-X dual-polarization, Stripmap products. In these images, it is possible to identify 34 wakes by visual inspection, with a variable number of imaged features (turbulent, narrow-V, Kelvin), which are used to test the algorithm.
Considering typical turbulent wake length and image resolutions, processed image tiles should have a dimension of about 3000 pixels. Instead, due to the fact that detected ships associated with the visible wakes are closer to image borders, image tiles are selected as large as 2000 × 2000 pixels. With reference to masks, δamax is determined for any detected ship by using ancillary data for the satellite velocity and to estimate the local slant range by interpolation. In addition, 30 knots is selected as the maximum ship velocity to be expected on the grounds of the scheduled maritime traffic in the Gulf of Naples, Italy. As for δrmax, it is estimated from the ship cluster dimension for each detected ship. For the processing validations, δamax and δrmax vary in the ranges of 156 to 428 pixels (618 pixels for wake ID #29-30) and 18 to 67 pixels, respectively.
The end-to-end wake detection process is presented for Wake #30 (Table 4), imaged by TerraSAR-X. The wake (Figure 3a) has been chosen because: (1) it is very close to another ship wake, to test the robustness of the proposed method with respect to critical situations where multiple wakes appear; (2) only one narrow-V wake and one Kelvin arm are distinguishable, even if very weak, in addition to the turbulent wake. This is useful to test the proposed method’s capability to confirm only the imaged features.
An intensity image subset is generated around the identified ship and properly masked (red rectangle in Figure 3a). The masked intensity subset is then Radon-transformed (Figure 3b). The input intensity image being square, the transform is available only in a butterfly-shaped region out of which (red area) it is not defined. The area enclosed by the red sinusoidal curves represents the sub-domain where wake structures shall be located, if imaged, considering the foreseen maximum azimuth shift.
The peak/trough search phase is carried out, and the identified wake structures are shown in Figure 3b. The blue triangle is the candidate turbulent wake; the two green squares are the candidate narrow-V wake arms; and the two yellow circles are the candidate Kelvin wake arms. Finally, the inverse Radon transform is applied to identify the wake direction, plotted as lines superimposed on the intensity image (Figure 3c). Figure 3d shows the confirmed half-lines, after the 180° ambiguity solution and the estimation of the merit indexes. It is worth recalling that the turbulent wake is confirmed if F t I is negative; the narrow-V wakes are confirmed if FI is positive; and the Kelvin arms are confirmed if FI > 0.33.
The first result is that the algorithm correctly identifies the imaged ship wake, discarding the other, longer dark line, not related to the ship under investigation. In [15], the dark extremum of the Radon transform values is related to the turbulent wake. For the wake in Figure 3, the absolute minimum of the Radon transform values is not located in the blue triangle of Figure 3b. Consequently, any technique not using the pair-search logic for the turbulent and narrow-V wake components fails the detection in this case.
Then, the 180° heading-ambiguity is solved, and merit indexes correctly validate all visible features. In detail, the merit index relative to turbulent wake is negative, whereas a positive index is shown for only one narrow-V wake. Since the first and second Kelvin arms show a negative and 0.02 merit index, respectively, they are not confirmed. Then, the ship heading is estimated at 7° with respect to the azimuth direction.
Velocity cannot be evaluated because the azimuth displacement method is not applicable (the angle α between the ship moving direction and range is greater than 75°), as well as the Kelvin pattern method, since no Kelvin arms are detected.
In order to have an overall view of wake detectability, ships related to the 34 visible wakes are detected in the images, and 34 image subsets are generated to verify whether the algorithm automatically detects existing wakes. The developed confirmation criterion in intensity domains is applied over 170 detected wake features of the 34 wakes in the Stripmap SAR images (Table 3 and Table 4). The wake detection results are validated through image visual inspection.
First of all, no missed confirmations are obtained for turbulent and narrow-V wakes, i.e., all of the bright (dark) wake features really imaged show a positive (negative) merit index. Among the Kelvin wake arms, 22 cases show a positive merit index, even if in most cases, they should be discarded, because visual inspection revealed that the detected arms could not be confirmed. Therefore, no false confirmations occur thanks to the strategy of confirming only Kelvin arms when FI > 0.33. As a drawback, in one case, a real Kelvin wake (although with a weak appearance) is also discarded. Because it refers to the only case (Wake #1) for which the first Kelvin arm shows a merit index of 0.68, it does not impact on the velocity estimation capability.
The proposed method for wake detection is robust with respect to critical situations where multiple wakes appear as verified for Wake #30. The pair-search logic shows also an additional advantage when SAR images are characterized by dark areas not related to wake features. On some occasions, it is possible that these features restitute the absolute minimum in the restricted area of the Radon domain, which would lead to erroneous turbulent wake identification. It is worth noting that since the method assumes a wake structure composed of one straight turbulent wake, two straight narrow-V wakes and two straight Kelvin arms, it is not able to correctly reconstruct wakes with different structures, as the one shown in Figure 4, which shows a lack of straight features and more than one dark wake component.
With reference to wake appearance, it is worth noting that the case of the turbulent and one narrow-V wakes comprises the vast majority (24), whereas the turbulent and two narrow-V are identified in nine cases. In only one case (Wake #1), a Kelvin arm is detected, in addition to the turbulent and two narrow-V wakes.
The last columns of Table 3 and Table 4 list velocity estimation results, which have been performed 10 times by means of the azimuth displacement method, with the other 24 cases discarded because the angle between the ship heading and azimuth direction is below 15°.
Validation of ship velocity with sea truth (Automated Identification System (AIS) data) is possible in seven cases. The AIS data have been provided by exactEarth Ltd. (Cambridge, ON, Canada) and interpolated to the SAR image acquisition time by using the Hermite cubit spline [29] and including the azimuth shift due to ship velocity components along the slant range. As an example, Wake #33 (Table 4) is shown in Figure 5a. The ship detected in a TerraSAR-X image is associated with the “BF Catania” (container ship, 102 m × 19 m) with available AIS information at the time of image acquisition (heading 258° w.r.t. True-North, velocity 9.6 knots). The confirmed wake components are shown in Figure 5b. SAR processing outputs are 258.4° as the heading and 10.2 knots as the velocity (azimuth displacement method), with a 6.25% overestimation for the latter. Additionally, for Wake #1 in Table 3 (Figure 5c), the wake features are detected and correctly confirmed (Figure 5d). Since Wake #1 is the only one included in the dataset, showing a high merit index (0.68) for a Kelvin arm, both azimuth displacement and Kelvin wake pattern methods can be applied. They lead to 27.5 knots and 24.1 knots, respectively, with a difference of 12%. It is worth noting that the absolute minimum of the Radon transform values is related to the dark stretched spot on the left part of the tile, and the turbulent wake direction is correctly identified thanks to the pair-search logic. Furthermore, in such a case, the thresholding techniques [15] fail the wake reconstruction.
On the basis of the time of image acquisition and the geolocation of the ship cluster, it is possible to associate the detected ship with the “Don Francesco” (high speed craft, catamaran; 60 m × 16.5 m; maximum velocity 39 knots; en route from Castellammare to Capri), but unfortunately, no AIS data are available.
The last two columns of Table 3 and Table 4 list the ship velocity along the heading direction estimated by the azimuth displacement method and provided by the AIS data, respectively. Generally, the ship velocity errors range from 2% to 12% with a single out-of-range value of 24% relative to Wake #11 (Table 3, Figure 6). The larger error could be due to the ship location, which is very close to the windy west coast of Capri Island and/or to a ship heading of 27° with respect to the azimuth direction.
Finally, 10 ships not related to wakes are detected, and the end-to-end processing is applied. The corresponding ten image subsets are generated to confirm that the algorithm excludes wake presence. As an example, Figure 7 portrays a ship signature that is not associated with a wake signature. The results show that for the 10 subsets, the figure of merit relative to the turbulent wake is positive and/or FI relative to the first narrow-V wake is negative. Consequently, the whole wake structure is correctly considered as not present.

4. Conclusions

An algorithm is developed for the estimation of ship heading and velocity by SAR images. Efforts have been undertaken to evolve towards a potentially autonomous procedure. Therefore, although taking full advantage of previous studies, an original approach is proposed for the detection of ship wakes. It exploits the Radon transform for the detection of the typical wake structures (turbulent wake, narrow-V wakes and Kelvin arms), but new features are inserted into the processing sequence: (1) peaks and troughs in the Radon domain corresponding to the typical wake components are searched and always identified according to the hydrodynamic theory, exploiting the physical characteristics in terms of relative angular distance; (2) the ship signature is masked and not summed in the Radon integral. The main originalities are: (1) contemporaneous identification of the turbulent and one narrow-V wakes as a pair and, successively; (2) the definition of merit indexes in the intensity domain, which are utilized to get the validation as representative of the ship wake features.
The algorithm foresees that five candidate features of typical wake appearances are always found. The procedure first looks for a dark-bright line-shaped feature pair with separation within 4°, representative of the turbulent and one narrow-V wake. They are identified as the minimum/maximum pair in the Radon domain with maximum difference. Then, the second narrow-V bright arm and the two Kelvin wake arms are identified as the maxima in the Radon domain within the angular distances foreseen by hydrodynamics theory. Finally, wake features are validated as representative of real wake signatures in SAR data by means of the merit indexes defined in the intensity domain.
The algorithm has been applied to 13 X-band SAR images from the TerraSAR-X and COSMO/SkyMed missions with different polarization and incidence angles. In these images, it has been possible to identify 34 wakes by visual inspection, with a variable number of imaged features, which are used to test the algorithm. Results have shown that no missed confirmations are obtained for turbulent and narrow-V wakes and have confirmed that the algorithm is robust with respect to critical situations, such as multiple wakes’ appearance or dark areas not related to wake features. Indeed, the algorithm has been applied to an image subset including two dark turbulent wakes of two ships cruising in the bottom-up direction. The algorithm correctly identifies the wake of the ship under investigation, discarding the other, longer turbulent wakes. It is the bright/dark pair search logic that allows one to discard the additional dark features, whose bright narrow-V wake arms have been already dampened.
Ship velocity is then estimated by state-of-the art techniques of azimuth shift and Kelvin pattern wavelength. Results’ validation with truth-at-sea (Automated Identification System data) has been possible in seven cases, where it is verified that ship velocity is estimated by the azimuth shift technique with errors typically below 12%, with only one case of velocity error around 24% for a ship very close to the Capri Island coast. Finally, another 10 ships not related to wakes are detected, and 10 image subsets are generated. The processing is also applied to the 10 subsets, and the results show that all wake-like features are correctly rejected.

Acknowledgments

TerraSAR-X date used in this work were made available by German Aerospace Center (DLR) in the framework of the first TanDEM-X Announcement of Opportunity (Proposal No. OTHER0456). The analyses were also carried out using CSK® products © ASI (Italian Space Agency) delivered under an ASI license for use in the framework of the COSMO-SkyMed Open Call for Science, Proposal Reference Code 0015/8/194/115.

Author Contributions

Maria Daniela Graziano developed and applied the algorithm, wrote the manuscript and analyzed the results. Marco D’Errico and Giancarlo Rufino contributed to algorithm review, result discussion and manuscript writing and review.

Conflicts of Interest

The authors declare no conflict of interest.

References

  1. EMSA, 2010. EMSA 5-Year Strategy. Available online: https://extranet.emsa.europa.eu/ (accessed on 26 January 2016).
  2. Council of the European Union, “Council Conclusion on Integration of Maritime Surveillance,” General Affairs Council Meeting, 23 May 2011. Available online: http://www.consilium.europa.eu/uedocs/cms_data/docs/pressdata/EN/genaff/122177.pdf (accessed on 26 January 2016).
  3. EMSA. EMSA’s View on GMES Programme of EU and ESA; in Particular on the Marine Core Service—Updated Version. Lisbon 5 December Ref. H.2/OTR/2007. Available online: http://www.emsa.europa.eu/csn-menu/122/722.html (accessed on 26 January 2016).
  4. Margarit, G.; Milanés, J.A.B.; Tabasco, A. Operational ship monitoring system based on synthetic aperture radar processing. Remote Sens. 2009, 1, 375–392. [Google Scholar] [CrossRef]
  5. Marino, A.; Sanjuan-Ferrer, M.J.; Hajnsek, I.; Ouchi, K. Ship detection with spectral analysis of synthetic aperture radar: A comparison of new and well-known algorithms. Remote Sens. 2015, 7, 5416–5439. [Google Scholar] [CrossRef]
  6. Huang, X.; Yang, W.; Zhang, H.; Xia, G.-S. Automatic ship detection in SAR images using multi-scale heterogeneities and an a Contrario decision. Remote Sens. 2015, 7, 7695–7711. [Google Scholar] [CrossRef]
  7. Crisp, D.J. The State-of-the-Art in Ship Detection in Synthetic Aperture Radar Imagery, doc# DSTO–RR–0272, 2004, 126, DSTO, Inf. Sci. Lab., Edinburgh, Australia. Available online: http://www.dtic.mil/get-tr-doc/pdf?AD=ada426096 (accessed on 26 January 2016).
  8. Greidanus, H. Satellite imaging for maritime surveillance of the european seas. Remote Sens. Eur. Seas 2008, 22, 343–358. [Google Scholar] [CrossRef]
  9. Eldhuset, K. An automatic ship and ship wake detection system for spaceborne SAR images in coastal regions. IEEE Trans. Geosci. Remote Sens. 1996, 34, 1010–1019. [Google Scholar] [CrossRef]
  10. Vachon, P.W.; Campbell, J.W.M.; Bjerkelund, C.A.; Dobson, F.W.; Rey, M.T. Ship detection by the RADARSAT SAR: Validation of detection model predictions. Can. J. Remote Sens. 1997, 23, 48–59. [Google Scholar] [CrossRef]
  11. Raney, R.K. Synthetic aperture imaging radar and moving targets. IEEE Trans. Aerosp. Electron. Syst. 1971, AES-7, 499–505. [Google Scholar] [CrossRef]
  12. Ouchi, K. On Multilook Images of Moving Targets by Synthetic Aperture Radars. IEEE Trans. Antennas Propag. 1985, 33, 823–827. [Google Scholar] [CrossRef]
  13. Ouchi, K.; Iehara, M.; Morimura, K.; Kumano, S.; Takami, I. Nonuniform azimuth image shift observed in the Radarsat images of ships in motion. IEEE Trans. Geosci. Remote Sens. 2002, 40, 2188–2195. [Google Scholar] [CrossRef]
  14. Tunaley, J.K.E. The estimation of ship velocity from SAR imagery. IEEE Trans. Geosci. Remote Sens. 2003, 1, 191–193. [Google Scholar] [CrossRef]
  15. Zilman, G.; Zapolski, A.; Marom, M. The speed and beam of a ship from its wake’s SAR images. IEEE Trans. Geosci. Remote Sens. 2004, 42, 23–43. [Google Scholar] [CrossRef]
  16. Zilman, G.; Zapolski, A.; Marom, M. On Detectability of a Ship’s Kelvin Wake in Simulated SAR Images of Rough Sea Surface. IEEE Trans. Geosci. Remote Sens. 2014, 53, 609–619. [Google Scholar] [CrossRef]
  17. Pichel, W.G.; Colon, P.C.; Wackerman, C.; Friedman, K.S. Ship and Wake Detection. In SAR Marine Users Manual; NOAA: Washington, DC, USA, 2004; Chapter 12. Available online: http://www.sarusersmanual.com (accessed on 26 January 2016). [Google Scholar]
  18. Rosenfeld, A.; Kak, A.C. Reconstruction. In Digital Picture Processing, Second Edition, Computer Sciences and Applied Mathematics; Academic Press Inc.: Orlando, FL, USA, 1982; Chapter 8; pp. 353–430. ISBN 0125973020. [Google Scholar]
  19. Illingworth, J.; Kittler, J. A survey of the Hough transform. Comput. Vis. Graphics Image Process. 1988, 44, 87–116. [Google Scholar] [CrossRef]
  20. Arnord-Bos, A.; Khenchaf, A.; Martin, A. An Evaluation of Current Ship Wake Detection Algorithms in SAR Images. Caractérisation du Milieu Marin. 2006, p. 8. Available online: http://people.irisa.fr/Arnaud.Martin/publi/ARNOLD_06b.pdf (accessed on 26 January 2016).
  21. Murphy, L.M. Linear feature detection and enhancement in noisy images via Radon transform. Pattern Recognit. Lett. 1986, 4, 279–284. [Google Scholar] [CrossRef]
  22. Tunaley, J.K.E.; Buller, E.H.; Wu, K.H.; Rey, M.T. The Simulation of the SAR image of a ship wake. IEEE Trans. Geosci. Remote Sens. 1991, 29, 149–156. [Google Scholar] [CrossRef]
  23. Rey, M.T.; Tunaley, J.; Folinsbee, J.T.; Jahans, P.A.; Dixon, J.A.; Vant, M.R. Application of Radon transform Techniques to Wake Detection in Seasat-A SAR Images. IEEE Trans. Geosci. Remote Sens. 1990, 28, 553–560. [Google Scholar] [CrossRef]
  24. Lorenzzetti, J.A.; Paes, R.L.; Gherardi, D.M. A Performance Comparison of a CFAR Ship Detection Algorithm Using Envisat, Radarsat, Cosmo-Skymed and Terrasar-X Images. In Proceedings of the SeaSAR 2010, Frascati, Italy, 25–29 January 2010; ESA SP-679. 2010. [Google Scholar]
  25. Paes, R.L.; Lorenzzetti, J.A.; Gherardi, D.F.M. Ship detection using terrasar-x images in the campos basin (Brazil). IEEE Geosci. Remote Sens. Lett. 2010, 7, 545–548. [Google Scholar] [CrossRef]
  26. Ermakov, S.; Kapustin, I.; Lazareva, T. Ship wake signatures in radar/optical images of the sea surface: observations and physical mechanisms. In Proceedings of the SPIE Remote Sensing of the Ocean, Sea Ice, Coastal Waters, and Large Water Regions 2014, Amsterdam, The Netherland, 14 October 2014; p. 6. [CrossRef]
  27. On-Line Source. Available online: https://www.marinetraffic.com (accessed on 26 January 2016).
  28. Graziano, M.D.; Rufino, G.; D’Errico, M. Wake-based ship route estimation in high-resolution SAR images. In Proceedings of the SPIE Remote Sensing, SAR Image Analysis, Modeling, and Techniques XIV, Amsterdam, The Netherland, 22–25 September 2014; p. 12. [CrossRef]
  29. Hintzen, N.T.; Piet, G.J.; Brunel, T.P. Improved estimation of trawling tracks using cubic Hermite spline interpolation of position registration data. Fish. Res. 2010, 101, 108–115. [Google Scholar] [CrossRef]
Figure 1. The flow chart of the proposed method.
Remotesensing 08 00498 g001
Figure 2. Angular search logic for narrow-V wakes and Kelvin arms.
Remotesensing 08 00498 g002
Figure 3. End-to-end wake detection process applied to Wake #30 of Table 4: (a) masked image tile; (b) Radon transform with detected wake components (blue triangle: turbulent wake, two green squares: narrow-V wake arms, two yellow circles: Kelvin wake arms); (c) detected lines superimposed to the intensity image; (d) confirmed half lines.
Remotesensing 08 00498 g003
Figure 4. Different wake structure example.
Remotesensing 08 00498 g004
Figure 5. Wake detection examples: (a) masked image tile for Wake #33 in Table 4; (b) confirmed half lines for Wake #33 in Table 4; (c) masked image tile for Wake #1 in Table 3; (d) confirmed half lines for Wake #1 in Table 3.
Remotesensing 08 00498 g005
Figure 6. Wake #11 in Table 3.
Remotesensing 08 00498 g006
Figure 7. Ship not related to wake. COSMO/SkyMed image on 23 June 2012 (Table 3).
Remotesensing 08 00498 g007
Table 1. Search logic for the second narrow-V wake.
θv2 Selection
Remotesensing 08 00498 i001
If θv1 is clockwise with respect to θt, θv2 is counterclockwise with respect to θt
Remotesensing 08 00498 i002
If θv1 is counterclockwise with respect to θt, θv2 is clockwise with respect to θt
Remotesensing 08 00498 i003
sv2 Selectionif θt < 90°st − Δsv2 < sv2 < stif θt < 90° − Δθvst < sv2 < st + Δsv2
if 90° < θt < 90° + Δθvst − Δsv2 < sv2 < st + Δsv2if 90° − Δθv < θt < 90°st − Δsv2 < sv2 < st + Δsv2
if θt > 90° + Δθvst < sv2 < st + Δsv2if θt > 90°st − Δsv2 < sv2 < st
Table 2. Search logic for the Kelvin arms.
θk1 Selection
Remotesensing 08 00498 i001
θk1 is clockwise with respect to θt
Remotesensing 08 00498 i002
sk1 Selectionif θt < 90° − Δθkst < sk1 <st + Δsk
if 90° − Δθk < θt < 90°st − Δsk < sk1 < st + Δsk
if θt > 90°st − Δsk< sk1 < st
θk2 Selection
Remotesensing 08 00498 i001
θk2 is counterclockwise respect to θt
Remotesensing 08 00498 i003
sk2 Selectionif θt < 90°st − Δsk < sk2 < st
if 90° < θt < 90° + Δθkst − Δsk < sk2 < st + Δsk
if θt > 90° + Δθkst < sk2 < st + Δsk
Table 3. COSMO/SkyMed dataset, imaged wakes and velocity estimation results. AIS, Automated Identification System.
Acquisition DatePolarizationWake IDIncidence Angle (°)Azimuth Displacement Velocity EstimationAIS Data Velocity
Ground Range Component (knots)Ship Heading Component (knots)Ship Heading Component (knots)
30 June 2008 04:57HH#124.627.5--
#223.3---
#323.3---
18 June 2011 17:09VV#436.4---
25 June 2011 17:08VV#536.1---
5 August 2011 04:50VV#634.0---
#734.1---
#834.222.0--
23 June 2012 17:05VV#936.4117.120.922
#1035.9---
#1136.128.328.823.2
6 July 2012 17:05HH#1235.611.215.3116.8
#1335.7---
#1435.7---
#1536.2---
7 August 2012 17:05VV#1636.1---
#1736.016.321.321.7
#1835.821.128.229.3
#1936.49.210.111.9
3 July 2013 16:50HH#2050.3---
#2150.0---
Table 4. TerraSAR-X dataset, imaged wakes and velocity estimation results.
Acquisition DatePolarizationWake IDIncidence Angle (°)Azimuth Displacement Velocity EstimationAIS Data Velocity
Ground Range Component (knots)Ship Heading Component (knots)Ship Heading Component (knots)
3 August 2012 05:20VV#22 21.3---
#2321.7---
9 June 2011 16:49VV#2427.75.8--
#2528.1---
#2628.5---
#2728.5---
29 June 2013 05:20VV#2821.7---
#2921.8---
#3021.8---
10 July 2013 05:20VV#3121.8---
#3221.8---
5 June 2014 05:20VV#3321.610.210.29.6
#3421.8---

