
Snow Extent Variability in Lesotho Derived from MODIS Data (2000–2014)


Abstract
:
1. Introduction
2. Data and Methods
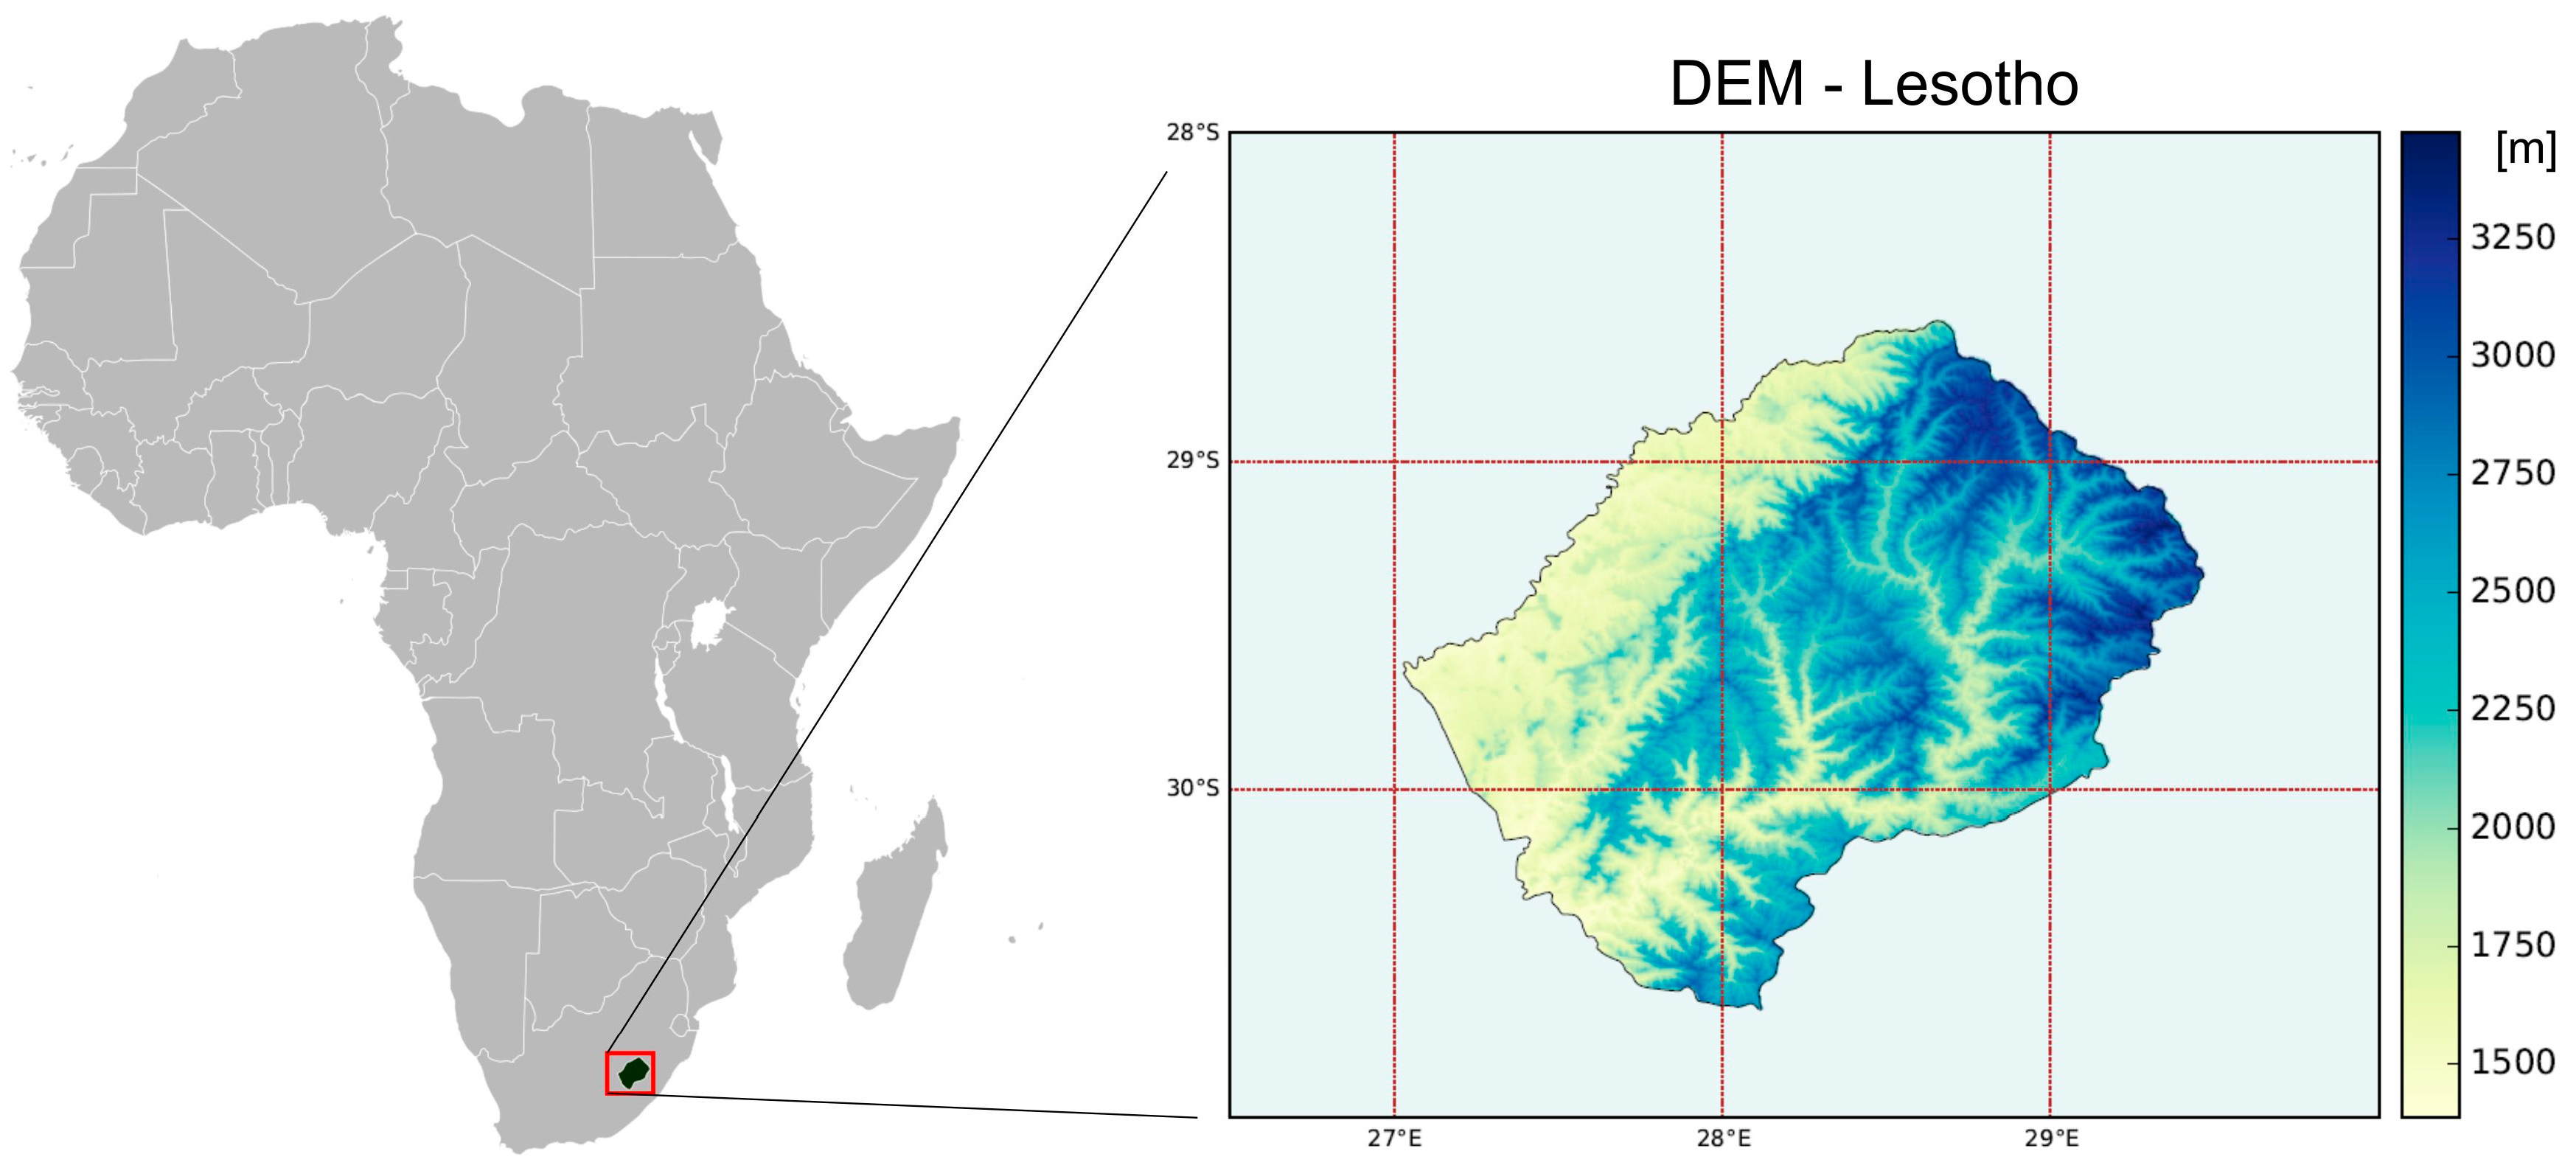
2.1. Study Area
2.2. Data
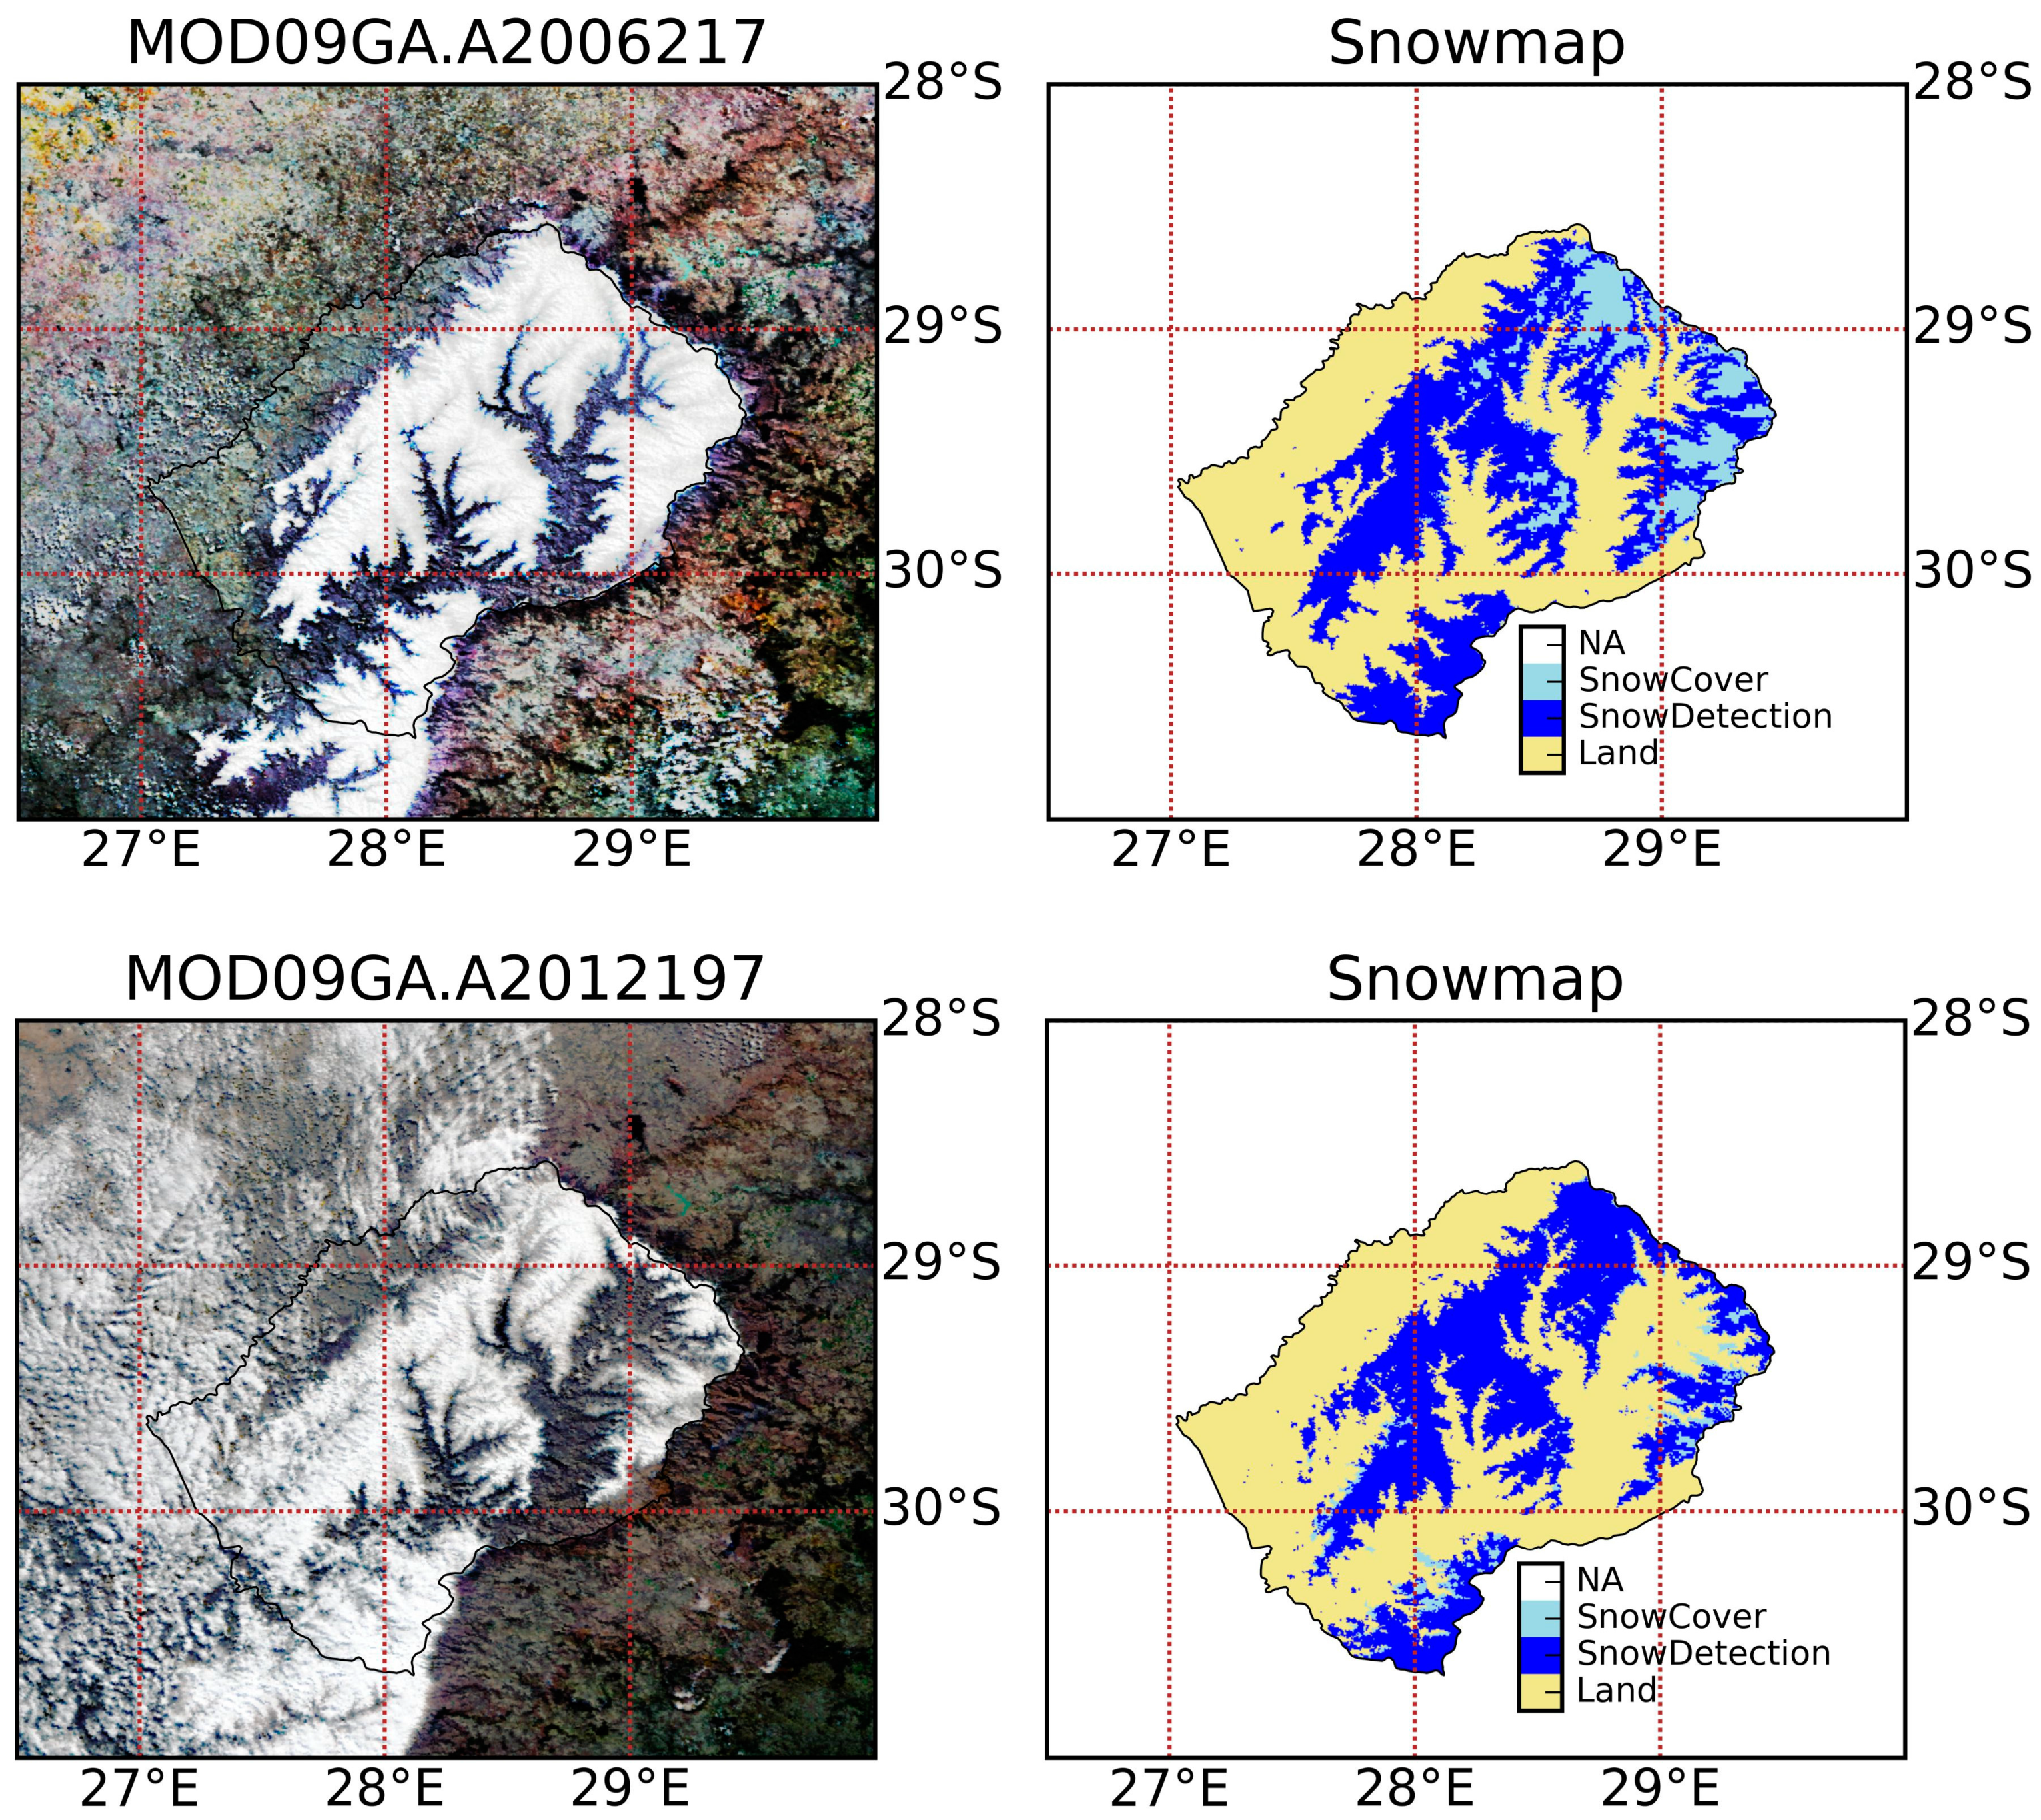
2.2.1. MODIS
2.2.2. Landsat-Thematic Mapper (TM)
2.2.3. ENVISAT-MERIS
2.2.4. Auxiliary Data
2.3. Methods
2.3.1. MODIS Processing
2.3.2. Processing of Landsat-TM
2.3.3. Processing of MERIS
2.3.4. Post-Processing
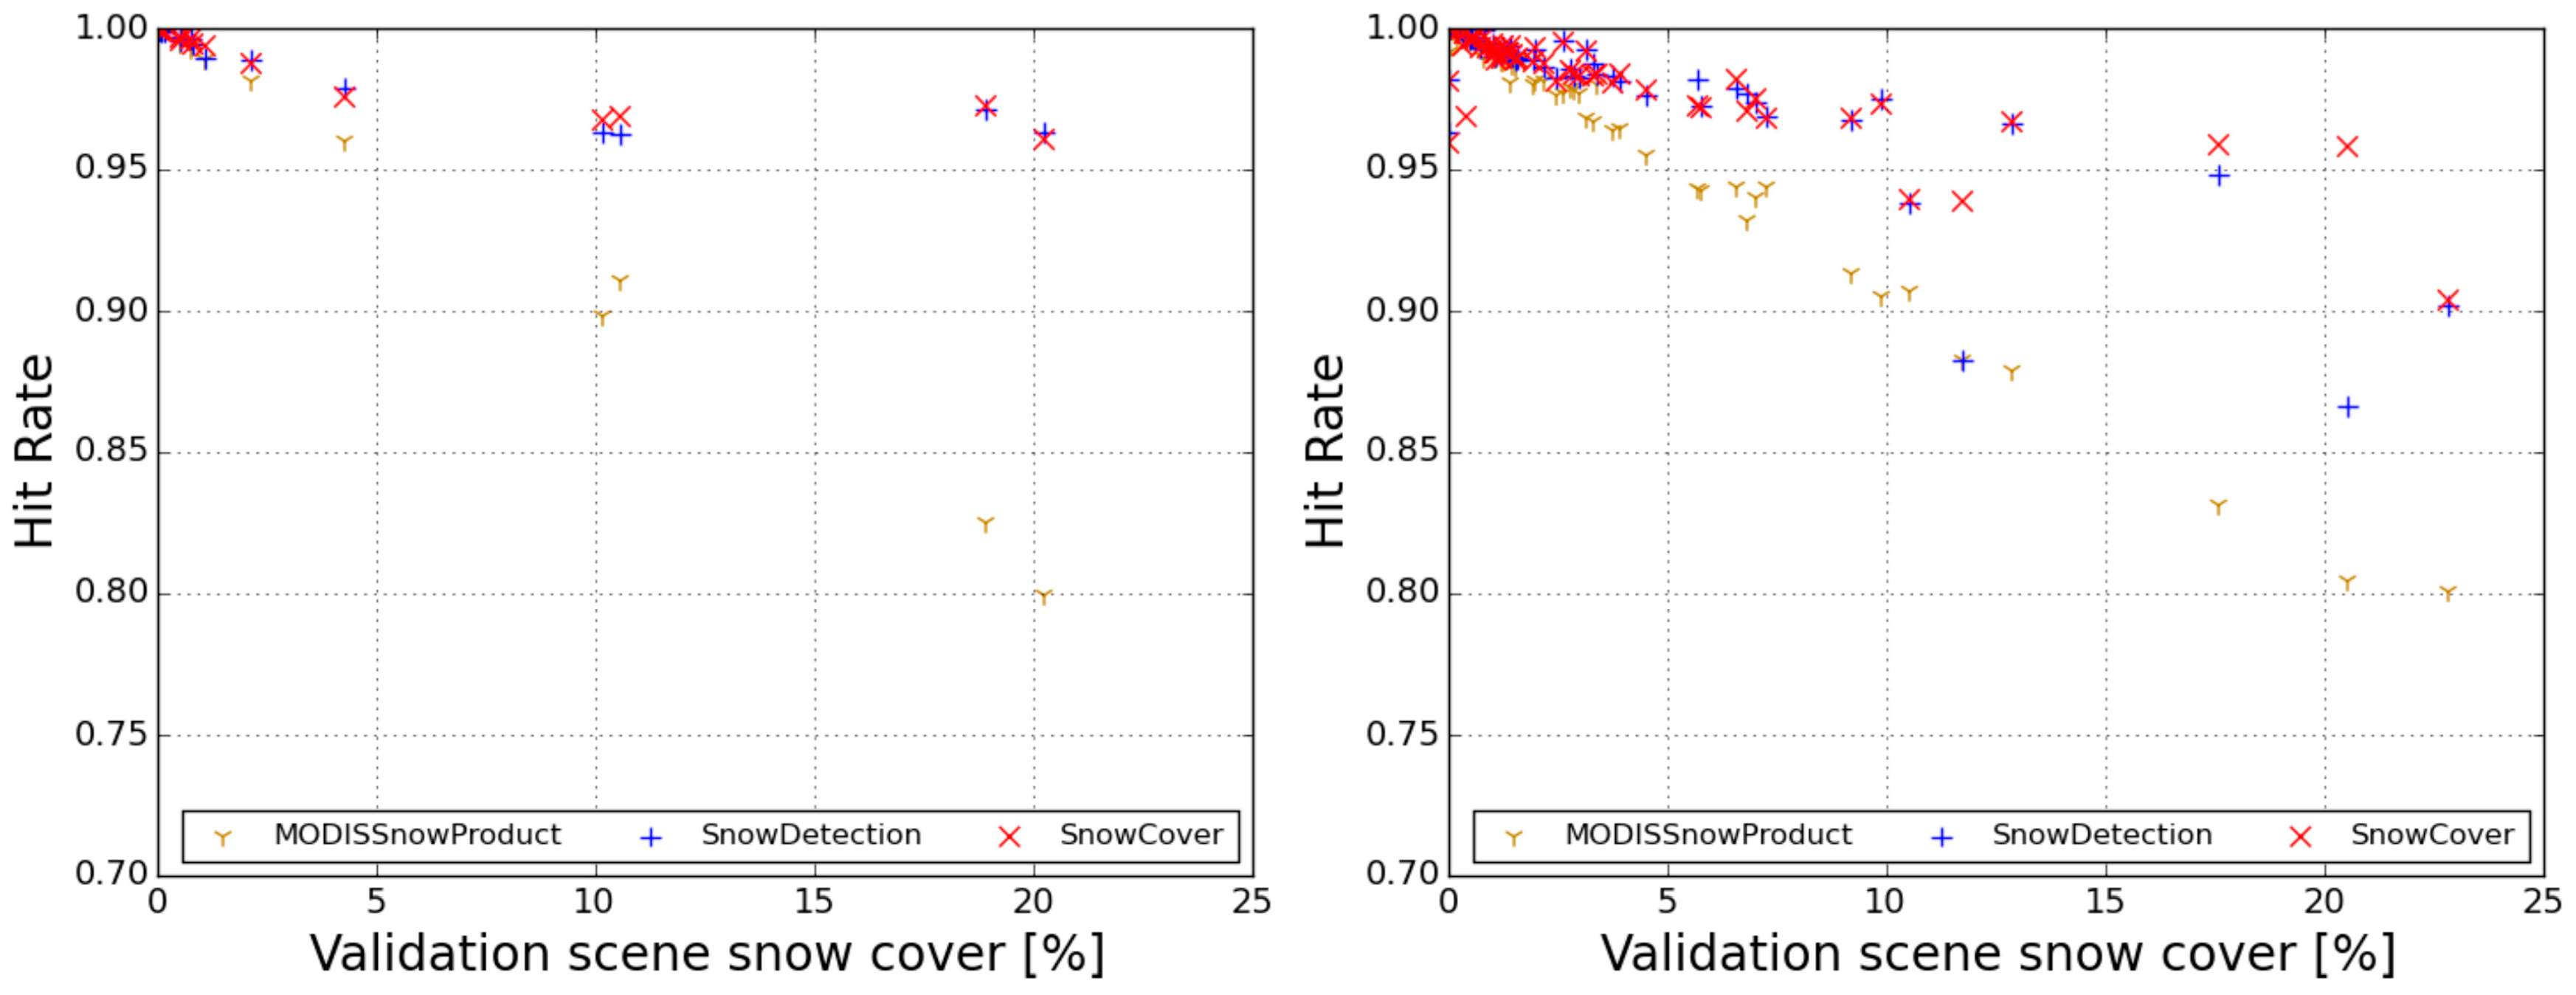
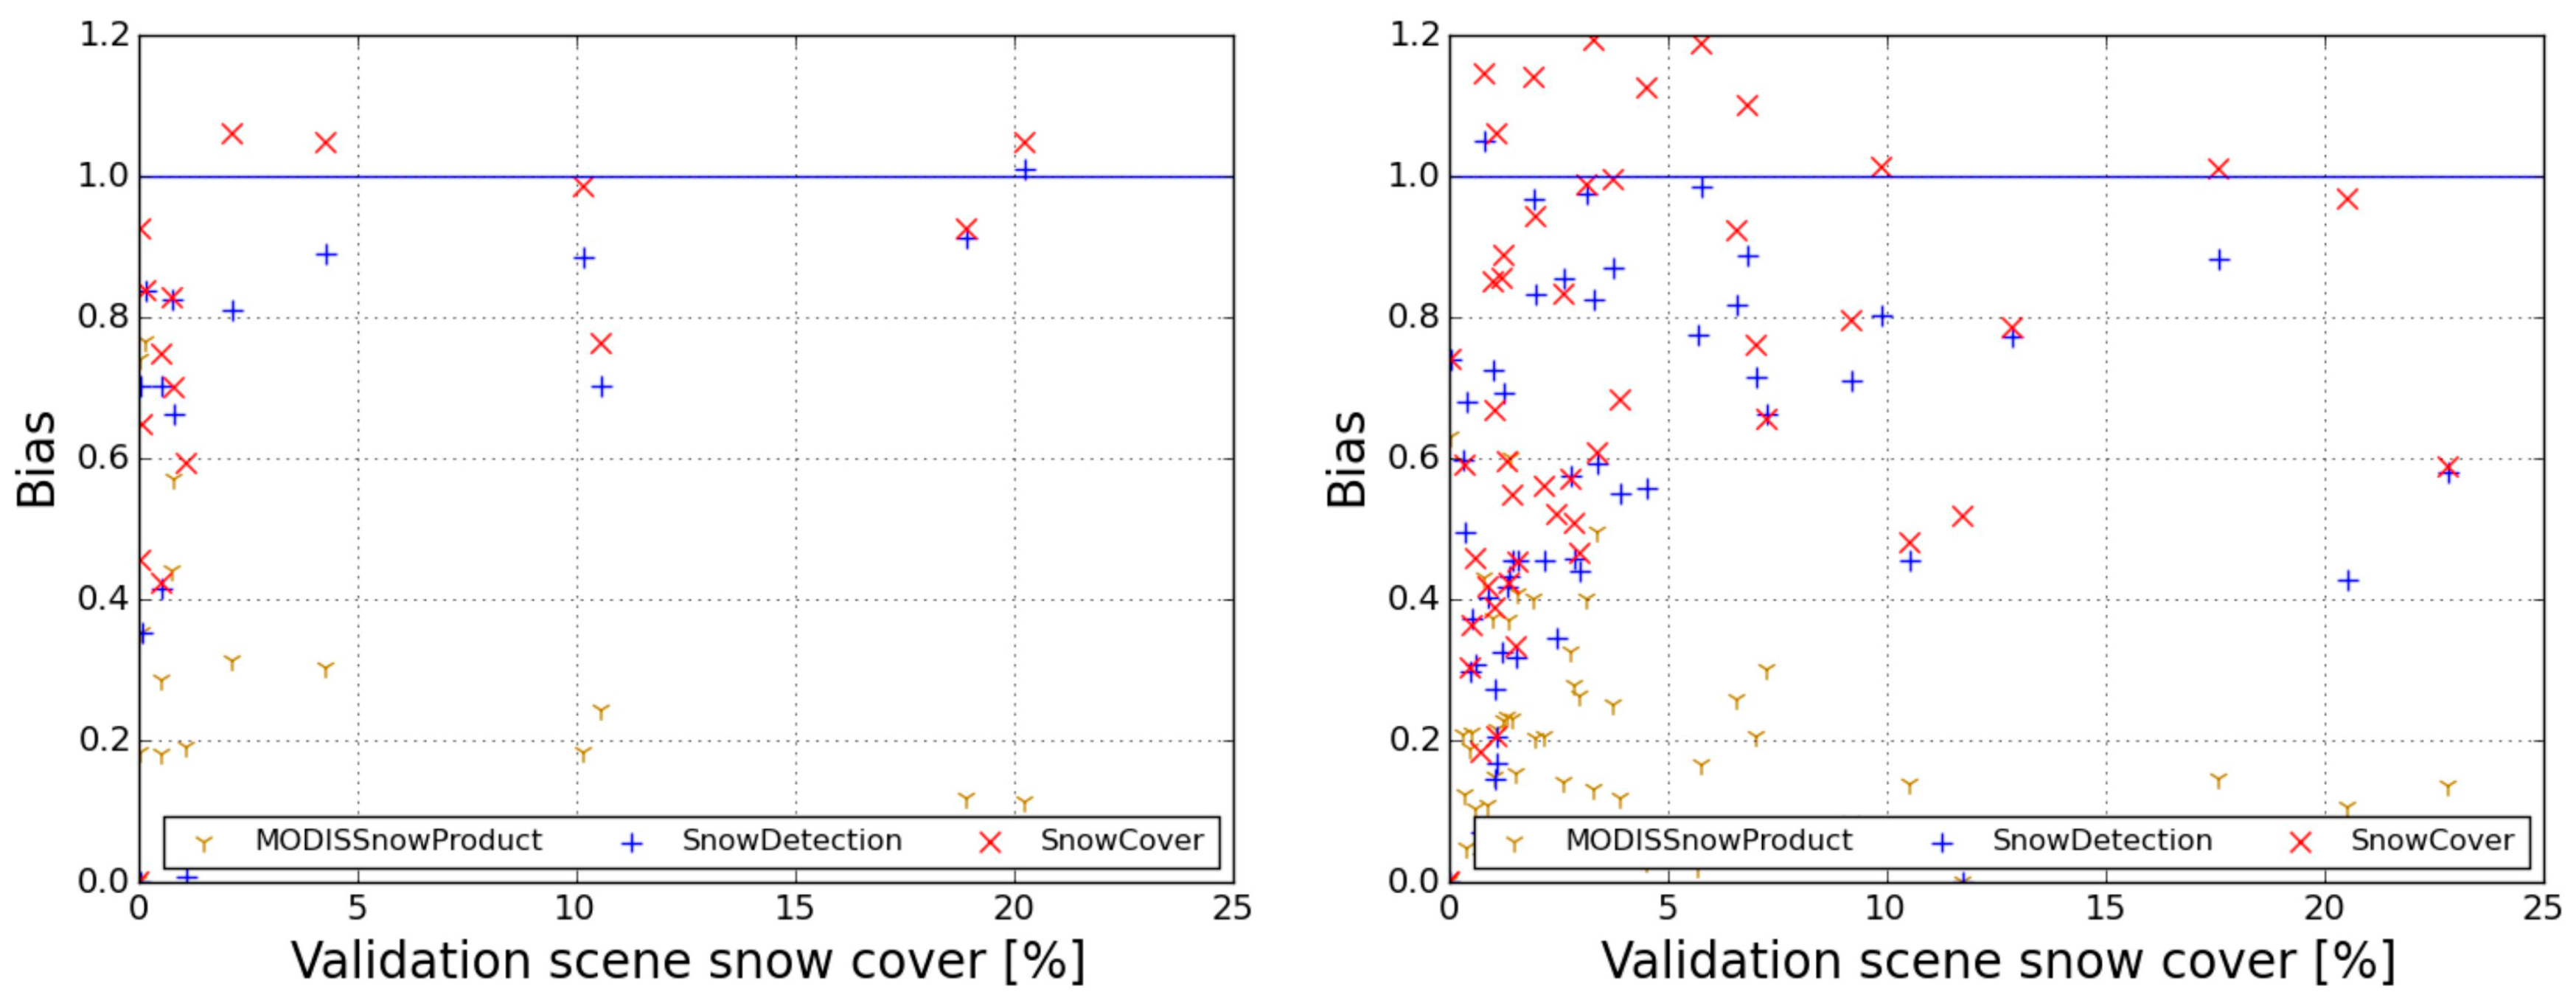
2.3.5. Validation and Comparison
3. Results
3.1. Comparison
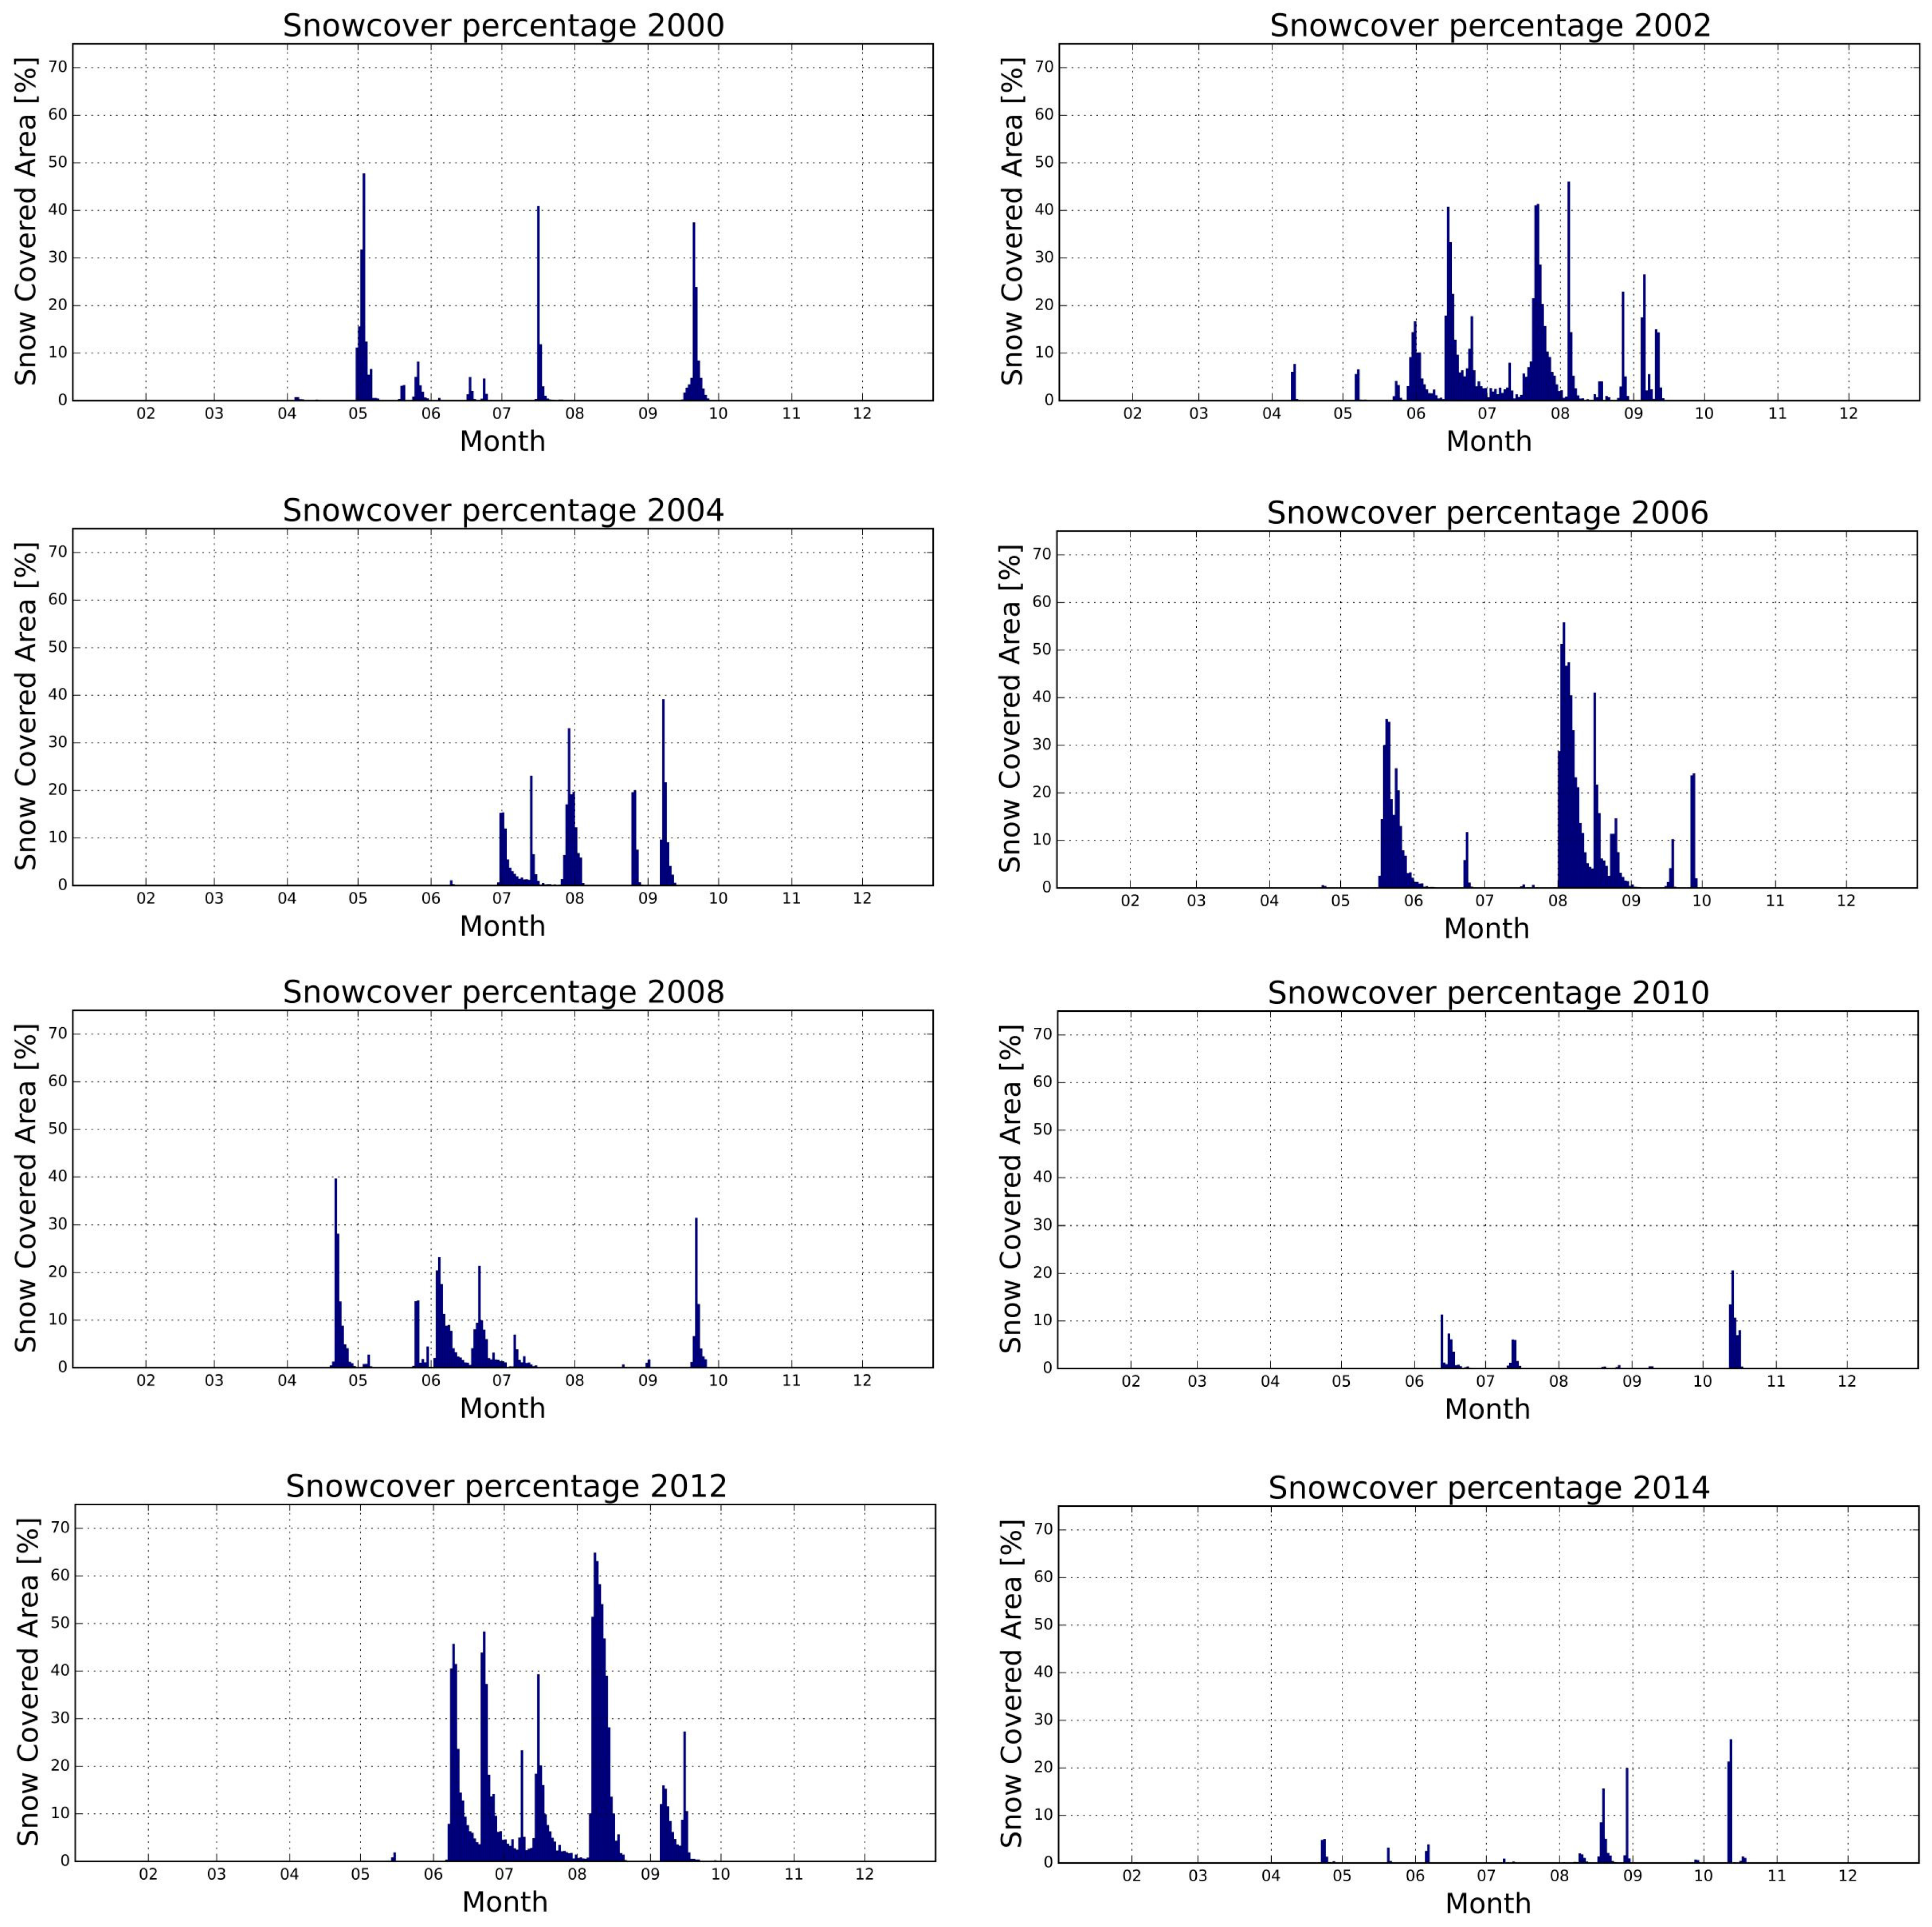
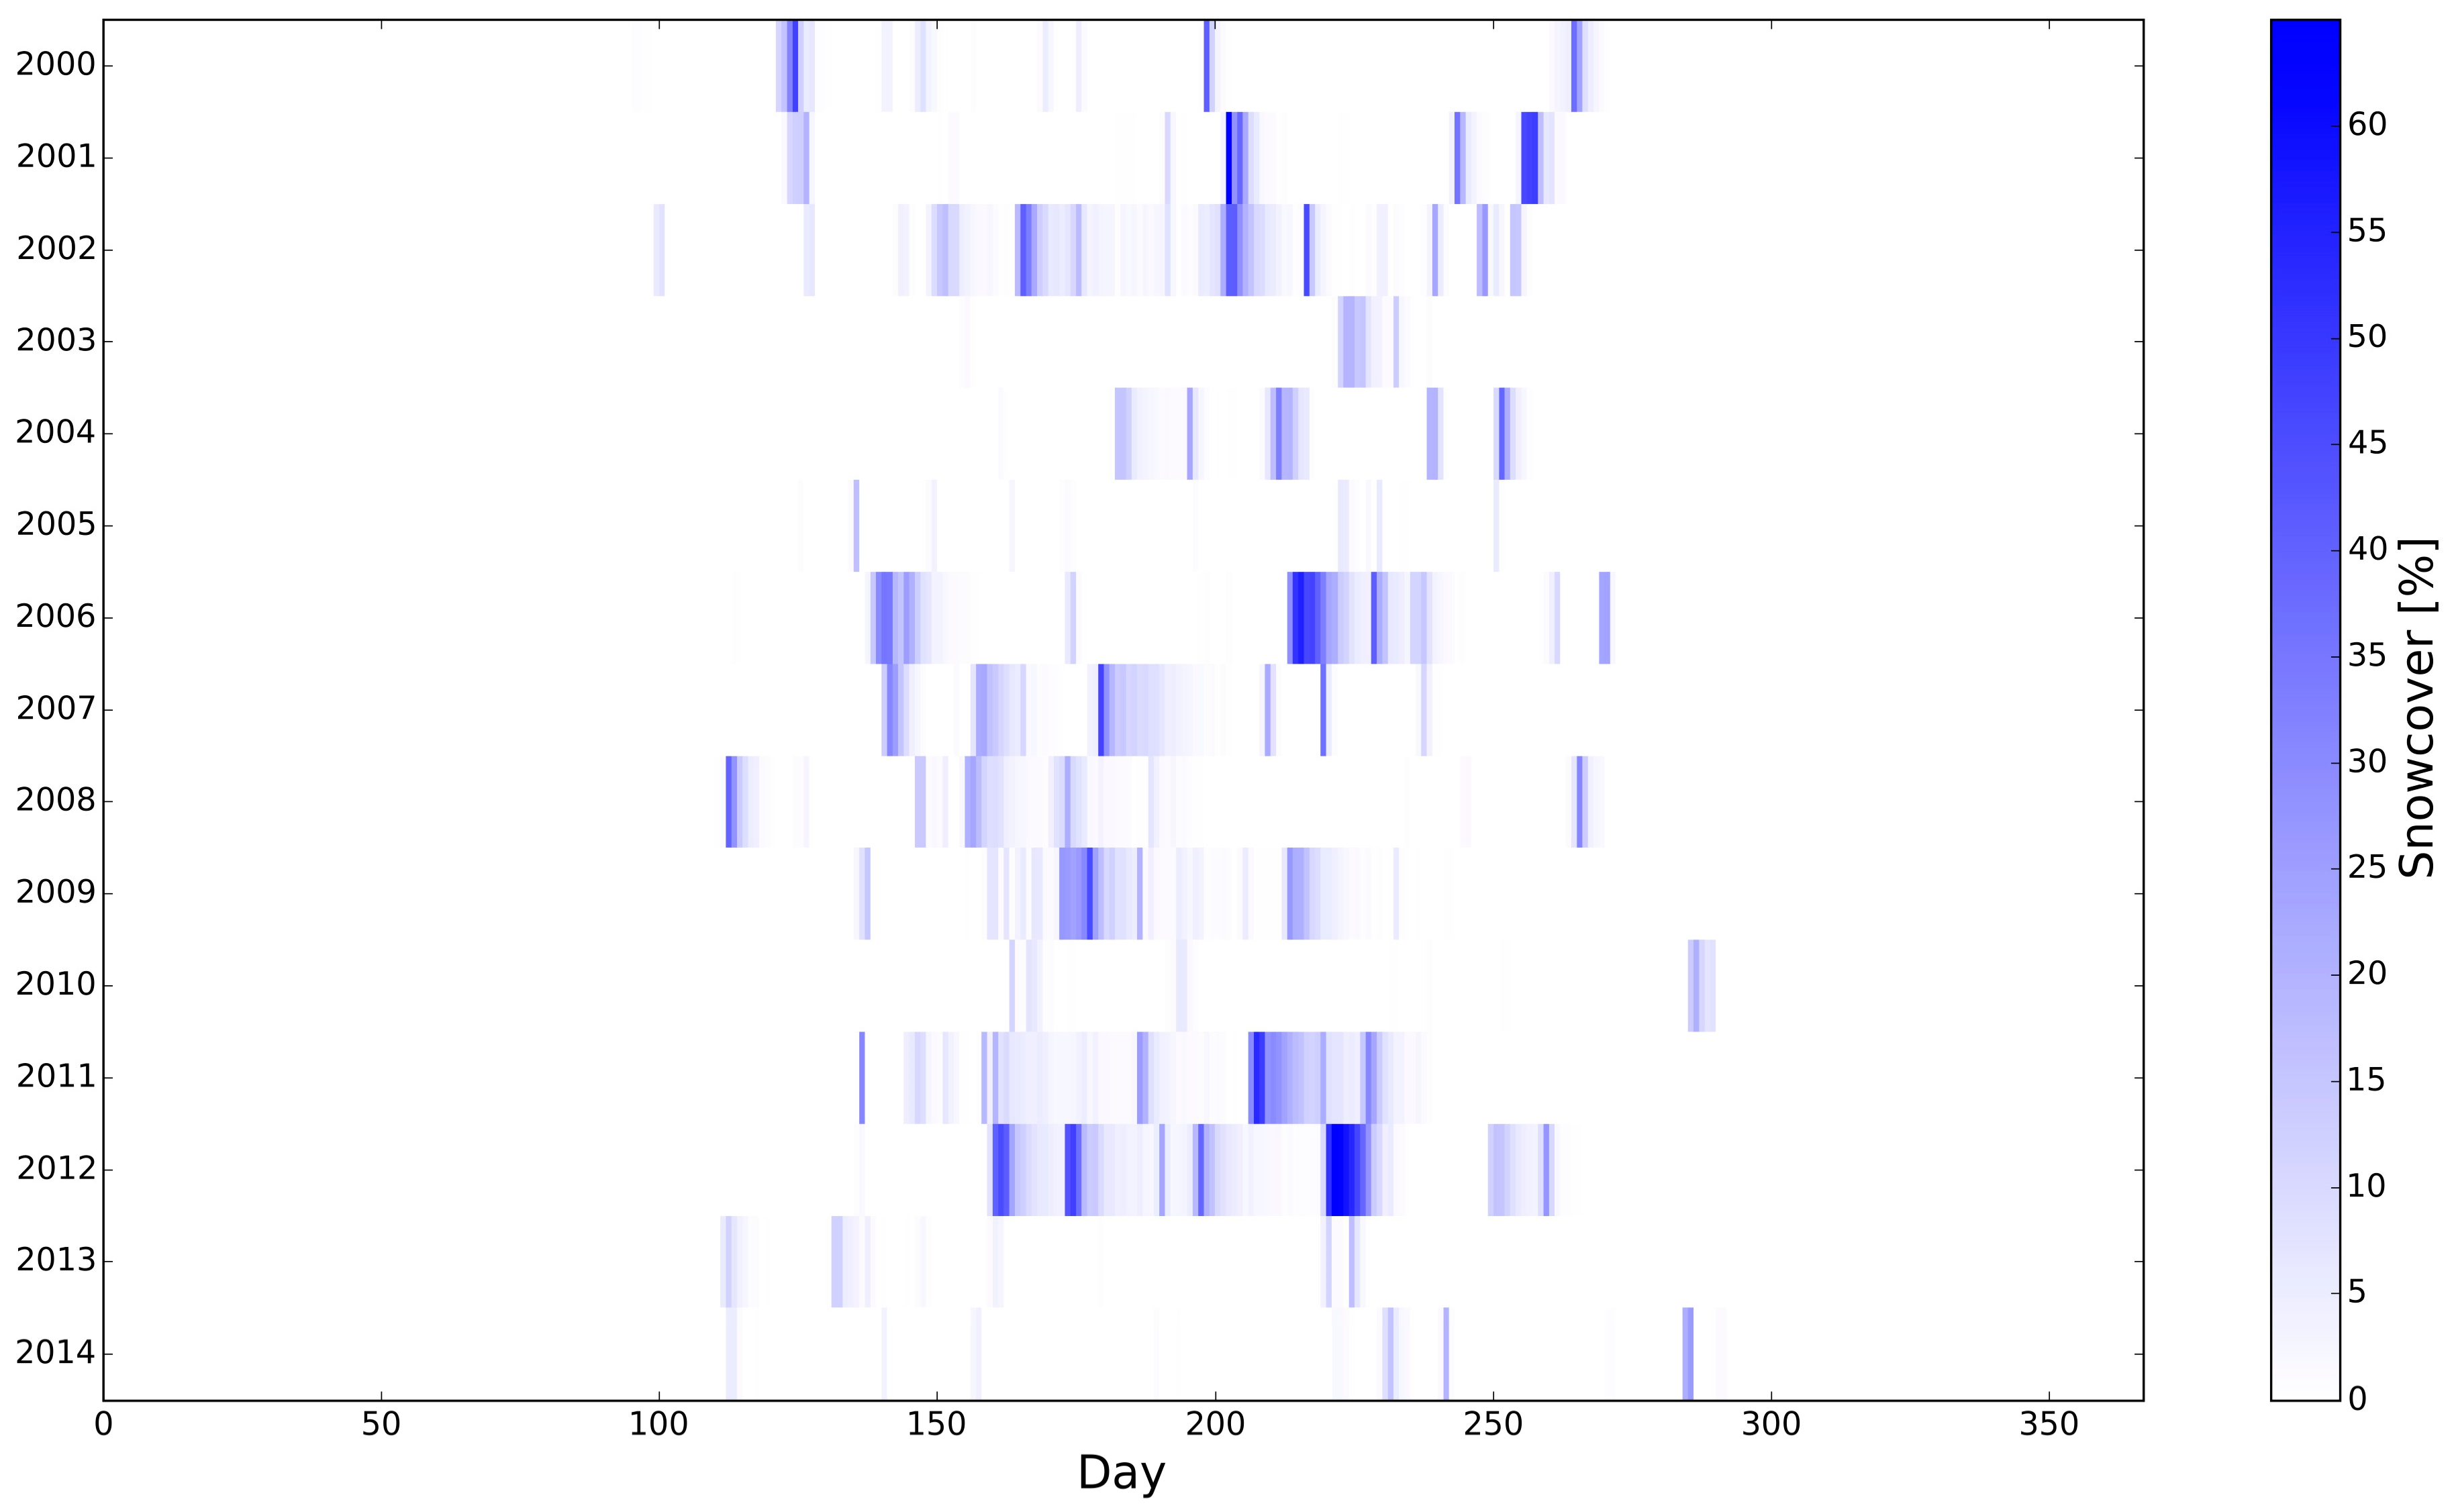
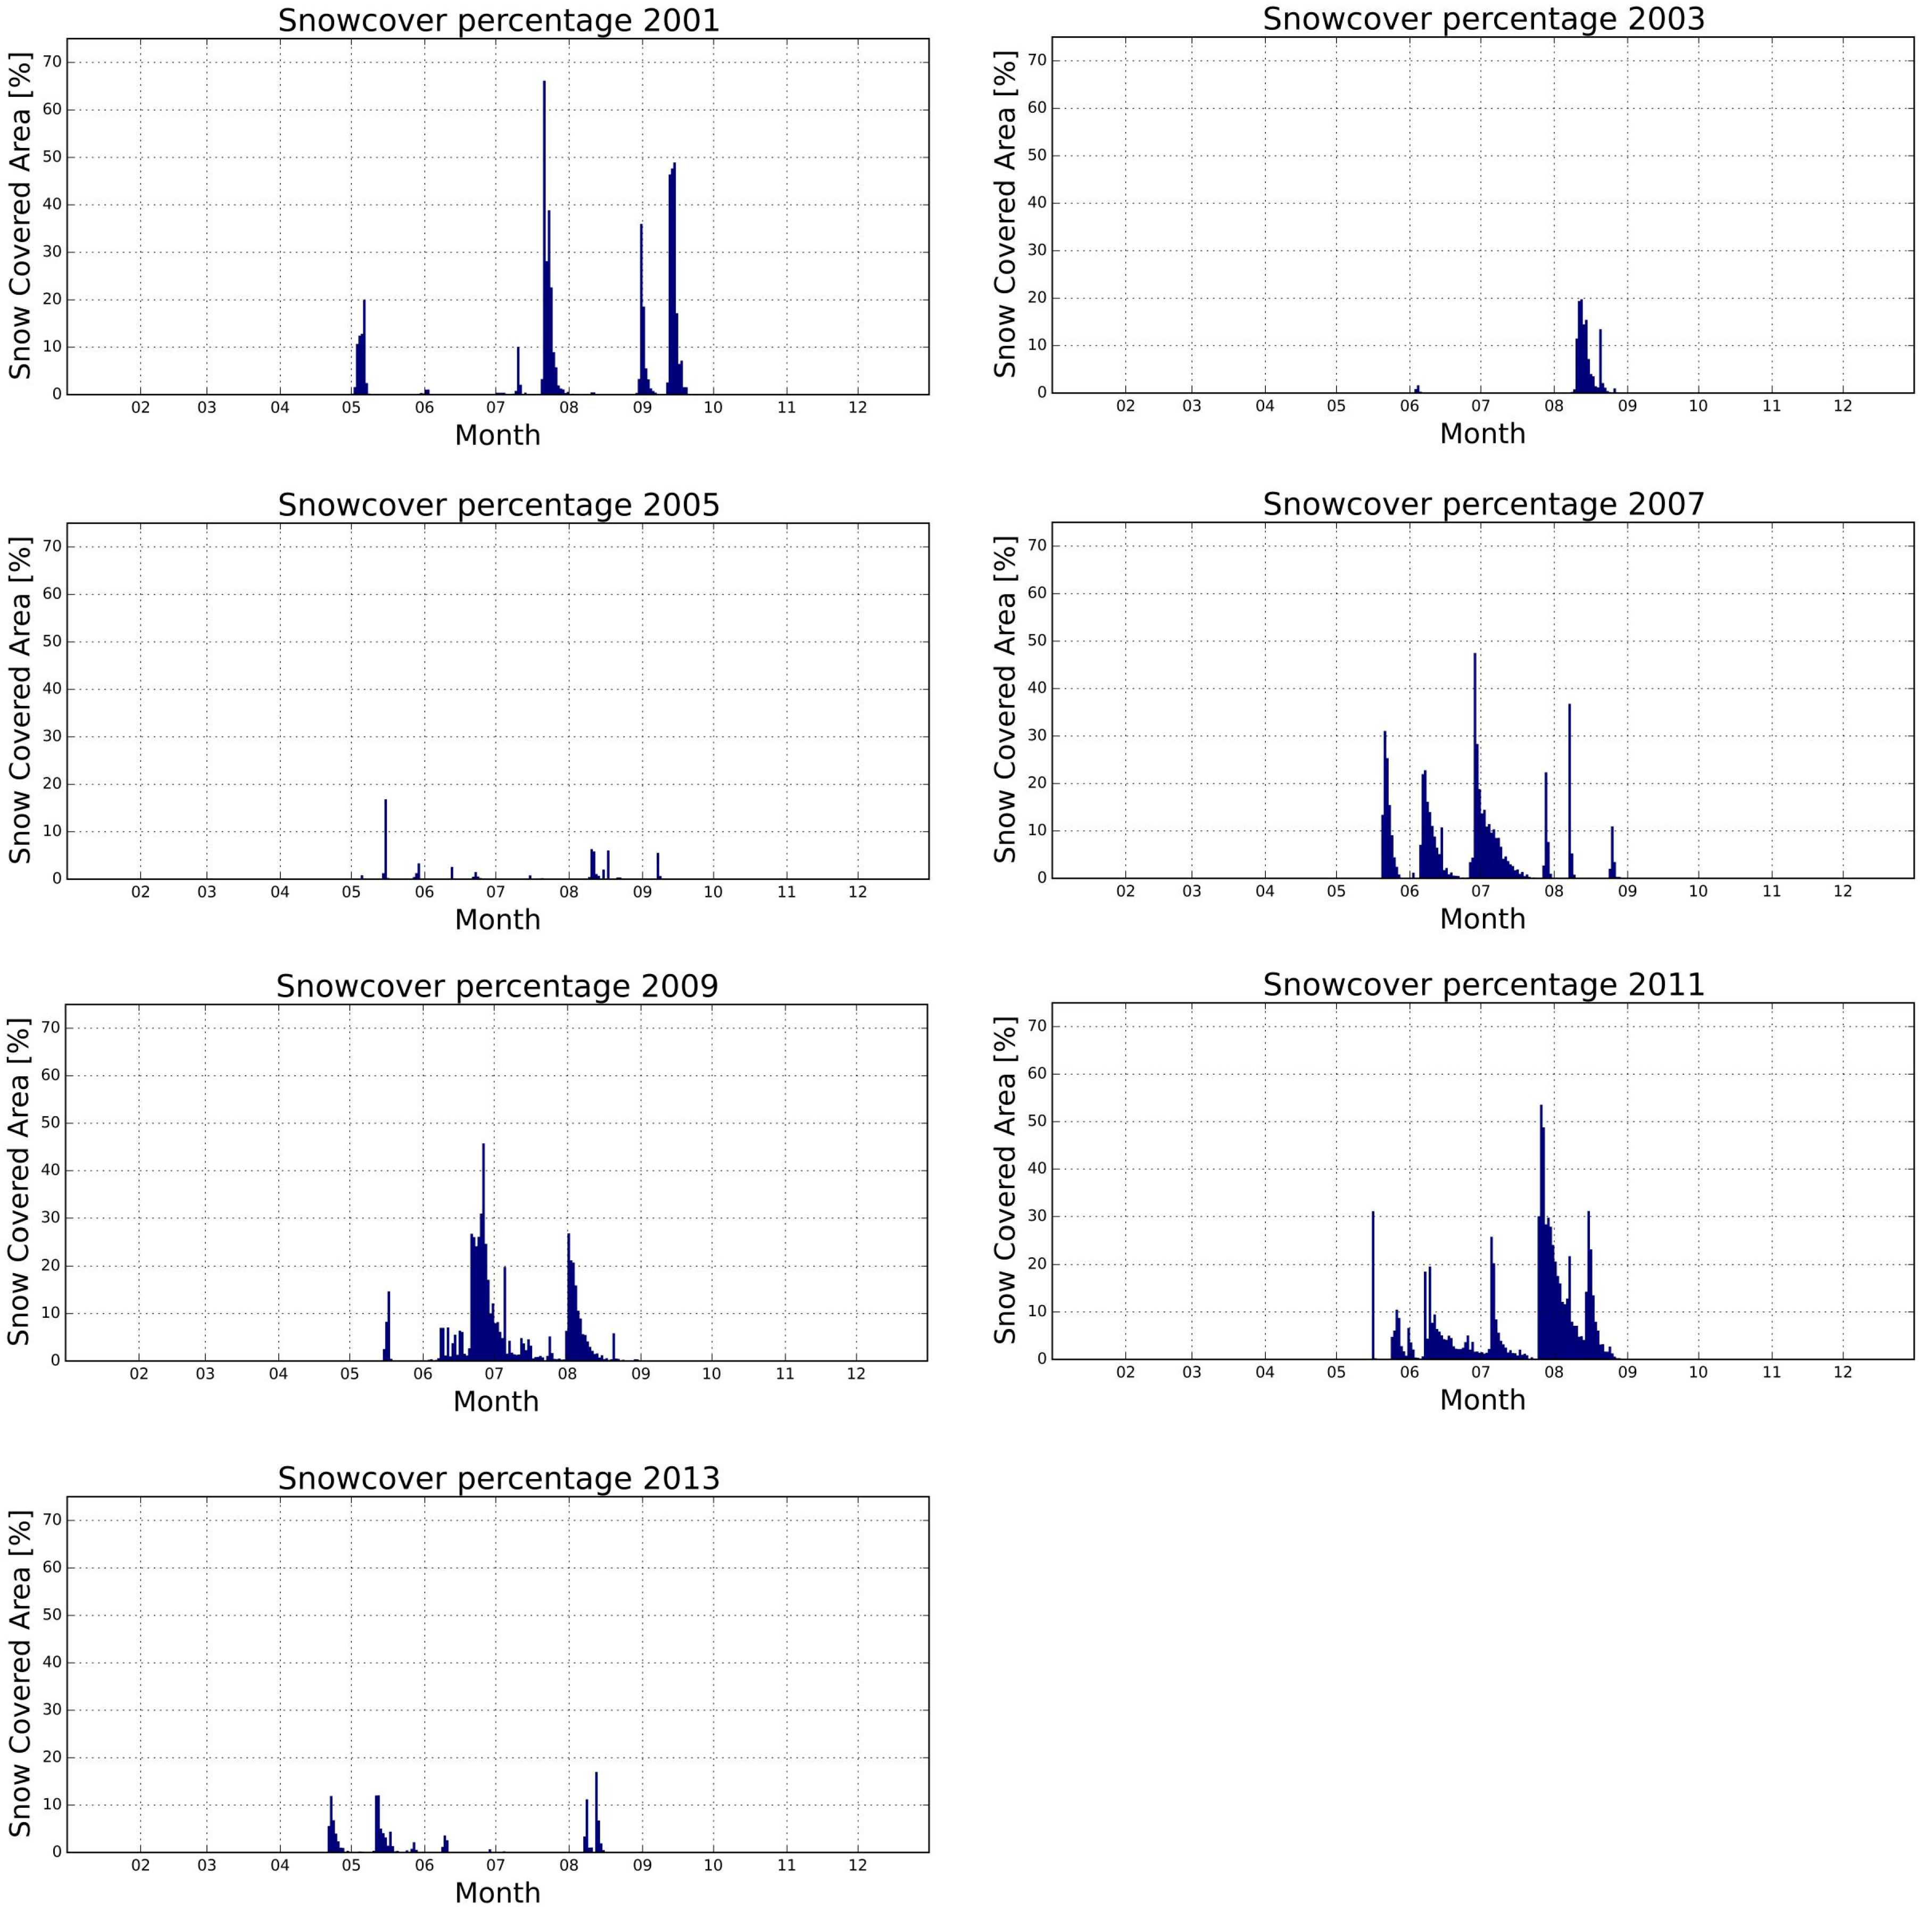
3.2. Time Series
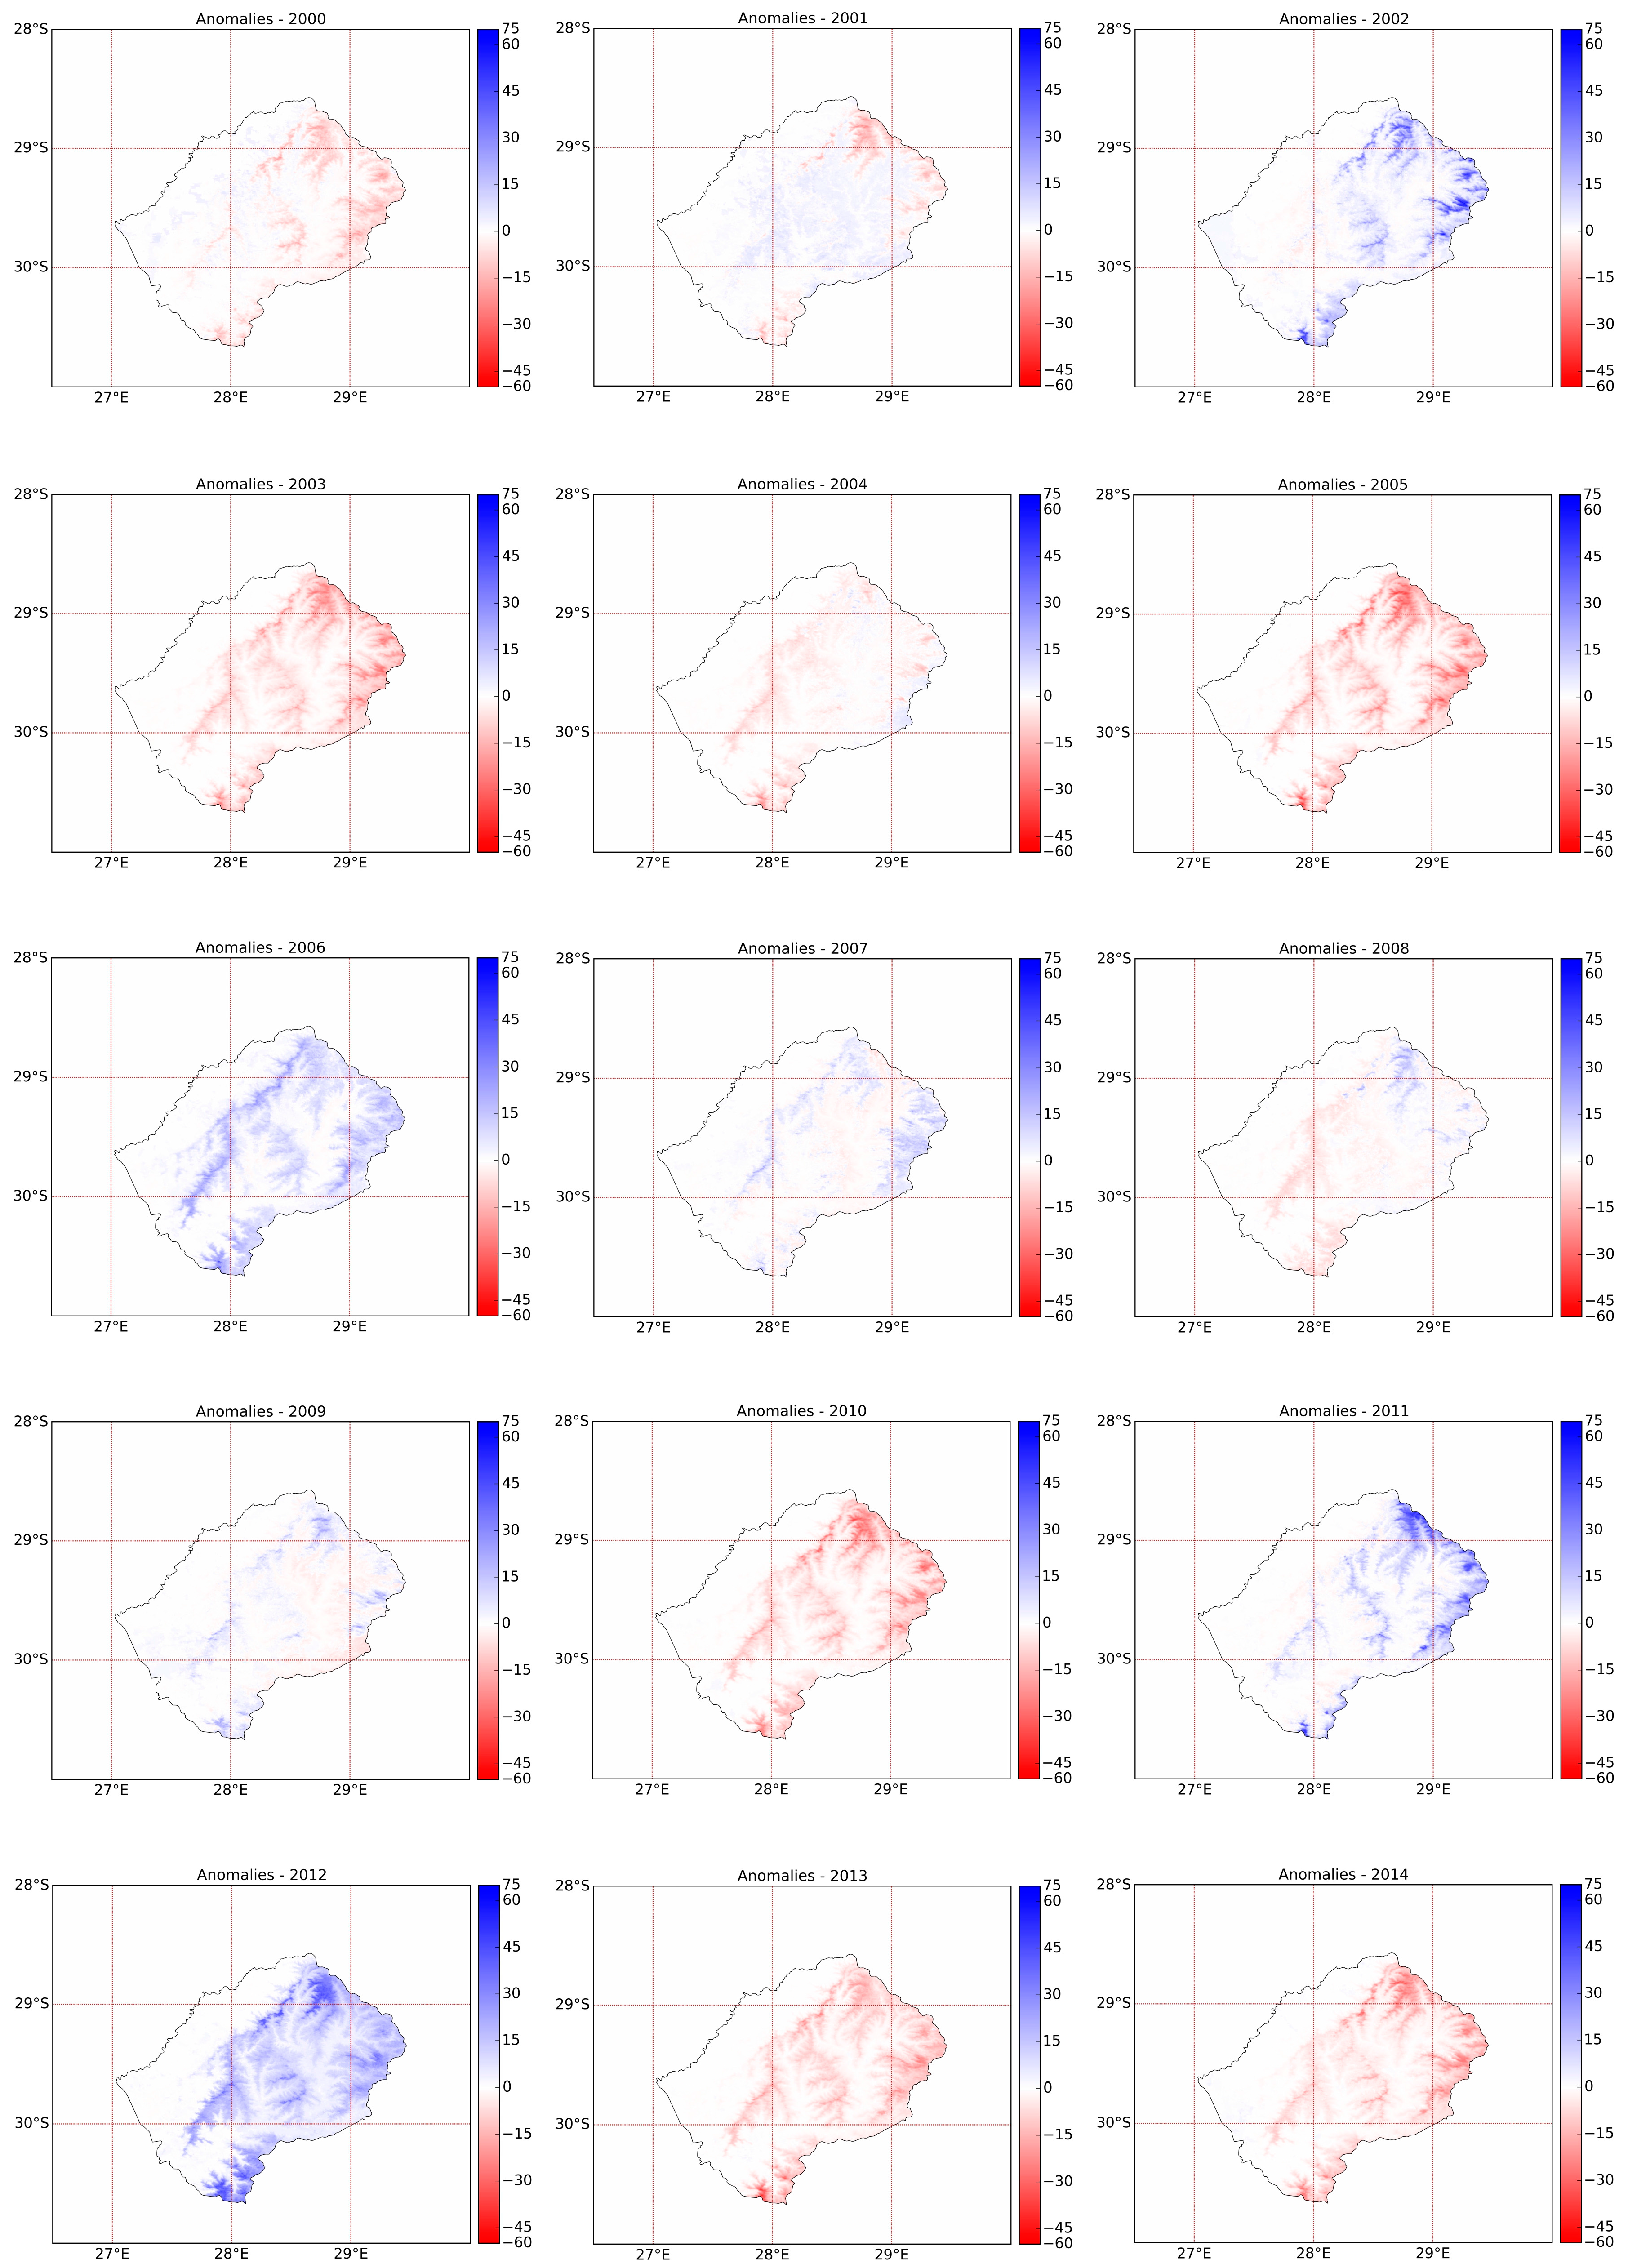
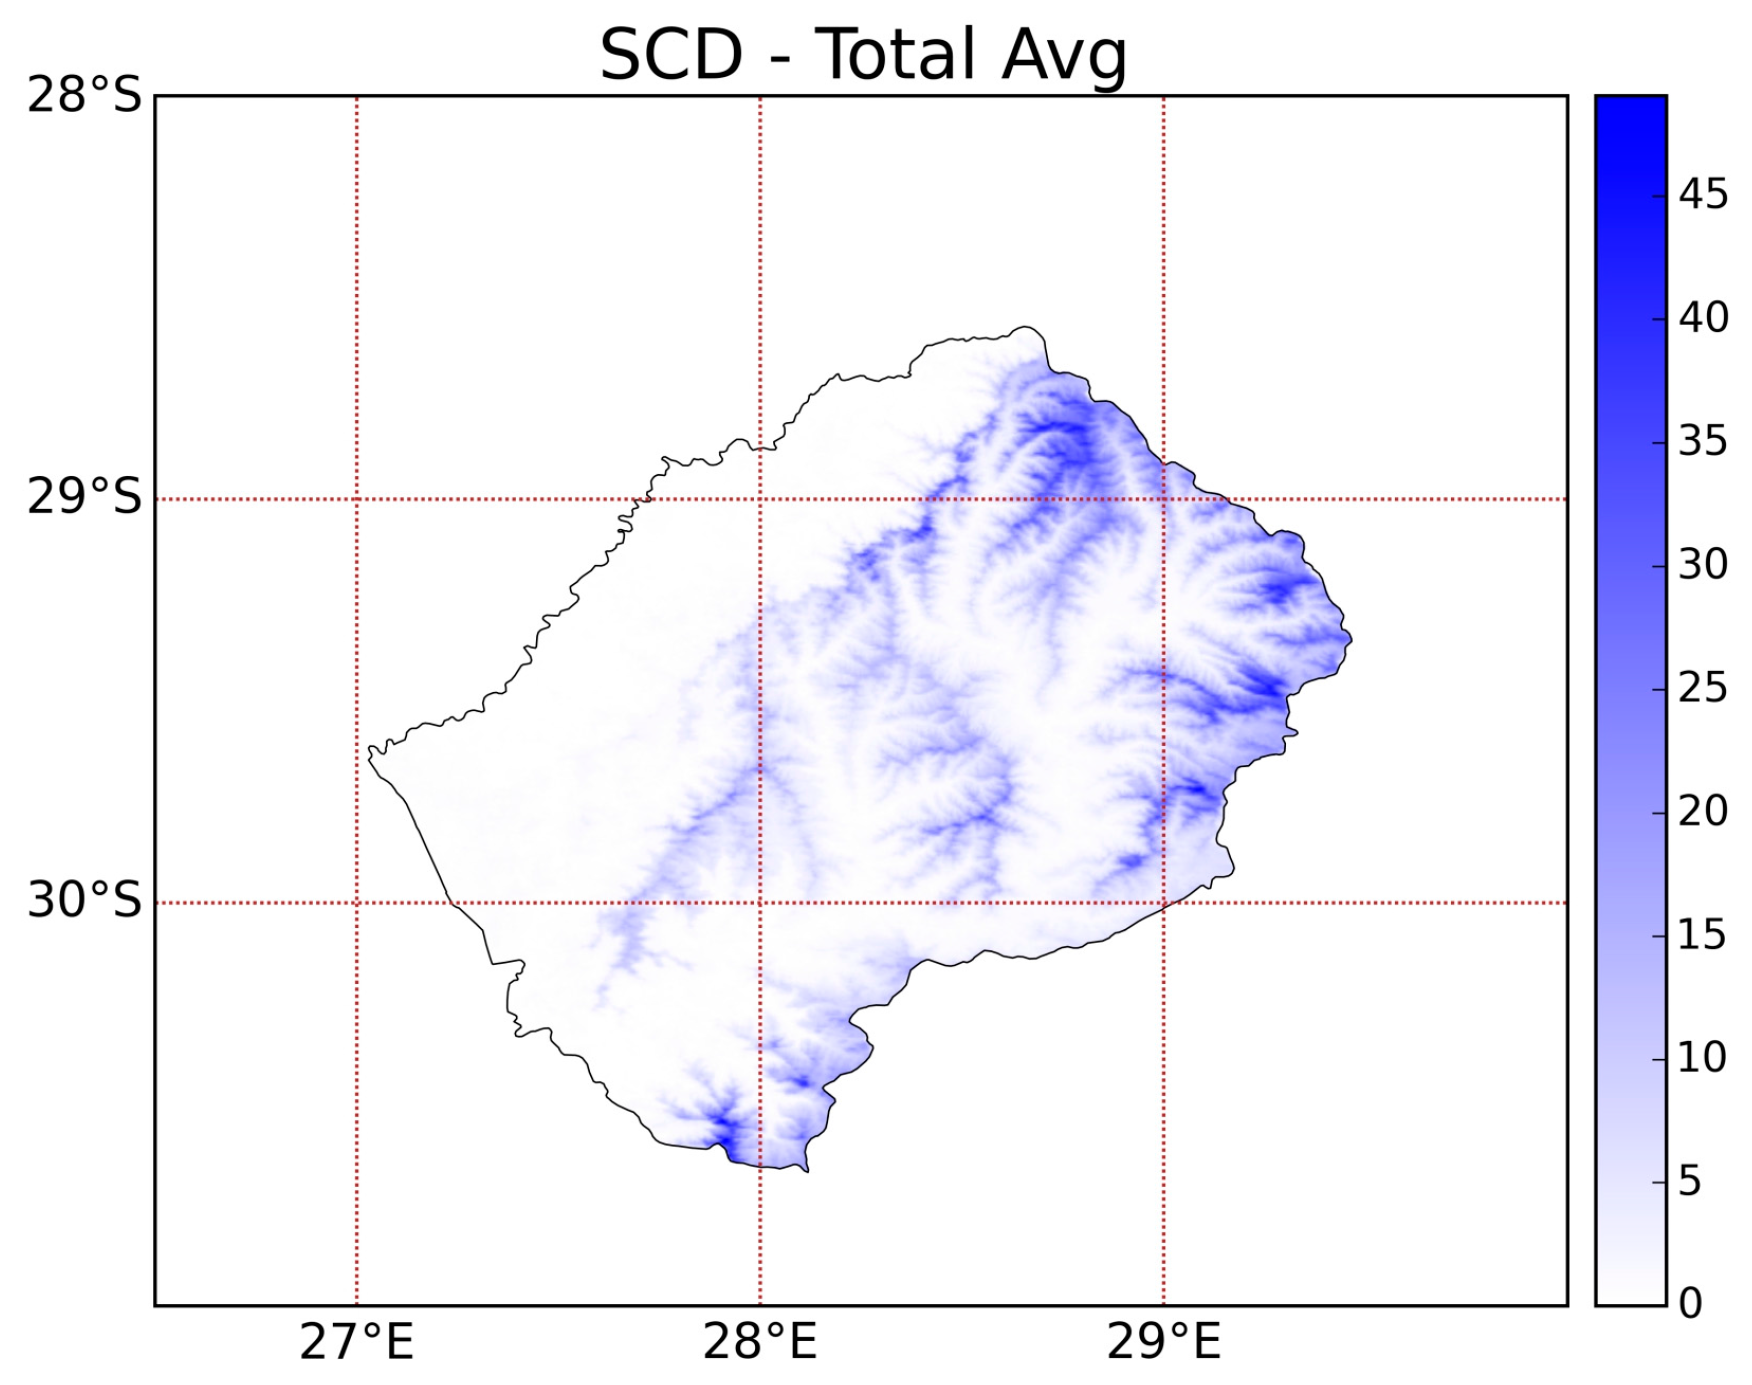
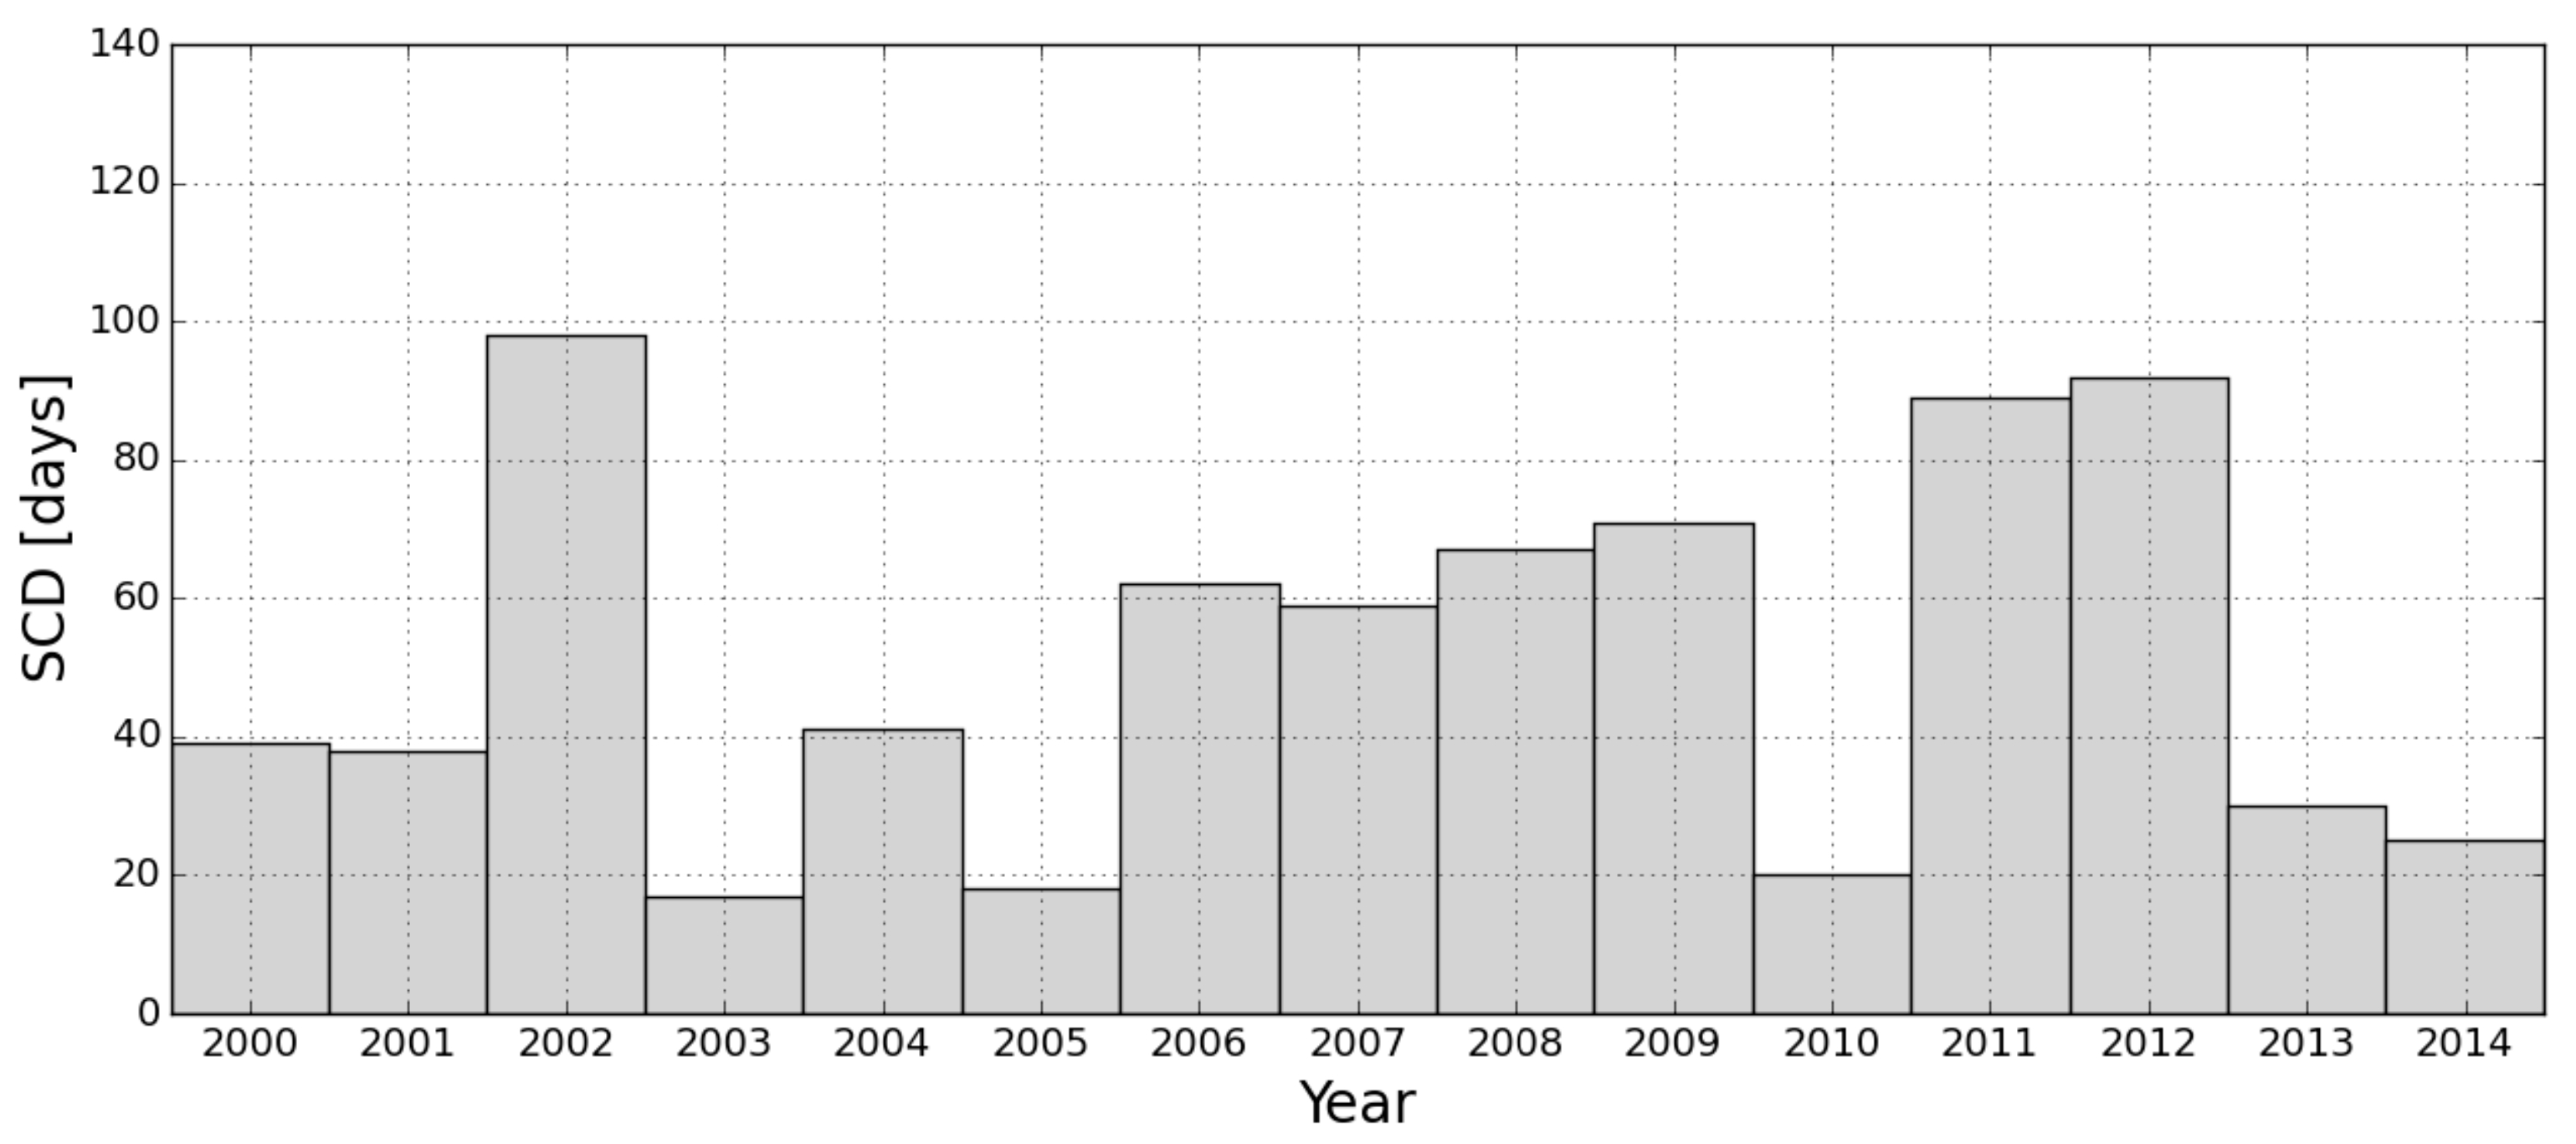
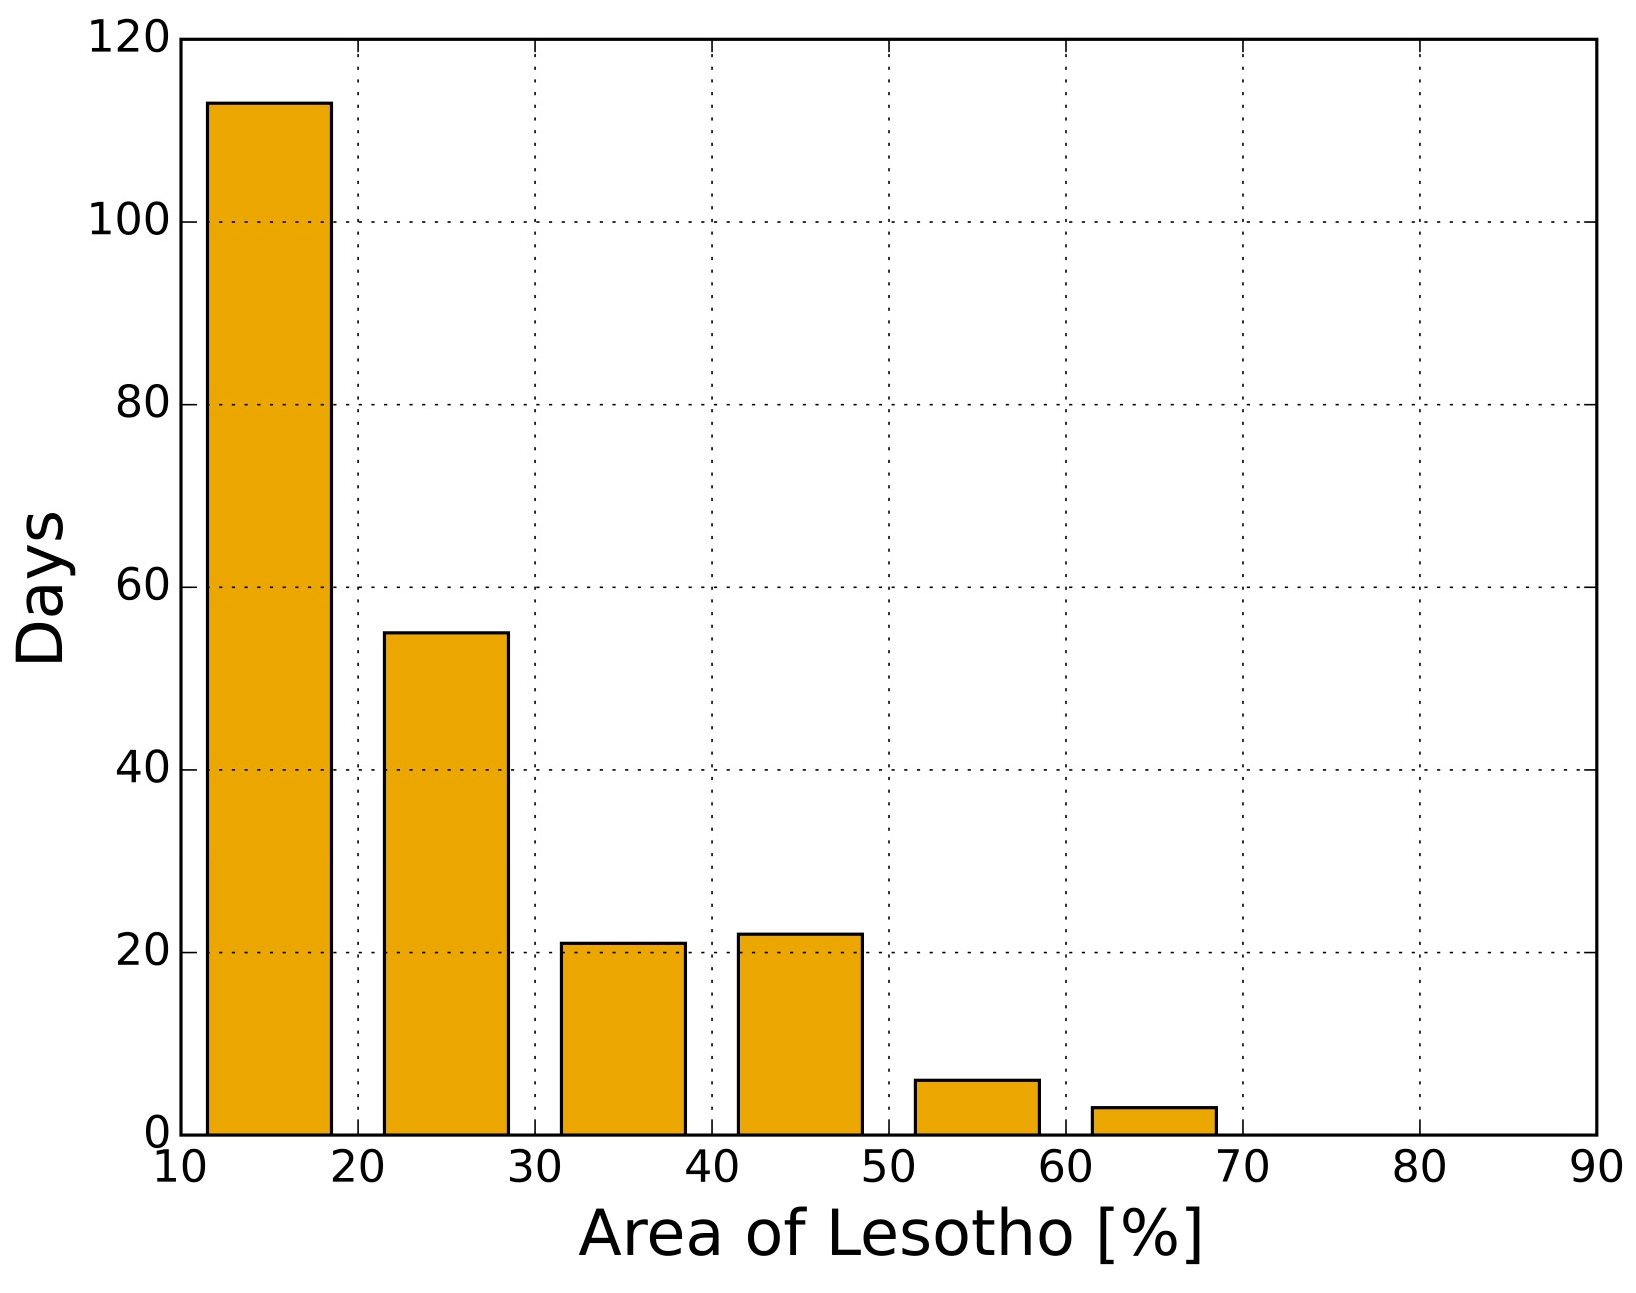
3.3. Analysis of Variability
4. Discussion
5. Conclusions and Outlook
Acknowledgments
Author Contributions
Conflicts of Interest
Abbreviations
| AATSR | Advanced Along-Track Scanning Radiometer |
| ASTER | Advanced Spaceborne Thermal Emission and Reflection Radiometer |
| AVHRR | Advanced Very High Resolution Radiometer |
| BEAM | toolbox and development platform for satellite remote sensing data |
| ESA | European Space Agency |
| FSC | Fractional Snow Cover |
| GDEM | Global Digital Elevation Model |
| IPCC-ARE5 | Intergovernmental Panel on Climate Change – Fifth Assessment Report |
| LMS | Lesotho Meteorological Service |
| MERIS | MEdium Resolution Imaging Spectrometer |
| MNDSI | MERIS Normalized Difference Snow Index |
| MODIS | Moderate Resolution Imaging Spectroradiometer |
| NASA | National Aeronautics and Space Administration |
| NDSI | Normalized Difference Snow Index |
| NIR | Near Infrared |
| RGB | Red-Green-Blue |
| SE | Snow Extent |
| SWIR | Shortwave Infrared |
| TM | Thematic Mapper |
| USGS | United States Geological Survey |
| VIS | Visible Spectrum |
Appendix

References
- Sene, K.J.; Jones, D.A.; Meigh, J.R.; Farquharson, F.A.K. Rainfall and flow variations in the Lesotho Highlands. Int. J. Climatol. 1998, 18, 329–345. [Google Scholar] [CrossRef]
- Nel, W.; Sumner, P.D. First rainfall data from the KZN Drakensberg escarpment edge (2002 and 2003). Water SA 2005, 31, 399–402. [Google Scholar]
- IPCC. Climate Change 2013: The Physical Science Basis. In Contribution of Working Group I to the Fifth Assessment Report of the Intergovernmental Panel on Climate Change; Stocker, T.F., Qin, D., Plattner, G.-K., Tignor, M., Allen, S.K., Boschung, J., Nauels, A., Xia, Y., Bex, V., Midgley, P.M., Eds.; Cambridge University Press: Cambridge, UK; New York, NY, USA, 2013; p. 1535. [Google Scholar]
- Nel, W.; Sumner, P.D. Rainfall and temperature attributes on the Lesotho–Drakensberg escarpment edge, Southern Africa. Geogr. Ann. 2008, 90, 97–108. [Google Scholar] [CrossRef]
- Lesotho Meteorological Service; (LMS, Maseru, Lesotho). Personal communication of Lesotho Meteorological Service, 2015.
- Dozier, J. Spectral signature of alpine snow cover from the Landsat Thematic Mapper. Remote Sens. Environ. 1989, 28, 9–22. [Google Scholar] [CrossRef]
- Tedesco, M. (Ed.) Remote Sensing of the Cryosphere; John Wiley & Sons: Oxford, UK, 2015; p. 432.
- Nolin, A.W. Recent advances in remote sensing of seasonal snow. J. Glaciol. 2011, 56, 1141–1150. [Google Scholar] [CrossRef]
- Rees, G. Remote Sensing of Snow and Ice; Taylor and Francis: Cambridge, UK, 2005; p. 312. [Google Scholar]
- Dozier, J.; Painter, T.H. Multispectral and hyperspectral remote sensing of alpine snow properties. Annu. Rev. Earth Planet. Sci. 2004, 32, 465–494. [Google Scholar] [CrossRef]
- Durand, M.; Molotch, N.P.; Margulis, S.A. Merging complementary remote sensing datasets in the context of snow water equivalent reconstruction. Remote Sens. Environ. 2008, 112, 1212–1225. [Google Scholar] [CrossRef]
- Hüsler, F.; Jonas, T.; Riffler, M.; Musial, J.P.; Wunderle, S. A satellite-based snow cover climatology (1985–2011) for the European Alps derived from AVHRR data. Cryosphere 2014, 8, 73–90. [Google Scholar] [CrossRef]
- Parajka, J.; Pepe, M.; Rampini, A.; Rossi, S.; Blöschl, G. A regional snow-line method for estimating snow cover from MODIS during cloud cover. J. Hydrol. 2010, 381, 203–212. [Google Scholar] [CrossRef]
- Parajka, J.; Bloeschl, G. Validation of MODIS snow cover images over Austria. Hydrol. Earth Syst. Sci. 2006, 10, 679–689. [Google Scholar] [CrossRef]
- Hall, D.K.; Riggs, G.A.; Salomonson, V.V. Development of methods for mapping global snow cover using Moderate Resolution Imaging Spectroradiometer data. Remote Sens. Environ. 1995, 54, 127–140. [Google Scholar] [CrossRef]
- Marchane, A.; Jarlan, L.; Hanich, L.; Boudhar, A.; Gascoinb, S.; Tavernier, A.; Filali, N.; Le Pageb, M.; Hagolle, O.; Berjamye, B. Assessment of daily MODIS snow cover products to monitor snow cover dynamics over the Moroccan Atlas mountain range. Remote Sens. Environ. 2015, 160, 72–86. [Google Scholar] [CrossRef]
- Sankey, T.; Donald, J.; McVay, J.; Ashley, M.; O'Donnell, F.; Lopez, S.M.; Springer, A. Multi-scale analysis of snow dynamics at the southern margin of the North American continental snow distribution. Remote Sens. Environ. 2015, 169, 307–319. [Google Scholar] [CrossRef]
- Zhang, G.; Xie, H.; Yao, T.; Liang, T.; Kang, S. Snow cover dynamics of four lake basins over Tibetan Plateau using time series MODIS data (2001–2010). Water Resour. Res. 2012, 48, W10529. [Google Scholar] [CrossRef]
- Yu, J.; Zhang, G.; Yao, T.; Xie, H.; Zhang, H.; Ke, C.; Yao, R. Developing Daily Cloud-Free Snow Composite Products From MODIS Terra– Aqua and IMS for the Tibetan Plateau. IEEE Trans. Geosci. Remote Sens. 2016, 54, 2171–2180. [Google Scholar] [CrossRef]
- Ramsey, B.H. Prospects for the Interactive Multisensor Snow and Ice Mapping System (IMS). In Proceedings of the 57th Eastern Snow Conference, Syracuse, New York, NY, USA, 18–19 May 2000.
- Gafurov, A.; Bardossy, A. Cloud removal methodology from MODIS snow cover product. Hydrol. Earth Syst. Sci. 2009, 13, 1361–1373. [Google Scholar] [CrossRef]
- Mulder, N.; Grab, S.W. Contemporary spatio-temporal patterns of snow cover over the Drakensberg. South Afr. J. Sci. 2009, 105, 228–233. [Google Scholar]
- Landsat Project Science Office. Landsat 7 Science Data User's Handbook; NASA's Goddard Space Flight Center: Greenbelt, MD, USA. Available online: http://landsathandbook.gsfc.nasa.gov/ (accessed on 14 April 2016).
- Grab, S.W.; Linde, J.H. Mapping exposure to snow in a developing African context: Implications for human and livestock vulnerability in Lesotho. Nat. Hazards 2014, 71, 1537–1560. [Google Scholar] [CrossRef]
- Linde, J.H. Spatio-Temporal Trends for Long-Lasting Contemporary Snow in Lesotho: Implications for Human and Livestock Vulnerability. Master’s Thesis, University of the Witwatersrand, Johannesburg, 2011. [Google Scholar]
- Riggs, G.A.; Hall, D.K.; Salomonson, V.V. MODIS Snow Products User Guide to Collection 5, Nov. 2006. Available online: http://modis-snow-ice.gsfc.nasa.gov/?c=userguides (accessed on 10 November 2015).
- Hart, C.G.N.; Reason, C.J.C.; Fauchereau, N. Cloud bands over southern Africa: Seasonality, contribution to rainfall variability and modulation by the MJO. Clim. Dyn. 2013, 41, 1199–1212. [Google Scholar] [CrossRef]
- RCMRD Geoportal Lesotho Land Cover 2000 Scheme II. Available online: http://geoportal.rcmrd.org/layers/servir%3Alesotho_landcover_2000_scheme_ii (accessed on 3 May 2016).
- Hall, D.K.; Riggs, G.A. Accuracy assessment of the MODIS snow products. Hydrol. Process. 2007, 21, 1534–1547. [Google Scholar] [CrossRef]
- Rittger, K.; Painter, T.H.; Dozier, J. Assessment of methods for mapping snow cover from MODIS. Adv. Water Resour. 2012, 51, 367–380. [Google Scholar] [CrossRef]
- MOD/MYD10A1 Products. Available online: http://n5eil01u.ecs.nsidc.org/SAN/MOSA/MOD10A1.005/ (accessed on 20 May 2015).
- Thompson, J.A.; Paull, D.J.; Lees, B.G. An Improved Liberal Cloud-Mask for Addressing Snow/Cloud Confusion with MODIS. Photogramm. Eng. Remote Sens. 2015, 81, 119–129. [Google Scholar]
- Bormann, K.J.; McCabe, M.F.; Evans, J.P. Satellite based observations for seasonal snow cover detection and characterization in Australia. Remote Sens. Environ. 2012, 123, 57–71. [Google Scholar] [CrossRef]
- MOD/MYD09GA Product. Available online: http://e4ftl01.cr.usgs.gov/MOLT/MOD09GA.005/ (accessed on 6 July 2015).
- Salomonson, V.V.; Appel, I. Estimating fractional snow cover from MODIS using the normalized difference snow index. Remote Sens. Environ. 2004, 89, 351–360. [Google Scholar] [CrossRef]
- Salomonson, V.V.; Appel, I. Development of the Aqua MODIS NDSI fractional snow cover algorithm and validation results. IEEE Trans. Geosci. Remote Sens. 2006, 44, 1747–1756. [Google Scholar] [CrossRef]
- Landsat Thematic Mapper Data. Available online: http://earthexplorer.usgs.gov/ (accessed on 10 April 2015).
- MERIS L1b Data. Available online: http://merisfrs-merci-ds.eo.esa.int/merci/welcome.do (accessed on 29 January 2015).
- Tachikawa, T.; Hato, M.; Kaku, M.; Iwasaki, A. The characteristics of ASTER GDEM version 2. IGARSS 2011. [Google Scholar] [CrossRef]
- Meyer, D. (Ed.) ASTER Global Digital Elevation Model Version 2—Summary of Validation Results; NASA Land Processes Distributed Active Archive Center and the Joint Japan-US ASTER Science Team: Sioux Falls, SD, USA, 2011.
- Dozier, J. Estimation of properties of alpine snow from the Landsat Thematic Mapper. Adv. Space Res. 1989, 9, 207–215. [Google Scholar] [CrossRef]
- Hall, D.K.; Riggs, G.A.; Salomonson, V.V.; DiGirolamo, N.E.; Bayr, K.J. MODIS snow-cover products. Remote Sens. Environ. 2002, 83, 181–194. [Google Scholar] [CrossRef]
- Riggs, G.A.; Hall, D.K. Snow Mapping with the MODIS Aqua Instrument. In Proceedings of the 61st Eastern Snow Conference, Portland, ME, USA, 9–11 June 2004; pp. 81–84.
- Klein, A.G.; Hall, D.K.; Riggs, G.A. Improving snow-cover mapping in forests through the use of a canopy reflectance model. Hydrol. Process. 1998, 12, 1723–1744. [Google Scholar] [CrossRef]
- Lin, J.; Feng, X.; Xiao, P.; Li, H.; Wang, J.; Li, Y. Comparison of snow indexes in estimating snow cover fraction in a mountainous area in northwestern China. IEEE Geosci. Remote Sens. Lett. 2012, 9, 725–729. [Google Scholar]
- Mishra, V.D.; Negi, H.S.; Rawat, A.K.; Chaturvedi, A.; Singh, R.P. Retrieval of sub-pixel snow cover information in the Himalayan region using medium and coarse resolution remote sensing data. Int. J. Remote Sens. 2009, 30, 4707–4731. [Google Scholar] [CrossRef]
- FAO Forestry Department. Global Forest Resources Assessment: Country Report: Lesotho; Number 1545; Food and Agriculture Organization of the United Nations: Rome, Italy, 2010. [Google Scholar]
- Jain, S.; Goswami, A.; Saraf, A.K. Accuracy assessment of MODIS, NOAA and IRS data in snow cover mapping under Himalayan conditions. Int. J. Remote Sens. 2008, 29, 5863–5878. [Google Scholar] [CrossRef]
- Preusker, R.; Fischer, J.; Brockmann, C.; Zühlke, M.; Krämer, U.; Hünerbein, A. Cloud screening and snow detection with MERIS. In Proceedings of the MERIS AATSR Meeting, ESRIN, Frascati, Italy, 23 September 2008.
- Foppa, N.; Seiz, G. Inter-annual variations of snow days over Switzerland from 2000–2010 derived from MODIS satellite data. Cryosphere 2012, 6, 331–342. [Google Scholar] [CrossRef]
- Siljamo, N.; Hyvärinen, O. New Geostationary Satellite Based Snow-Cover Algorithm. J. Appl. Meteorol. Climatol. 2011, 50, 1275–1290. [Google Scholar] [CrossRef]
- Stevenson, M.; Jolliffe, T.; Stephenson, D.B. Forecast Verification: A Practitioner’s Guide in Atmospheric Science. Int. J. Forecast. 2006, 22, 403–405. [Google Scholar] [CrossRef]
- Hüsler, F.; Jonas, T.; Wunderle, S.; Albrecht, S. Validation of a modified snow cover retrieval algorithm from historical 1-km AVHRR data over the European Alps. Remote Sens. Environ. 2012, 121, 497–516. [Google Scholar] [CrossRef]
- King, P.; Riedi, J. Available online: http://modis-atmos.gsfc.nasa.gov/MOD06_L2/atbd.html (accessed on 24 November 2015).
- Ackerman, F.; Strabala, L.; Gumley, B.; Menzel, W.P. Discriminating Clear-Sky from Cloud with MODIS—Algorithm Theoretical Basis Document; Products: MOD35, ATBD-MOD-06; Cooperative Institute for Meteorological Satellite Studies, University of Wisconsin-Madison: Madison, WI, USA, 2010. [Google Scholar]
- Morriss, B.F.; Ochs, E.; Deeb, E.J.; Newman, S.D.; Daly, S.F.; Gagnon, J.J. Persistence-based temporal filtering for MODIS snow products. Remote Sens. Environ. 2016, 175, 130–137. [Google Scholar] [CrossRef]


| Snow Validation Source (Landsat-TM or ENVISAT-MERIS) | ||||
|---|---|---|---|---|
| yes | no | |||
| MODIS snow product | yes | h: hit | f: false | h + f |
| no | m: miss | z: zero | m + z | |
| h + m | f + z | n = h + f + m + z | ||
© 2016 by the authors; licensee MDPI, Basel, Switzerland. This article is an open access article distributed under the terms and conditions of the Creative Commons Attribution (CC-BY) license (http://creativecommons.org/licenses/by/4.0/).
Share and Cite
Wunderle, S.; Gross, T.; Hüsler, F. Snow Extent Variability in Lesotho Derived from MODIS Data (2000–2014). Remote Sens. 2016, 8, 448. https://doi.org/10.3390/rs8060448
Wunderle S, Gross T, Hüsler F. Snow Extent Variability in Lesotho Derived from MODIS Data (2000–2014). Remote Sensing. 2016; 8(6):448. https://doi.org/10.3390/rs8060448
Chicago/Turabian StyleWunderle, Stefan, Timm Gross, and Fabia Hüsler. 2016. "Snow Extent Variability in Lesotho Derived from MODIS Data (2000–2014)" Remote Sensing 8, no. 6: 448. https://doi.org/10.3390/rs8060448
APA StyleWunderle, S., Gross, T., & Hüsler, F. (2016). Snow Extent Variability in Lesotho Derived from MODIS Data (2000–2014). Remote Sensing, 8(6), 448. https://doi.org/10.3390/rs8060448