Article

Evaluation of PERSIANN-CDR for Meteorological Drought Monitoring over China

1
State Key Laboratory of Desert and Oasis Ecology, Xinjiang Institute of Ecology and Geography, Chinese Academy of Sciences, Urumqi 830011, China
2
University of Chinese Academy of Sciences, Beijing 100039, China
3
School of Atmospheric Sciences, Sun Yat-sen University, Guangzhou 510275, China
4
School of Civil Engineering and Environmental Science, University of Oklahoma, Norman, OK 73072, USA
5
Faculty of Environmental Sciences, University of Lay Adventists of Kigali (UNILAK), P.O. 6392, Kigali, Rwanda
*
Author to whom correspondence should be addressed.
Remote Sens. 2016, 8(5), 379; https://doi.org/10.3390/rs8050379
Submission received: 28 February 2016 / Revised: 13 April 2016 / Accepted: 27 April 2016 / Published: 4 May 2016
(This article belongs to the Special Issue Satellite Climate Data Records and Applications)

Abstract

:
In this paper, Precipitation Estimation from Remotely Sensed Information using Artificial Neural Networks–Climate Data Record (PERSIANN-CDR) is analyzed for the assessment of meteorological drought. The evaluation is conducted over China at 0.5° spatial resolution against a ground-based gridded China monthly Precipitation Analysis Product (CPAP) from 1983 to 2014 (32 years). The Standardized Precipitation Index (SPI) at various time scales (1 month to 12 months) is calculated for detecting drought events. The results show that PERSIANN-CDR depicts similar drought behavior as the ground-based CPAP in terms of capturing the spatial and temporal patterns of drought events over eastern China, where the intensity of gauge networks and the frequency of droughts are high. 6-month SPI shows the best agreement with CPAP in identifying drought months. However, large differences between PERSIANN-CDR and CPAP in depicting drought patterns and identifying specific drought events are found over northwestern China, particularly in Xinjiang and Qinghai-Tibet Plateau region. Factors behind this may be due to the relatively sparse gauge networks, the complicated terrain and the performance of PERSIANN algorithm.

Graphical Abstract

1. Introduction

Drought is one of the costliest and most widespread but also one of the most complex and least understood natural hazards [1,2,3]. As a recurring phenomenon, droughts may typically last for several months, or even years and can occur over most parts of the world including wet and humid regions [4]. Based on definitions and types, droughts can be grouped into four categories: (a) meteorological; (b) agricultural; (c) hydrological; and (d) socioeconomic [2,5]. This study focuses on the meteorological drought, which is related to the negative precipitation departure under normal conditions over an extended period of time. Due to increasing vulnerability of environment, exposure of assets and the change of climate, drought impacts on agriculture, water supply and economy have increased over decades [1,6]. Therefore, the development of drought monitoring tools is very necessary for drought risk management [7,8].
Drought index, expressed by a numeric number, is a common tool utilized to identify and monitor drought [9,10]. Various drought indexes such as Palmer Drought Severity Index (PDSI) [11], Standard Precipitation Index (SPI) [12], Rainfall Deciles (RD) [13], Bhalme–Mooley Index (BMI) [14] Surface Water Supply Index (SWSI) [15] and China-Z Index (CZI) [16] have been developed over time and have been used to monitor drought at different spatiotemporal scales [2,4,17,18]. The SPI and PDSI are two popular and widely used precipitation-based drought indices. However, based on the theory of the balance of moisture supply and demand, PDSI calculation relies on multiple climatic variables, which might be problematic in regions without high-quality ground data. PDSI algorithm does not work well in mountainous regions and snow covered areas, which tend to underestimate runoff conditions [19]. In addition, the results of PDSI may require re-normalization for comparison between different regions [4,7]. Developed by Mckee et al. [12] to quantify precipitation deficit at multiple time scales (i.e., 1-, 3-, 6-, and 12-month), SPI is recommended by the World Meteorological Organization (WMO) as the reference drought index [20]. It is easily adapted to local climate, solely based on long-term precipitation data and can be computed at almost any time scale with simple calculation procedure [21,22]. In addition to drought monitoring, SPI can also be used to identify flood periods [23,24]. Vicente-Serrano et al. [25] found that SPI was superior to PDSI for its flexible time scale and simple calculation. SPI has also been recommended for operational drought monitoring [26,27].
Precipitation measurements provide essential input information for drought monitoring and analysis. Conventional precipitation gauge network can provide long-term and accurate precipitation input for drought monitoring. In numerous studies [10,28,29,30], the SPIs were calculated by directly using long-term precipitation observations. However, in many regions of the world, the ground-based precipitation measurement networks have sparse and nonhomogeneous distribution, which limits their ability to identify and monitor droughts. In many cases, these measurement networks are even nonexistent [31]. The global Precipitation Climatology Project (GPCP) has provided three kinds of long-term global precipitation data by combining satellite and rain gauge information which include 2.5°/monthly and 2.5°/5-day spatiotemporal datasets with the time period from 1979 to present and 1°/daily dataset with the time period from 1996 to present [32,33,34,35,36]. However, these versions of GPCP products are insufficient to monitor and characterize drought due to their coarse resolution.
As an alternative precipitation input information for various applications at regional and global scale, a series of satellite-based quantitative precipitation estimates (QPE) algorithms have been developed by combining Infrared (IR) and passive microwave (PMW) observations from multiple satellite sensors in recent years, such as Tropical Rainfall Measuring Mission (TRMM), Multisatellite Precipitation Analysis (TMPA) [37], Climate Prediction Center morphing technique (CMORPH) [38], Global Satellite Mapping of Precipitation (GSMaP) [39], Precipitation Estimation from Remotely Sensed Information using Artificial Neural Networks (PERSIANN) [40,41] and the NRL-Blend satellite rainfall estimates from the Naval Research Laboratory (NRL) [42]. Because of their large-scale coverage, high spatial-temporal resolution and public accessibility, QPE products play an increasingly important role in various climate and hydrological applications such as flood and landslide monitoring [43,44,45,46]. A number of studies have focused on the evaluation of satellite-based precipitation products for drought applications [7,47,48,49,50,51]. However, the time series of such algorithms are too short for confident analysis of their usefulness for climate studies since PMW samples are limited or unavailable in pre-1997 period. According to the World Meteorological Organization (WMO) report, the conduction of climate studies needs at least 30 years of historical data [52]. In addition, reliable SPI calculation for drought monitoring requires long-term (more than 30 years) monthly precipitation records to ensure the confidence of results [12]. Wu et al. [53] studied the question of the length of precipitation records and found that the longer the precipitation record used in the SPI calculation was, the more reliable SPI values would be achieved, especially for the SPI values with timespan longer than 52 weeks.
The high-frequency droughts have become one of the most devastating natural disasters in China, which is the most populous and fast-growing economy in the world [54,55]. The drought affected area has significantly increased in the past 60 years not only in northern China with shortage of water resources but also in southern China with relatively abundant water resources [56]. In recent years, several extreme drought events struck southwestern China and the middle of lower Yangtze River. The annual average affected areas and damaged areas by drought disasters were nearly 0.21 × 10⁸ km2 and 0.10 × 10⁸ km2 from 1950 to 2010, which were 2.19 times and 1.77 times of the impacts of flood disasters, respectively [57]. Therefore, the reliable, long-term, and relatively high-resolution precipitation information is of critical importance for various hydro-climatological applications, including but not limited to drought early warning and water resources management [31].
Aimed at addressing the need to study the spatial and temporal characteristics of precipitation in a scale relevant to climate studies, PERSIANN Climate Data Record (PERSIANN-CDR) [58] has been developed to provide a dataset with a consistent, long-term period, high spatiotemporal resolution and near-global coverage. There have been some reports on the evaluation of the error characteristics of PERSIANN-CDR in different regions [31,58,59,60,61,62], Miao et al. [31] evaluated the performance of PERSIANN-CDR in capturing the behavior of daily extreme precipitation events in China and found that PERSIANN-CDR performs well in capturing the spatial and temporal patterns of daily precipitation extremes. Similar study has also been carried out to evaluate the error characteristics of PERSIANN-CDR, as well as some other high-resolution satellite-based precipitation products, in terms of spatial distribution, temporal variation, and frequency of precipitation with different intensities based on daily/0.25° resolution over mainland China [62]. It was found that the gauge-adjusted PERSIANN-CDR shows comparable performance with CPAP with high correlation coefficient (0.89) and low relative bias (3.8%), although an underestimation was also found over central part of Xinjiang in northwestern China. However, to our best knowledge, no efforts have been reported in evaluating and quantifying PERSIANN-CDR for meteorological droughts monitoring over China. Based on the previous studies on the error characteristics of PERSIANN-CDR, the primary goal of this study is to yield more insights on PERSIANN-CDR’s reliability for meteorological drought monitoring during the period from 1983 to 2014 over mainland China. This paper tries to answer questions such as: would the PERSIANN-CDR dataset be reliable to monitor drought conditions? The results of this study will provide the users and algorithm developers of PERSIANN-CDR with valuable information on its quality for drought monitoring applications.
The rest of this paper is organized as follows: Section 2 introduces the study area, PERSIANN-CDR product, the gridded ground observation dataset used as a reference and the evaluation metrics. Both the precipitation comparison and the SPI results comparison between PERSIANN-CDR and CPAP based on spatial and temporal evaluation metrics are provided in Section 3. A brief summary and conclusions follow in Section 4.

2. Study Area and Datasets
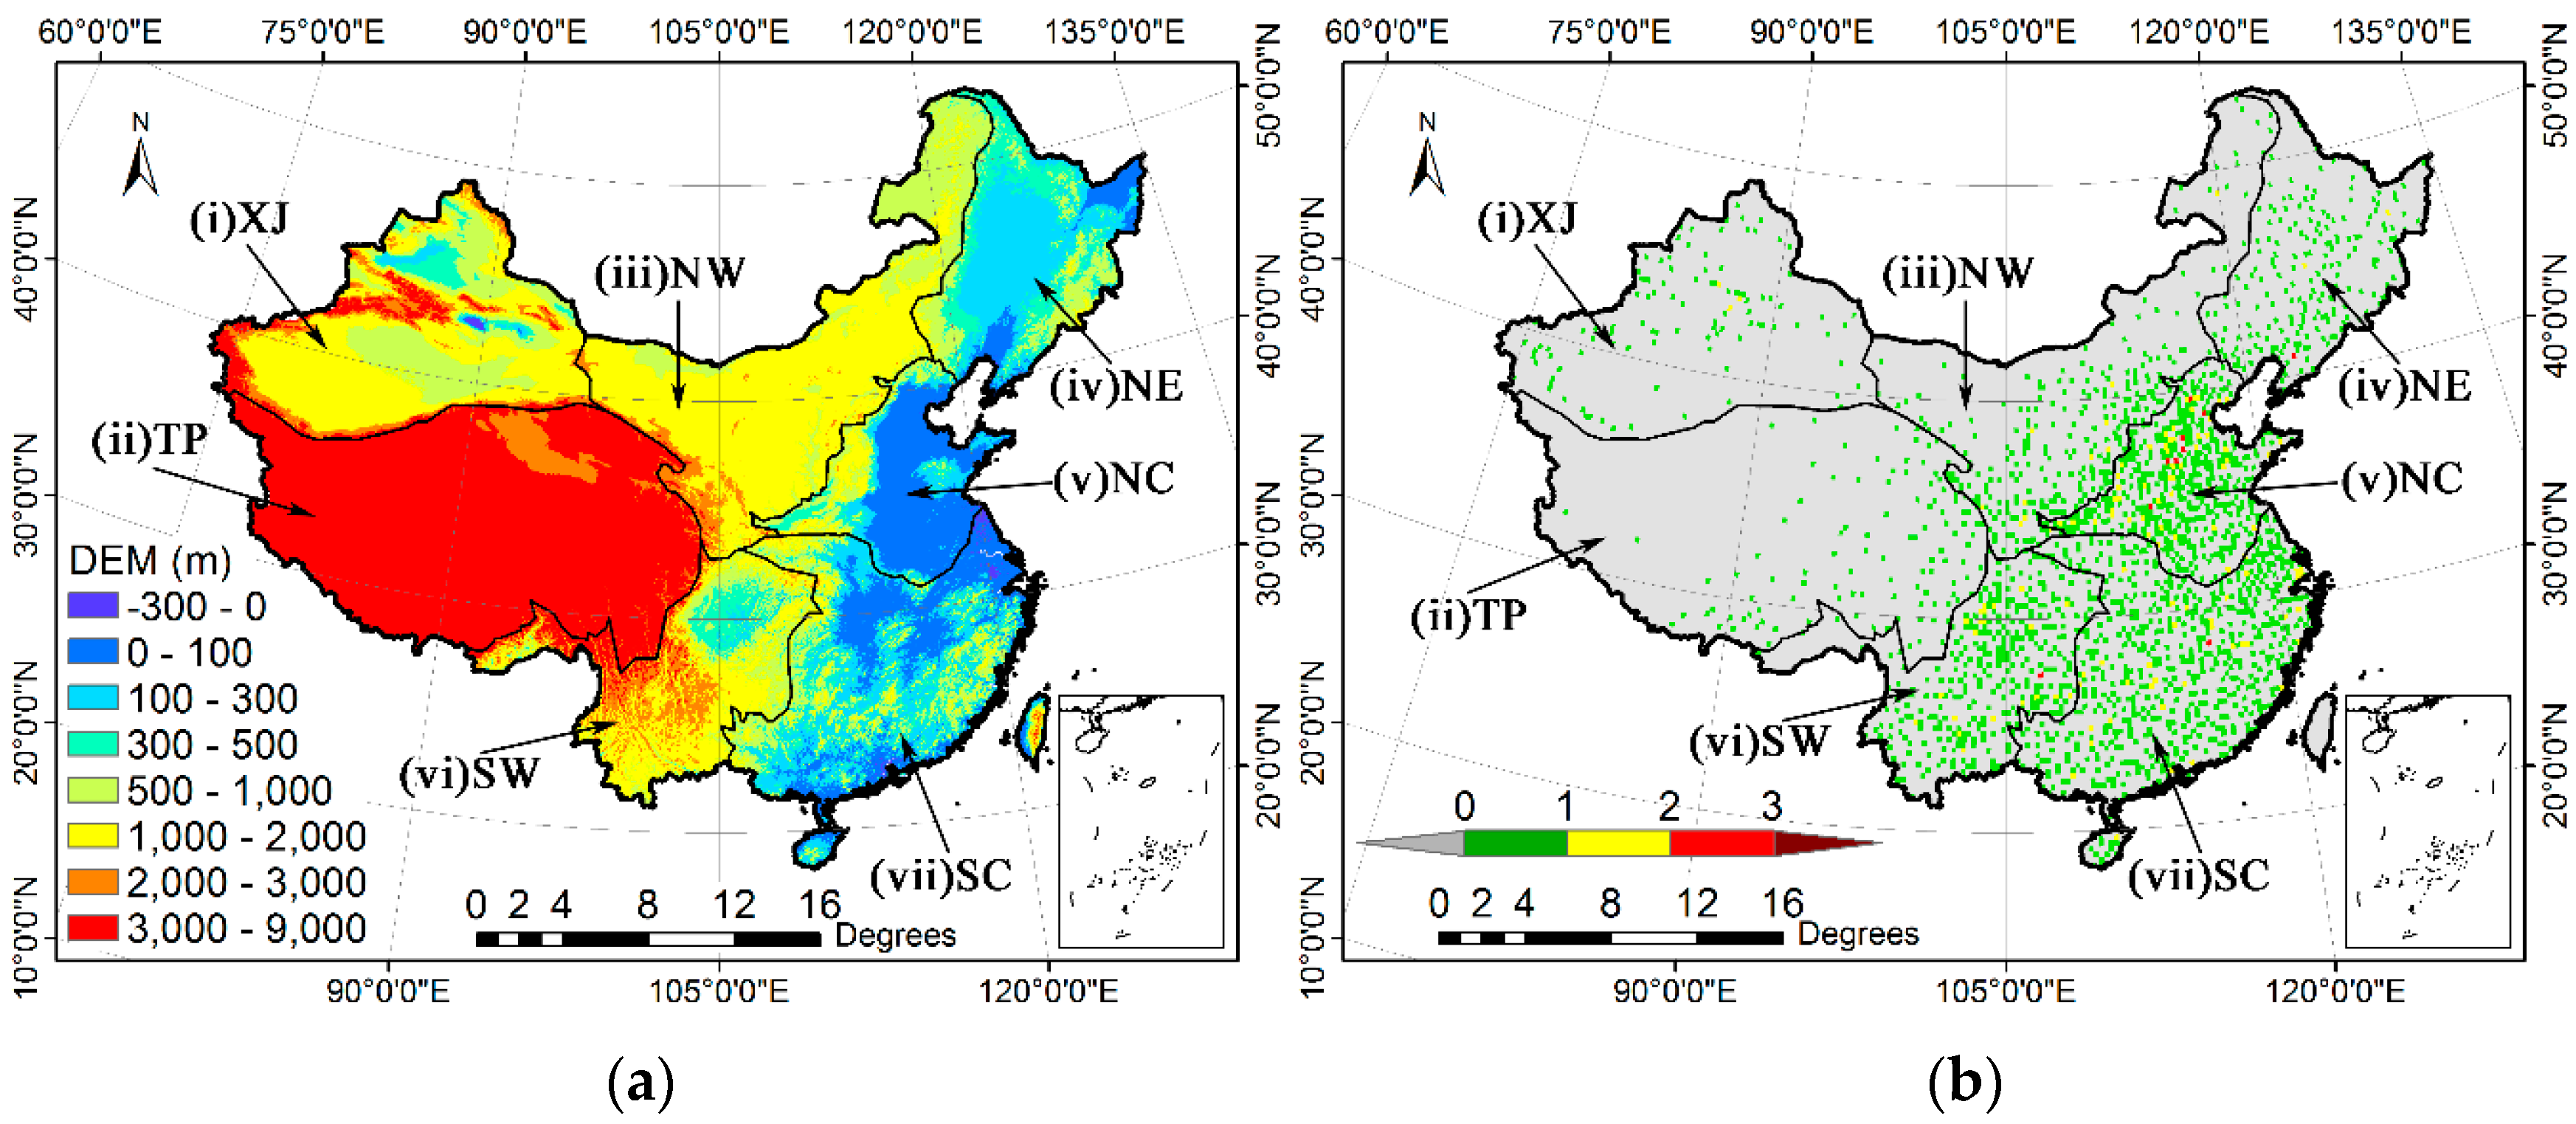
2.1. Study Area

The geography of China is variable, with regional differences in topography. Figure 1a shows the topographic variability from a digital elevation model (DEM). Similar to the divisions presented in [63], China is separated into seven subregions in terms of elevation, mountain ranges [64] and the annual mean precipitation distribution [65]. These subregions are shown in Figure 1 and are referred to as: (I) the Xinjiang (XJ) region, which has arid and semi-arid climate characteristics; (II) Qinghai-Tibet Plateau (TP) which has an average elevation about 4500 m; (III) Northwestern China (NW) bounded by the 400 mm annual precipitation isohyet; (IV) Northeastern China (NE) located in the north of Yan mountain; (V) Northern China (NC) located in the north of Qinling Mountains-Huai River line; (VI) Yunnan-Guizhou Plateau in southwestern China (SW) which is bounded by the Ta-pa Mountains and Wulingshan mountains to the north and east; and (VII) Southern China (SC), south of the Nanling mountains and southeast of the Wuyi Mountains. These sub regions’ abbreviations are labeled on Figure 1, and will be used herein.
The climate in China also varies greatly from region to region. The climate in XJ is characterized by semi-arid climates, and its precipitation is primarily influenced by the mid-latitude westerlies with moisture contributions from the North Atlantic Ocean [66]. Due to its semi-arid and arid climate, severe droughts are less frequent in XJ and TP. Most parts of China are located in the East Asia monsoon region, and the climate events (e.g., droughts and floods) throughout the year are determined by East Asia monsoon. The rainy season in most of China generally begins with the onset of the summer monsoon and ends with its withdrawal [67]. The monsoon rain belt moves from low latitudes to mid-high latitudes as the summer monsoon advances northward [68]. The time of monsoon shift frequently results in drought events in the east part of China [69,70], especially for the spring late drought in NC and summer and autumn drought over SW and SC. Southwestern China is dominated by the monsoon between the Qinghai-Tibet Plateau (TP) and the Indian Ocean.

2.2. PERSIANN-CDR Satellite Precipitation Dataset

As a new retrospective multi-satellite high-resolution precipitation product, PERSIANN-CDR [58] is developed for the National Climatic Data Center (NCDC) Climate Data Record (CDR) program in the National Oceanic and Atmospheric Administration (NOAA). Currently, PERSIANN-CDR provides 0.25° precipitation estimates at daily temporal resolution with near-global coverage from 60°S to 60°N from 1 January 1983 to 31 November 2014. PERSIANN-CDR is routinely produced with varying time latency due to the availability of its inputs, such as GridSat-B1 IR data and GPCP monthly rainfall data. Precipitation Estimation from Remotely Sensed Information using Artificial Neural Networks (PERSIANN) is an algorithm based on artificial neural networks (ANNs), which was developed by the University of Arizona in 1997 to estimate precipitation by using local cloud textures from IR images of geostationary satellites [40]. PERSIANN-CDR is generated from PERSIANN model by using GridSat-B1 infrared (IR) data [71] as the primary source of precipitation input information. In order to meet the calibration requirements, the PERSIANN model is pre-trained using the National Centers for Environmental Prediction (NCEP) stage IV hourly precipitation estimates. The parameters of PERSIANN are kept fixed and then PERSIANN model is run for the full historical record of GridSat-B1 IR precipitation data. To reduce the bias in precipitation estimates from PERSIANN model, while preserving the spatial and temporal patterns in high resolution, the achieved estimates are adjusted by using the 2.5°/monthly GPCP precipitation product [58]. More detailed information regarding the algorithm can be found at [72]. PERSIANN-CDR used in the present study is provided by NOAA’s National Centers for Environmental Information (http://www.ncdc.noaa.gov), and is available at [73]. In order to remain consistent with the reference product, PERSIANN-CDR is spatially aggregated to the 0.5° resolution, and then accumulated into monthly data for calculation of SPI.

2.3. The Gridded Observation Dataset

The China monthly Precipitation Analysis Product (CPAP) is produced and routinely calibrated by the National Meteorological Information Center (NMIC) and China Meteorological Administration (CMA, http://data.cma.cn/). The product was developed based on thin plate smoothing splines interpolation technique [74,75] to yield 0.5° data at a monthly temporal resolution from 1961 to the present. More than 2000 rain gauge observations were applied to generate this dataset [76,77]. The Digital Elevation Model (DEM) of China generated from GTOPO30 data was used to correct orographic errors. All the gauge data used in CPAP have undergone strict quality control in three levels including the extreme values’ check, internal consistency check, and spatial consistency check [70]. CPAP has been systematically validated by Zhao et al. [76,77] at daily temporal resolution and found that CPAP has very good agreements with gauge observations with low average root mean square error (RMSE, 0.49 mm/day) and high average correlation coefficient (CC, 0.93) over China. In addition, CPAP can capture the rainfall pattern over complicated terrain regions with higher accuracy because, not only the horizontal distance, but also local topographical features are taken into account in the CPAP algorithm [76,77]. Therefore, CPAP product can be used widely in weather/climate monitoring. However, the Chinese rain gauge network is distributed unevenly over China (Figure 1b). Gauge stations are densely spaced in eastern China where the climate is wet and the population is dense, whereas relatively sparse gauge stations are found in western China. Gauges are especially infrequent in the areas of NW, XJ and TP, all of which are dominated by semiarid and arid climate. The limited number and the interpolation technique could be a source of error in evaluation of PERSIANN-CDR [78]. It is worth mentioning that the gauges used in CPAP are not completely independent from those used in PERSIANN-CDR, since ~500 out of the total gauges (~2400) from CPAP are potentially applied in the GPCC dataset that is used to correct PERSIANN-CDR. The assessment results may be influenced to some extent by the location of coincident gauges. In this study, the monthly CPAP product is used as a reference dataset to evaluate the capability of PERSIANN-CDR precipitation product for meteorological drought monitoring.

2.4. The Standardized Precipitation Index (SPI)

The standardized precipitation index (SPI) developed by McKee et al. [12] is designed to assess anomalous precipitation by giving a numeric value to precipitation. It is able to characterize and compare meteorological droughts across areas with different climates [79]. SPI is calculated based on long-term precipitation data (at least 30 years) accumulated over a selected time scale [80]. Generally, precipitation is not normally distributed, so this long-term precipitation data is fitted to a gamma distribution first and then transformed into a Gaussian distribution through an equal probability transformation. SPI can be computed at different time scales from 1 to 24 months to indicate short or long-term drought events. In the present study, 1-month, 3-month, 6-month and 12-month time scales (SPI1, SPI3, SPI6 and SPI12), corresponding to the past 1, 3, 6, 12 months of observed precipitation totals respectively, are selected to represent short and long-term droughts. The SPI values range from −3 to +3 with positive values indicating wet conditions and negative values indicating dry conditions. Specific SPI drought categories are shown in Table 1. Since the SPI is a standardized index, the SPI values for different geographic regions as well as different seasons are independent and can be directly compared [7]. In our study, SPI is calculated grid by grid for both CPAP and PERSIANN-CDR with four time scales (i.e., SPI1, SPI3, SPI6, and SPI12) through a 32-years period over mainland China.

2.5. Statistical Evaluation Metrics

A series of traditional error indexes which include relative bias (RB), root mean square error (RMSE), Pearson linear correlation coefficient (CC) are used in this study. In order to avoid the strong dependence on the reference rainfall volume, fractional RMSE (FRMSE) is also introduced in this paper to evaluate precipitation estimation error in PERSIANN-CDR. RB, RMSE, CC and FRMSE are defined as follows:
R B = i = 1 N ( S i G i ) i = 1 N ( G i )
R M S E = 1 N i = 1 N ( S i G i ) 2
C C = i = 1 N ( S i S i ¯ ) ( G i G i ¯ ) i = 1 N ( S i S i ¯ ) 2 i = 1 N ( G i G i ¯ ) 2
F R M S E = 1 N i = 1 N ( S i G i ) 2 A v g ( G )
where S stands for satellite-based PERSIANN-CDR product and G represents the gauge-based reference data (CPAP). RB and CC are dimensionless, and RMSE is in mm/month. In Equation (4), “Avg()” refers to the average. RB, when multiplied by 100, denotes the degree of overestimation or underestimation in percentage. All above statistics have been computed on a grid-by-grid basis over China.

3. Results and Discussion

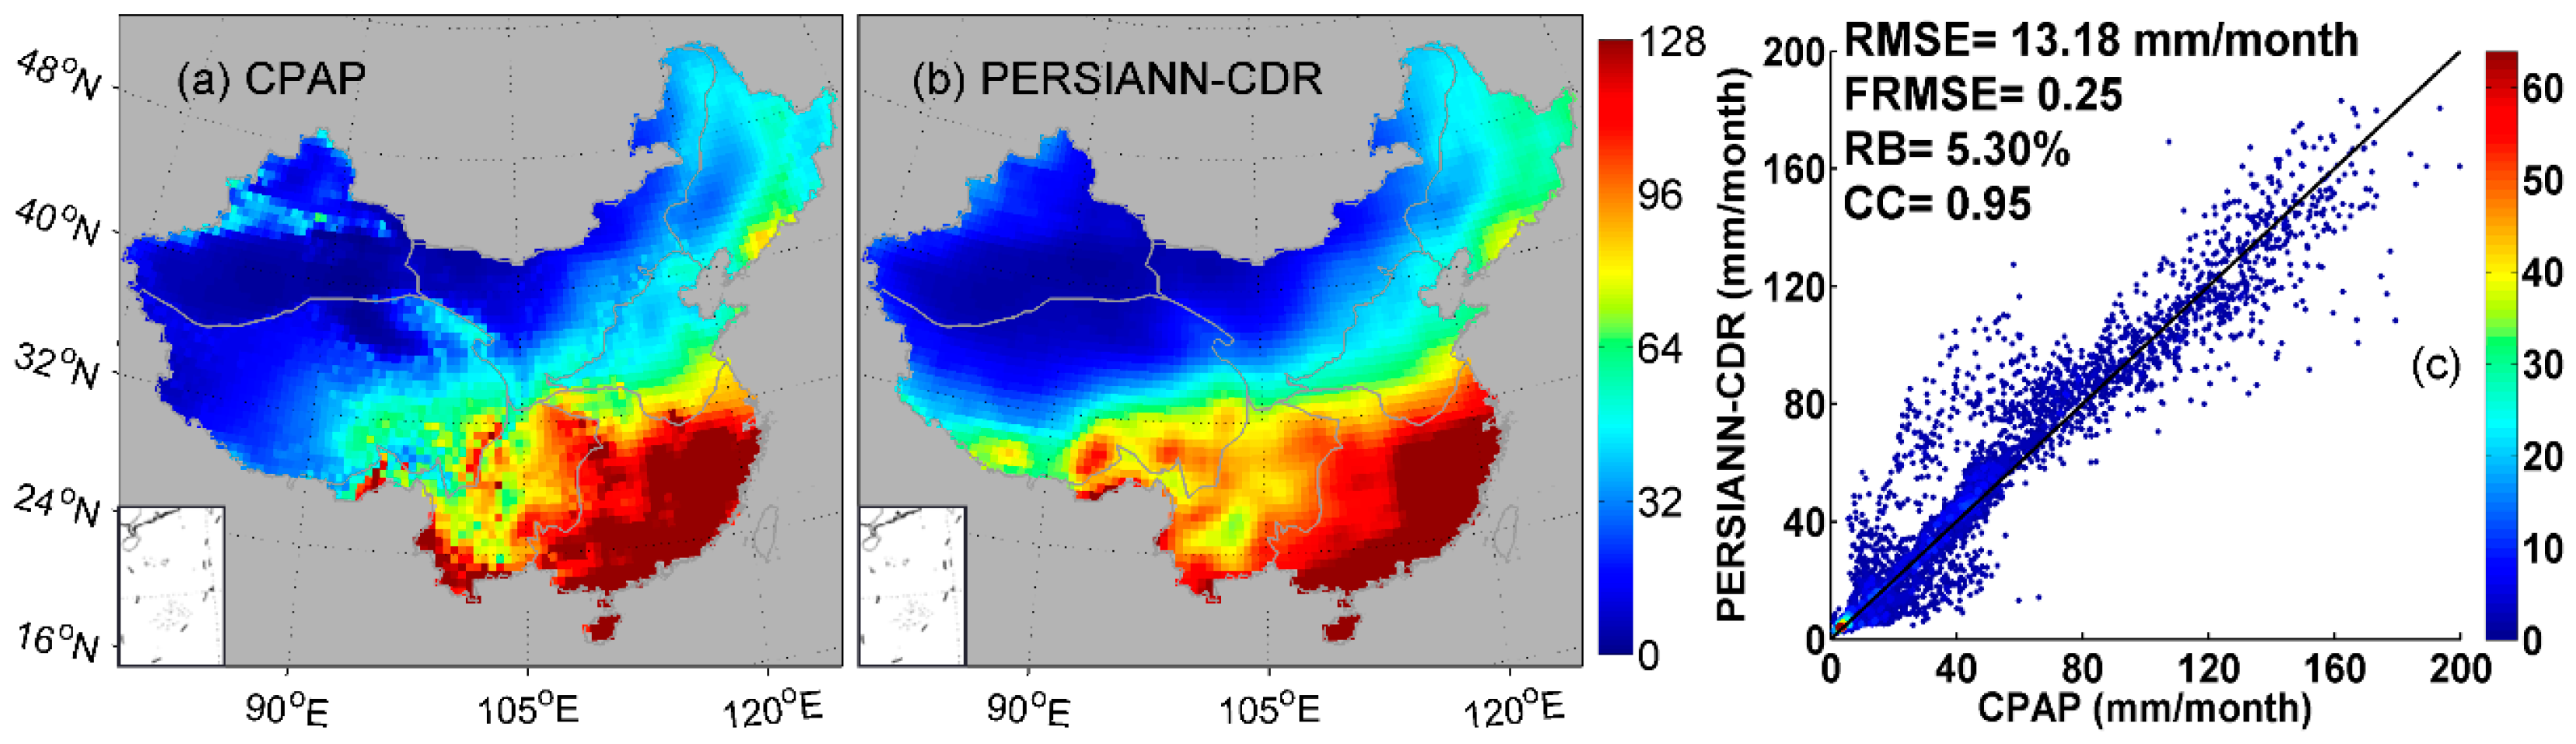
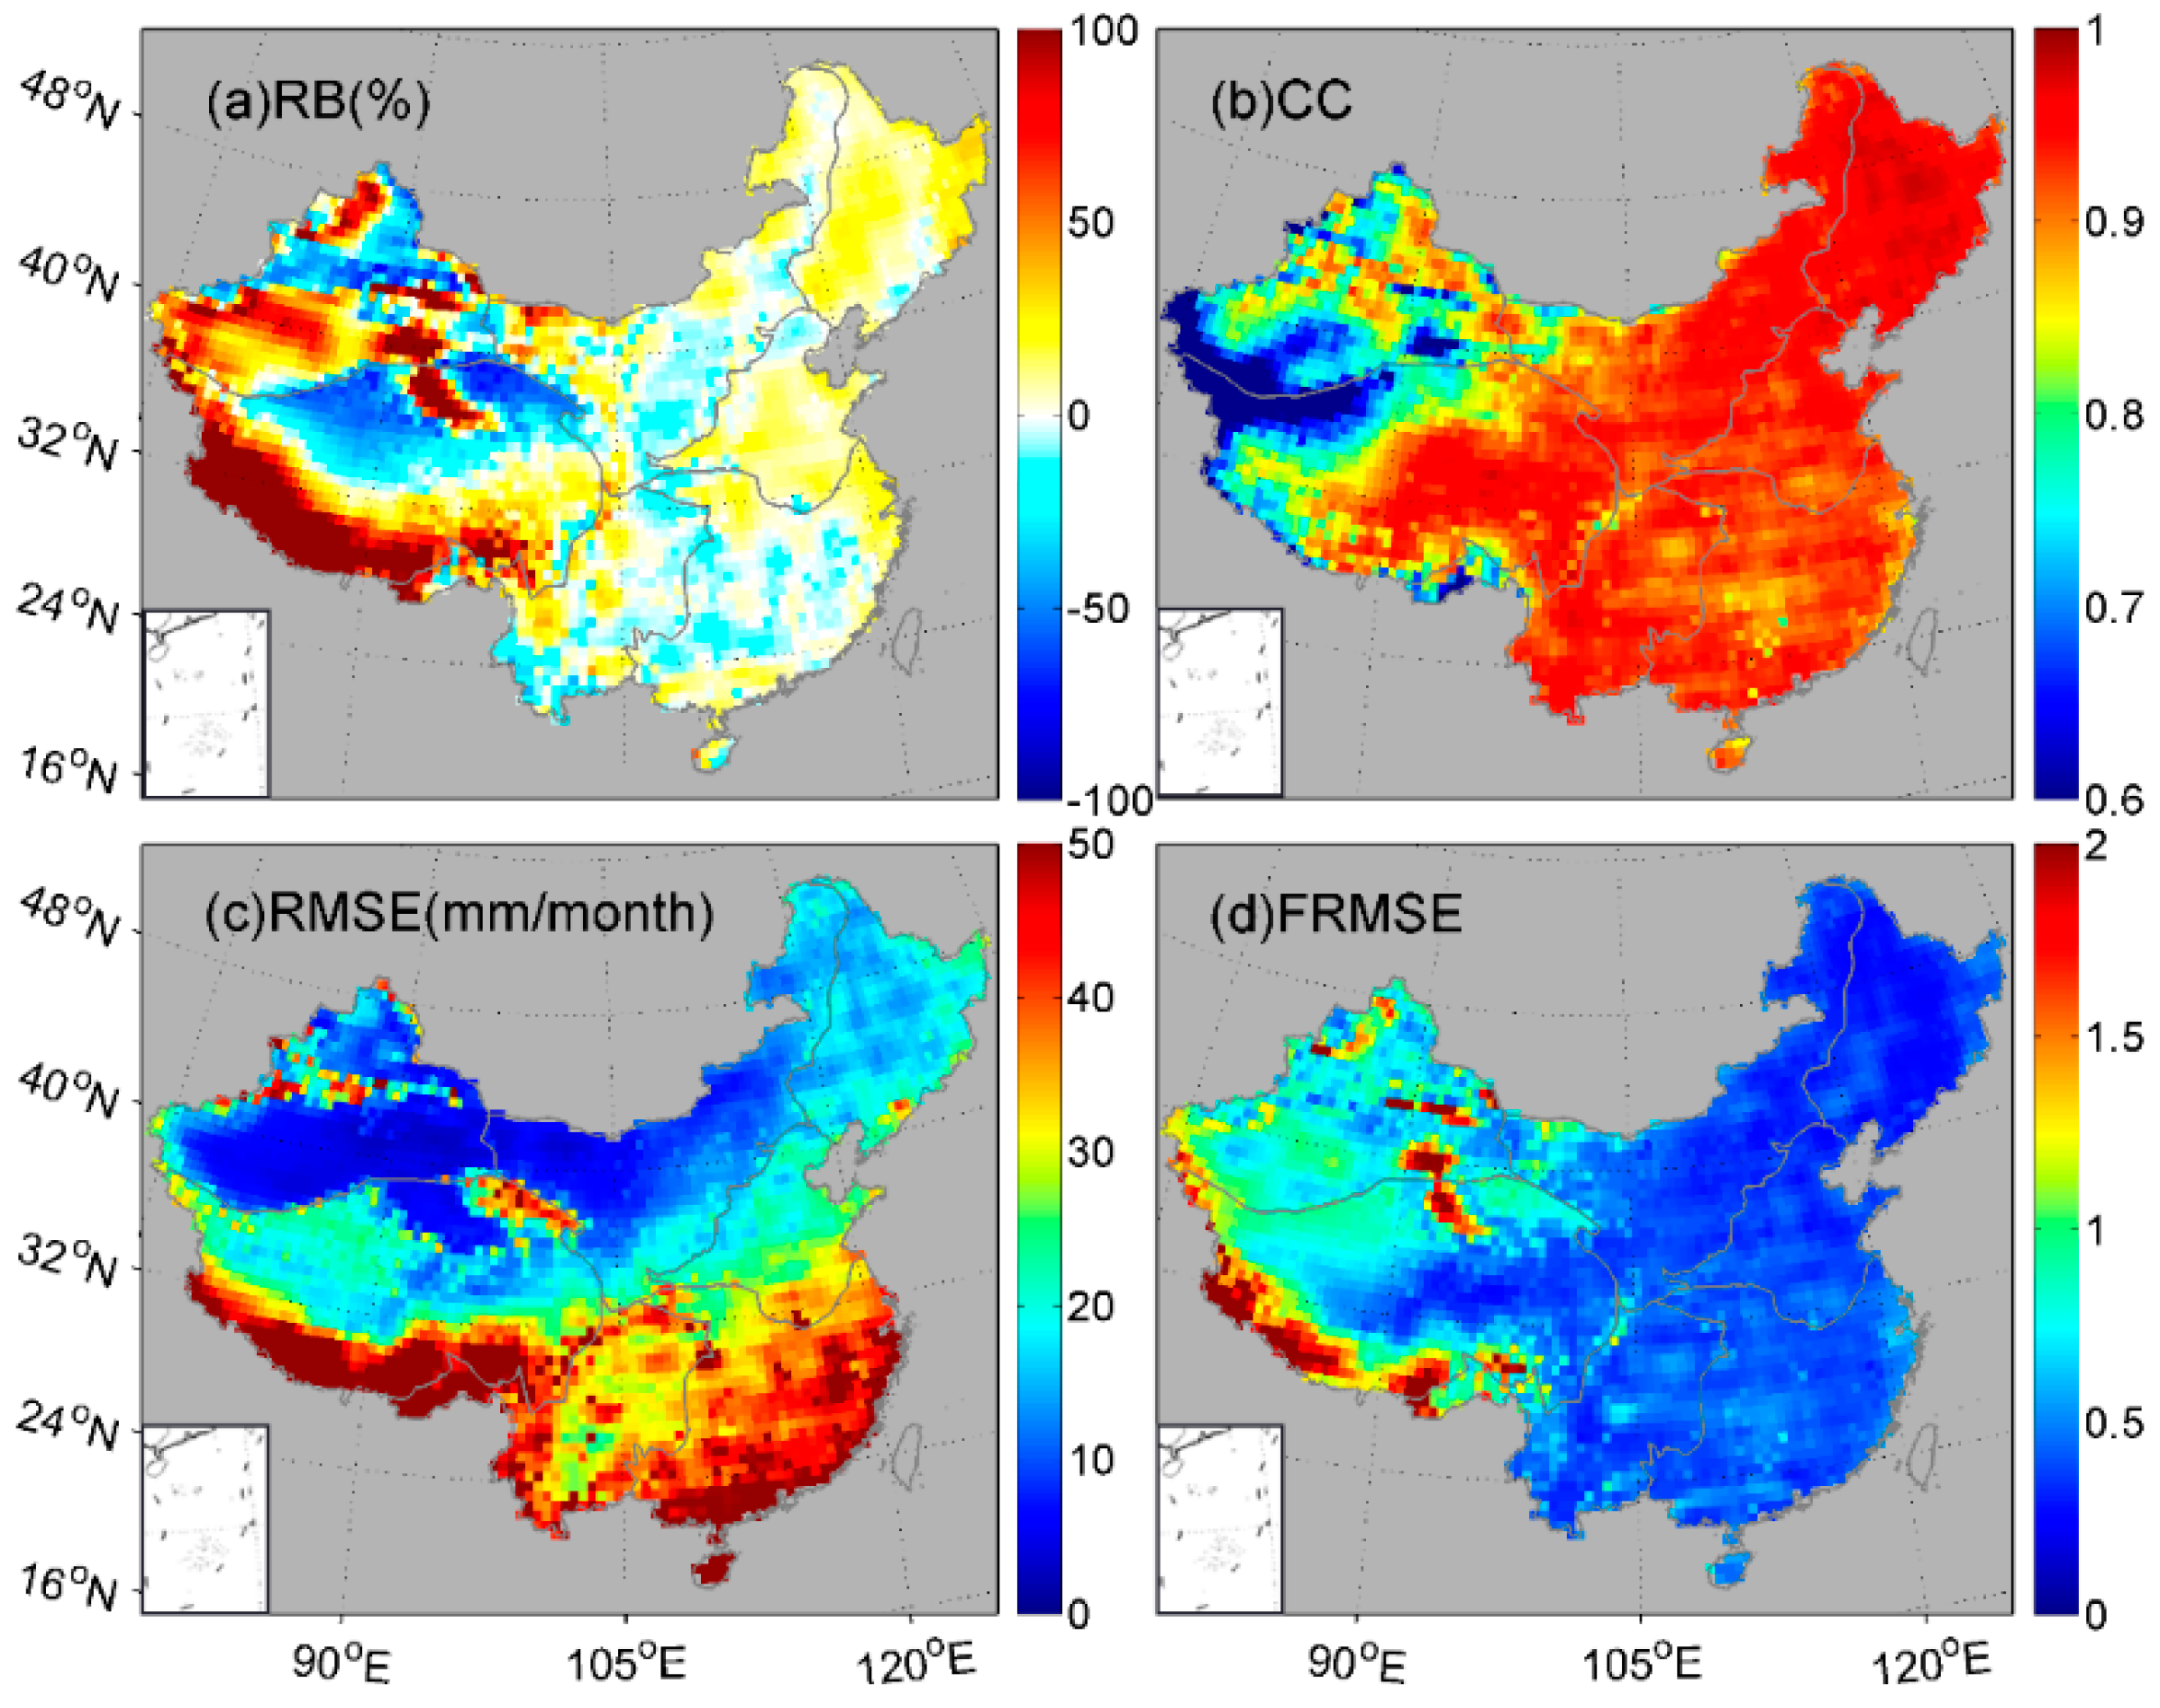
3.1. Precipitation Evaluation

Precipitation is the only input requirement to calculate SPI. The accuracy of precipitation estimation may directly affect the accuracy of SPI. PERSIANN-CDR is evaluated in detecting precipitation relative to CPAP from January 1983 to December 2014 over mainland China. It is expected that the discrepancies in SPI estimates can be reflected by the estimating errors in precipitation spatial pattern and statistics between PERSIANN-CDR and CPAP. Figure 2 displays the distribution of 32 years monthly mean precipitation over China and the scatterplot with error statistics between CPAP and PERSIANN-CDR. Spatial distributions of RB, CC and FRMSE of PERSIANN-CDR versus CPAP are shown in Figure 3. The RB, CC, RMSE and FRMSE are calculated grid by grid with 32-year samples of monthly precipitation rates.
PERSIANN-CDR performs well in capturing the spatial pattern of precipitation, which is similar to that of CPAP with 32-year mean precipitation values decreasing from southeastern China to northwestern China, although the precipitation pattern of PERSIANN-CDR seems to be relatively smoother than CPAP. However, the agreement between PERSIANN-CDR and CPAP is not strong over northwestern part of China where there is relatively sparse and unevenly distributed rain gauges and dry climate. Specifically, PERSIANN-CDR seems to underestimate some precipitation in northwestern part of XJ and overestimate the precipitation over south part of TP. According to the corresponding scatterplot (Figure 2c), PERSIANN-CDR has good agreement with gridded gauge dataset with a high CC (0.95) and low RB and RMSE (5.32% and 13.23 mm/month, respectively) over mainland China. High and positive CC values (>0.8), low RB and RMSE values (<12% and <0.2, respectively) between PERSIANN-CDR and CPAP are found in Figure 3 over most parts of China, especially for the eastern and southeastern China (i.e., NE, NC, SW and SC) where the drought events frequently occur. In terms of statistical analysis, it is found that the regions where CC values over 0.8 cover about 82.5% of the whole mainland China (Figure 3b). This indicates that PERSIANN-CDR shows good skill in estimating precipitation in most areas of China. However, large disagreements between PERSIANN-CDR and CPAP in detecting precipitation are found over the south (north) part of TP and XJ. The low CC values (<0.6) and high FRMSE values (>1.5) in XJ and TP, especially for the southwestern XJ and northwestern TP (Figure 3b), agree with the spatial pattern of RB. This may be caused by the combined reasons such as the complicated terrain and climate, the possible lower quality of PERSIANN-CDR over those regions and the sparsity of rain gauge stations over XJ and TP. More error characteristics of PERSIANN-CDR in depicting spatial distribution, temporal variation, frequency of precipitation with different intensities, and detecting precipitation events over mainland China may refer to our previous study [62]. In addition, the capability of PERSIANN-CDR in capturing the behavior of daily extreme precipitation events can be found in the report of Miao et al. [31].

3.2. Spatial Evaluation of SPI Estimates

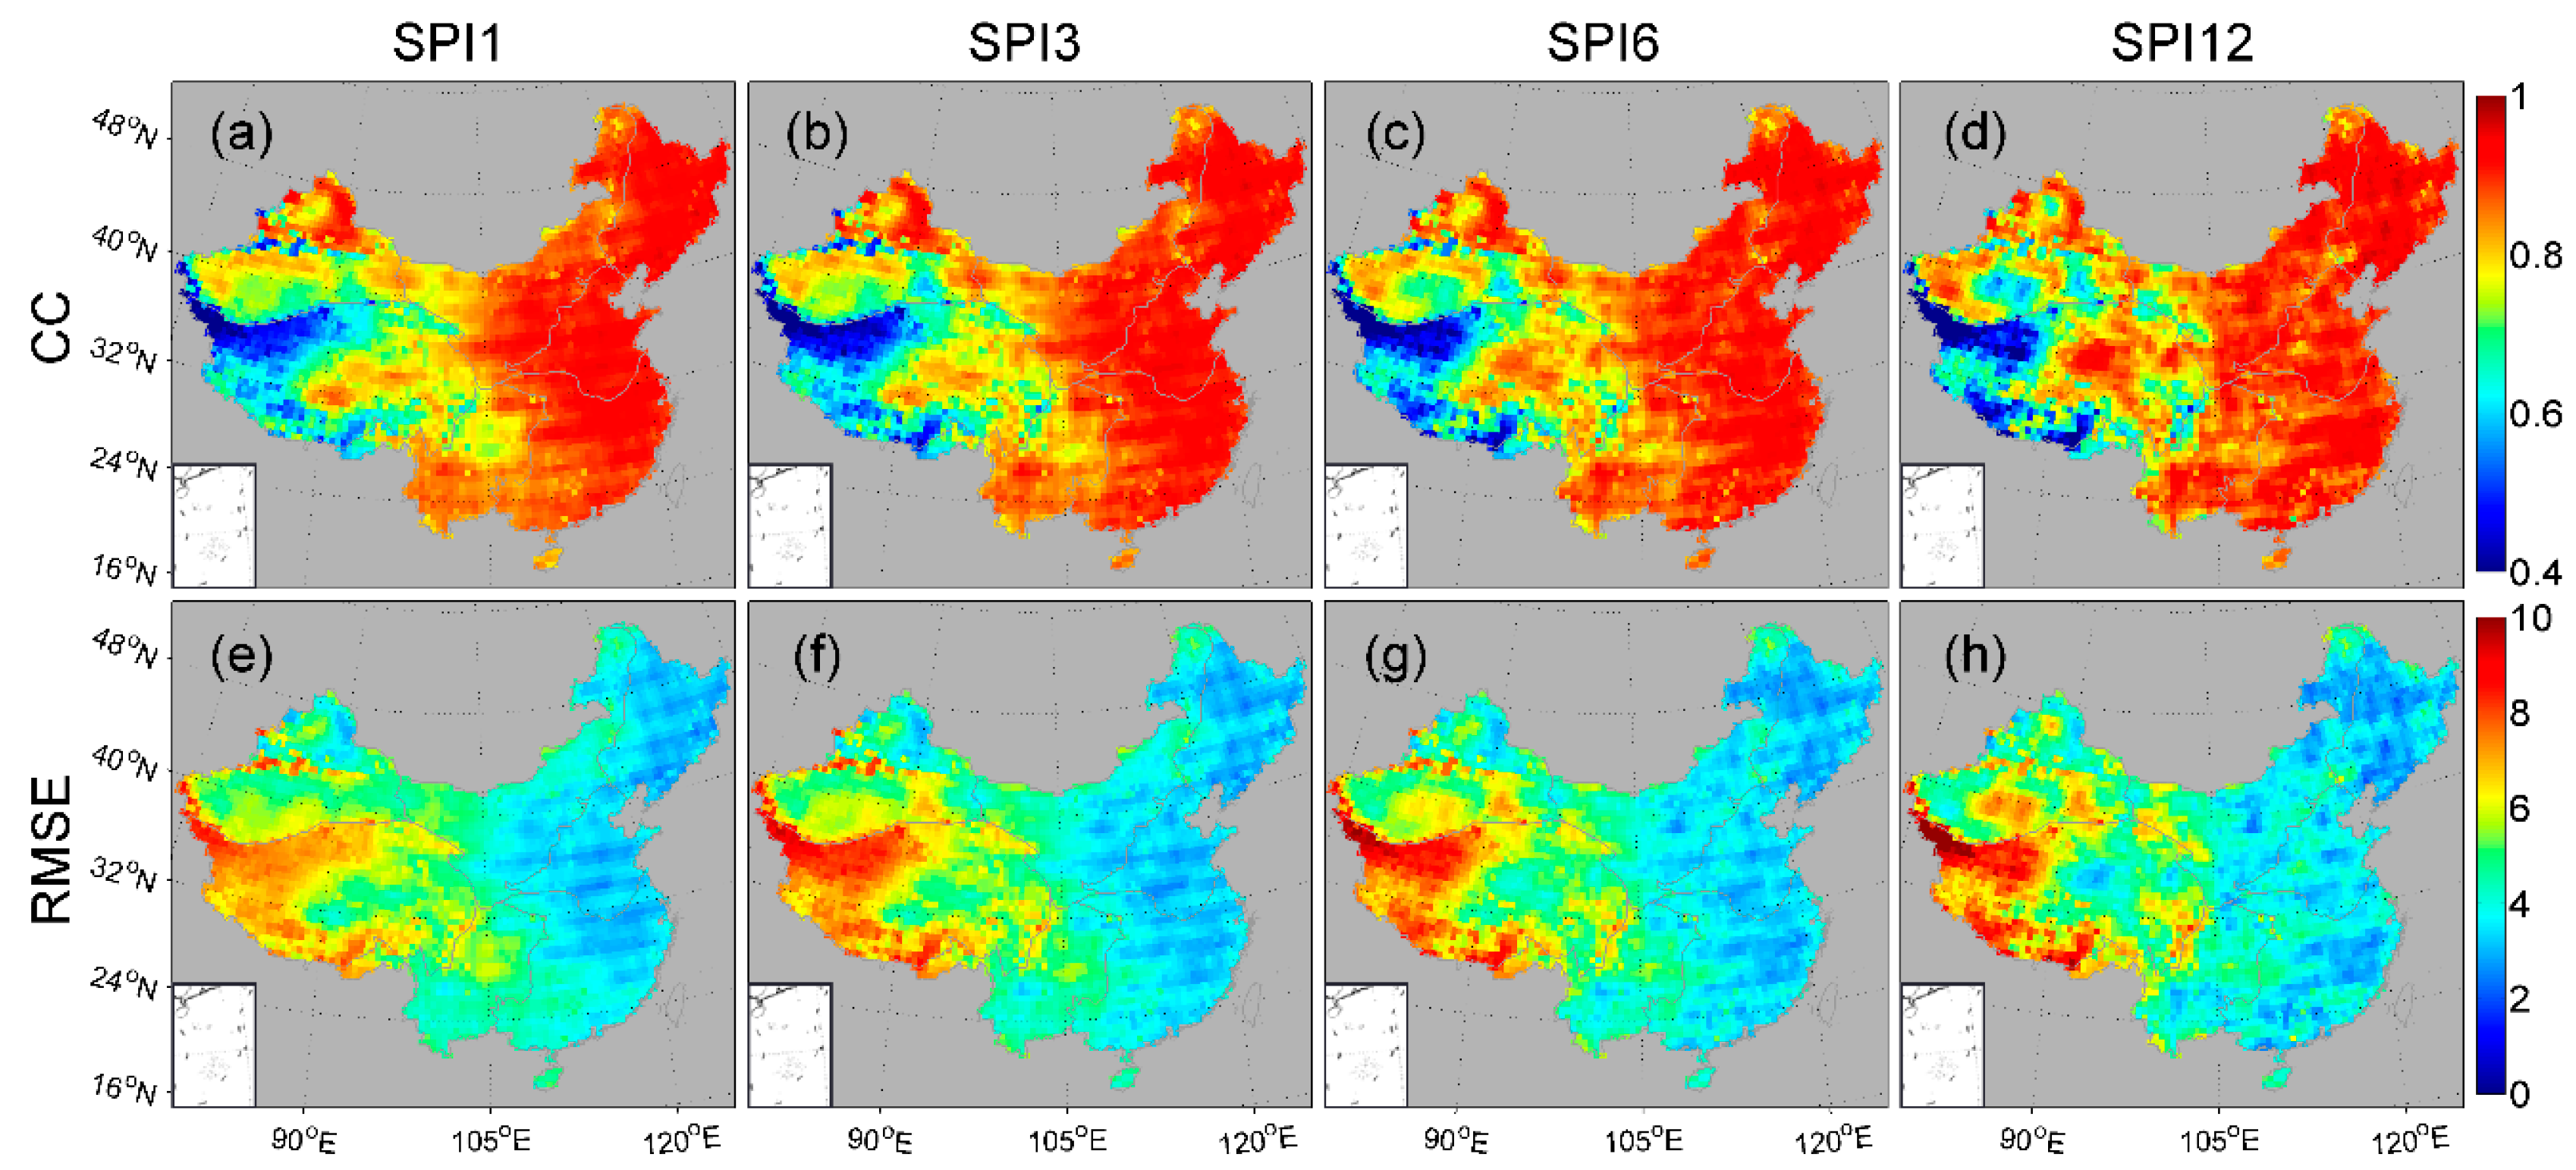
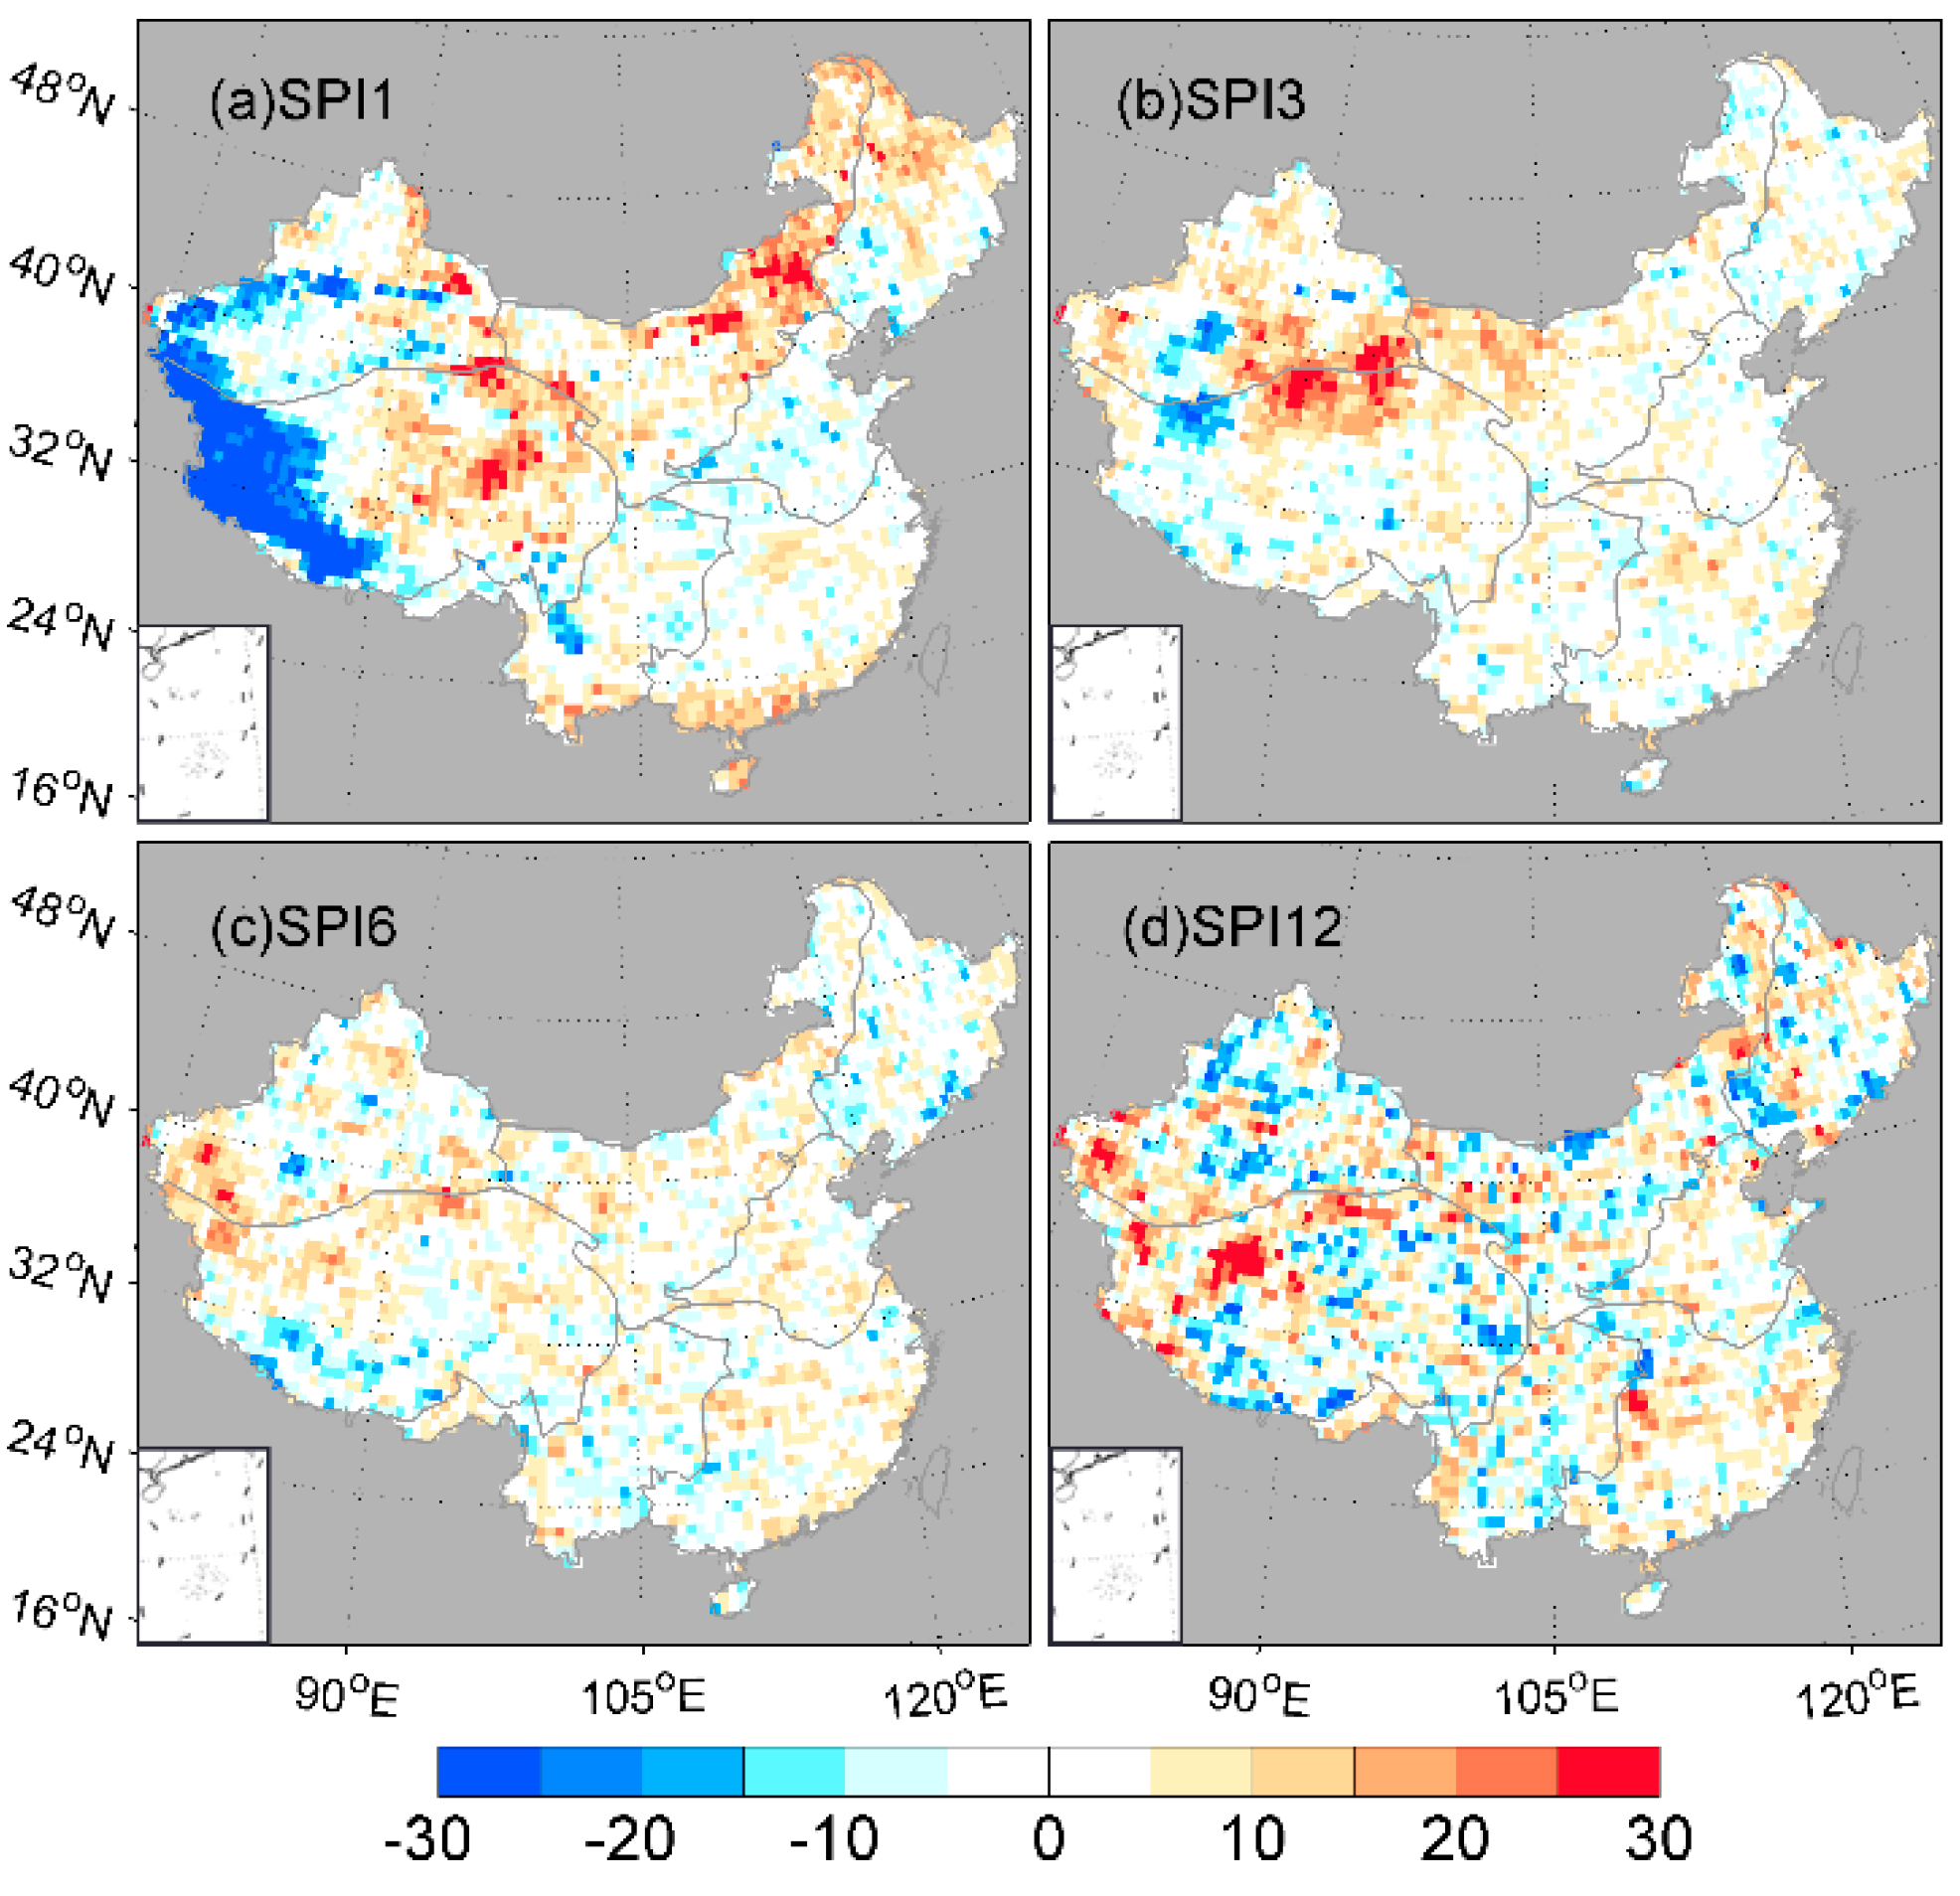
3.2.1. Comparison of SPI Based Statistics

The CC and RMSE are used to evaluate SPI estimates from PERSIANN-CDR relative to SPI estimates from CPAP based on different time scales. The spatial pattern of CC and RMSE results for SPI1, SPI3, SPI6 and SPI12 between CPAP and PERSIANN-CDR are shown in Figure 4. The odd striation found in CCs and RMSEs over eastern China (Figure 4) is probably due to the interpolation of CPAP.
It is noteworthy that the spatial patterns of CC and RMSE are similar in most parts of China at different time scales, although the SPI12 results are slightly better. As the time scale increases, CC values in eastern TP become relatively higher while RMSE values also become higher in western TP. PERSIANN-CDR has good agreement with CPAP in terms of higher CCs and lower RMSEs over eastern China (i.e., NW, NE, NC, SW and SC) where rain gauge networks are dense and where most of drought events occur. The lower CC values (CC < 0.6) and higher RMSE values (RMSE > 6 mm/month) are found in TP and XJ which have a dry climate and a low gauge density. This is consistent with the precipitation evaluation analysis in Section 3.1, which indicates that precipitation estimation error may directly affect the accuracy of SPI values. Specifically, PERSIANN-CDR shows the lowest correlation (<0.5) over the northern TP and southern XJ at all time scales. Subsequently, the corresponding RMSEs are also high in those regions. The large difference between two datasets in this region may be attributed to the precipitation error generated from complicated terrain, dry climate and sparse density of gauges. In addition, the distribution of small amounts of rainfall in time and space over these regions may also affect the results of SPIs. Overall, SPI estimates of PERSIANN-CDR show high CC values and low RMSE values over most China. In addition, the SPI performances are directly influenced by the precipitation error.

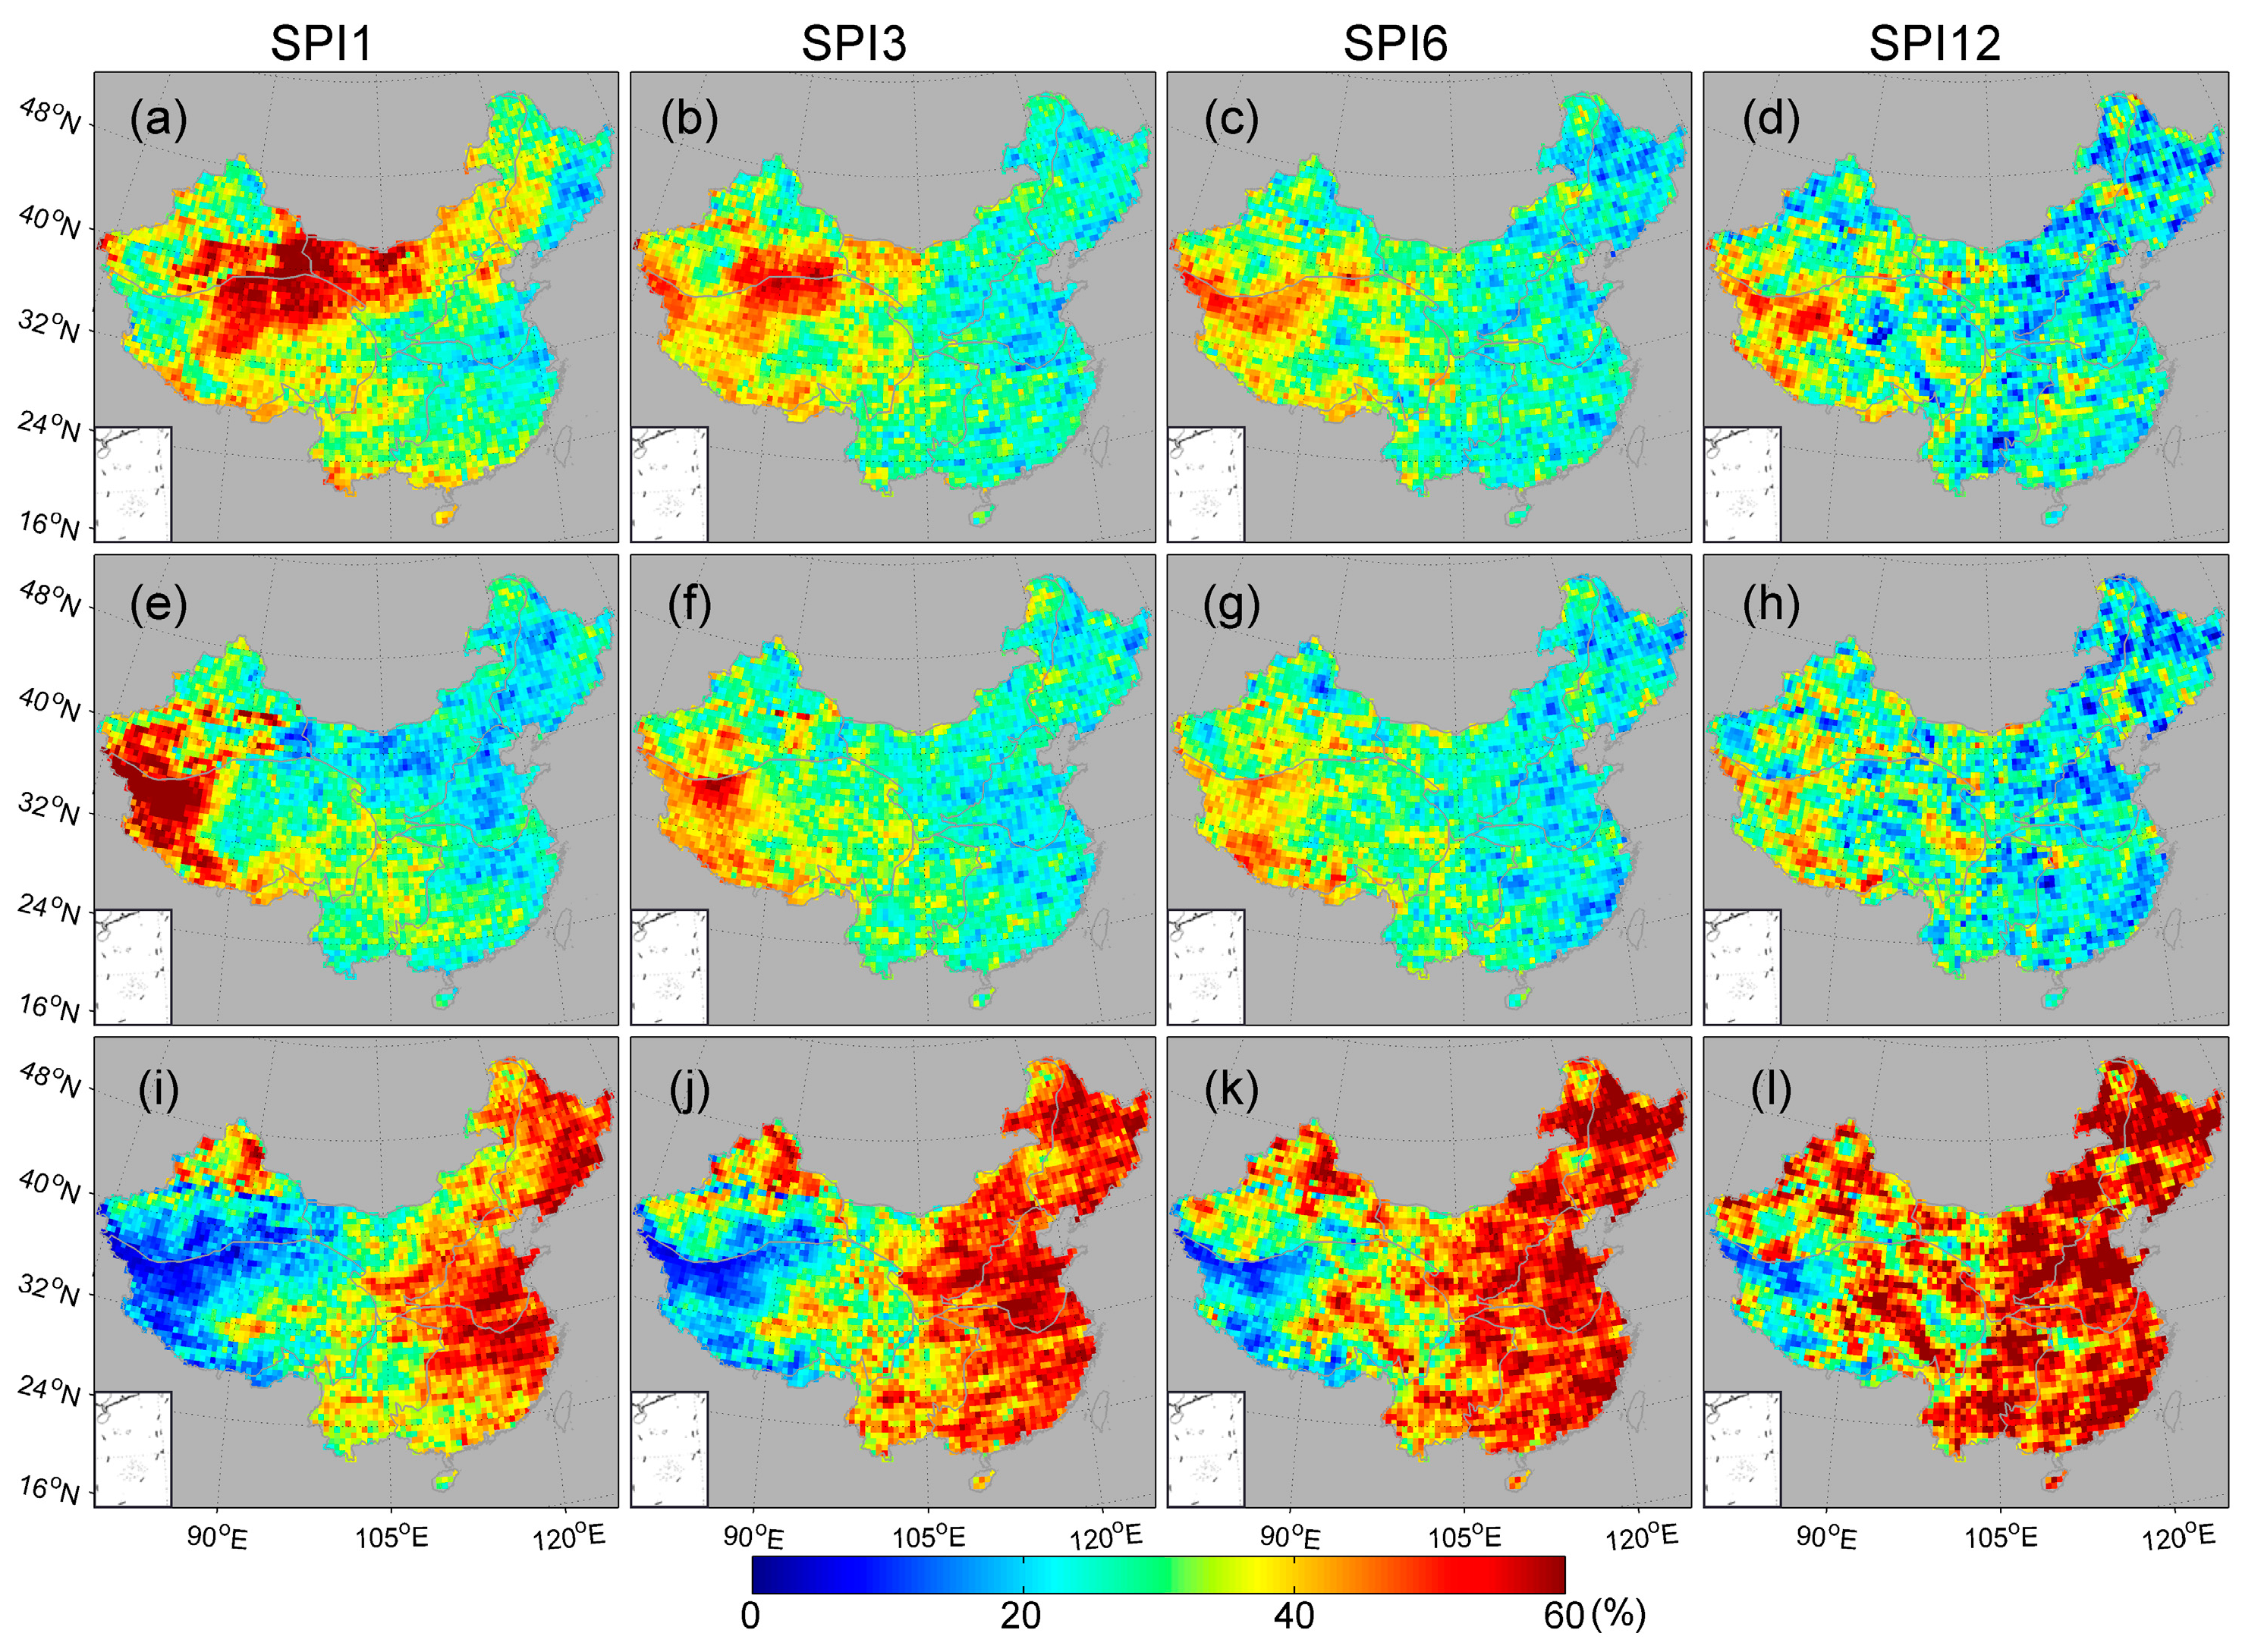
3.2.2. Comparison of SPI Based Drought Events

The SPI can be used to detect the duration and spatial extent of meteorological drought events. In this section, whether a grid is under drought condition is determined by the criterion of SPI < −1.0. According to this criterion, the total number of months under drought is counted grid by grid to check the consistency of PERSIANN-CDR in identifying the drought periods. Figure 5 shows the difference in total number of months under drought between PERSIANN-CDR and CPAP for different time scales.
Generally, PERSIANN-CDR for SPI6 seems to have the best agreement with CPAP for the number of drought months over most China (Figure 5c), especially for western China (e.g., XJ and TP). In comparison to CPAP, PERSIANN-CDR for SPI1 and SPI3 identify much fewer months under drought over western part of TP and central part of XJ while they identify more months under drought over eastern TP, eastern XJ and most of NW. The result of SPI3 shows closer agreement with CPAP than that of SPI1 over the whole study region. Interestingly, SPI12 presents overall poor performance in detecting the total number of drought months. The number of months under drought differs for SPI12 with a mixture distribution of positive difference and negative difference over the whole study region, which is not consistent with the high CC and low RMSE of SPI12 between PERSIANN-CDR and CPAP shown in Figure 3d.
In order to determine whether PERSIANN-CDR predicts the same drought events rather than the same number of months under drought regardless of timing, the number of months under drought identified by either PERSIANN-CDR and CPAP (z) are calculated based on the criterion of SPI < −1.0. The months under drought can be grouped into three possible conditions: the droughts detected by PERSIANN-CDR but not CPAP (x), the droughts detected by CPAP but not PERSIANN-CDR (y) and the droughts detected by both PERSIANN-CDR and CPAP (u). The ratios of the months under drought to the total number of months under drought in these three conditions (x/z, y/z and u/z, respectively) are calculated following the study of Mo et al. [81] and shown as percentages in Figure 6.
The number of months under drought detected by only PERSIANN-CDR and only CPAP gradually decreases as the time scale increases, especially for the region of western China (i.e., northeastern TP, eastern XJ and western NW). While the percentage of drought months detected by both datasets is high over most of China, it has been found that it increase from SPI1 to SPI12 (Figure 6i–l). The PERSIANN-CDR predicts drought more than 40% of the time for SPI1 and less for other time scales over northeastern TP, eastern XJ and western NW, while CPAP does not detect any drought (Figure 6a–d). Conversely, CPAP detects droughts when PERSIANN-CDR does not predict any drought for 40%–60% over western TP and southwestern XJ (Figure 6e–h). Both PERSIANN-CDR and CPAP detect drought simultaneously at more than 50% of the time over eastern China for SPI1 (Figure 6i). The percentage increases with the time scale increasing, and the agreement between PERSIANN-CDR and CPAP for SPI12 is found to be the best (Figure 6d,h,l).

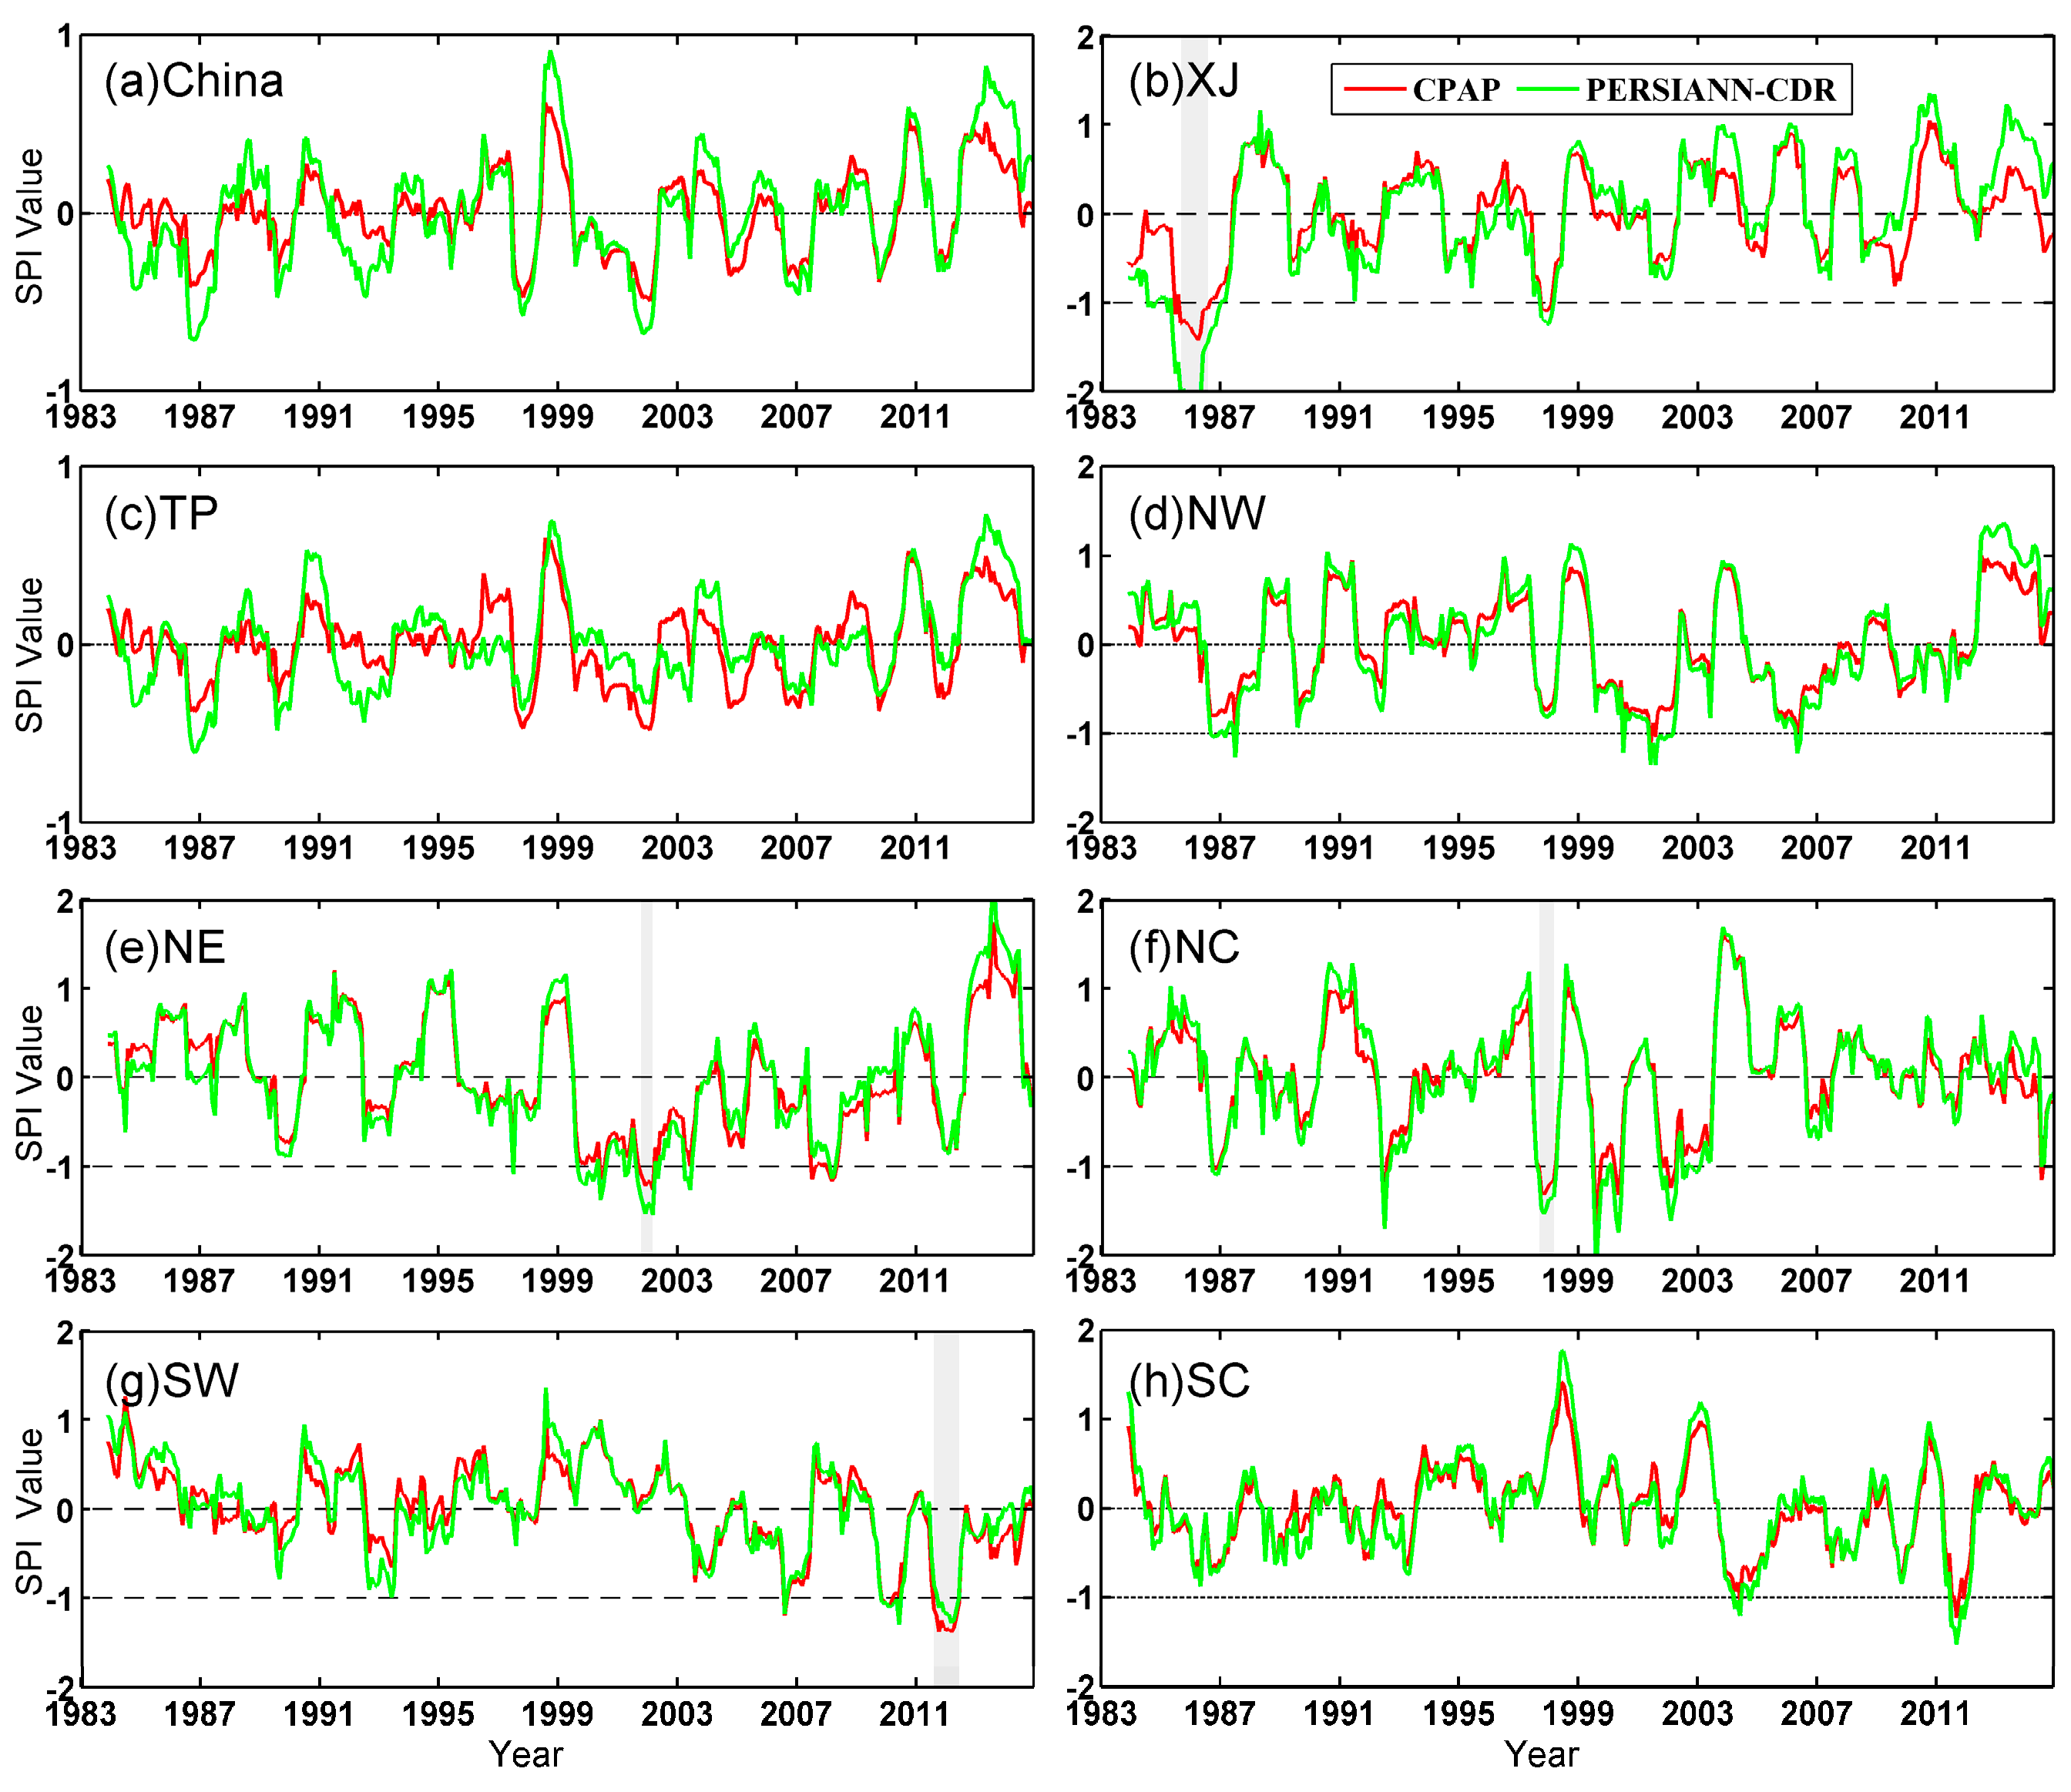
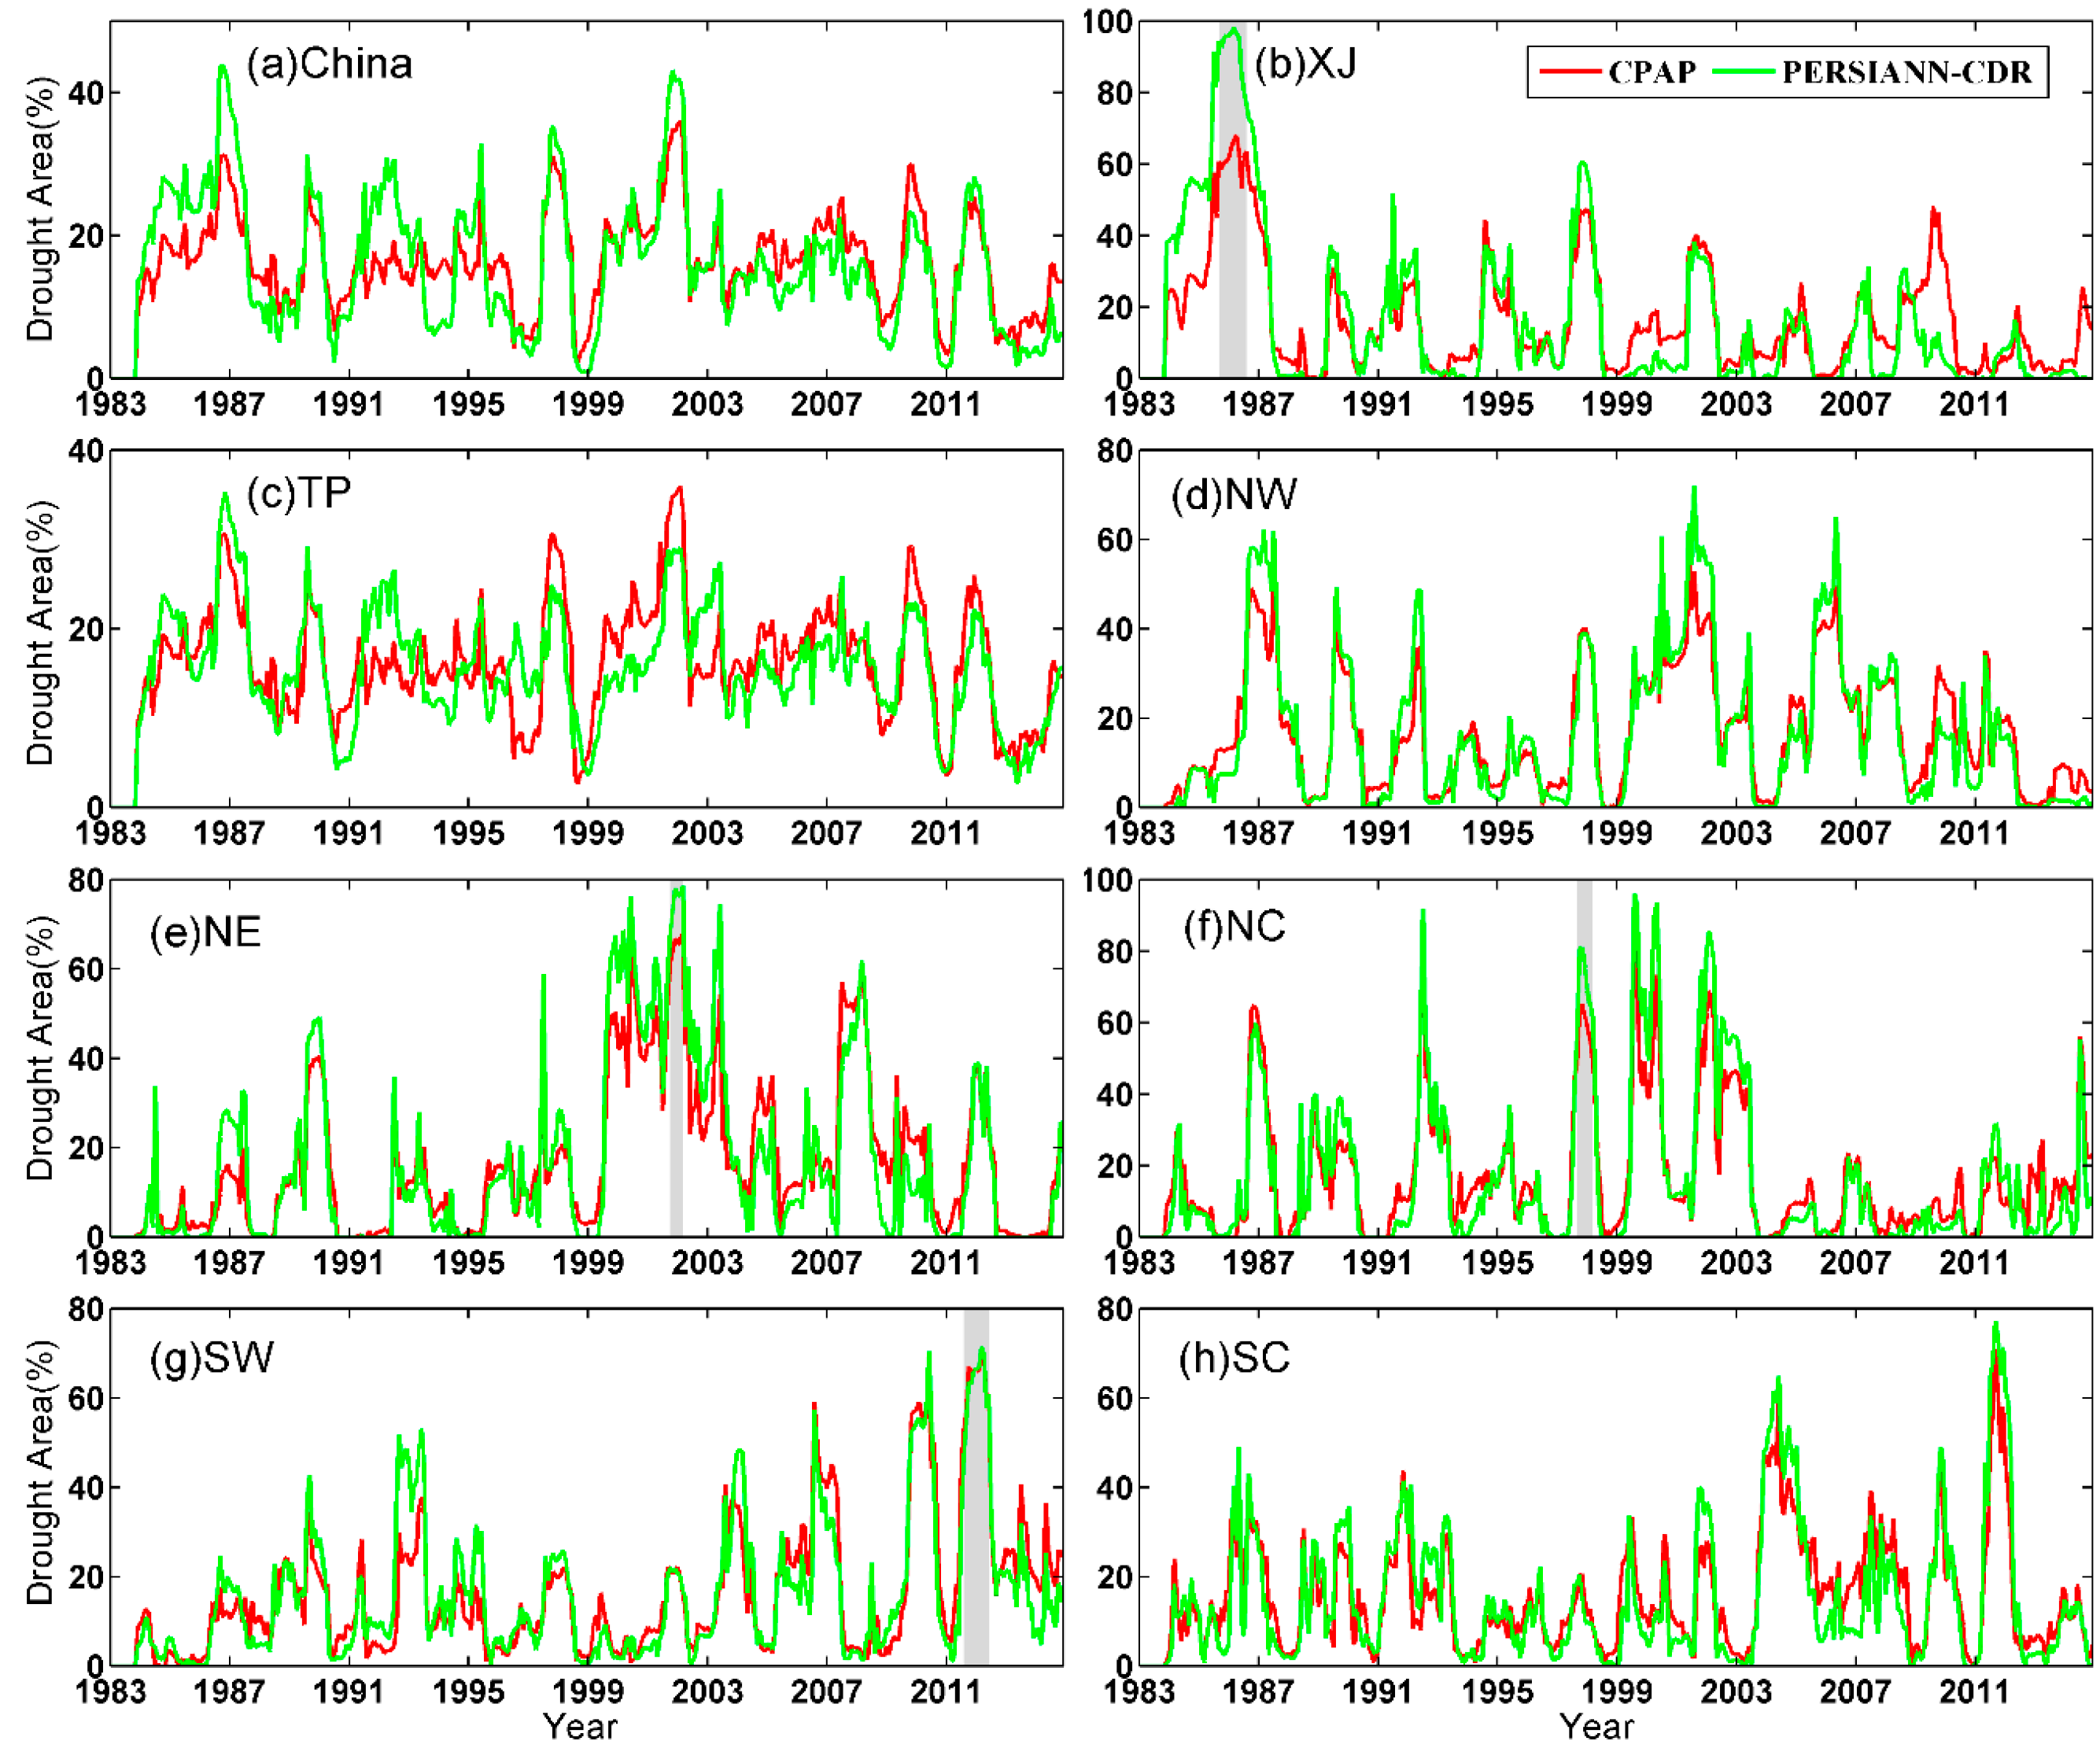
3.3. Time Series Evaluation of SPI Estimates

To further compare the temporal behavior of the SPI estimates of PERSIANN-CDR, the domain averaged SPI12 time series from 1983 to 2014 is calculated over China and seven subregions (Figure 7). Since the timescales are the cumulative results of shorter periods that may be above or below normal, the longer SPIs tend to gravitate towards zero unless a distinctive wet or dry trend is taking place. Therefore, SPI12 is chosen for analysis. It is noticeable that some individual grid cells show SPI values as low as −3 during drought events, even if the values in Figure 7 are suppressed due to the spatial averaging.
The SPI estimates from PERSIANN-CDR show good agreements with SPI estimates from CPAP; and PERSIANN-CDR captures all drought events over China and seven subregions. However, the SPI values of PERSIANN-CDR tend to be larger than that of CPAP over China, especially for XJ, TP. The disagreements may be related to the complicated terrain and climate, sparsity of under-lying gauge network and performance of PERSIANN-CDR. SPI also can be used to quantify the spatial extent of drought events. The drought area is calculated month by month for 1983–2014 from the ratio between the number of spatial grid cells under drought and total number of spatial grid cells over the spatial mainland China or subregions (Figure 8). Generally, PERSIANN-CDR depicts the drought area well in comparison to CPAP. However, the drought areas of PERSIANN-CDR tend to be larger than that of CPAP, over mainland China and XJ, NW, NE, NC and SC, while smaller drought areas detected by PERSIANN-CDR are found in TP (Figure 8). These results are in correspondence with the spatial domain averaged SPI values (Figure 7).

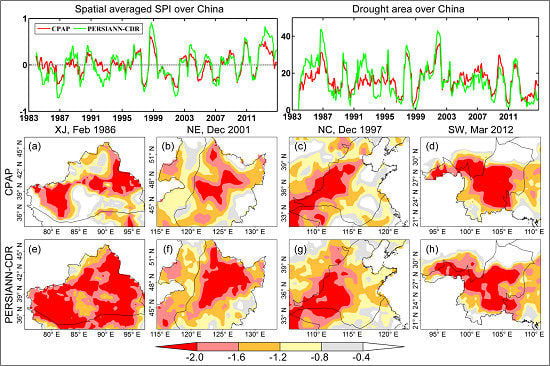
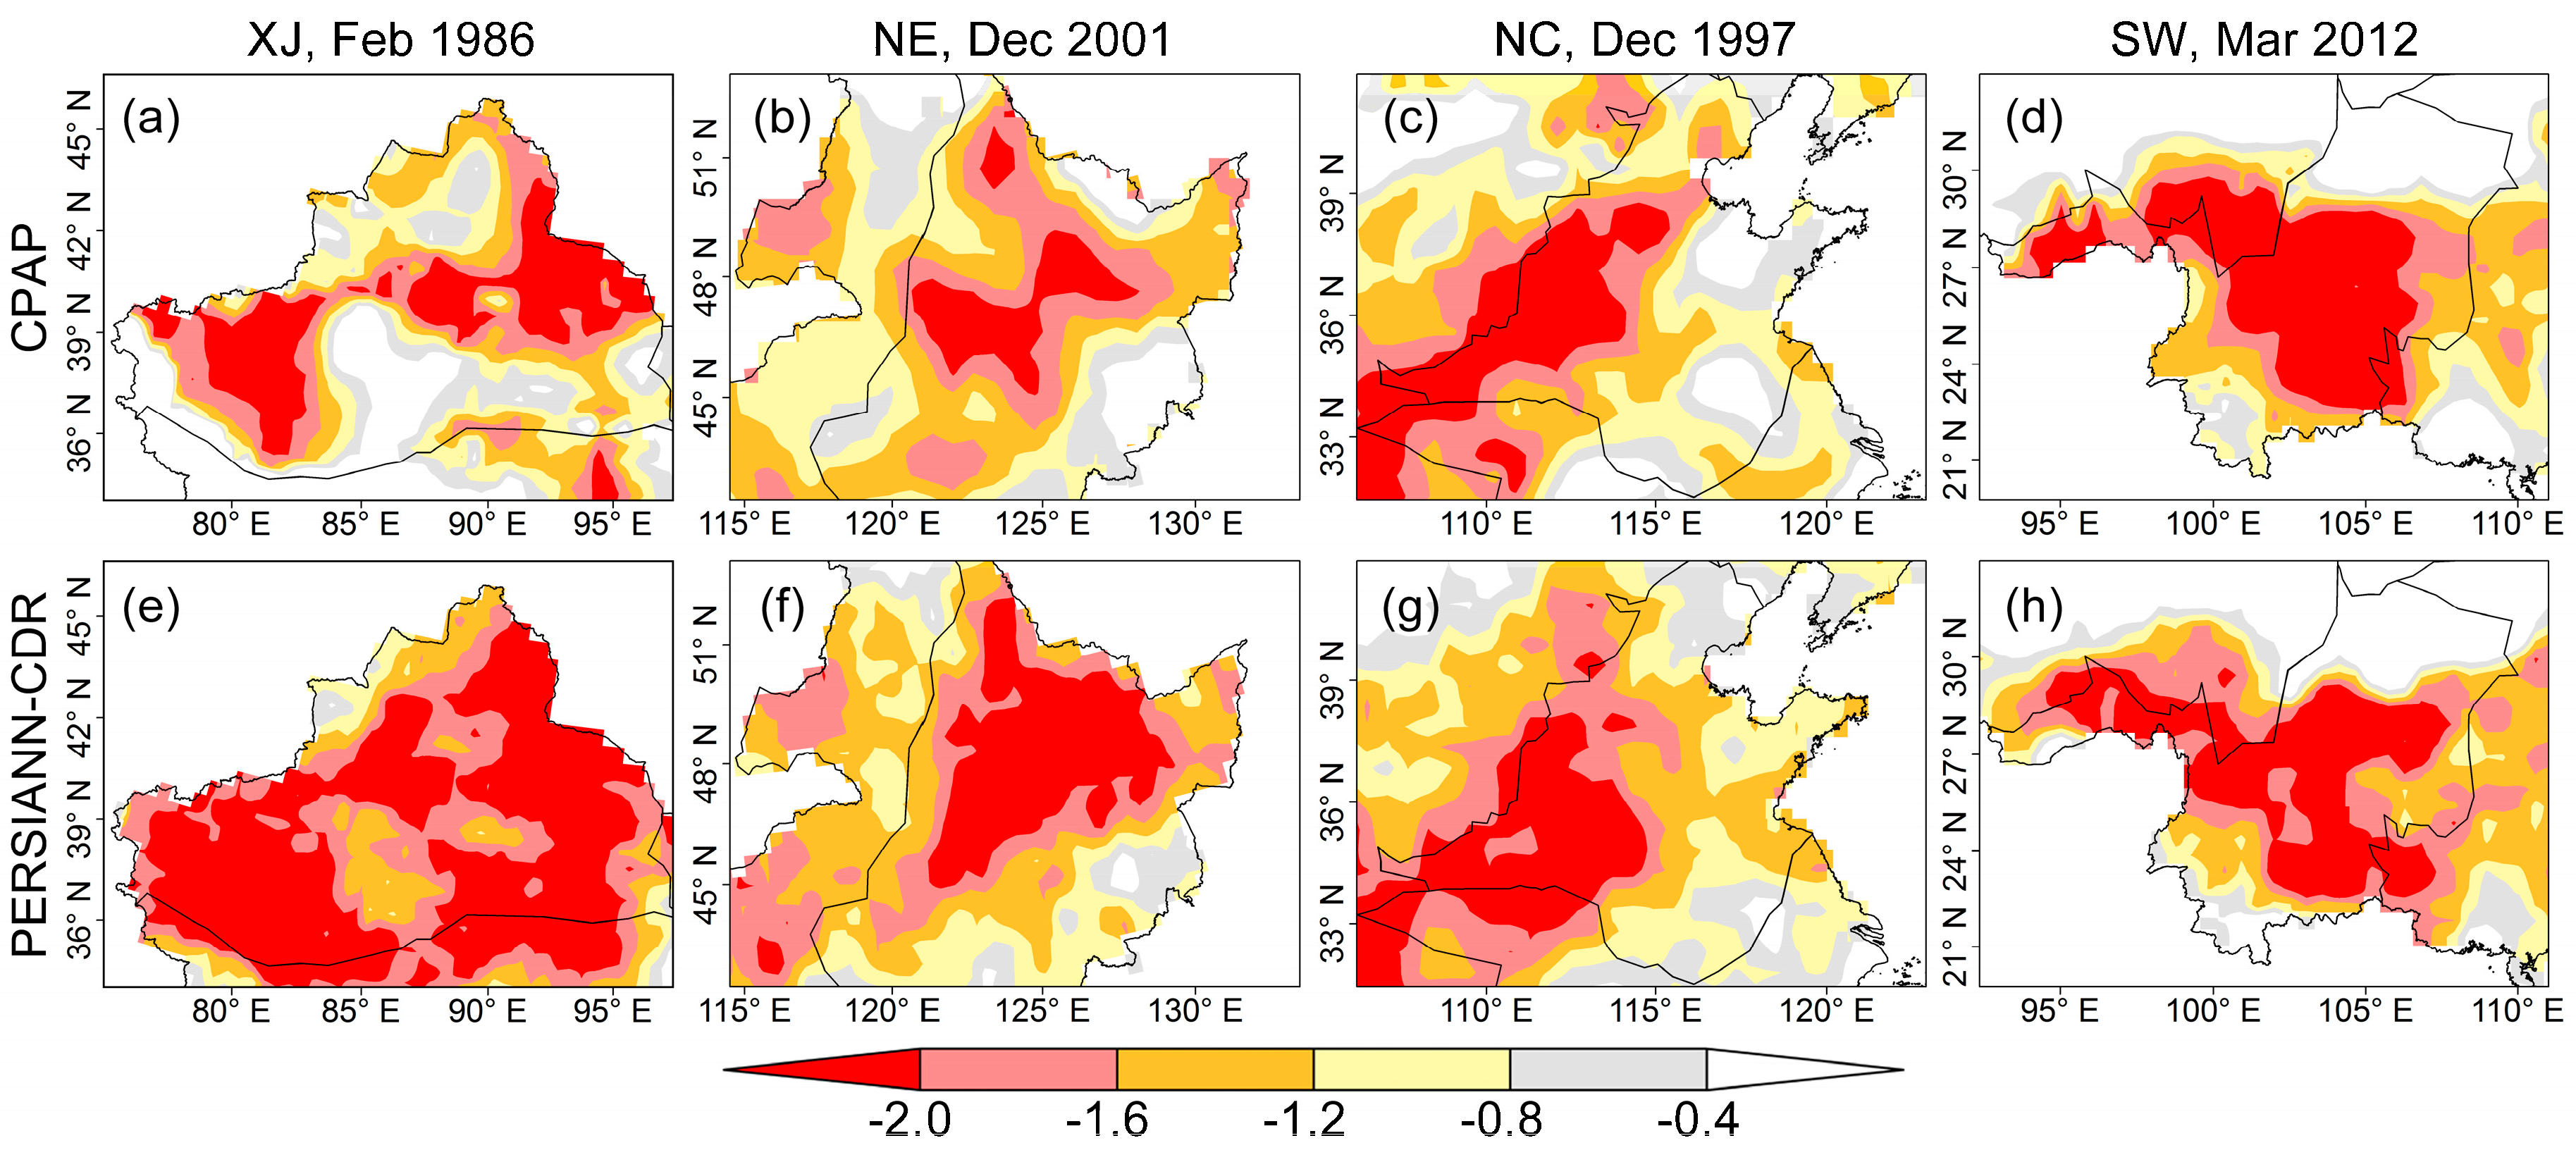
3.4. Specific Drought Events: Some Case Studies

To evaluate the capability of PERSIANN-CDR to capture drought events in detail, four severe drought events are selected by the criteria of SPI values less than −1 and drought period more than three months over XJ, NE, NC and SW. The four typical drought events are highlighted with grey background in their respective time series plots in Figure 7 and Figure 8. The start and end time, the duration and severity of these drought events are given in Table 2. Drought severity is defined as the cumulative sum of the monthly SPI values, considering SPI values under −1.0, and the duration of drought is defined as the number of months in which the SPI values remained under −1.0 by following the study of Mihajlović [82]. According to Table 2, the duration can be well depicted by PERSIANN-CDR with marginal difference for NE, NC and SW. In comparison of CPAP, similar drought severity are detected by PERSIANN-CDR over NE and NC where dense gauges are. However, the disagreement between PERSIANN-CDR and CPAP for XJ is not negligible with most distinguishing difference over the other subregions. It should be noted that severe droughts are generally less frequent for its semi-arid and arid climate. Figure 9 shows the spatial maps of SPI for a specific month during each drought event listed in Table 2. Correspondingly, SPI of PERSIANN-CDR agrees well in terms of the spatial pattern for the droughts in NE, NC and SW. However, a larger spatial extent is detected by PERSIANN-CDR for drought in XJ. Combined with the analysis before, the longer drought duration, heavier severity and larger spatial extent are detected by PERSIANN-CDR than those of CPAP.

4. Conclusions

Availability of the latest daily, 0.25° satellite-based PERSIANN-CDR provides an opportunity for long-term assessments of droughts at a finer resolution than previously possible. This study evaluates the performance of PERSIANN-CDR in detecting the behavior of meteorological drought events from 1983 to 2014. The ground-based monthly CPAP precipitation dataset was used as the reference observation set for comparison. The SPIs at different time scales (i.e., SPI1, SPI3, SPI6 and SPI12) were used as drought indexes to evaluate PERSIANN-CDR in depicting meteorological droughts. The major findings of this study are summarized as follows:
(1) PERSIANN-CDR performs well in replicating spatial patterns of precipitation with high CC (0.95), low RB (5.30%) and RMSE (13.18 mm/month) over most parts of China while large disagreements between PERSIANN-CDR and CPAP are found in regions of sparse-gauge networks such as XJ and TP. In these regions, the discrepancies in SPI estimates can be reflected by the disagreements in precipitation spatial pattern and statistics between PERSIANN-CDR and CPAP.
(2) High agreements between SPI estimates from PERSIANN-CDR and CPAP over most regions of China are found when identifying drought events in both time and space. SPI6 shows the best agreement with CPAP, while SPI1 and SPI3 tend to detect more drought months over northwestern China. The agreement between PERSIANN-CDR and CPAP in drought detection will vary with the change of time scale.
(3) In the evaluation of predicting the same drought events, the agreement between PERSIANN-CDR and CPAP becomes stronger when the time scale increases from SPI1 to SPI12. Both PERSIANN-CDR and CPAP identify drought events simultaneously at more than 50% of the time scale over most areas of China.
(4) PERSIANN-CDR is mostly able to detect all drought events in time and space, although there are some large differences for specific events and regions. The difference grows largest in regions with complicated terrain and sparse gauge networks, such as XJ and TP. These results cannot prove that PERSIANN-CDR is less accurate than CPAP over northwestern China (e.g., XJ and TP). This may be caused by combined reasons such as the lack of dense rain gauge, complicated terrain, dry climate, the error from interpolation, and the possible error from IR-based algorithm. However, the sparse rain gauge networks failing to capture the heterogeneity of precipitation may be the most likely reason for the weaker agreements. Therefore, the performance of PERSIANN-CDR for detecting meteorological drought over these regions should be further studied in the future.
Overall, PERSIANN-CDR is skillful enough to detect drought events and can serve as a valuable dataset for various applications, such as long-term hydrological and climate studies over most of China, especially for eastern part of China.

Acknowledgments

This work was jointly funded by the National Natural Science Foundation of China (Grant No. 41371419), One Thousand Youth Talents Plan of China (Xinjiang Project: 374231001) and project of Chinese Academy of Sciences (Y674122). Kathleen Malu (William Paterson University) kindly provided English proofreading. Constructive comments and suggestions from anonymous reviewers are acknowledged. The PERSIANN-CDR precipitation product used in this study was acquired from NOAA’s National Centers for Environmental Information (http://www.ncdc.noaa.gov). This CDR was originally developed by Soroosh Sorooshian and colleagues for NOAA’s CDR Program. The reference dataset (CPAP) is provided by the National Meteorological Information Center (NMIC) and China Meteorological Administration (CMA) (http://cdc.nmic.cn/sksj.do?method=ssrjscp).

Author Contributions

A.B. conceived and designed the framework of this study; H.G., T.L, S.C. and F.N. processed the data, analyzed the results. H.G. wrote the paper. All authors contributed to the final version of the manuscript by proofreading and bringing in constructive ideas.

Conflicts of Interest

The authors declare no conflict of interest.

References

  1. Wilhite, D.A. Drought as a natural hazard: Concepts and definitions. In Drought, A Global Assessment; Wilhite, D.A., Ed.; Routledge: London, UK, 2000; Volume 1, pp. 3–18. [Google Scholar]
  2. Heim, R.R. A review of twentieth-century drought indices used in the united states. Bull. Am. Meteorol. Soc. 2002, 83, 1149–1165. [Google Scholar]
  3. Kao, S.C.; Govindaraju, R.S. A copula-based joint deficit index for droughts. J. Hydrol. 2010, 380, 121–134. [Google Scholar] [CrossRef]
  4. Dai, A.G. Drought under global warming: A review. WIREs Clim. Chang. 2011, 2, 45–65. [Google Scholar] [CrossRef]
  5. Keyantash, J.; Dracup, J.A. The quantification of drought: An evaluation of drought indices. Bull. Am. Meteorol. Soc. 2002, 83, 1167–1180. [Google Scholar]
  6. Hoerling, M.; Eischeid, J.; Perlwitz, J.; Quan, X.; Zhang, T.; Pegion, P. On the increased frequency of mediterranean drought. J. Clim. 2012, 25, 2146–2161. [Google Scholar] [CrossRef]
  7. Sahoo, A.K.; Sheffield, J.; Pan, M.; Wood, E.F. Evaluation of the tropical rainfall measuring mission multi-satellite precipitation analysis (TMPA) for assessment of large-scale meteorological drought. Remote Sens. Environ. 2015, 159, 181–193. [Google Scholar] [CrossRef]
  8. Anderson, L.O.; Malhi, Y.; Aragao, L.E.; Ladle, R.; Arai, E.; Barbier, N.; Phillips, O. Remote sensing detection of droughts in amazonian forest canopies. New Phytol. 2010, 187, 733–750. [Google Scholar] [CrossRef] [PubMed]
  9. Belayneh, A.; Adamowski, J. Standard precipitation index drought forecasting using neural networks, wavelet neural networks, and support vector regression. Appl. Comput. Intell. Soft Comput. 2012, 2012, 1–13. [Google Scholar] [CrossRef]
  10. He, B.; Lu, A.F.; Wu, J.J.; Zhao, L.; Liu, M. Drought hazard assessment and spatial characteristics analysis in China. J. Geogr. Sci. 2011, 21, 235–249. [Google Scholar] [CrossRef]
  11. Palmer, W.C. Meteorological Drought; US Department of Commerce, Weather Bureau: Washington, DC, USA, 1965; Volume 30. [Google Scholar]
  12. McKee, T.B.; Doesken, N.J.; Kleist, J. The relationship of drought frequency and duration to time scales. In Proceedings of the Eighth Conference on Applied Climatology, Anaheim, CA, USA, 17–22 January 1993; pp. 179–183.
  13. Gibbs, W.J. Rainfall Deciles as Drought Indicators; Bureau of Meteorology: Melbourne, Australia, 1967. [Google Scholar]
  14. Bhalme, H.N.; Mooley, D.A. Large-scale droughts/floods and monsoon circulation. Mon. Weather Rev. 1980, 108, 1197–1211. [Google Scholar]
  15. Shafer, B.; Dezman, L. Development of a surface water supply index (SWSI) to assess the severity of drought conditions in snowpack runoff areas. In Proceedings of the 50th Annual Western Snow Conference, Reno, NV, USA, 19–23 April 1982; pp. 164–175.
  16. Wu, H.; Hayes, M.J.; Weiss, A.; Hu, Q. An evaluation of the standardized precipitation index, the china-z index and the statistical z-score. Int. J. Climatol. 2001, 21, 745–758. [Google Scholar] [CrossRef]
  17. Heim, R.R. Drought indices: A review. In Drought: A Global Assessment; Wilhite, D.A., Ed.; Routledge: London, UK, 2000; pp. 159–167. [Google Scholar]
  18. Kallis, G. Droughts. Annu. Rev. Environ. Resour. 2008, 33, 85–118. [Google Scholar] [CrossRef]
  19. Alley, W.M. The palmer drought severity index—limitations and assumptions. J. Clim. Appl. Meteorol. 1984, 23, 1100–1109. [Google Scholar] [CrossRef]
  20. Hao, Z.; AghaKouchak, A. A nonparametric multivariate multi-index drought monitoring framework. J. Hydrometeorol. 2014, 15, 89–101. [Google Scholar] [CrossRef]
  21. Edwards, D.C. Characteristics of 20th Century Drought in the United States at Multiple Time Scales. Master's Thesis, Colorado State University, Fort Collins, CO, USA, 1997. [Google Scholar]
  22. Hayes, M.; Svoboda, M.; Wall, N.; Widhalm, M. The Lincoln declaration on drought indices: Universal meteorological drought index recommended. Bull. Am. Meteorol. Soc. 2011, 92, 485–488. [Google Scholar] [CrossRef]
  23. Seiler, R.A.; Hayes, M.; Bressan, L. Using the standardized precipitation index for flood risk monitoring. Int. J. Climatol. 2002, 22, 1365–1376. [Google Scholar] [CrossRef]
  24. Lu, E. Determining the start, duration, and strength of flood and drought with daily precipitation: Rationale. Geophys. Res. Lett. 2009, 36, L12707. [Google Scholar] [CrossRef]
  25. Vicente-Serrano, S.M.; Begueria, S.; Lorenzo-Lacruz, J.; Camarero, J.J.; Lopez-Moreno, J.I.; Azorin-Molina, C.; Revuelto, J.; Moran-Tejeda, E.; Sanchez-Lorenzo, A. Performance of drought indices for ecological, agricultural, and hydrological applications. Earth Interact. 2012, 16, 1–27. [Google Scholar] [CrossRef]
  26. Silva, Y.; Takahashi, K.; Chávez, R. Dry and wet rainy seasons in the Mantaro river basin (Central Peruvian Andes). Adv. Geosci. 2008, 14, 261–264. [Google Scholar] [CrossRef]
  27. Morid, S.; Smakhtin, V.; Moghaddasi, M. Comparison of seven meteorological indices for drought monitoring in Iran. Int. J. Climatol. 2006, 26, 971–985. [Google Scholar] [CrossRef]
  28. Santos, J.F.; Pulido-Calvo, I.; Portela, M.M. Spatial and temporal variability of droughts in Portugal. Water Resour. Res. 2010, 46, W03503. [Google Scholar] [CrossRef]
  29. Bordi, I.; Fraedrich, K.; Gerstengarbe, F.W.; Werner, P.C.; Sutera, A. Potential predictability of dry and wet periods: Sicily and elbe-basin (Germany). Theor. Appl. Climatol. 2004, 77, 125–138. [Google Scholar]
  30. Lyon, B.; Zubair, L.; Ralapanawe, V.; Yahiya, Z. Finescale evaluation of drought in a tropical setting: Case study in Sri Lanka. J. Appl. Meteor. Climatol. 2009, 48, 77–88. [Google Scholar] [CrossRef]
  31. Miao, C.Y.; Ashouri, H.; Hsu, K.L.; Sorooshian, S.; Duan, Q.Y. Evaluation of the persiann-cdr daily rainfall estimates in capturing the behavior of extreme precipitation events over China. J. Hydrometeorol. 2015, 16, 1387–1396. [Google Scholar] [CrossRef]
  32. Huffman, G.J.; Adler, R.F.; Arkin, P.; Chang, A.; Ferraro, R.; Gruber, A.; Janowiak, J.; McNab, A.; Rudolf, B.; Schneider, U. The global precipitation climatology project (GPCP) combined precipitation dataset. Bull. Am. Meteorol. Soc. 1997, 78, 5–20. [Google Scholar] [CrossRef]
  33. Huffman, G.J.; Adler, R.F.; Bolvin, D.T.; Gu, G.J. Improving the global precipitation record: GPCP version 2.1. Geophys. Res. Lett. 2009, 36, L17808. [Google Scholar] [CrossRef]
  34. Adler, R.F.; Huffman, G.J.; Chang, A.; Ferraro, R.; Xie, P.-P.; Janowiak, J.; Rudolf, B.; Schneider, U.; Curtis, S.; Bolvin, D.; et al. The version-2 global precipitation climatology project (GPCP) monthly precipitation analysis (1979–present). J. Hydrometeorol. 2003, 4, 1147–1167. [Google Scholar] [CrossRef]
  35. Xie, P.P.; Janowiak, J.E.; Arkin, P.A.; Adler, R.; Gruber, A.; Ferraro, R.; Huffman, G.J.; Curtis, S. GPCP pentad precipitation analyses: An experimental dataset based on gauge observations and satellite estimates. J. Clim. 2003, 16, 2197–2214. [Google Scholar] [CrossRef]
  36. Huffman, G.J.; Adler, R.F.; Morrissey, M.M.; Bolvin, D.T.; Curtis, S.; Joyce, R.; McGavock, B.; Susskind, J. Global precipitation at one-degree daily resolution from multisatellite observations. J. Hydrometeorol. 2001, 2, 36–50. [Google Scholar] [CrossRef]
  37. Huffman, G.J.; Adler, R.F.; Bolvin, D.T.; Gu, G.J.; Nelkin, E.J.; Bowman, K.P.; Hong, Y.; Stocker, E.F.; Wolff, D.B. The TRMM Multisatellite Precipitation Analysis (TMPA): Quasi-global, multiyear, combined-sensor precipitation estimates at fine scales. J. Hydrometeorol. 2007, 8, 38–55. [Google Scholar] [CrossRef]
  38. Joyce, R.J.; Janowiak, J.E.; Arkin, P.A.; Xie, P.P. Cmorph: A method that produces global precipitation estimates from passive microwave and infrared data at high spatial and temporal resolution. J. Hydrometeorol. 2004, 5, 487–503. [Google Scholar] [CrossRef]
  39. Ushio, T.; Sasashige, K.; Kubota, T.; Shige, S.; Okamoto, K.; Aonashi, K.; Inoue, T.; Takahashi, N.; Iguchi, T.; Kachi, M.; et al. A Kalman filter approach to the global satellite mapping of precipitation (GSMaP) from combined passive microwave and infrared radiometric data. J. Meteor. Soc. Jpn. 2009, 87, 137–151. [Google Scholar] [CrossRef]
  40. Hsu, K.L.; Gao, X.G.; Sorooshian, S.; Gupta, H.V. Precipitation estimation from remotely sensed information using artificial neural networks. J. Appl. Meteorol. 1997, 36, 1176–1190. [Google Scholar] [CrossRef]
  41. Sorooshian, S.; Hsu, K.-L.; Gao, X.; Gupta, H.V.; Imam, B.; Braithwaite, D. Evaluation of persiann system satellite–based estimates of tropical rainfall. Bull. Am. Meteorol. Soc. 2000, 81, 2035–2046. [Google Scholar] [CrossRef]
  42. Turk, J.; Mostovoy, G.; Anantharaj, V. The NRL-blend high resolution precipitation product and its application to land surface hydrology. In Satellite Rainfall Applications for Surface Hydrology; Gebremichael, M., Hossain, F., Eds.; Springer Netherlands: Berlin, Germany, 2010; pp. 85–104. [Google Scholar]
  43. Chen, S.; Liu, H.; You, Y.; Mullens, E.; Hu, J.; Yuan, Y.; Huang, M.; He, L.; Luo, Y.; Zeng, X.; et al. Evaluation of high-resolution precipitation estimates from satellites during July 2012 Beijing flood event using dense rain gauge observations. PLoS ONE 2014, 9, e89681. [Google Scholar] [CrossRef] [PubMed]
  44. Yong, B.; Chen, B.; Gourley, J.J.; Ren, L.; Hong, Y.; Chen, X.; Wang, W.; Chen, S.; Gong, L. Intercomparison of the version-6 and version-7 TMPA precipitation products over high and low latitudes basins with independent gauge networks: Is the newer version better in both real-time and post-real-time analysis for water resources and hydrologic extremes? J. Hydrol. 2014, 508, 77–87. [Google Scholar]
  45. Xue, X.; Hong, Y.; Limaye, A.S.; Gourley, J.J.; Huffman, G.J.; Khan, S.I.; Dorji, C.; Chen, S. Statistical and hydrological evaluation of TRMM-based Multi-satellite precipitation analysis over the Wangchu Basin of Bhutan: Are the latest satellite precipitation products 3B42V7 ready for use in ungauged basins? J. Hydrol. 2013, 499, 91–99. [Google Scholar] [CrossRef]
  46. Stisen, S.; Sandholt, I. Evaluation of remote-sensing-based rainfall products through predictive capability in hydrological runoff modelling. Hydrol. Process. 2010, 24, 879–891. [Google Scholar] [CrossRef]
  47. Hao, Z.; AghaKouchak, A.; Nakhjiri, N.; Farahmand, A. Global integrated drought monitoring and prediction system. Sci. Data 2014, 1, 1–10. [Google Scholar] [CrossRef] [PubMed]
  48. Katiraie-Boroujerdy, P.-S.; Nasrollahi, N.; Hsu, K.-L.; Sorooshian, S. Quantifying the reliability of four global datasets for drought monitoring over a semiarid region. Theor. Appl. Climatol. 2015, 123, 387–398. [Google Scholar] [CrossRef]
  49. Nana, Y.; Bingfang, W.; Sheng, C.; Xin, B. Evaluation of TRMM precipitation product for meteorological drought monitoring in Hai Basin. IOP Conf. Ser.: Earth Environ. Sci. 2014, 17, 012093. [Google Scholar]
  50. Zeng, H.W.; Li, L.J.; Li, J.Y. The evaluation of TRMM Multisatellite Precipitation Analysis (TMPA) in drought monitoring in the Lancang River Basin. J. Geogr. Sci. 2012, 22, 273–282. [Google Scholar] [CrossRef]
  51. Zhou, T.; Nijssen, B.; Huffman, G.J.; Lettenmaier, D.P. Evaluation of real-time satellite precipitation data for global drought monitoring. J. Hydrometeorol. 2014, 15, 1651–1660. [Google Scholar] [CrossRef]
  52. Burroughs, W. Climate: Into the 21st Century; Cambridge University Press: Cambridge, UK, 2003. [Google Scholar]
  53. Wu, H.; Hayes, M.J.; Wilhite, D.A.; Svoboda, M.D. The effect of the length of record on the standardized precipitation index calculation. Int. J. Climatol. 2005, 25, 505–520. [Google Scholar] [CrossRef]
  54. Rao, M.; Samarth, A. Population dynamics and climate change: Links and issues for development. J. Public Health 2010, 32, 163–164. [Google Scholar] [CrossRef] [PubMed]
  55. Piao, S.; Ciais, P.; Huang, Y.; Shen, Z.; Peng, S.; Li, J.; Zhou, L.; Liu, H.; Ma, Y.; Ding, Y. The impacts of climate change on water resources and agriculture in China. Nature 2010, 467, 43–51. [Google Scholar] [CrossRef] [PubMed]
  56. Wang, X.J.; Zhang, J.Y.; Shahid, S.; ElMahdi, A.; He, R.M.; Bao, Z.X.; Ali, M. Water resources management strategy for adaptation to droughts in China. Mitig. Adapt. Strateg. Glob. Chang. 2012, 17, 923–937. [Google Scholar] [Green Version]
  57. Weng, B.; Zhang, P.; Li, S. Drought risk assessment in China with different spatial scales. Arab. J. Geosci. 2015, 8, 10193–10202. [Google Scholar] [CrossRef]
  58. Ashouri, H.; Hsu, K.L.; Sorooshian, S.; Braithwaite, D.K.; Knapp, K.R.; Cecil, L.D.; Nelson, B.R.; Prat, O.P. Persiann-CDR daily precipitation climate data record from multisatellite observations for hydrological and climate studies. Bull. Am. Meteorol. Soc. 2015, 96, 69–83. [Google Scholar] [CrossRef]
  59. Casse, C.; Gosset, M. Analysis of hydrological changes and flood increase in Niamey based on the PERSIANN-CDR satellite rainfall estimate and hydrological simulations over the 1983–2013 period. Proc. IAHS 2015, 370, 117–123. [Google Scholar] [CrossRef]
  60. Guo, H.; Chen, S.; Bao, A.M.; Hu, J.J.; Gebregiorgis, A.S.; Xue, X.W.; Zhang, X.H. Inter-comparison of high-resolution satellite precipitation products over Central Asia. Remote Sens. 2015, 7, 7181–7211. [Google Scholar] [CrossRef]
  61. Yang, X.; Yong, B.; Hong, Y.; Chen, S.; Zhang, X. Error analysis of multi-satellite precipitation estimates with an independent raingauge observation network over a medium-sized humid basin. Hydrol. Sci. J. 2015, 1–42. [Google Scholar] [CrossRef]
  62. Guo, H.; Chen, S.; Bao, A.; Hu, J.; Yang, B.; Stepanian, P. Comprehensive evaluation of high-resolution satellite-based precipitation products over China. Atmosphere 2015, 7, 1–25. [Google Scholar] [CrossRef]
  63. Chen, S.; Hong, Y.; Cao, Q.; Gourley, J.J.; Kirstetter, P.E.; Yong, B.; Tian, Y.D.; Zhang, Z.X.; Shen, Y.; Hu, J.J.; et al. Similarity and difference of the two successive v6 and v7 trmm multisatellite precipitation analysis performance over China. J. Geophys. Res. 2013, 118, 13060–13074. [Google Scholar] [CrossRef]
  64. Tang, Z.Y.; Wang, Z.H.; Zheng, C.Y.; Fang, J.Y. Biodiversity in China’s mountains. Front. Ecol. Environ. 2006, 4, 347–352. [Google Scholar] [CrossRef]
  65. Qian, W.; Lin, X. Regional trends in recent precipitation indices in China. Meteorol. Atmos. Phys. 2005, 90, 193–207. [Google Scholar] [CrossRef]
  66. Bothe, O.; Fraedrich, K.; Zhu, X.H. Precipitation climate of central Asia and the large-scale atmospheric circulation. Theor. Appl. Climatol. 2012, 108, 345–354. [Google Scholar] [CrossRef]
  67. Zhou, T.; Gong, D.; Li, J.; Li, B. Detecting and understanding the multi-decadal variability of the east Asian summer monsoon—Recent progress and state of affairs. Meteorol. Z. 2009, 18, 455–467. [Google Scholar] [CrossRef]
  68. Liu, X.D.; Wang, Y. Contrasting impacts of spring thermal conditions over Tibetan Plateau on late-spring to early-summer precipitation in southeast China. Atmos. Sci. Lett. 2011, 12, 309–315. [Google Scholar] [CrossRef]
  69. Zhou, T.J.; Yu, R.C.; Chen, H.M.; Dai, A.; Pan, Y. Summer precipitation frequency, intensity, and diurnal cycle over China: A comparison of satellite data with rain gauge observations. J. Clim. 2008, 21, 3997–4010. [Google Scholar] [CrossRef]
  70. Shen, Y.; Xiong, A.Y.; Wang, Y.; Xie, P.P. Performance of high-resolution satellite precipitation products over China. J. Geophys. Res. 2010, 115, D02114. [Google Scholar] [CrossRef]
  71. Knapp, K.R. Scientific data stewardship of International Satellite Cloud Climatology Project B1 global geostationary observations. J. Appl. Remote Sens. 2008, 2, 023548. [Google Scholar] [CrossRef]
  72. Climate Data Record (CDR) Program Climate Algorithm Theoretical Basis Document. Available online: http://www1.ncdc.noaa.gov/pub/data/sds/cdr/CDRs/Sea_Surface_Temperature_Pathfinder/AlgorithmDescription.pdf (accessed on 6 June 2015).
  73. Persiann-CDR ftp Download. Available online: ftp://data.ncdc.noaa.gov/cdr/persiann/files/ (accessed on 6 April 2015).
  74. Hutchinson, M.F. Interpolation of rainfall data with thin plate smoothing splines. Part I: Two dimensional smoothing of data with short range correlation. J. Geogr. Inf. Decis. Anal. 1998, 2, 139–151. [Google Scholar]
  75. Hutchinson, M.F. Interpolation of rainfall data with thin plate smoothing splines. Part II: Analysis of topographic dependence. J. Geogr. Inf. Decis. Anal. 1998, 2, 152–167. [Google Scholar]
  76. Zhao, Y.; Zhu, J.; Xu, Y. Establishment and assessment of the grid precipitation datasets in China for recent 50 years. J. Meteorol. Sci. 2014, 34, 414–420, (In Chinese with English Abstract). [Google Scholar]
  77. Zhao, Y.; Zhu, J. Assessing quality of grid daily precipitation datasets in China in recent 50 years. Plateau Meteorol. 2015, 34, 50–58, (In Chinese with English Abstract). [Google Scholar]
  78. Shen, Y.; Xiong, A.; Hong, Y.; Yu, J.; Pan, Y.; Chen, Z.; Saharia, M. Uncertainty analysis of five satellite-based precipitation products and evaluation of three optimally merged multi-algorithm products over the Tibetan Plateau. Int. J. Remote Sens. 2014, 35, 6843–6858. [Google Scholar] [CrossRef]
  79. Sternberg, T.; Thomas, D.; Middleton, N. Drought dynamics on the Mongolian Steppe, 1970–2006. Int. J. Climatol. 2011, 31, 1823–1830. [Google Scholar] [CrossRef]
  80. Bordi, I.; Sutera, A. Drought monitoring and forecasting at large scale. In Methods and Tools for Drought Analysis and Management; Rossi, G., Vega, T., Bonaccorso, B., Eds.; Springer Netherlands: Berlin, Germany, 2007; Volume 62, pp. 3–27. [Google Scholar]
  81. Mo, K.C.; Long, L.N.; Xia, Y.L.; Yang, S.K.; Schemm, J.E.; Ek, M. Drought indices based on the Climate Forecast System Reanalysis and ensemble NLDAS. J. Hydrometeorol. 2011, 12, 181–205. [Google Scholar] [CrossRef]
  82. Mihajlović, D. Monitoring the 2003–2004 meteorological drought over Pannonian part of Croatia. Int. J. Climatol. 2006, 26, 2213–2225. [Google Scholar] [CrossRef]
Figure 1. (a) Topographic map of China. The black solid lines indicate the borders of the seven sub-regions: (i) Xinjiang (XJ), (ii) Qinghai-Tibetan plateau (TP), (iii) Northwest (NW), (iv) Northeast (NE), (v) North (NC), (vi) Southwest Yungui Plateau (SW), and (vii) South (SC); (b) A density map of gauges over China with about 2400 gauges used in CPAP. The white panel in lower right corner of each figure represents the South China Sea region. China’s borders were downloaded from National Administration of Surveying, Mapping, and Geoinformation with No. GS (2008)1045.
Remotesensing 08 00379 g001
Figure 2. (a,b) Spatial distribution of 32 years monthly mean precipitation derived from (a) CPAP; and (b) PERSIANN-CDR over China; (c) is the corresponding scatterplot and error statistics between CPAP and PERSIANN-CDR. The white panel in lower left corner of each spatial distribution figures represents the South China Sea region.
Remotesensing 08 00379 g002
Figure 3. Spatial distribution of (a) RB; (b) CC; (c) RMSE; and (d) FRMSE between PERSIANN-CDR and CPAP over China on a 0.5 lat/lon grid.
Remotesensing 08 00379 g003
Figure 4. (ad) CC; and (eh) RMSE of SPI1, SPI3, SPI6 and SPI12 between PERSIANN-CDR and CPAP estimates from 1983 to 2014.
Remotesensing 08 00379 g004
Figure 5. The difference in total number of drought months between PERSIANN-CDR and CPAP for (a) SPI1; (b) SPI3; (c) SPI6; and (d) SPI12 from 1983 to 2014. Drought month is defined in conformity with the criterion SPI < −1.0.
Remotesensing 08 00379 g005
Figure 6. (ad) Percentage ratio between the number of months where only the PERSIANN-CDR identifies drought (x) and the number of months either PERSIANN-CDR or CPAP identifies drought (z); (eh) Percentage ratio between the number of months where only CPAP identifies drought (y) and (z); (il) Percentage ratio between the number of months where both PERSIANN-CDR and CPAP identify drought (u) and (z). Drought month is based on the criterion of SPI < −1.0.
Remotesensing 08 00379 g006
Figure 7. Spatial domain averaged time series of SPI12 over (a) mainland China and seven subregions; (b) XJ; (c) TP; (d) NW; (e) NE; (f) NC; (g) SW; and (h) SC. The four grey columns highlighted in different plots (XJ, NE, NC and SW) represent four typical drought events selected for case study in Section 3.4.
Remotesensing 08 00379 g007
Figure 8. Drought area percentage time series of SPI12 over (a) mainland China and seven subregions; (b) XJ; (c) TP; (d) NW; (e) NE; (f) NC; (g) SW; and (h) SC. A grid cell is considered under drought when SPI < −1.0. The four grey columns highlighted in different plots (XJ, NE, NC and SW) present four typical drought events selected for case study in Section 3.4.
Remotesensing 08 00379 g008
Figure 9. Spatial monthly maps of SPIs at 12-month time scale from (ad) CPAP; and (eh) PERSIANN-CDR for four specific drought events.
Remotesensing 08 00379 g009
Table 1. Drought categories according to SPI values.
SPI ValueCategory
2.0 and aboveExtremely wet
1.5 to 1.99Severely wet
1.0 to 1.49Moderately wet
−0.99 to 0.99Near normal
−1.0 to −1.49Moderately dry
−1.5 to −1.99Severely dry
−2.0 and lessExtremely dry
Table 2. Characteristics of four severe drought events at 12-month timescale over different subregions.
SubregionProductStart–EndDuration (Months)Severity
XJCPAPSeptember 1985–August 198612−12.00
PERSIANN-CDRJune 1985–January 198720−33.62
NECPAPOctober 2001–March 20026−6.86
PERSIANN-CDRSeptember 2001–March 20027−9.67
NCCPAPSeptember 1997–March 19987−8.50
PERSIANN-CDRSeptember 1997–April 19988−10.55
SWCPAPAugust 2011–June 20127−13.03
PERSIANN-CDRAugust 2011–June 20127−6.59

