
Cloud Cover Assessment for Operational Crop Monitoring Systems in Tropical Areas


 ,
,  , and
, and
Abstract
:
1. Introduction
2. Methodology
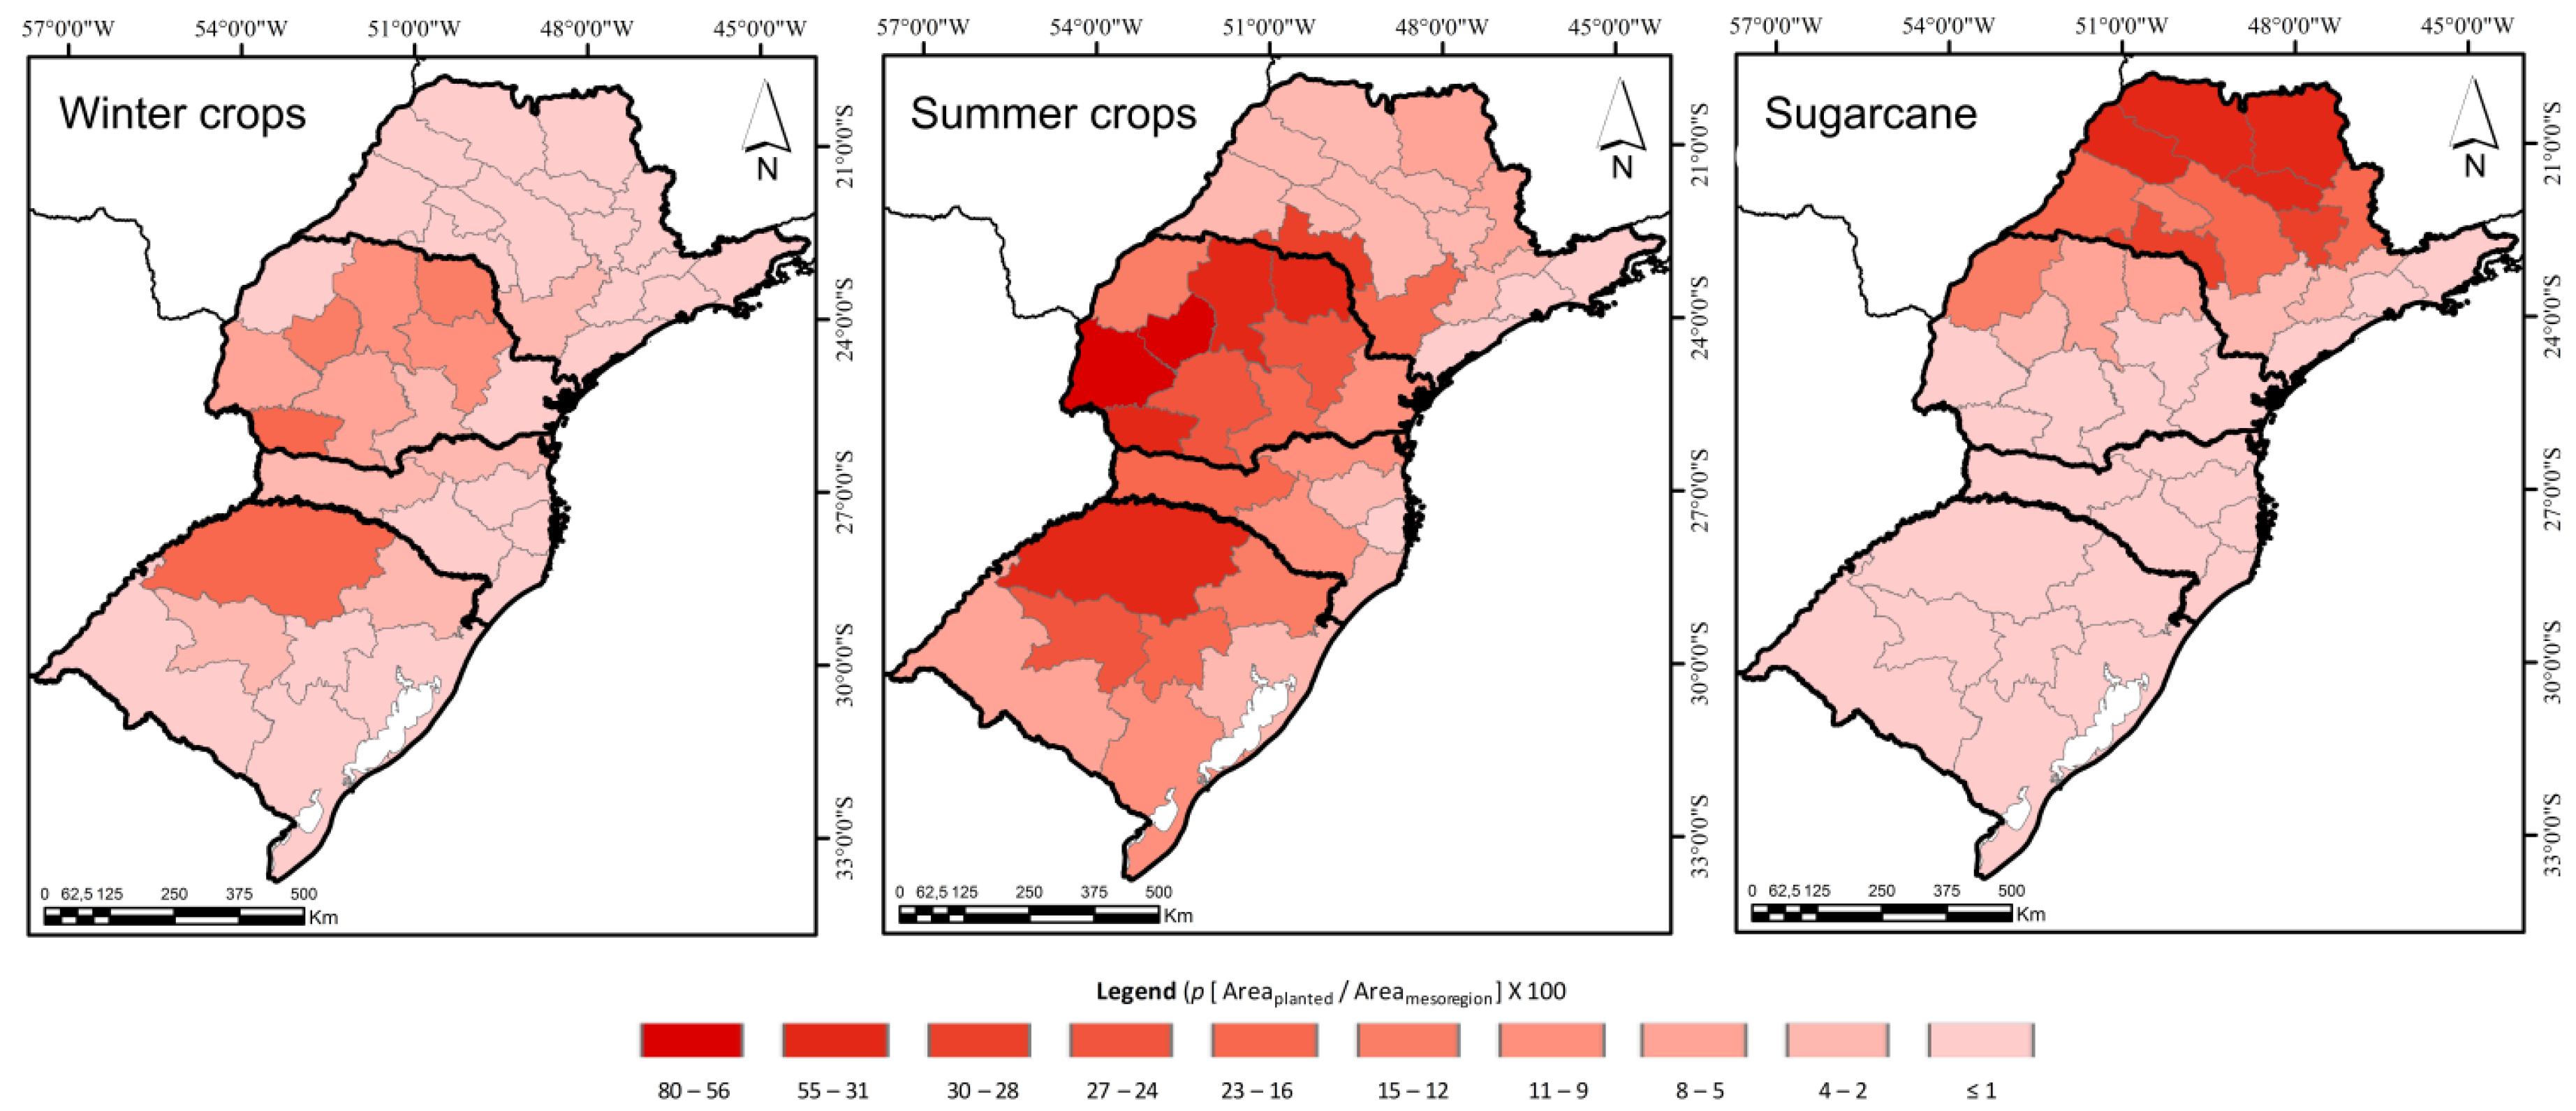
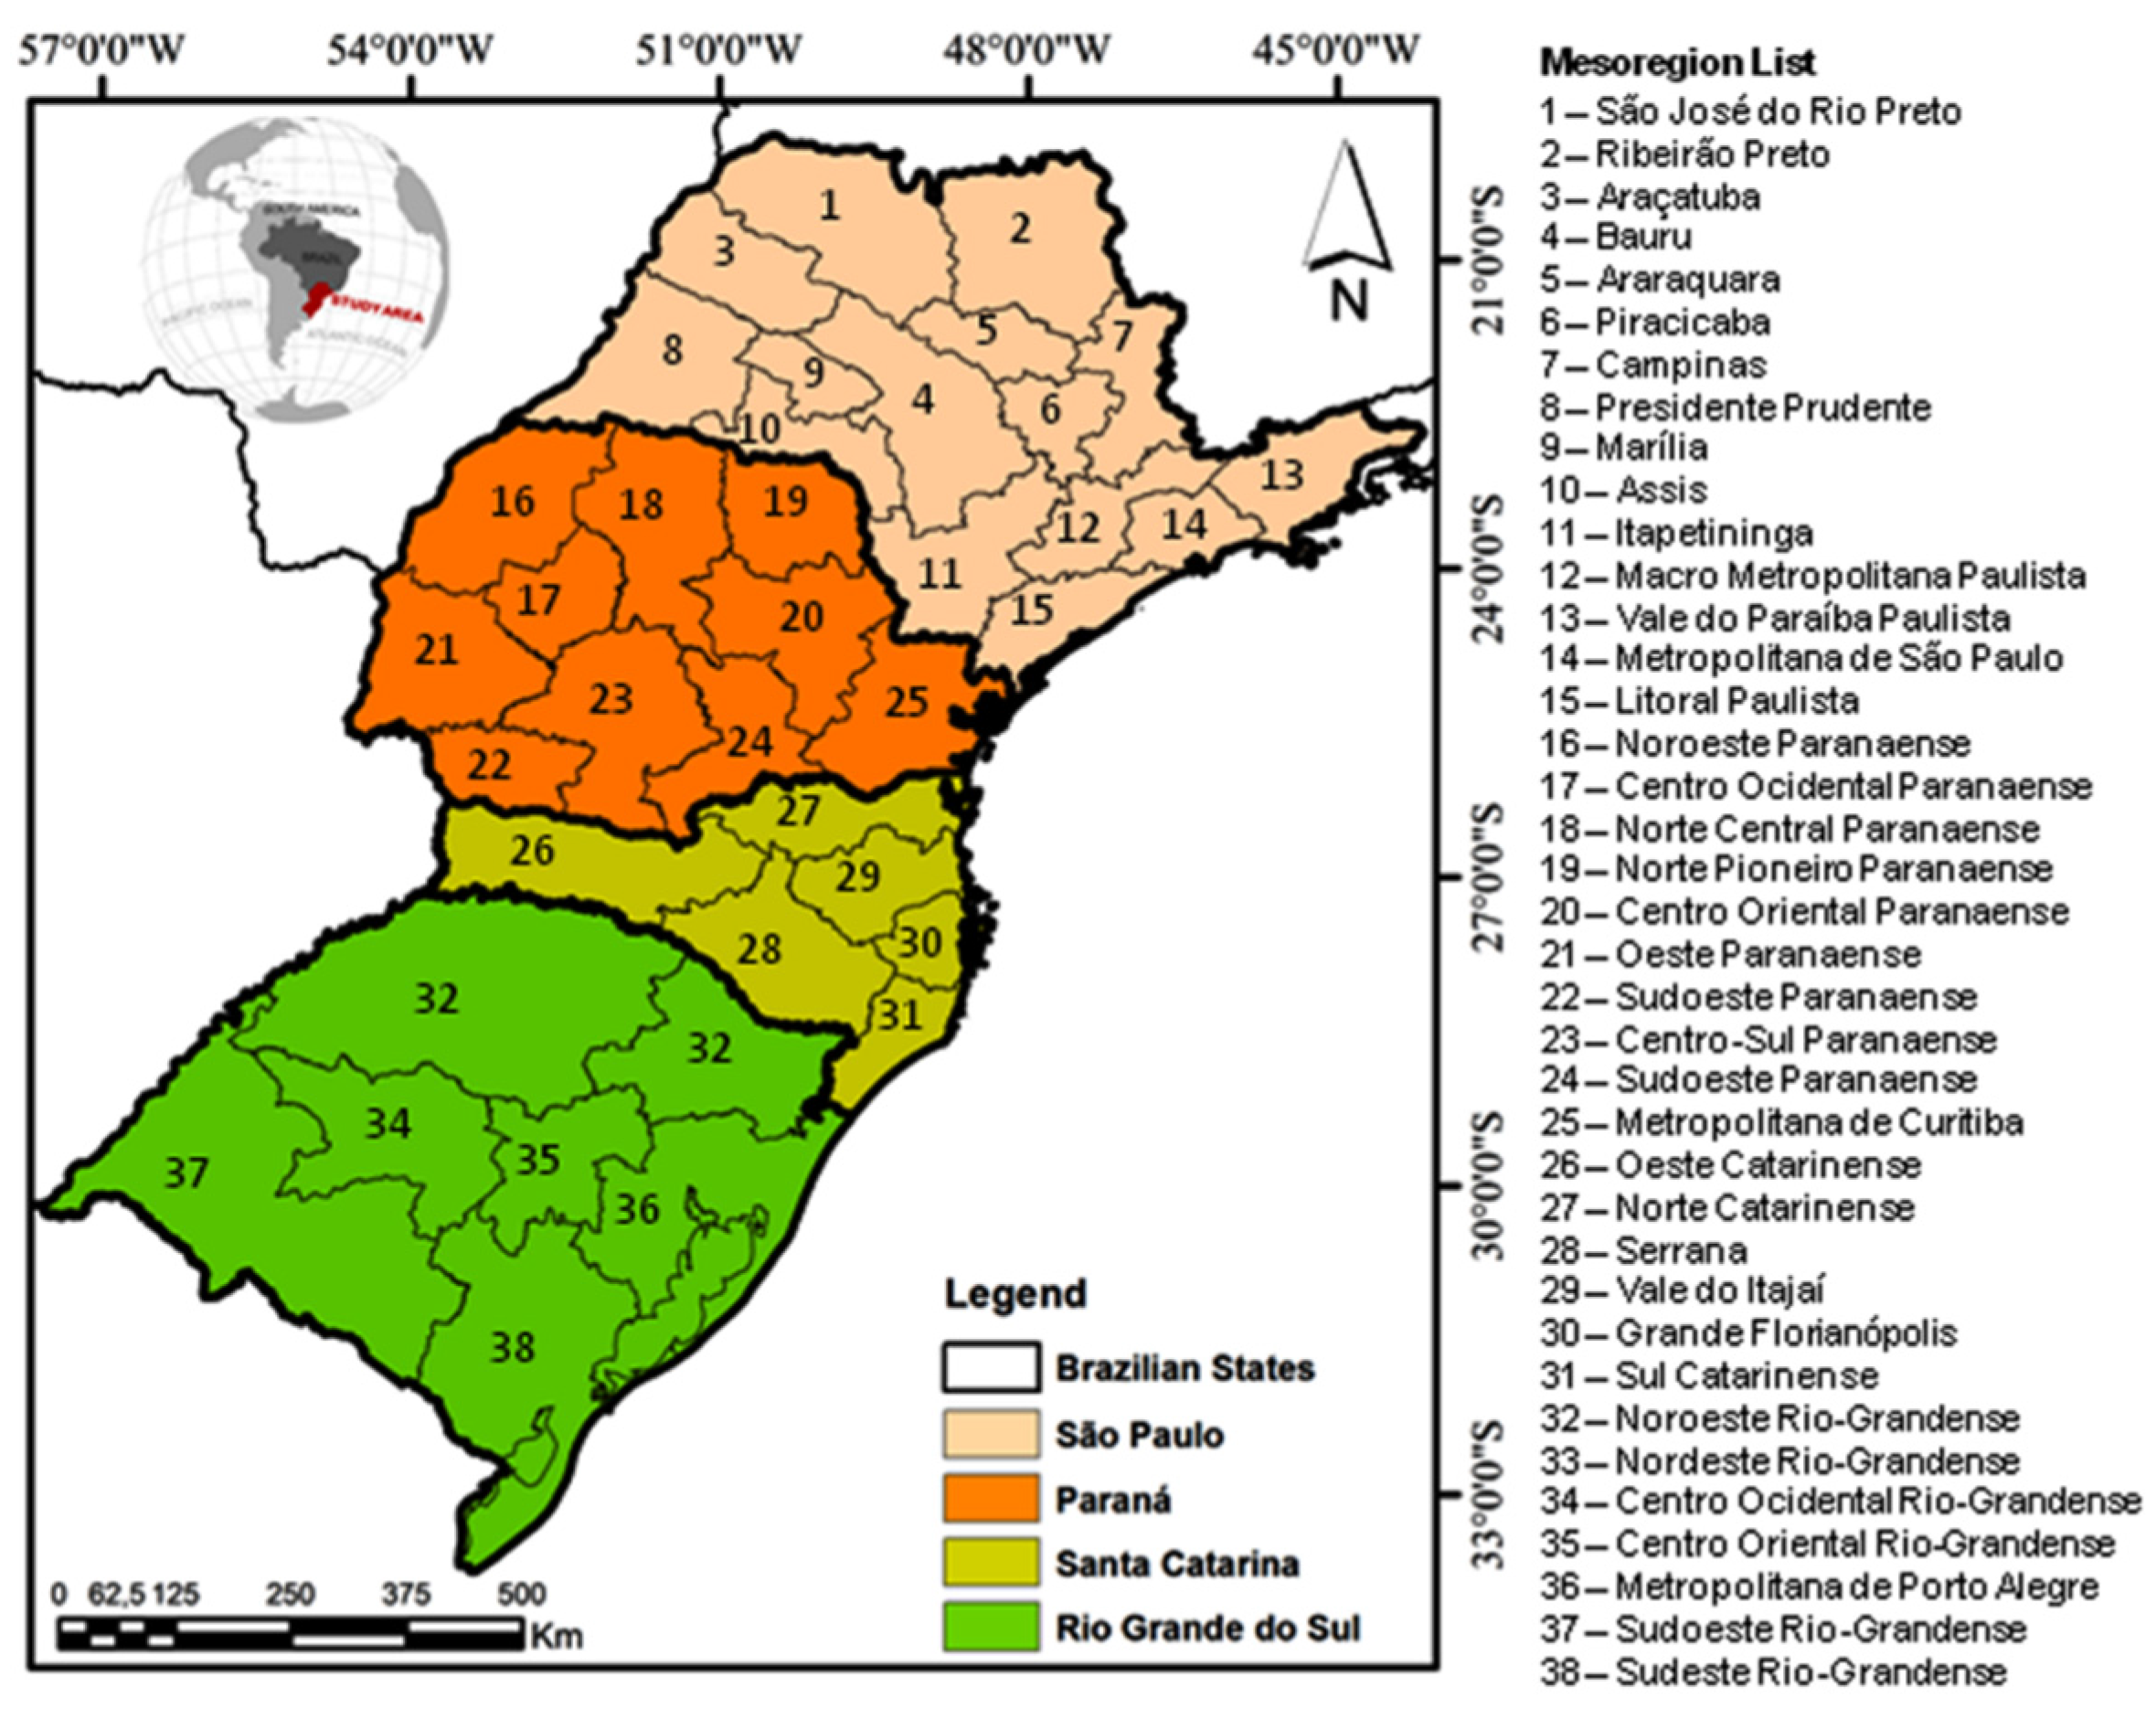
2.1. Study Site
2.2. MODIS Cloud Mask Product
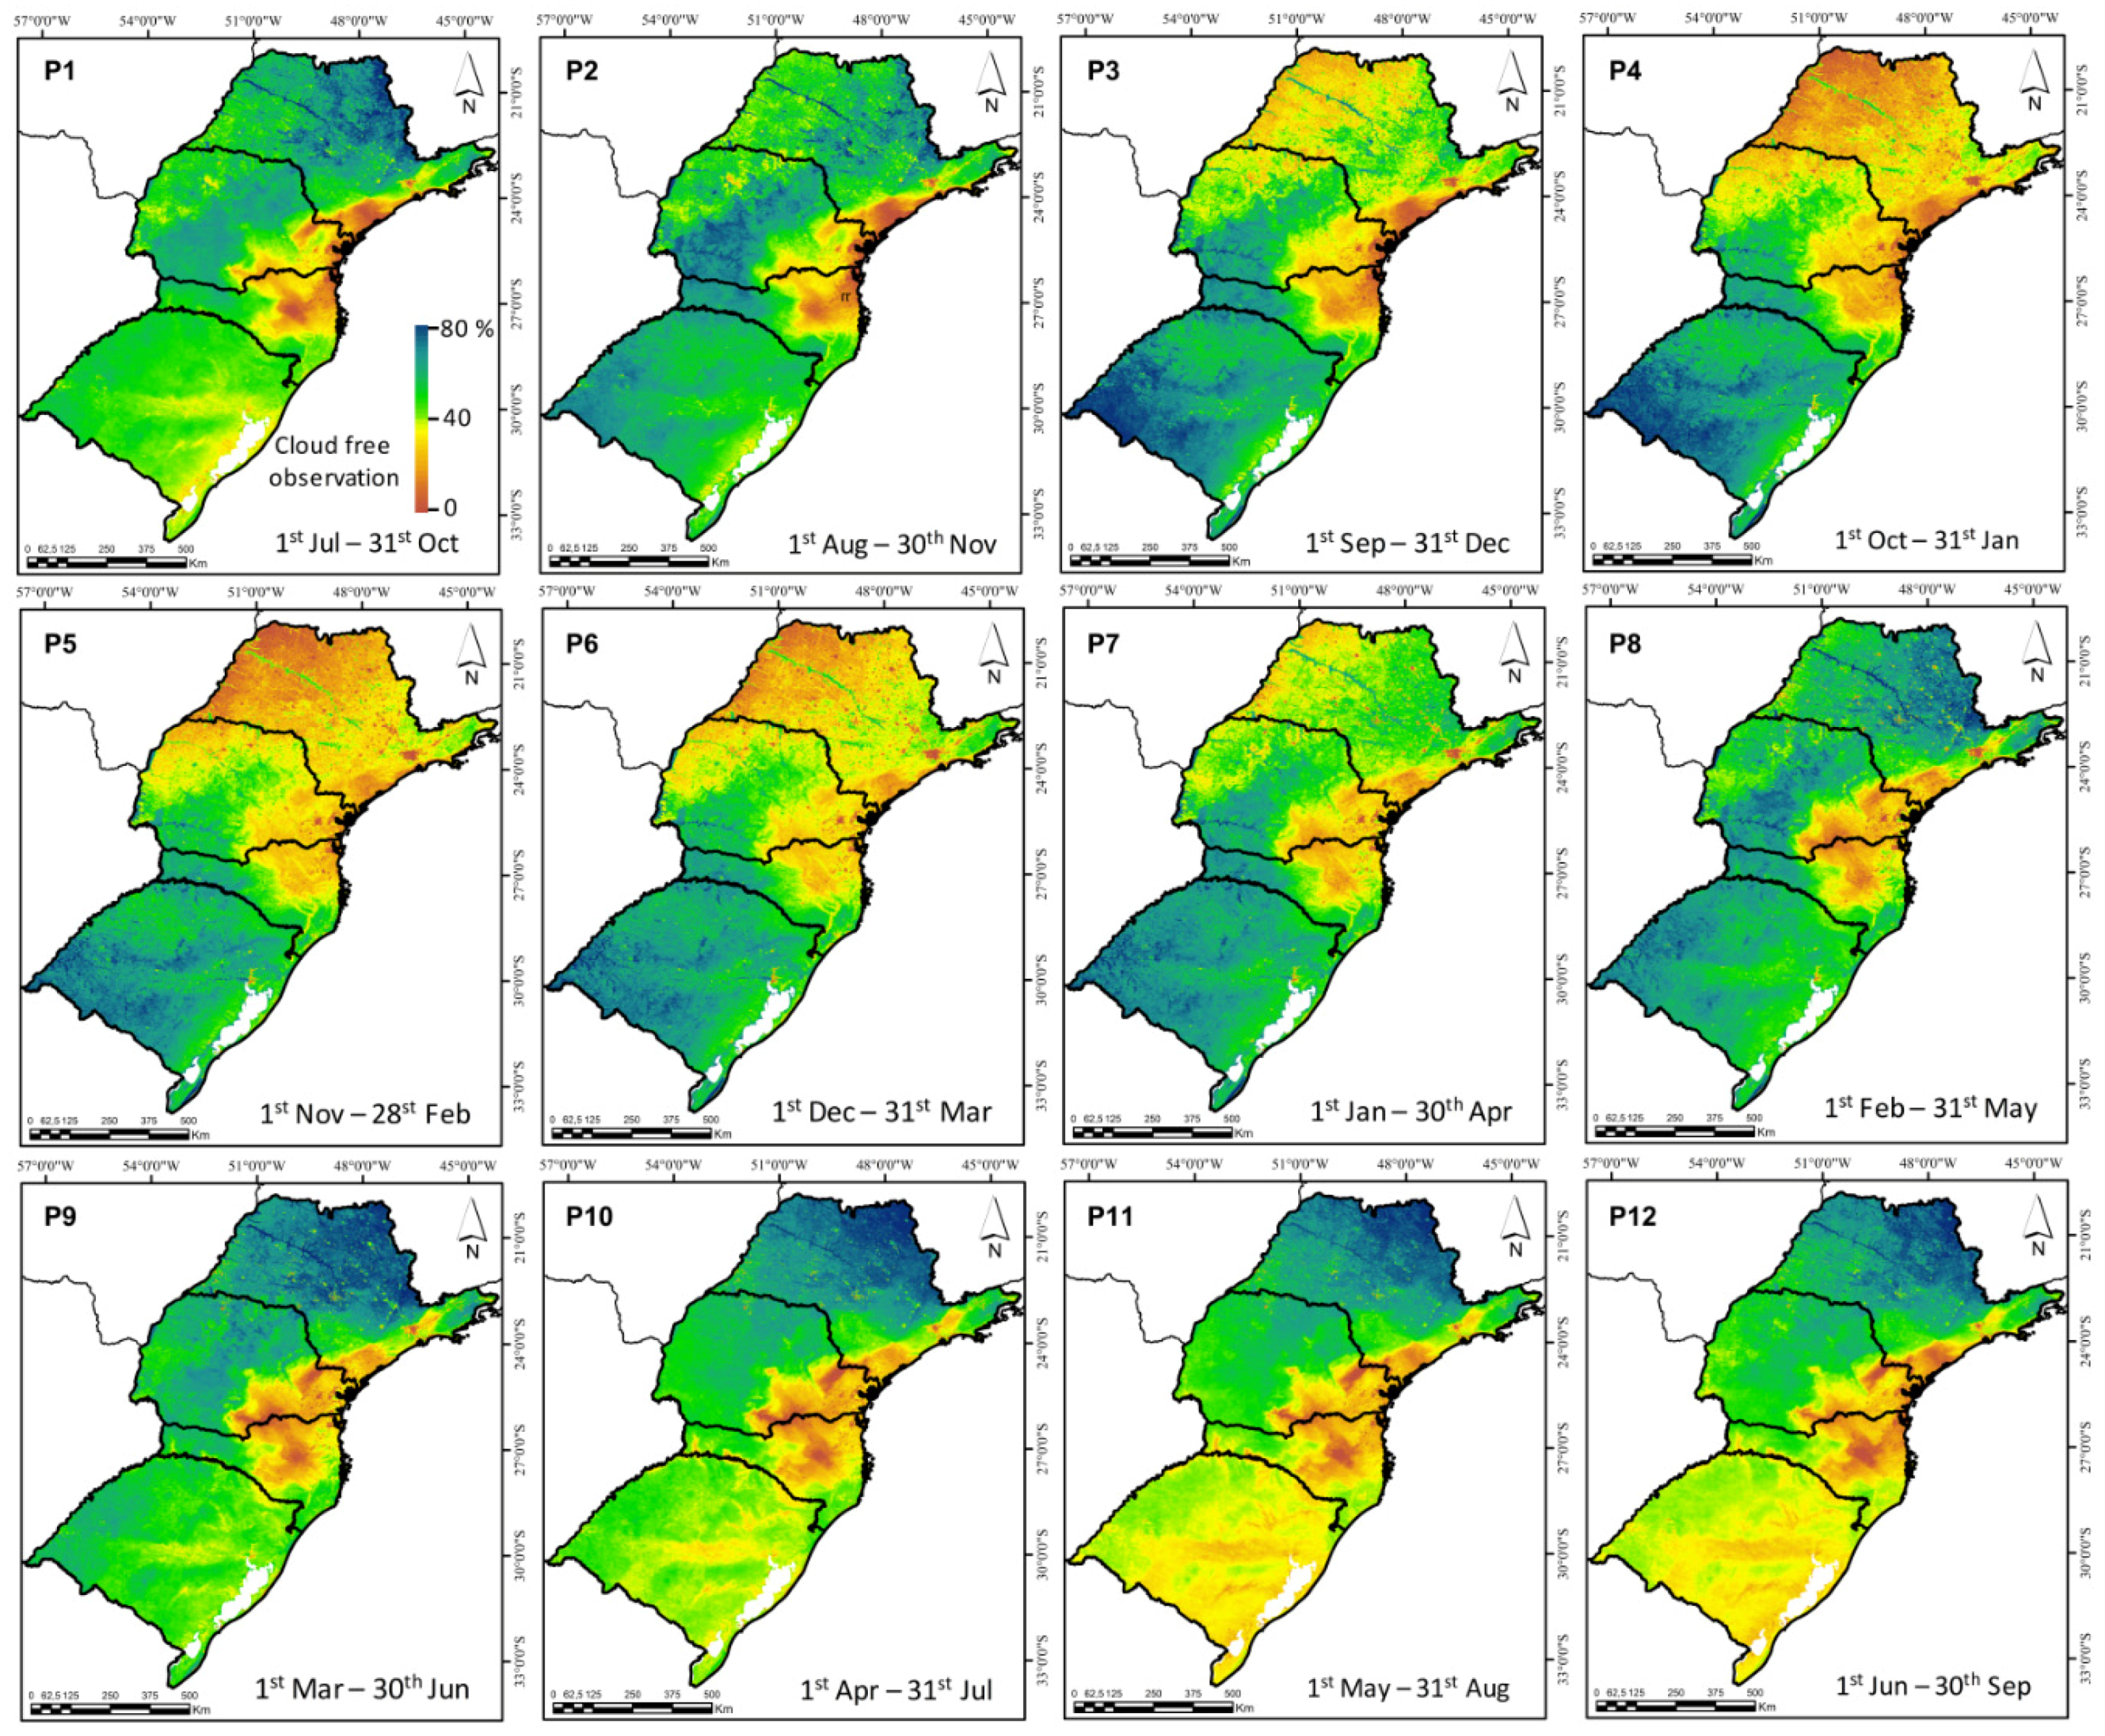
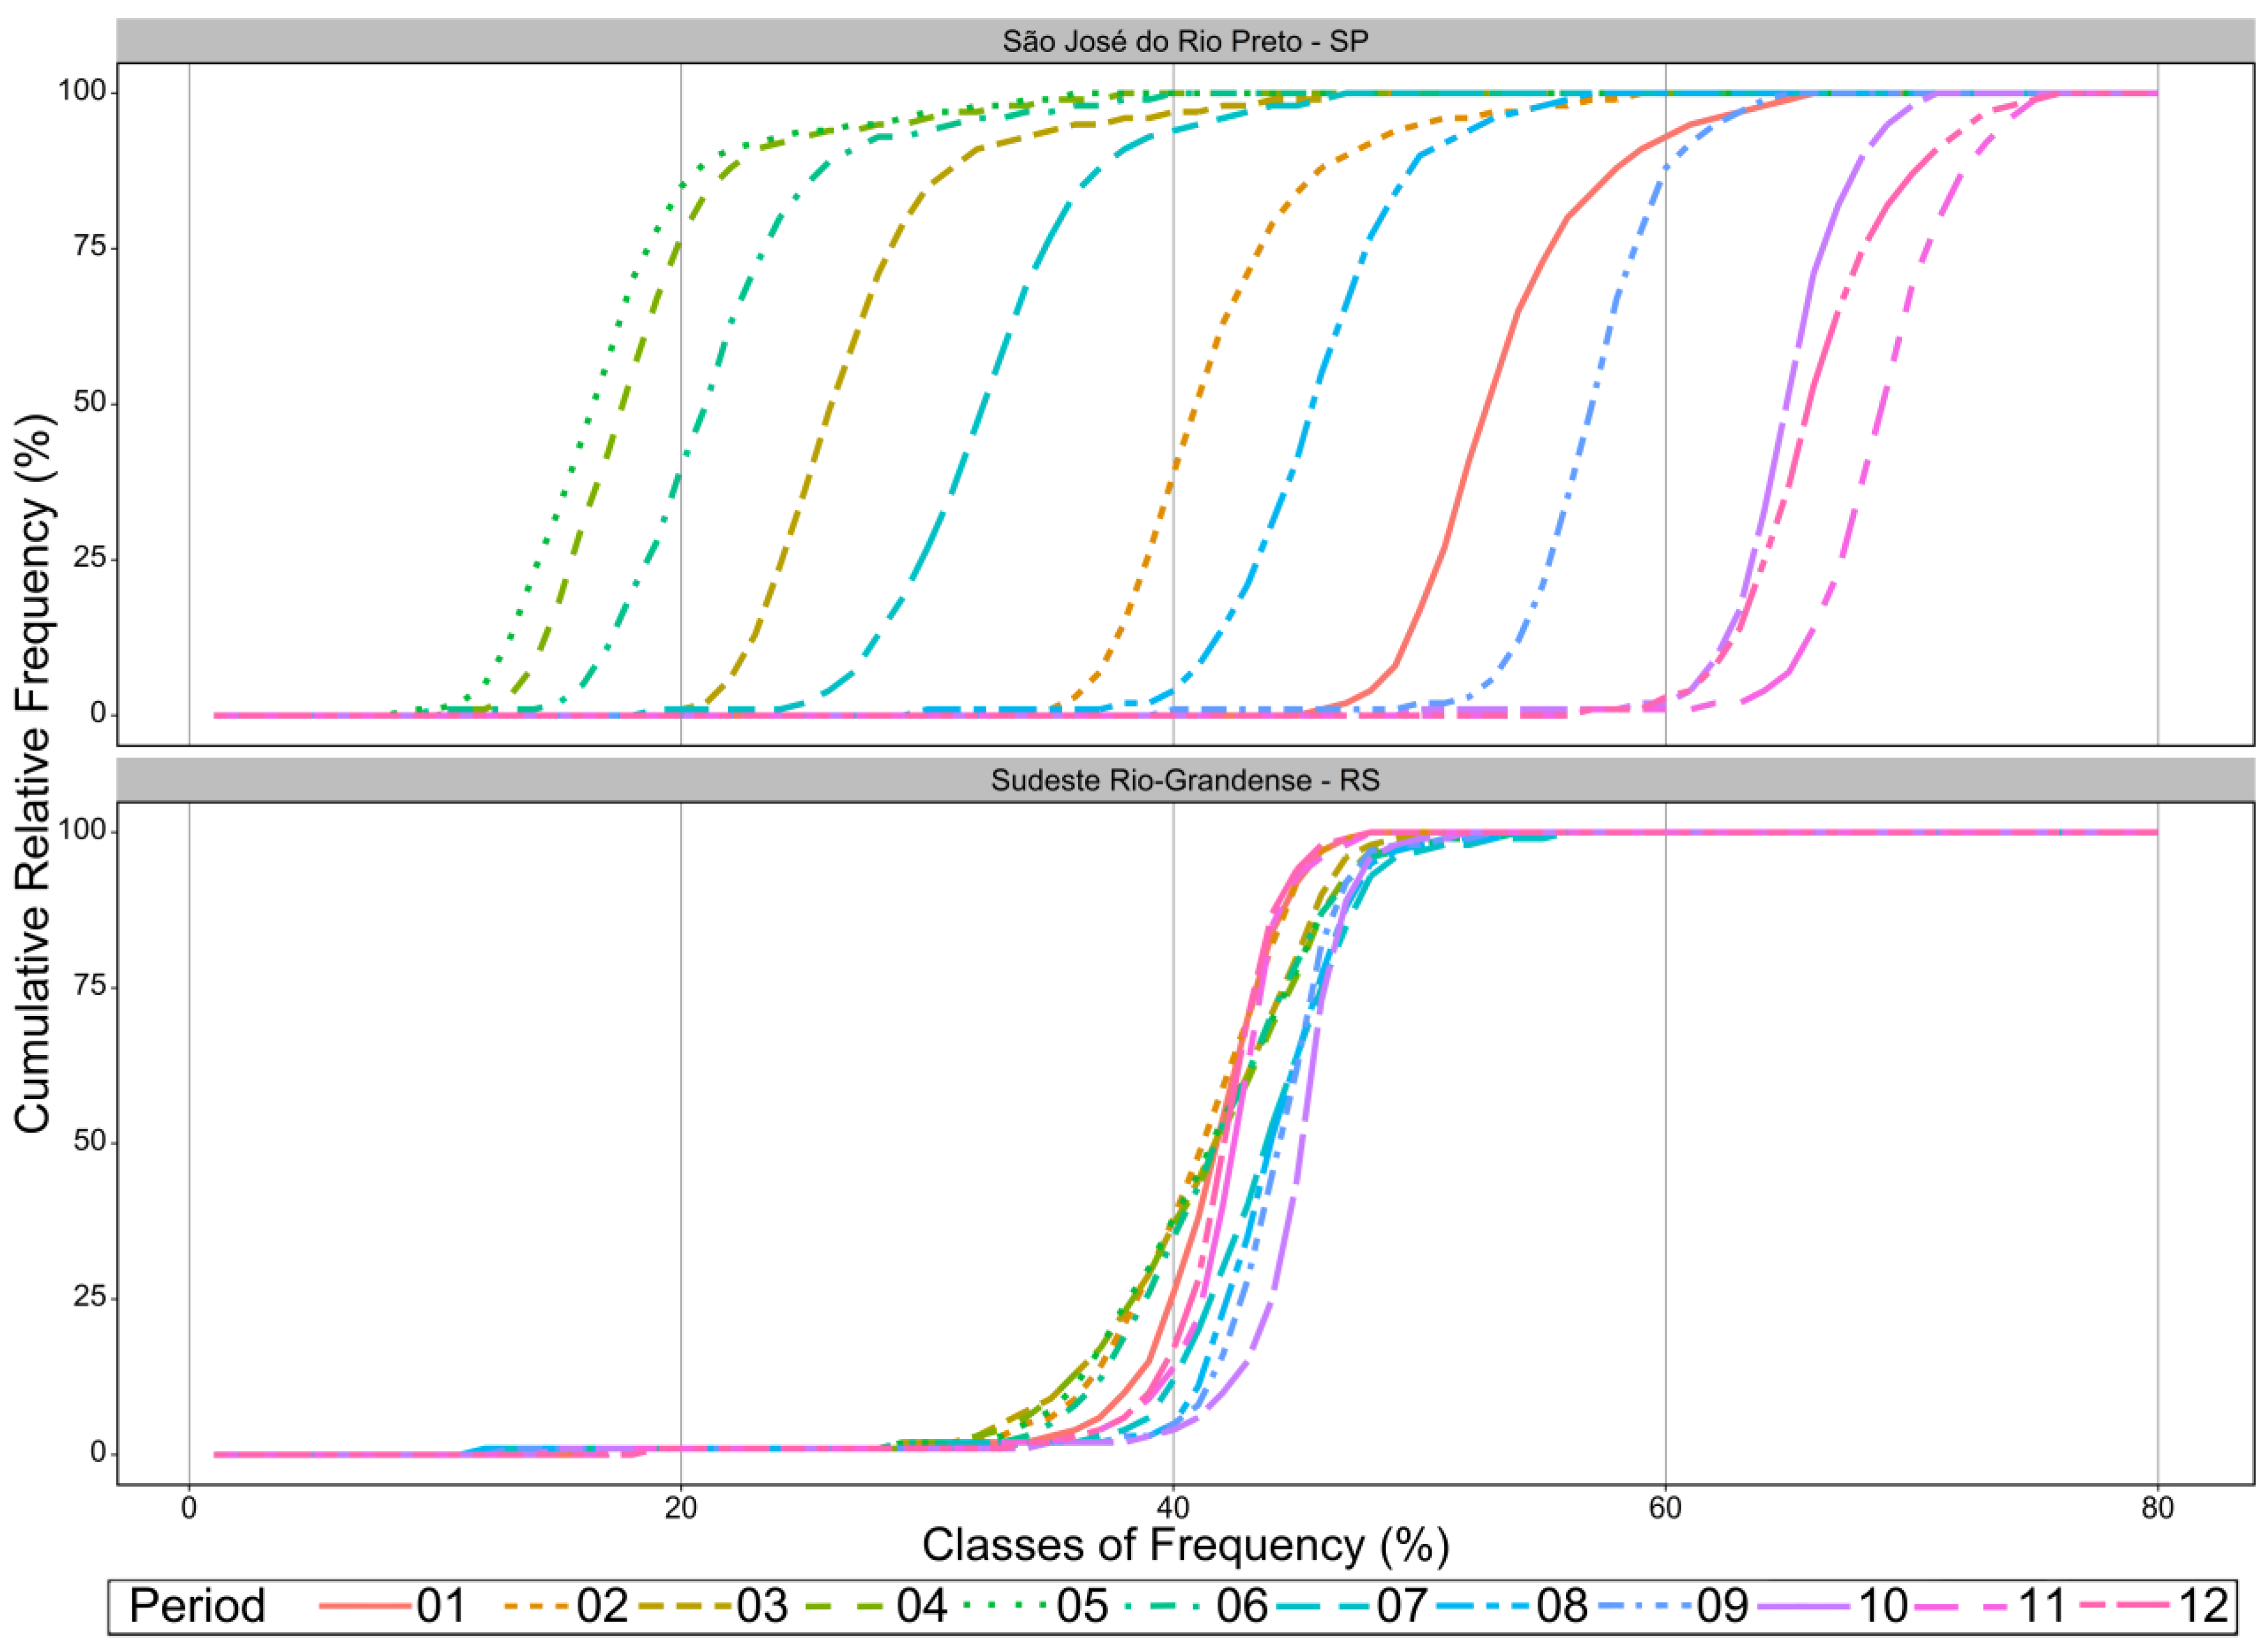
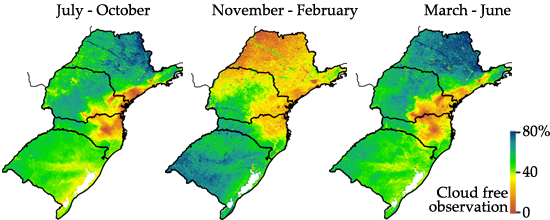
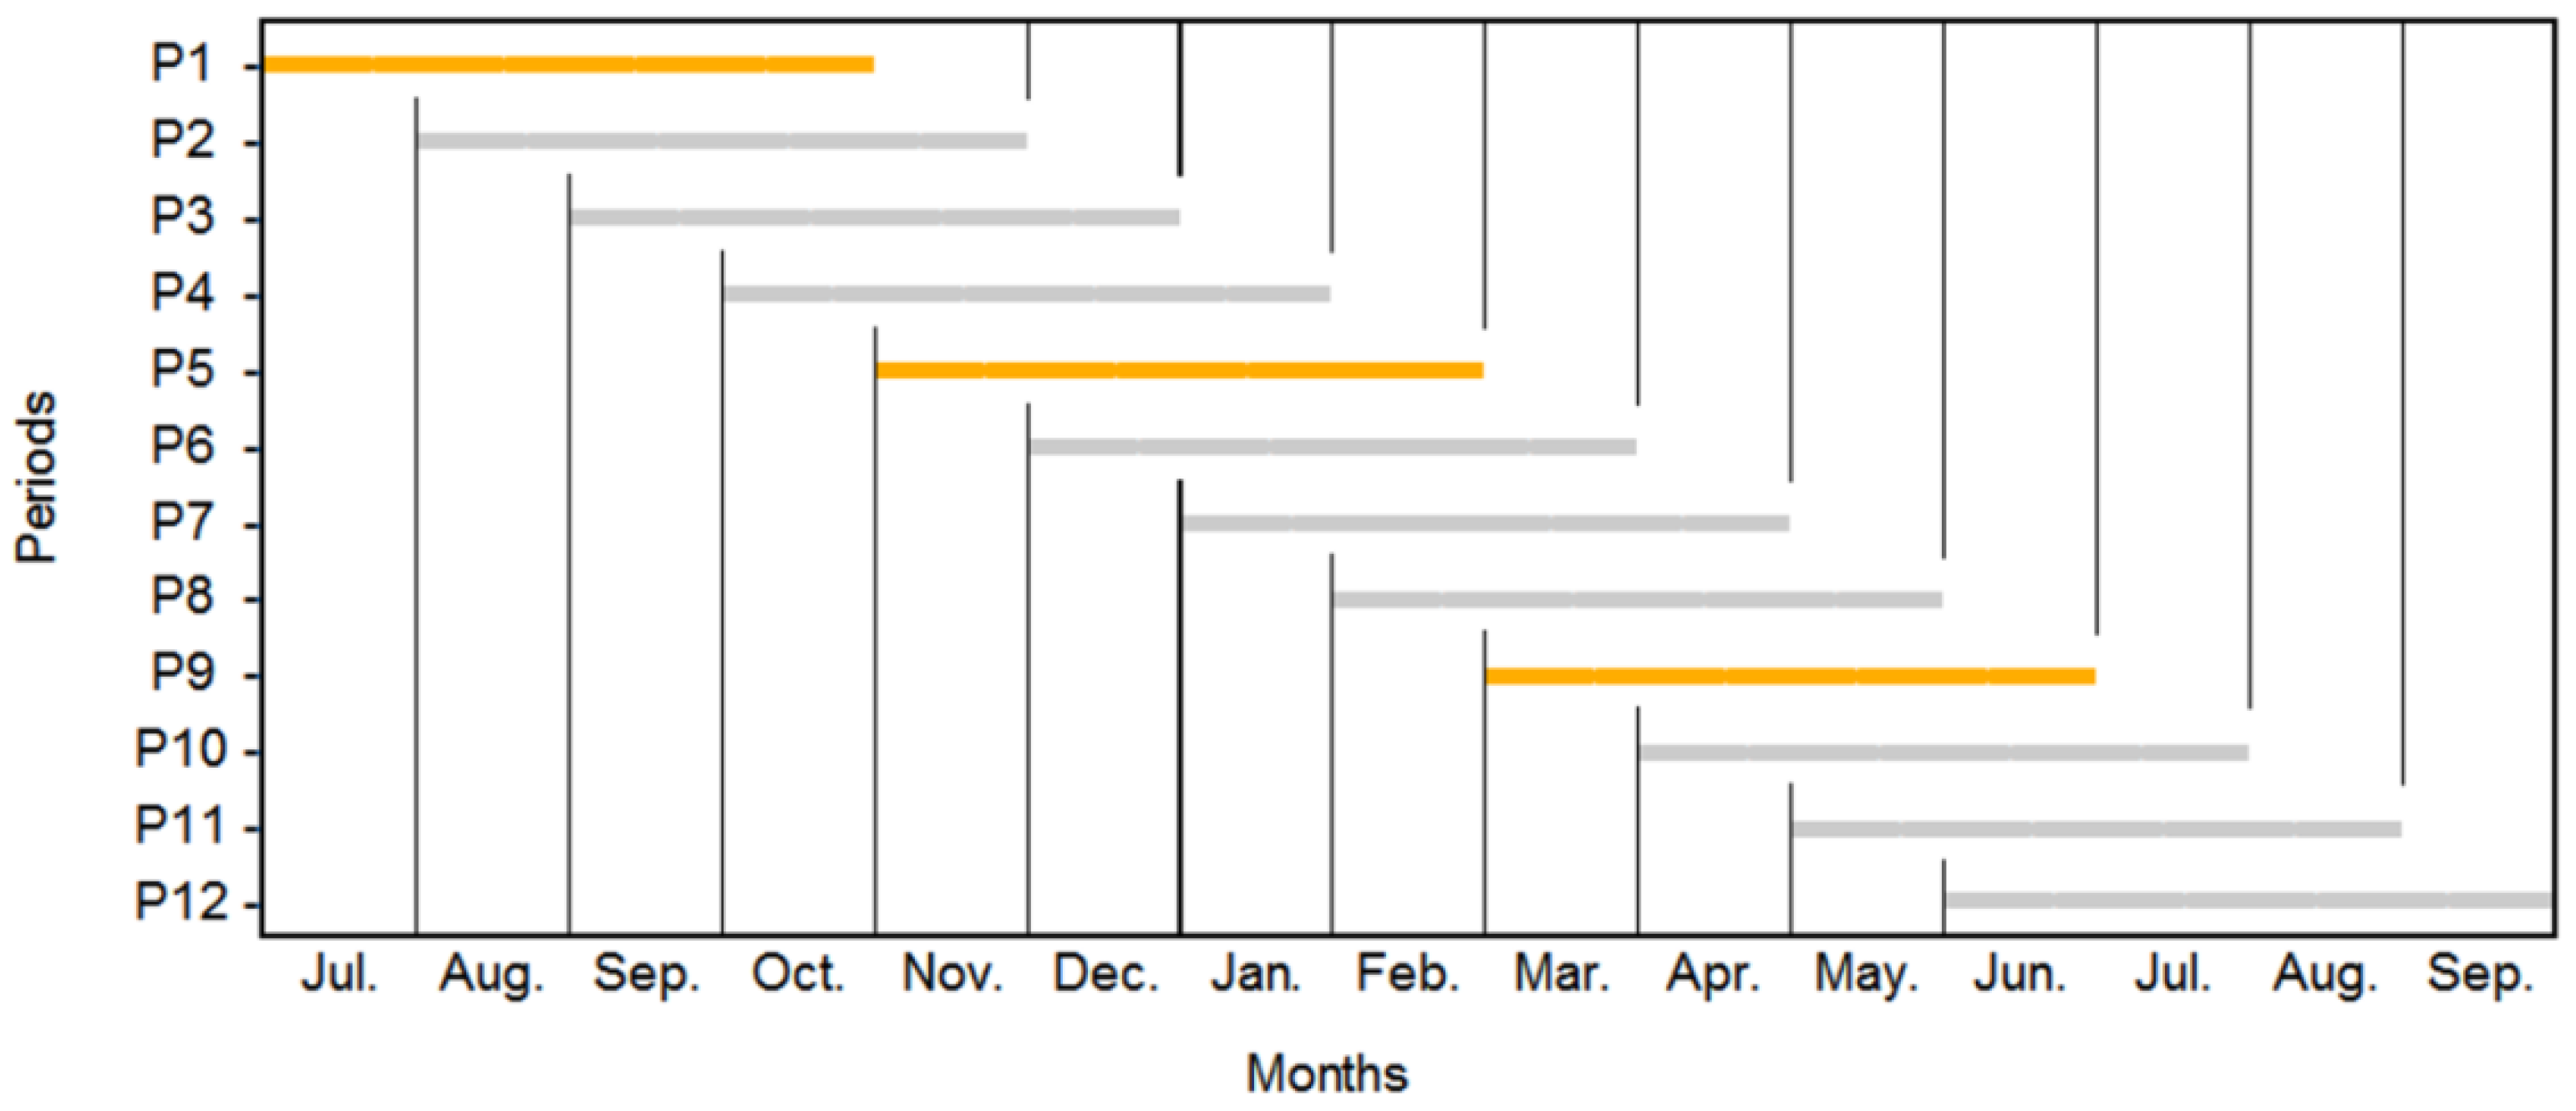
2.3. Clear Sky Statistics
- clear sky (confident clear), and,
- cloudy (probably clear + uncertain clear + cloudy).
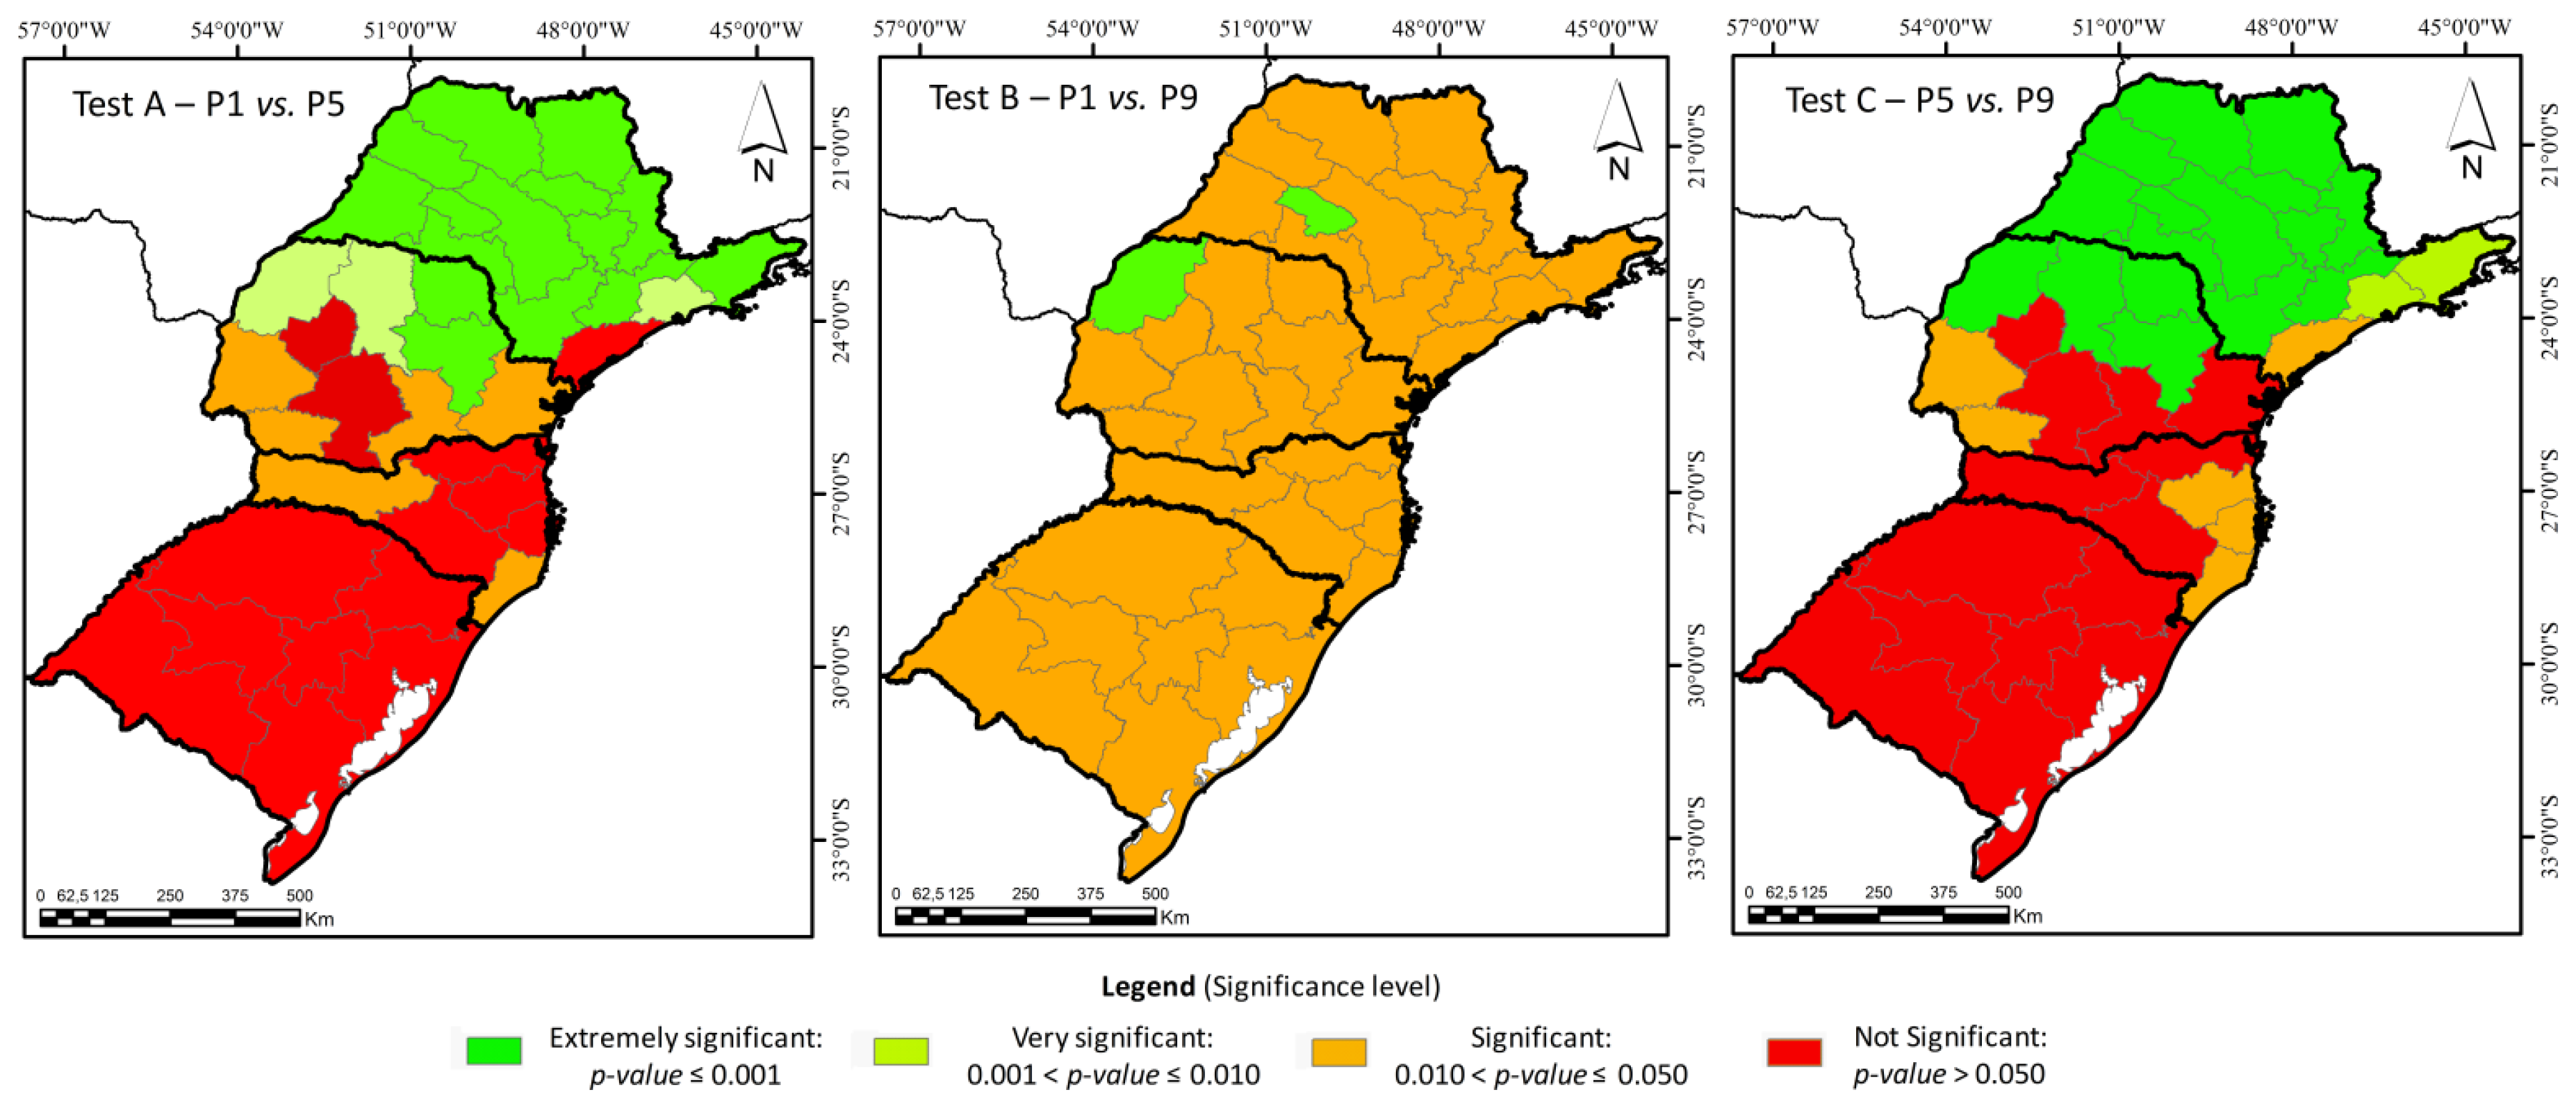
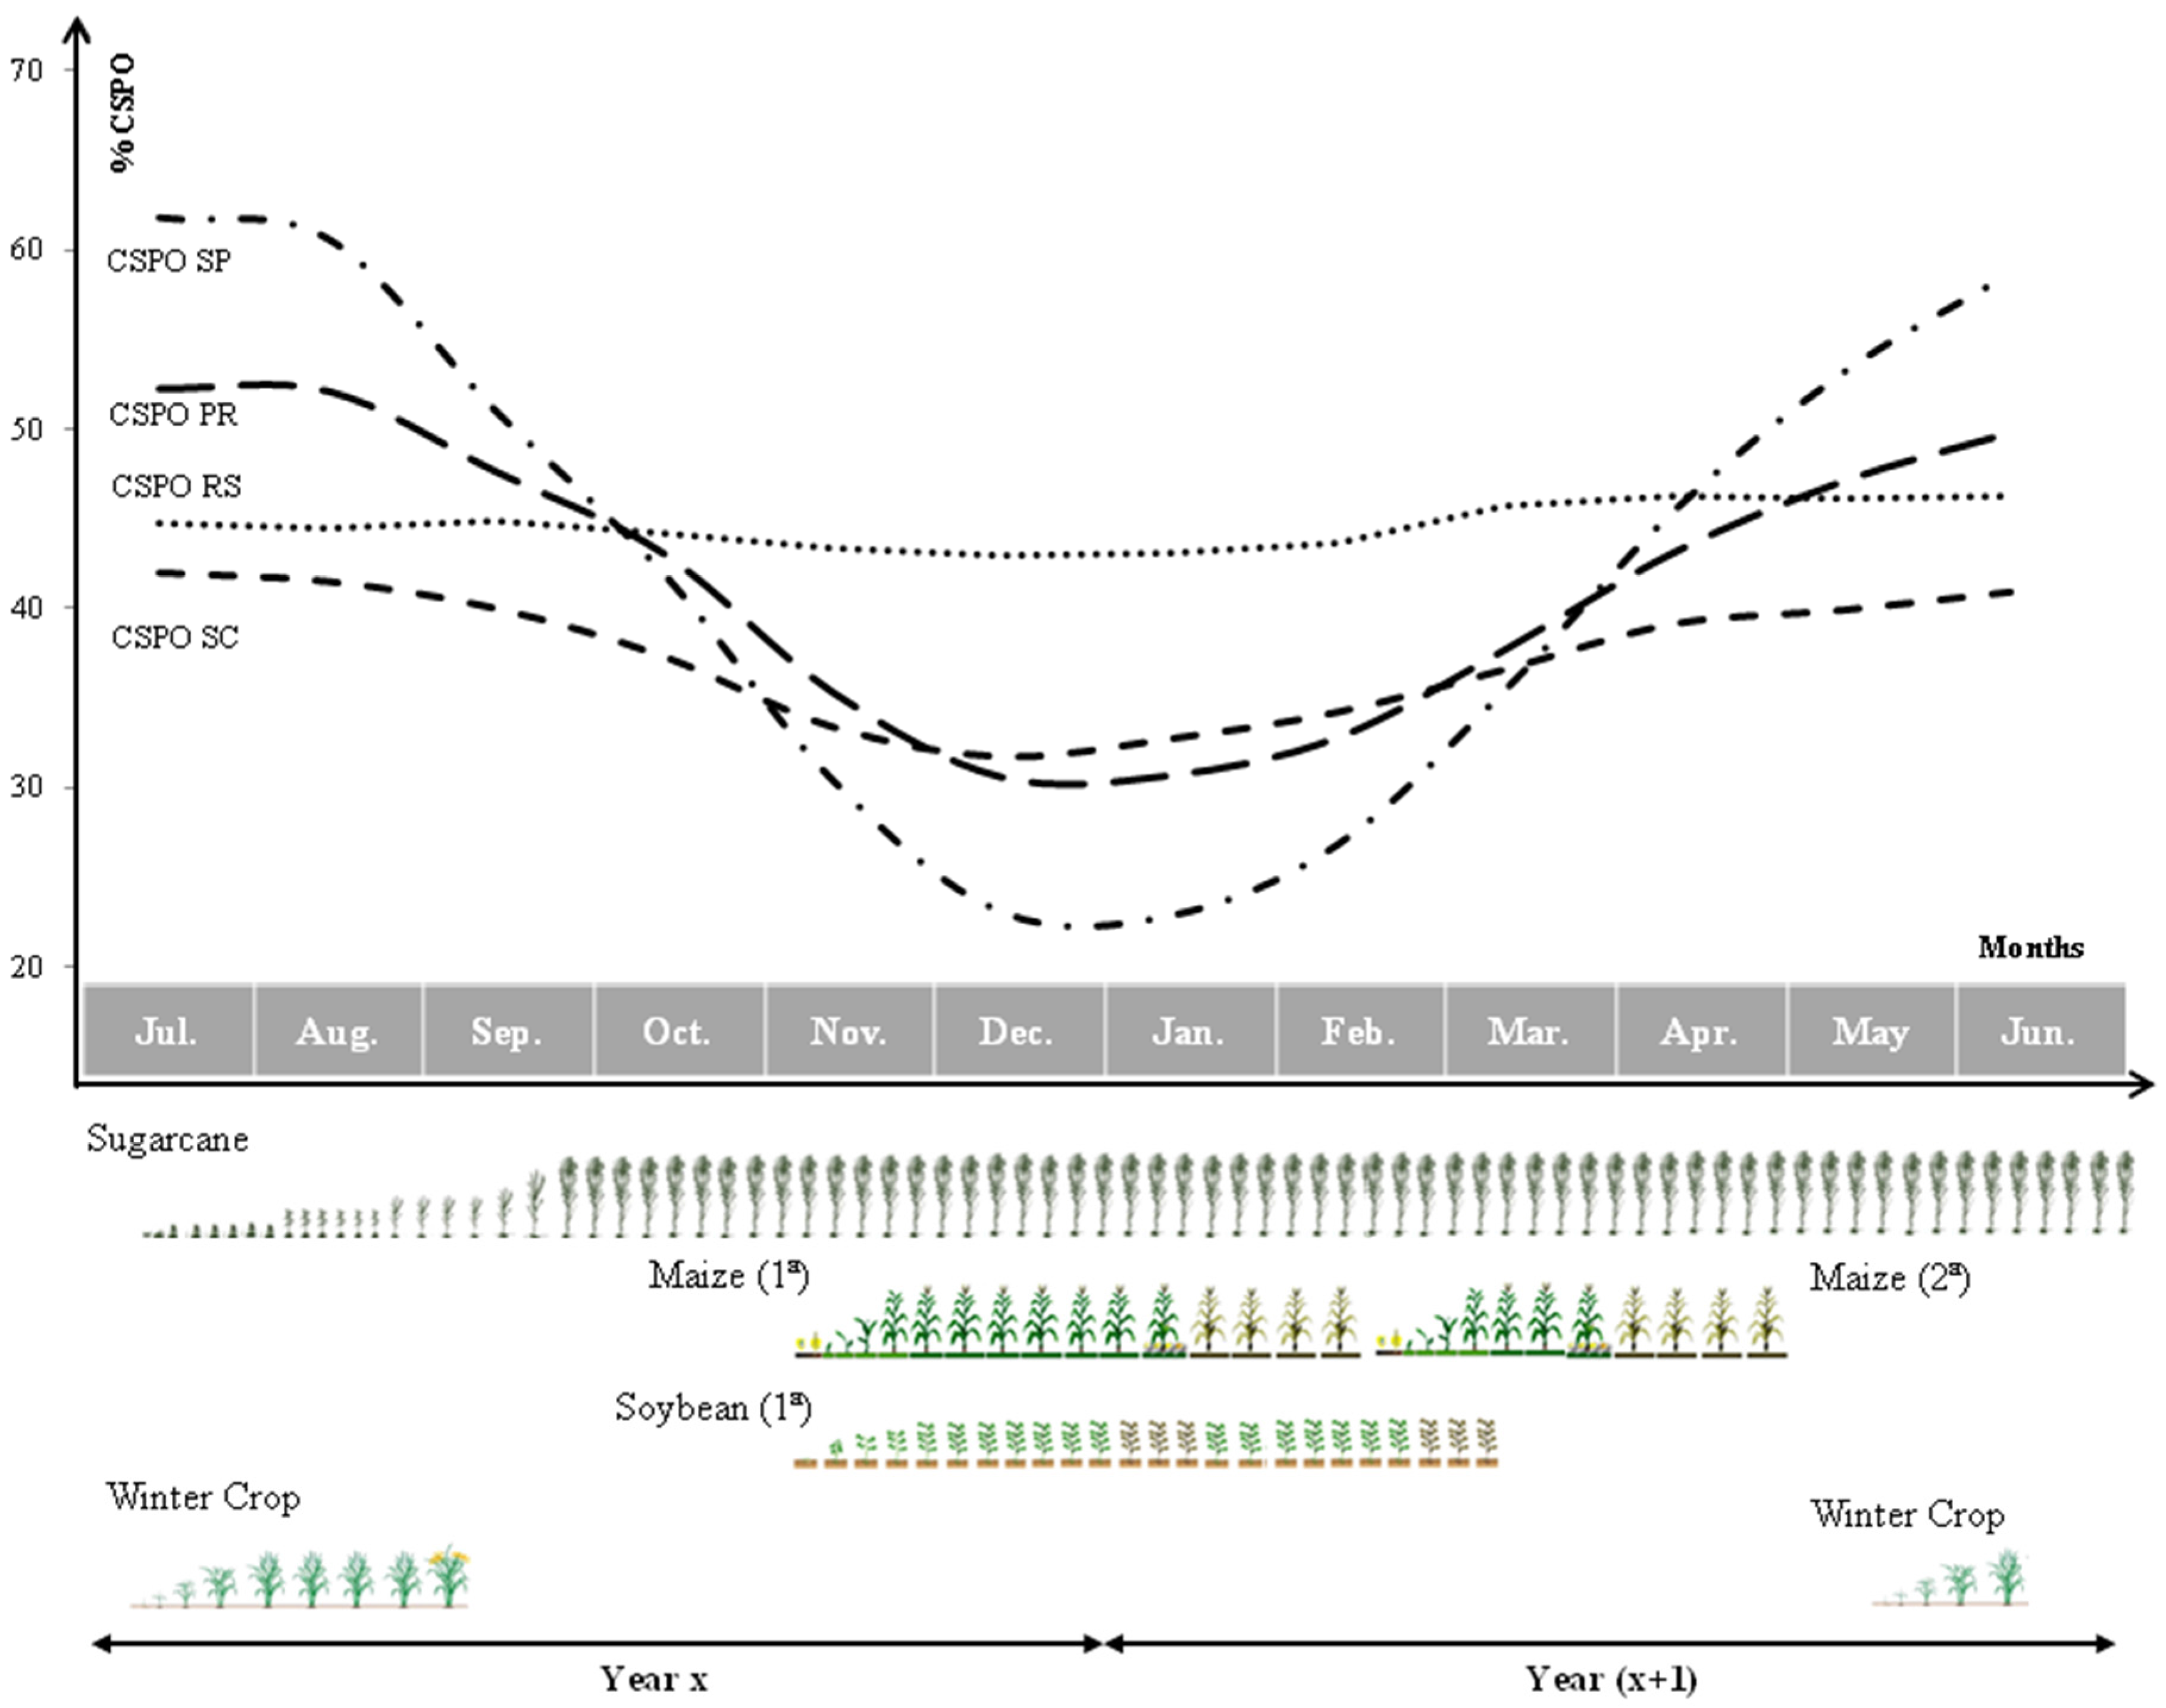
3. Results
4. Discussion
5. Conclusions
Acknowledgments
Author Contributions
Conflicts of Interest
References
- Hermelingmeier, C. The competitive firm and the role of information about uncertain factor prices. Econ. Model. 2010, 27, 547–552. [Google Scholar] [CrossRef]
- The Brazilian Institute of Geography and Statistics (IBGE). LSPA—Levantamento sistemático da produção agrícola; IBGE: Rio de Janeiro, Brazil, 2013. [Google Scholar]
- ISCCP: INT ISCCP D2 Monthly Means and Climatology. Available online: http://isccp.giss.nasa.gov/products/browsed2.html (accessed on 22 February 2016).
- Pino, F.A. Estimação subjetiva de safras agrícolas. Inf. Econ. 2001, 31, 55–58. [Google Scholar]
- Food and Agriculture Organization of the United Nations—Statistics Division. Available online: http://faostat3.fao.org/browse/Q/QC/E (accessed on 10 September 2015).
- Pino, F.A. Estatísticas agrícolas para o século XXI. Agric. São Paulo 1999, 46, 71–105. [Google Scholar]
- Alexandratos, N.; Bruinsma, J. World Agriculture towards 2030/2050: The 2012 Revision; ESA Working Paper No. 12-03; FAO: Rome, Italy, 2012. [Google Scholar]
- USDA Office of the Chief Economist—How the WASDE is Prepared. Available online: http://www.usda.gov/oce/commodity/wasde/prepared.htm (accessed on 10 January 2014).
- EUROSTAT Agriculture—Statistics Illustrated. Available online: http://ec.europa.eu/eurostat/web/agriculture/statistics-illustrated (accessed on 8 February 2016).
- Vogel, F.A.; Bange, G.A. Understanding USDA Crop Forecasts; US Department of Agriculture: Washington, DC, USA, 1999.
- GEOGLAM. Gloabal Argircultural Monitoring: Crop Monitor. Available online: http://www.geoglam-crop-monitor.org/ (accessed on 17 September 2015).
- Whitcraft, A.K.; Becker-Reshef, I.; Justice, C.O. A framework for defining spatially explicit earth observation requirements for a global agricultural monitoring initiative (GEOGLAM). Remote Sens. 2015, 7, 1461–1481. [Google Scholar] [CrossRef]
- Immitzer, M.; Vuolo, F.; Atzberger, C. First experience with sentinel-2 data for crop and tree species classifications in Central Europe. Remote Sens. 2016, 8, 166. [Google Scholar] [CrossRef]
- Rudorff, B.F.T.; Adami, M.; Aguiar, D.A.; Moreira, M.A.; Mello, M.P.; Fabiani, L.; Amaral, D.F.; Pires, B.M. The soy moratorium in the Amazon biome monitored by remote sensing images. Remote Sens. 2011, 3, 185–202. [Google Scholar] [CrossRef]
- Watts, J.D.; Lawrence, R.L.; Miller, P.R.; Montagne, C. Monitoring of cropland practices for carbon sequestration purposes in north central Montana by Landsat remote sensing. Remote Sens. Environ. 2009, 113, 1843–1852. [Google Scholar]
- Congalton, R.G.; Balogh, M.; Bell, C.; Green, K.; Milliken, J.A.; Ottman, R. Mapping and monitoring agricultural crops and other land cover in the lower Colorado River Basin. Photogramm. Eng. Remote Sens. 1998, 64, 1107–1113. [Google Scholar]
- Tatsumi, K.; Yamashiki, Y.; Canales, T.; Taipe, C.L.R. Crop classification of upland fields using random forest of time-series Landsat 7 ETM+ data. Comput. Electron. Agric. 2015, 115, 171–179. [Google Scholar] [CrossRef]
- Inglada, J.; Arias, M.; Tardy, B.; Hagolle, O.; Valero, S.; Morin, D.; Dedieu, G.; Sepulcre, G.; Bontemps, S.; Defourny, P.; et al. Assessment of an operational system for crop type map production using high temporal and spatial resolution satellite optical imagery. Remote Sens. 2015, 7, 12356–12379. [Google Scholar] [CrossRef]
- Rizzi, R.; Rudorff, B.F.T. Estimativa da área de soja no Rio Grande do Sul por meio de imagens Landsat. Rev. Bras. Cartogr. 2005, 57, 226–234. [Google Scholar]
- Badhwar, G.D. Classification of corn and soybeans using multitemporal thematic mapper data. Remote Sens. Environ. 1984, 16, 175–181. [Google Scholar] [CrossRef]
- Schultz, B.; Immitzer, M.; Formaggio, A.R.; Sanches, I.D.A.; Luiz, A.J.B.; Atzberger, C. Self-guided segmentation and classification of multi-temporal Landsat 8 images for crop type mapping in southeastern Brazil. Remote Sens. 2015, 7, 14482–14508. [Google Scholar] [CrossRef]
- Vieira, M.A.; Formaggio, A.R.; Rennó, C.D.; Atzberger, C.; Aguiar, D.A.; Mello, M.P. Object based image analysis and data mining applied to a remotely sensed Landsat time-series to map sugarcane over large areas. Remote Sens. Environ. 2012, 123, 553–562. [Google Scholar] [CrossRef]
- Rudorff, B.F.T.; Aguiar, D.A.; Silva, W.F.; Sugawara, L.M.; Adami, M.; Moreira, M.A. Studies on the rapid expansion of sugarcane for ethanol production in São Paulo State (Brazil) using Landsat data. Remote Sens. 2010, 2, 1057–1076. [Google Scholar] [CrossRef]
- Sanches, I.D.; Epiphanio, J.C.N.; Formaggio, A.R. Culturas agrícolas em imagens multitemporais do satélite Landsat. Agric. São Paulo 2005, 52, 83–96. [Google Scholar]
- Brown, J.C.; Kastens, J.H.; Coutinho, A.C.; de Castro Victoria, D.; Bishop, C.R. Classifying multiyear agricultural land use data from Mato Grosso using time-series MODIS vegetation index data. Remote Sens. Environ. 2013, 130, 39–50. [Google Scholar] [CrossRef]
- MacDonald, R.; Hall, F.; Erb, R. The use of Landsat data in a large area crop inventory experiment (LACIE). In Proceedings of the LARS Symposia, Sioux Falls, SD, USA, 25–29 October 1975.
- Atzberger, C. Advances in remote sensing of agriculture: Context description, existing operational monitoring systems and major information needs. Remote Sens. 2013, 5, 949–981. [Google Scholar] [CrossRef]
- Rembold, F.; Atzberger, C.; Savin, I.; Rojas, O. Using low resolution satellite imagery for yield prediction and yield anomaly detection. Remote Sens. 2013, 5, 1704–1733. [Google Scholar] [CrossRef]
- Kovalskyy, V.; Roy, D.P. The global availability of Landsat 5 TM and Landsat 7 ETM+ land surface observations and implications for global 30 m Landsat data product generation. Remote Sens. Environ. 2013, 130, 280–293. [Google Scholar] [CrossRef]
- Whitcraft, A.K.; Becker-Reshef, I.; Killough, B.D.; Justice, C.O. Meeting earth observation requirements for global agricultural monitoring: An evaluation of the revisit capabilities of current and planned moderate resolution optical earth observing missions. Remote Sens. 2015, 7, 1482–1503. [Google Scholar] [CrossRef]
- Loveland, T.R.; Dwyer, J.L. Landsat: Building a strong future. Remote Sens. Environ. 2012, 122, 22–29. [Google Scholar] [CrossRef]
- Fehr, W.R.; Caviness, C.E. Stages of Soybean Development; Special Report 80; Iowa State University: Ames, Iowa, USA, 1977. [Google Scholar]
- Asner, G.P. Cloud cover in Landsat observations of the Brazilian Amazon. Int. J. Remote Sens. 2001, 22, 3855–3862. [Google Scholar] [CrossRef]
- Sugawara, L.M.; Rudorff, B.F.T.; Adami, M. Viabilidade de uso de imagens do Landsat em mapeamento de área cultivada com soja no Estado do Paraná. Pesqui. Agropecu. Bras. 2008, 43, 1763–1768. [Google Scholar] [CrossRef]
- Luiz, A.J.B.; Formaggio, A.R.; Epiphanio, J.C.N.; Arenas-Toledo, J.M.; Goltz, E.; Brandão, D. Estimativa amostral objetiva de área plantada regional, apoiada em imagens de sensoriamento remoto. Pesqui. Agropecu. Bras. 2012, 47, 1279–1287. [Google Scholar] [CrossRef]
- Gallego, F.J. Crop area estimation in the MARS project. In Proceedings of the Conference on Ten Years of the MARS Project, Brussels, Belgium, 22–23 April 1999.
- Gallego, J.; Bamps, C. Using CORINE land cover and the point survey LUCAS for area estimation. Int. J. Appl. Earth Obs. Geoinformation 2008, 10, 467–475. [Google Scholar] [CrossRef]
- Kleweno, D.D.; Miller, C.E. 1980 AgRISTARS DC/LC Project Summary: Crop Area Estimates for Kansas and Iowa; US Department of Agriculture, Economics and Statistics Service: Washington, DC, USA, 1981.
- Stehman, S.V.; Sohl, T.L.; Loveland, T.R. Statistical sampling to characterize recent United States land-cover change. Remote Sens. Environ. 2003, 86, 517–529. [Google Scholar] [CrossRef]
- Whitcraft, A.K.; Vermote, E.F.; Becker-Reshef, I.; Justice, C.O. Cloud cover throughout the agricultural growing season: Impacts on passive optical earth observations. Remote Sens. Environ. 2015, 156, 438–447. [Google Scholar] [CrossRef]
- Wilson, A.M.; Parmentier, B.; Jetz, W. Systematic land cover bias in Collection 5 MODIS cloud mask and derived products—A global overview. Remote Sens. Environ. 2014, 141, 149–154. [Google Scholar] [CrossRef]
- Ackerman, S.A.; Frey, R.; Strabala, K.; Liu, Y.; Gumley, L.; Baum, B.; Menzel, P. Discriminating Clear-Sky from Cloud with MODIS Algorithm Theoretical Basis Document (MOD35) V6.1; Cooperative Institute for Meteorological Satellite Studies, University of Wisconsin-Madison: Madison, WI, USA, 2010. [Google Scholar]
- Ackerman, S.A.; Holz, R.E.; Frey, R.; Eloranta, E.W.; Maddux, B.C.; McGill, M. Cloud detection with MODIS. Part II: Validation. J. Atmos. Oceanic Technol. 2008, 25, 1073–1086. [Google Scholar] [CrossRef]
- King, M.D.; Platnick, S.; Menzel, W.P.; Ackerman, S.A.; Hubanks, P.A. Spatial and temporal distribution of clouds observed by MODIS onboard the terra and aqua satellites. IEEE Trans. Geosci. Remote Sens. 2013, 51, 3826–3852. [Google Scholar] [CrossRef]
- Stengel, M.; Mieruch, S.; Jerg, M.; Karlsson, K.G.; Scheirer, R.; Maddux, B.; Meirink, J.F.; Poulsen, C.; Siddans, R.; Walther, A.; et al. The clouds climate change initiative: Assessment of state-of-the-art cloud property retrieval schemes applied to AVHRR heritage measurements. Remote Sens. Environ. 2015, 162, 363–379. [Google Scholar] [CrossRef]
- Stubenrauch, C.J.; Rossow, W.B.; Kinne, S.; Ackerman, S.; Cesana, G.; Chepfer, H.; Di Girolamo, L.; Getzewich, B.; Guignard, A.; Heidinger, A.; et al. Assessment of global cloud datasets from satellites: Project and database initiated by the GEWEX radiation panel. Bull. Am. Meteorol. Soc. 2013, 94, 1031–1049. [Google Scholar] [CrossRef]
- The Brazilian Institute of Geography and Statistics (IBGE). Divisão Regional do Brasil em Mesorregiões e Microrregiões e Microrregiões Geográficas; IBGE: Rio de Janeiro, Brazil, 1990. [Google Scholar]
- Inman-Bamber, N.G. Sugarcane water stress criteria for irrigation and drying off. Field Crops Res. 2004, 89, 107–122. [Google Scholar] [CrossRef]
- Hagos, H.; Worku, W.; Takele, A. Effect of drying off period and harvest age on quality and yield of ratoon cane (Saccharium officinarium L.). Adv. Crop Sci. Technol. 2014, 2, 1–5. [Google Scholar]
- Schultz, B.; Immitzer, M.; Formaggio, A.R.; Atzberger, C. Object-based crop classification using multitemporal OLI imagery and chain classification with random forest. In Proceedings of the XVII SBSR Brazilian Symposium on remote Sensing, João Pessoa-PB, Brasil, 27–29 May 2015; pp. 3059–3066.
- Land Processes Distributed Active Archive Center (LPDAAC). MODIS Reprojection Tool Swath User Manual Release 2.2; USGS Earth Resources Observation and Science Center (EROS): Sioux Falls, SD, USA, 2010. [Google Scholar]
- R Core Team. R: A Language and Environment for Statistical Computing; R Foundation for Statistical Computing: Vienna, Austria, 2014. [Google Scholar]
- Matzke, N.J. Modiscloud: An R Package for processing MODIS Level 2 Cloud Mask products. The incidence and implications of clouds for cloud forest plant water relations. Ecol. Lett. 2013, 16, 307–314. [Google Scholar]
- Raster: Geographic Data Analysis and Modeling. Available online: http://cran.univ-lyon1.fr/web/packages/raster/ (accessed on 4 March 2016).
- Massey, F.J. The Kolmogorov-Smirnov Test for goodness of fit. J. Am. Stat. Assoc. 1951, 46, 68–78. [Google Scholar] [CrossRef]
- Fritz, S.; See, L.; McCallum, I.; You, L.; Bun, A.; Moltchanova, E.; Duerauer, M.; Albrecht, F.; Schill, C.; Perger, C.; et al. Mapping global cropland and field size. Glob. Chang. Biol. 2015, 21, 1980–1992. [Google Scholar] [CrossRef] [PubMed]
- Sano, E.E.; Ferreira, L.G.; Asner, G.P.; Steinke, E.T. Spatial and temporal probabilities of obtaining cloud-free Landsat images over the Brazilian tropical savanna. Int. J. Remote Sens. 2007, 28, 2739–2752. [Google Scholar] [CrossRef]
- The Brazilian Institute of Geography and Statistics (IBGE). Sistema IBGE de Recuperação Automática. Available online: http://www.sidra.ibge.gov.br (accessed on 8 March 2015).
- Luiz, A.J.B.; Schultz, B.; Trabaquini, K.; Eberhardt, I.D.R.; Formaggio, A.R. Método para estratificação em levantamentos agrícolas com mais de uma variável; Embrapa Meio Ambiente, Embrapa: Jaguariúna, Brazil, 2015. [Google Scholar]
- Schultz, B.; Formaggio, A.R.; Eberhardt, I.D.R.; Sanches, I.D.A.; Oliveira, J.C.; Luiz, A.J.B. Classificação orientada a objetos em imagens multitemporias Landsat aplicada na identificação de cana-de-açúcar e soja. Rev. Bras. Cartogr. 2016, in press. [Google Scholar]
- Grzegozewski, D.M.; Johann, J.A.; Uribe-Opazo, M.A.; Mercante, E.; Coutinho, A.C. Mapping soya bean and corn crops in the State of Paraná, Brazil, using EVI images from the MODIS sensor. Int. J. Remote Sens. 2016, 37, 1257–1275. [Google Scholar] [CrossRef]
- Arvor, D.; Jonathan, M.; Meirelles, M.S.P.; Dubreuil, V.; Durieux, L. Classification of MODIS EVI time series for crop mapping in the state of Mato Grosso, Brazil. Int. J. Remote Sens. 2011, 32, 7847–7871. [Google Scholar] [CrossRef]
- Mello, M.P.; Vieira, C.A.O.; Rudorff, B.F.T.; Aplin, P.; Santos, R.D.C.; Aguiar, D.A. STARS: A new method for multitemporal remote sensing. IEEE Trans. Geosci. Remote Sens. 2013, 51, 1897–1913. [Google Scholar] [CrossRef]
- Vuolo, F.; Ng, W.T.; Atzberger, C. Innovative approach for smoothing and gap-filling of high resolution multi-spectral time series: Example of Landsat data. Remote Sens. Environ. 2016. under review. [Google Scholar]
- Adami, M.; Rizzi, R.; Moreira, M.A.; Rudorff, B.F.T.; Ferreira, C.C. Amostragem probabilística estratificada por pontos para estimar a área cultivada com soja. Pesqui. Agropecu. Bras. 2010, 45, 585–592. [Google Scholar] [CrossRef]
- Ban, Y. Synergy of multitemporal ERS-1 SAR and Landsat TM data for classification of agricultural crops. Can. J. Remote Sens. 2003, 29, 518–526. [Google Scholar] [CrossRef]
- Larrañaga, A.; Álvarez-Mozos, J.; Albizua, L. Crop classification in rain-fed and irrigated agricultural areas using Landsat TM and ALOS/PALSAR data. Can. J. Remote Sens. 2011, 37, 157–170. [Google Scholar] [CrossRef]
- Moran, M.S.; Hymer, D.C.; Qi, J.; Kerr, Y. Comparison of ERS-2 SAR and Landsat TM imagery for monitoring agricultural crop and soil conditions. Remote Sens. Environ. 2002, 79, 243–252. [Google Scholar] [CrossRef]


| State | ||||
|---|---|---|---|---|
| São Paulo (SP) | Paraná (PR) | Santa Catarina (SC) | Rio Grande do Sul | |
| Winter crops | + | + | + | + |
| Summer crops | - | - | o | + |
| Sugarcane | o | n.a. | n.a. | n.a. |
© 2016 by the authors; licensee MDPI, Basel, Switzerland. This article is an open access article distributed under the terms and conditions of the Creative Commons by Attribution (CC-BY) license (http://creativecommons.org/licenses/by/4.0/).
Share and Cite
Eberhardt, I.D.R.; Schultz, B.; Rizzi, R.; Sanches, I.D.; Formaggio, A.R.; Atzberger, C.; Mello, M.P.; Immitzer, M.; Trabaquini, K.; Foschiera, W.; et al. Cloud Cover Assessment for Operational Crop Monitoring Systems in Tropical Areas. Remote Sens. 2016, 8, 219. https://doi.org/10.3390/rs8030219
Eberhardt IDR, Schultz B, Rizzi R, Sanches ID, Formaggio AR, Atzberger C, Mello MP, Immitzer M, Trabaquini K, Foschiera W, et al. Cloud Cover Assessment for Operational Crop Monitoring Systems in Tropical Areas. Remote Sensing. 2016; 8(3):219. https://doi.org/10.3390/rs8030219
Chicago/Turabian StyleEberhardt, Isaque Daniel Rocha, Bruno Schultz, Rodrigo Rizzi, Ieda Del’Arco Sanches, Antonio Roberto Formaggio, Clement Atzberger, Marcio Pupin Mello, Markus Immitzer, Kleber Trabaquini, William Foschiera, and et al. 2016. "Cloud Cover Assessment for Operational Crop Monitoring Systems in Tropical Areas" Remote Sensing 8, no. 3: 219. https://doi.org/10.3390/rs8030219
APA StyleEberhardt, I. D. R., Schultz, B., Rizzi, R., Sanches, I. D., Formaggio, A. R., Atzberger, C., Mello, M. P., Immitzer, M., Trabaquini, K., Foschiera, W., & José Barreto Luiz, A. (2016). Cloud Cover Assessment for Operational Crop Monitoring Systems in Tropical Areas. Remote Sensing, 8(3), 219. https://doi.org/10.3390/rs8030219