Understanding the Spatial Temporal Vegetation Dynamics in Rwanda
Abstract
:1. Introduction
2. Materials and Methods
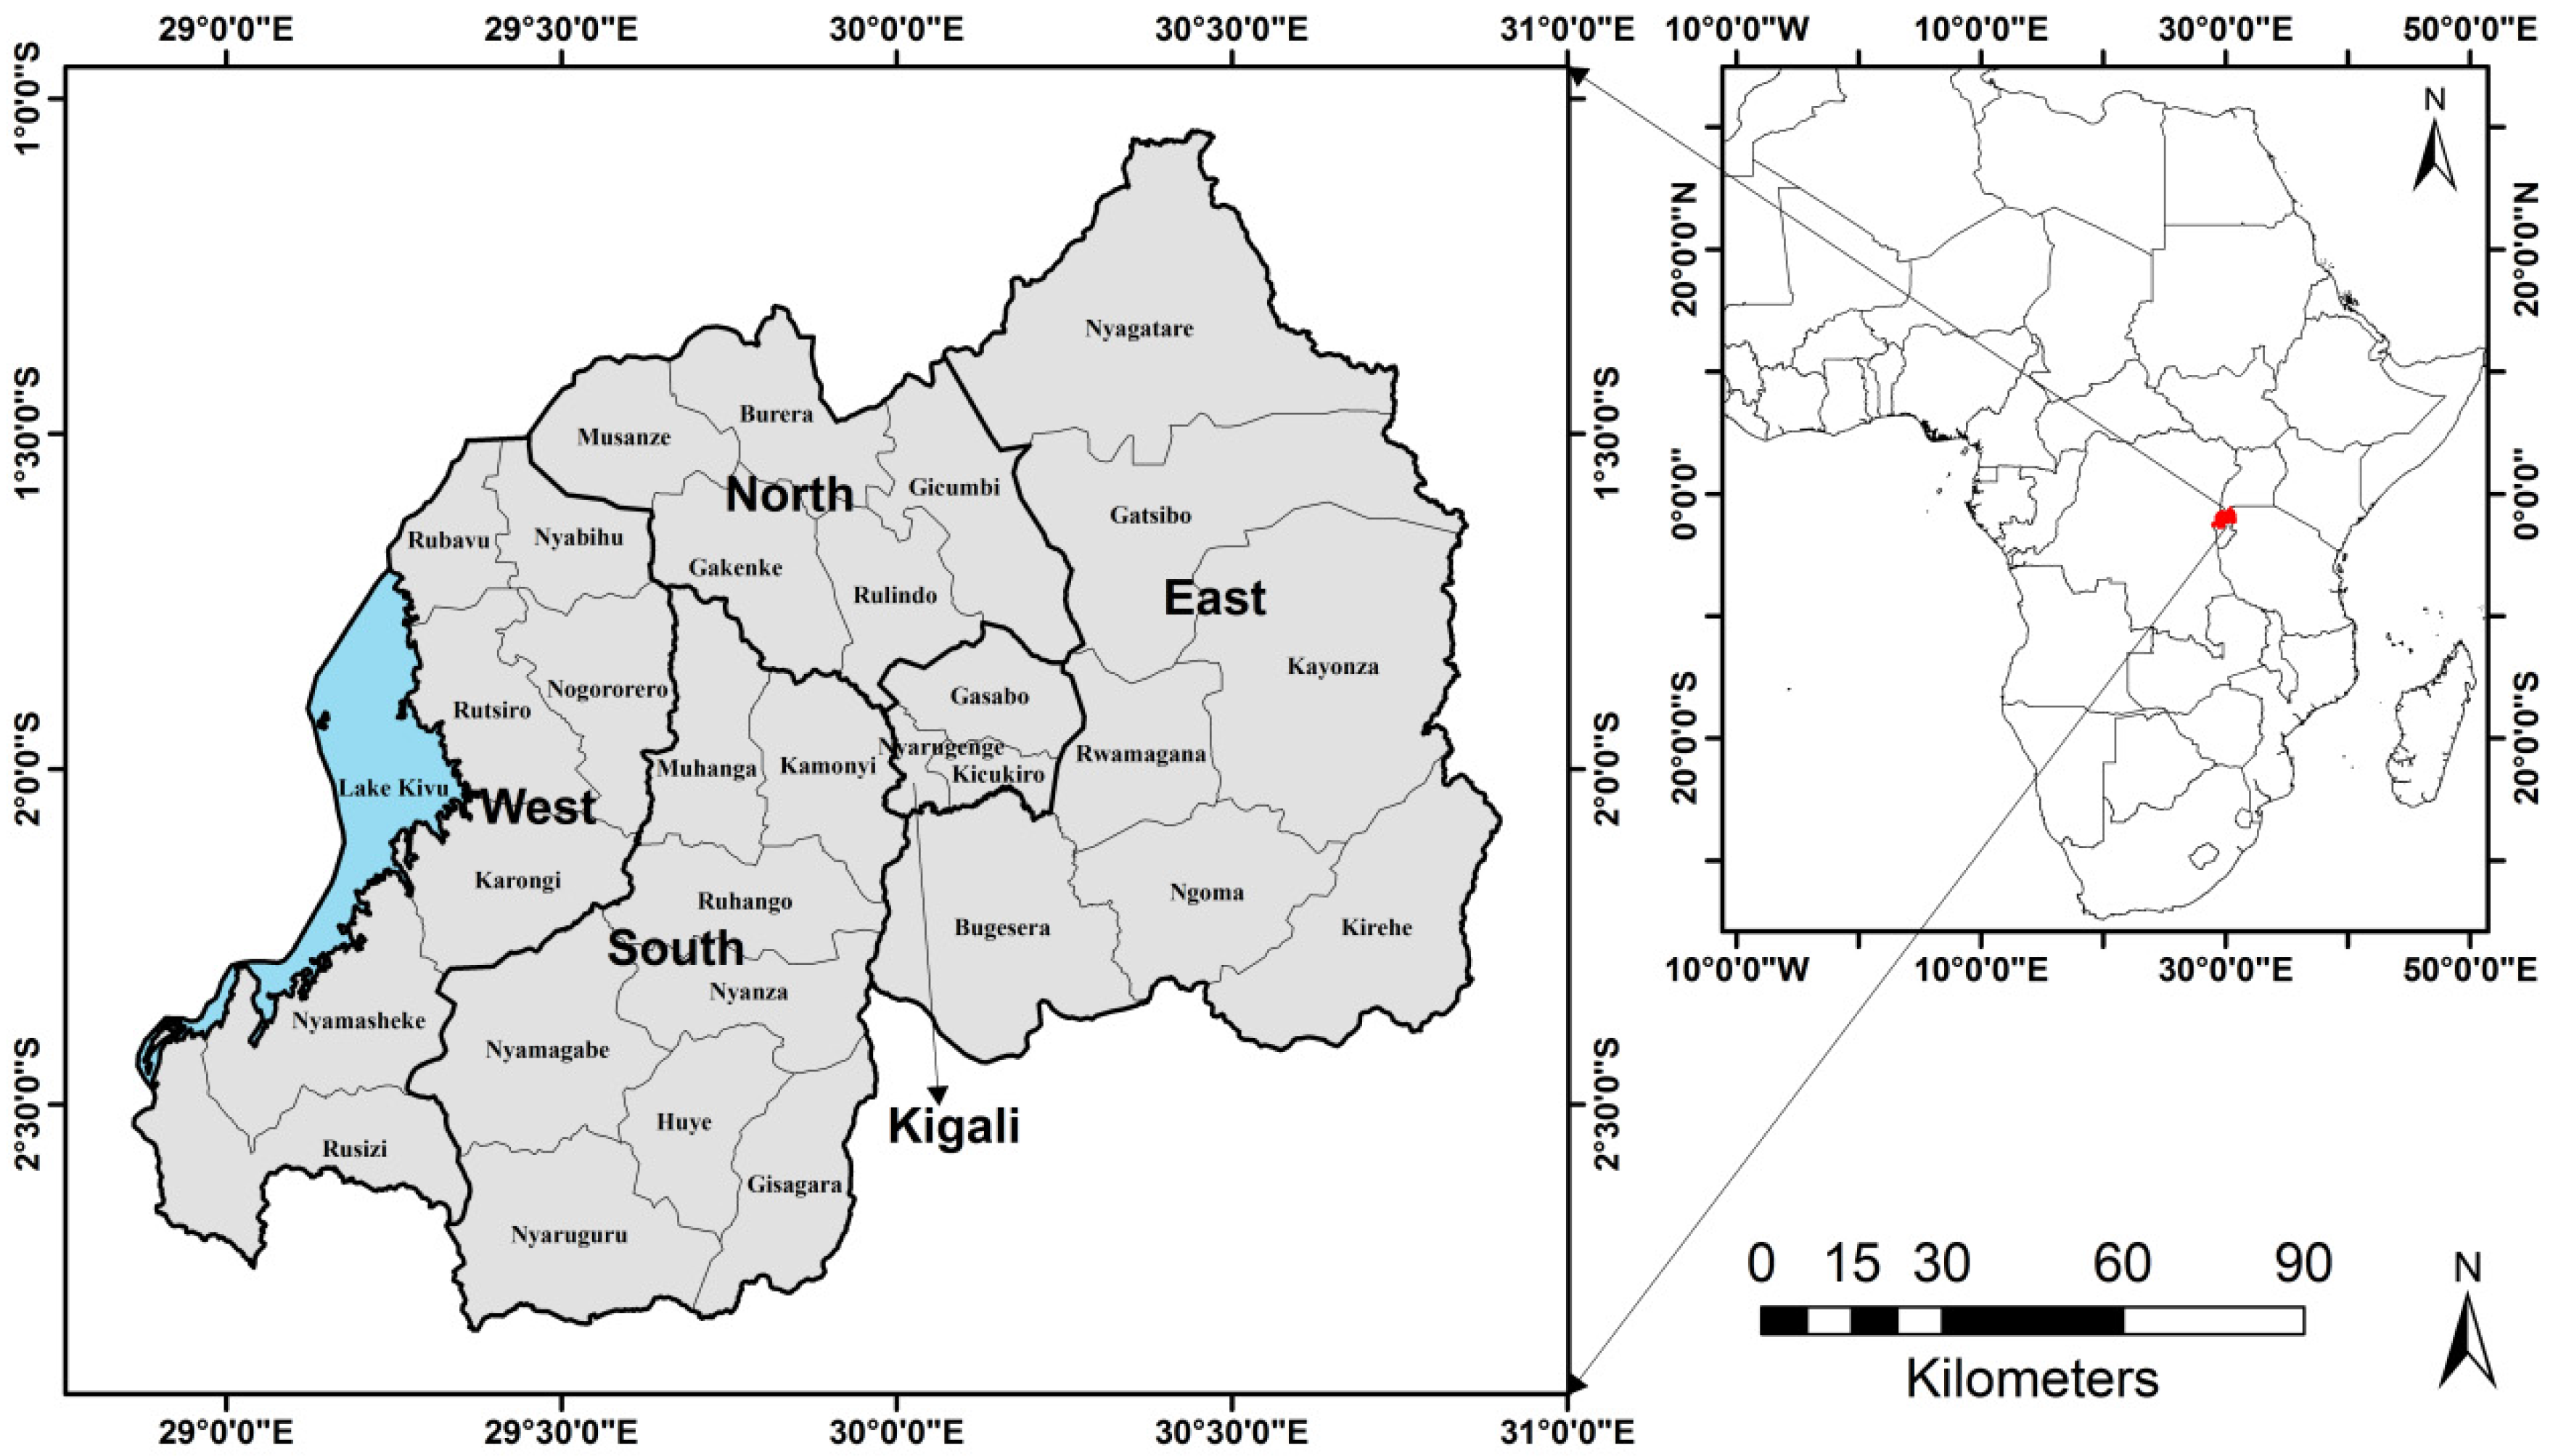
2.1. Study Area
2.2. Datasets
2.3. Methodology
2.3.1. Data Processing
2.3.2. Linear Regression Analysis
2.3.3. Rescaled Range Analysis Method (Hurst Exponent Index)
- (a)
- Divide the time series into subseries , and for each series t = 1, … …,
- (b)
- Define the sequence of time series,
- (c)
- Calculate the accumulated deviation
- (d)
- Create the range sequence
- (e)
- Create the standard deviation sequence
- (f)
- Calculate the Hurst exponent,
3. Results
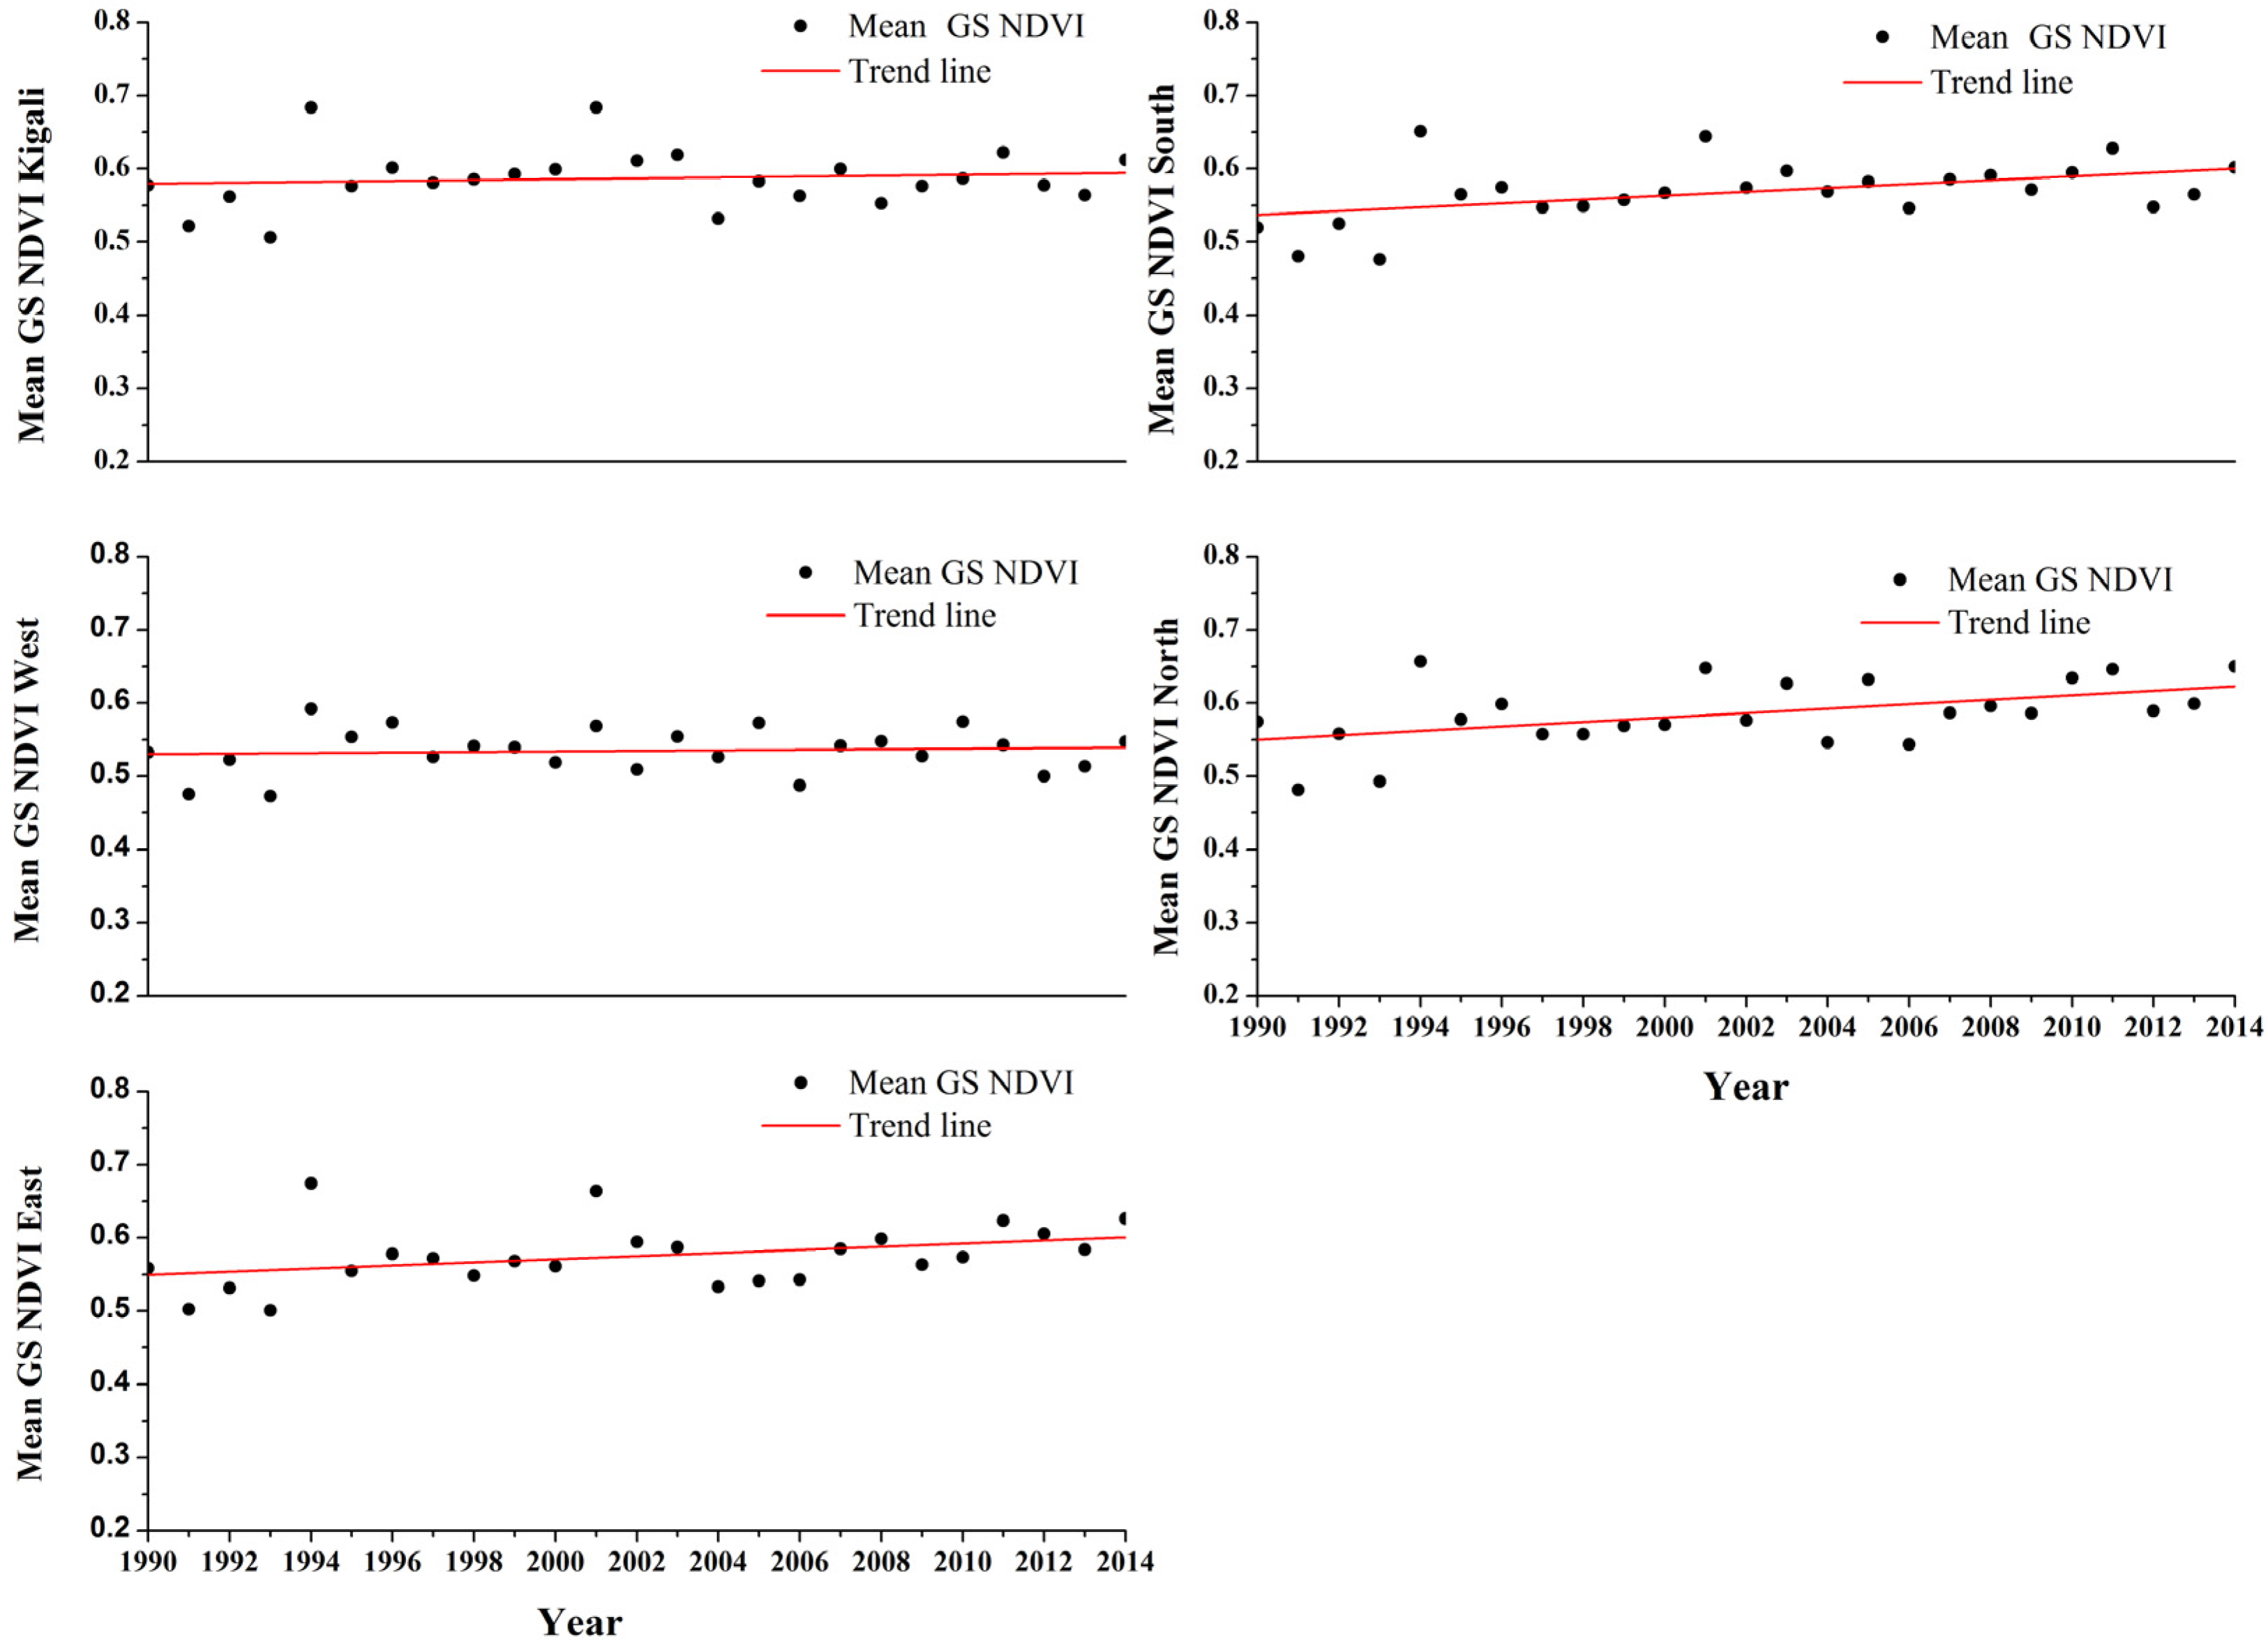
3.1. Statistical Analysis of Vegetation Normalized Difference Vegetation Index (NDVI) Evolution from 1990 to 2014
3.2. Statistical Analysis of the Monthly Mean NDVI throughout the Growing Season
| Kigali | Southern | Western | Northern | Eastern | |
|---|---|---|---|---|---|
| (a) Monthly Mean Growing Season NDVI in 1990 | |||||
| September | 0.4597 | 0.4514 | 0.4761 | 0.4746 | 0.4395 |
| September | 0.5004 | 0.4696 | 0.4869 | 0.5017 | 0.4887 |
| October | 0.5684 | 0.5198 | 0.5522 | 0.5754 | 0.5530 |
| October | 0.5029 | 0.4725 | 0.4980 | 0.5205 | 0.4834 |
| November | 0.6448 | 0.5593 | 0.5641 | 0.6476 | 0.6383 |
| November | 0.6063 | 0.5258 | 0.5469 | 0.5960 | 0.5811 |
| December | 0.6797 | 0.5979 | 0.5764 | 0.6439 | 0.6667 |
| (b) Monthly Mean Growing Season NDVI in 2014 | |||||
| September | 0.5102 | 0.531 | 0.5073 | 0.5834 | 0.5392 |
| September | 0.5521 | 0.5921 | 0.5168 | 0.6056 | 0.5681 |
| October | 0.6025 | 0.5740 | 0.5199 | 0.6264 | 0.5966 |
| October | 0.6537 | 0.5832 | 0.5072 | 0.6536 | 0.6586 |
| November | 0.6483 | 0.6049 | 0.5557 | 0.6717 | 0.6708 |
| November | 0.6162 | 0.6422 | 0.6099 | 0.6896 | 0.6590 |
| December | 0.5994 | 0.6271 | 0.5809 | 0.6687 | 0.6358 |
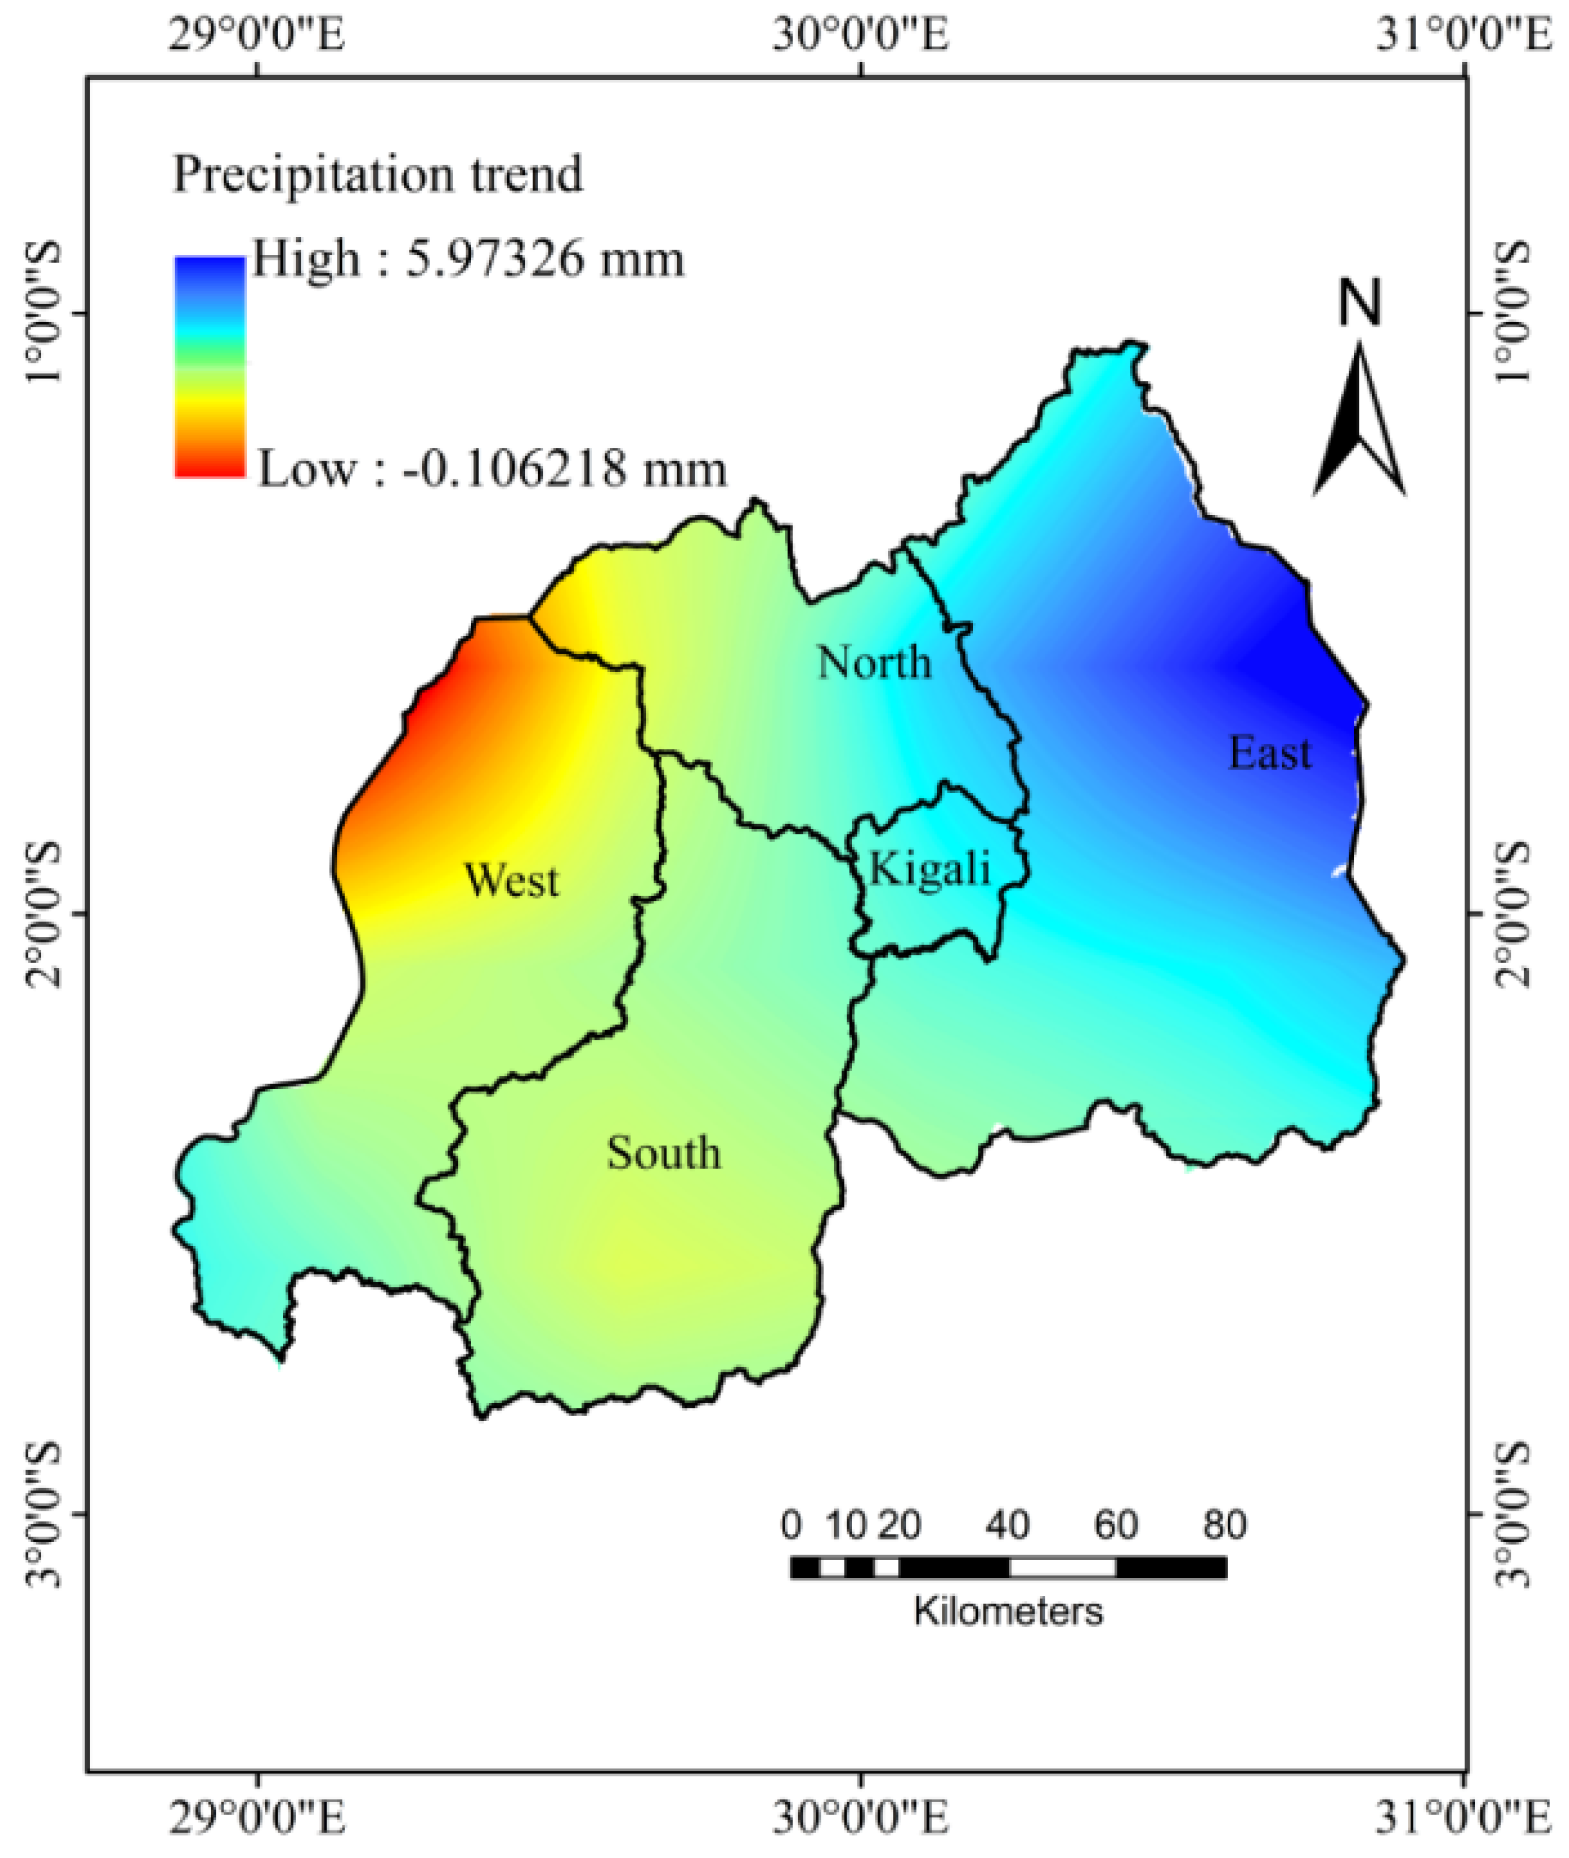
3.3. Investigating on the Rainfall Dynamics through Time Series
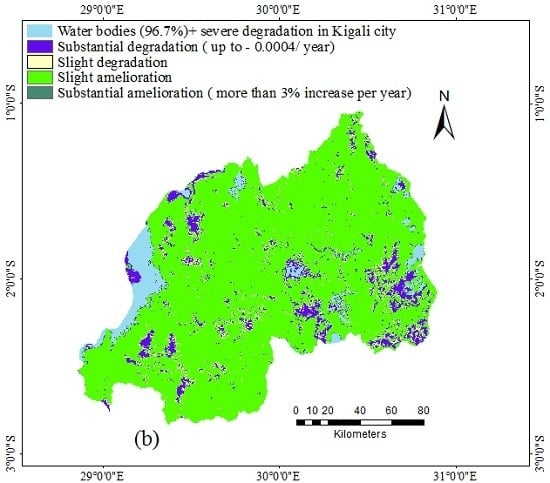
3.4. Analysis of Vegetation Trend Dynamics

| SNDVI | Variation Type | Area Percentage (%) | |
|---|---|---|---|
| ≥0.03 | Substantial amelioration | 1.2 | 81.3 |
| 0.0004–0.03 | Slight amelioration | 80.1 | |
| −0.0004–0.0004 | Substantial degradation | 6.6 | 14.1 |
| −0.006–(−0.0004) | Slight degradation | 7.5 | |
| ≤−0.006 | Lakes + severe degradation in Kigali | 4.6 | 4.6 |
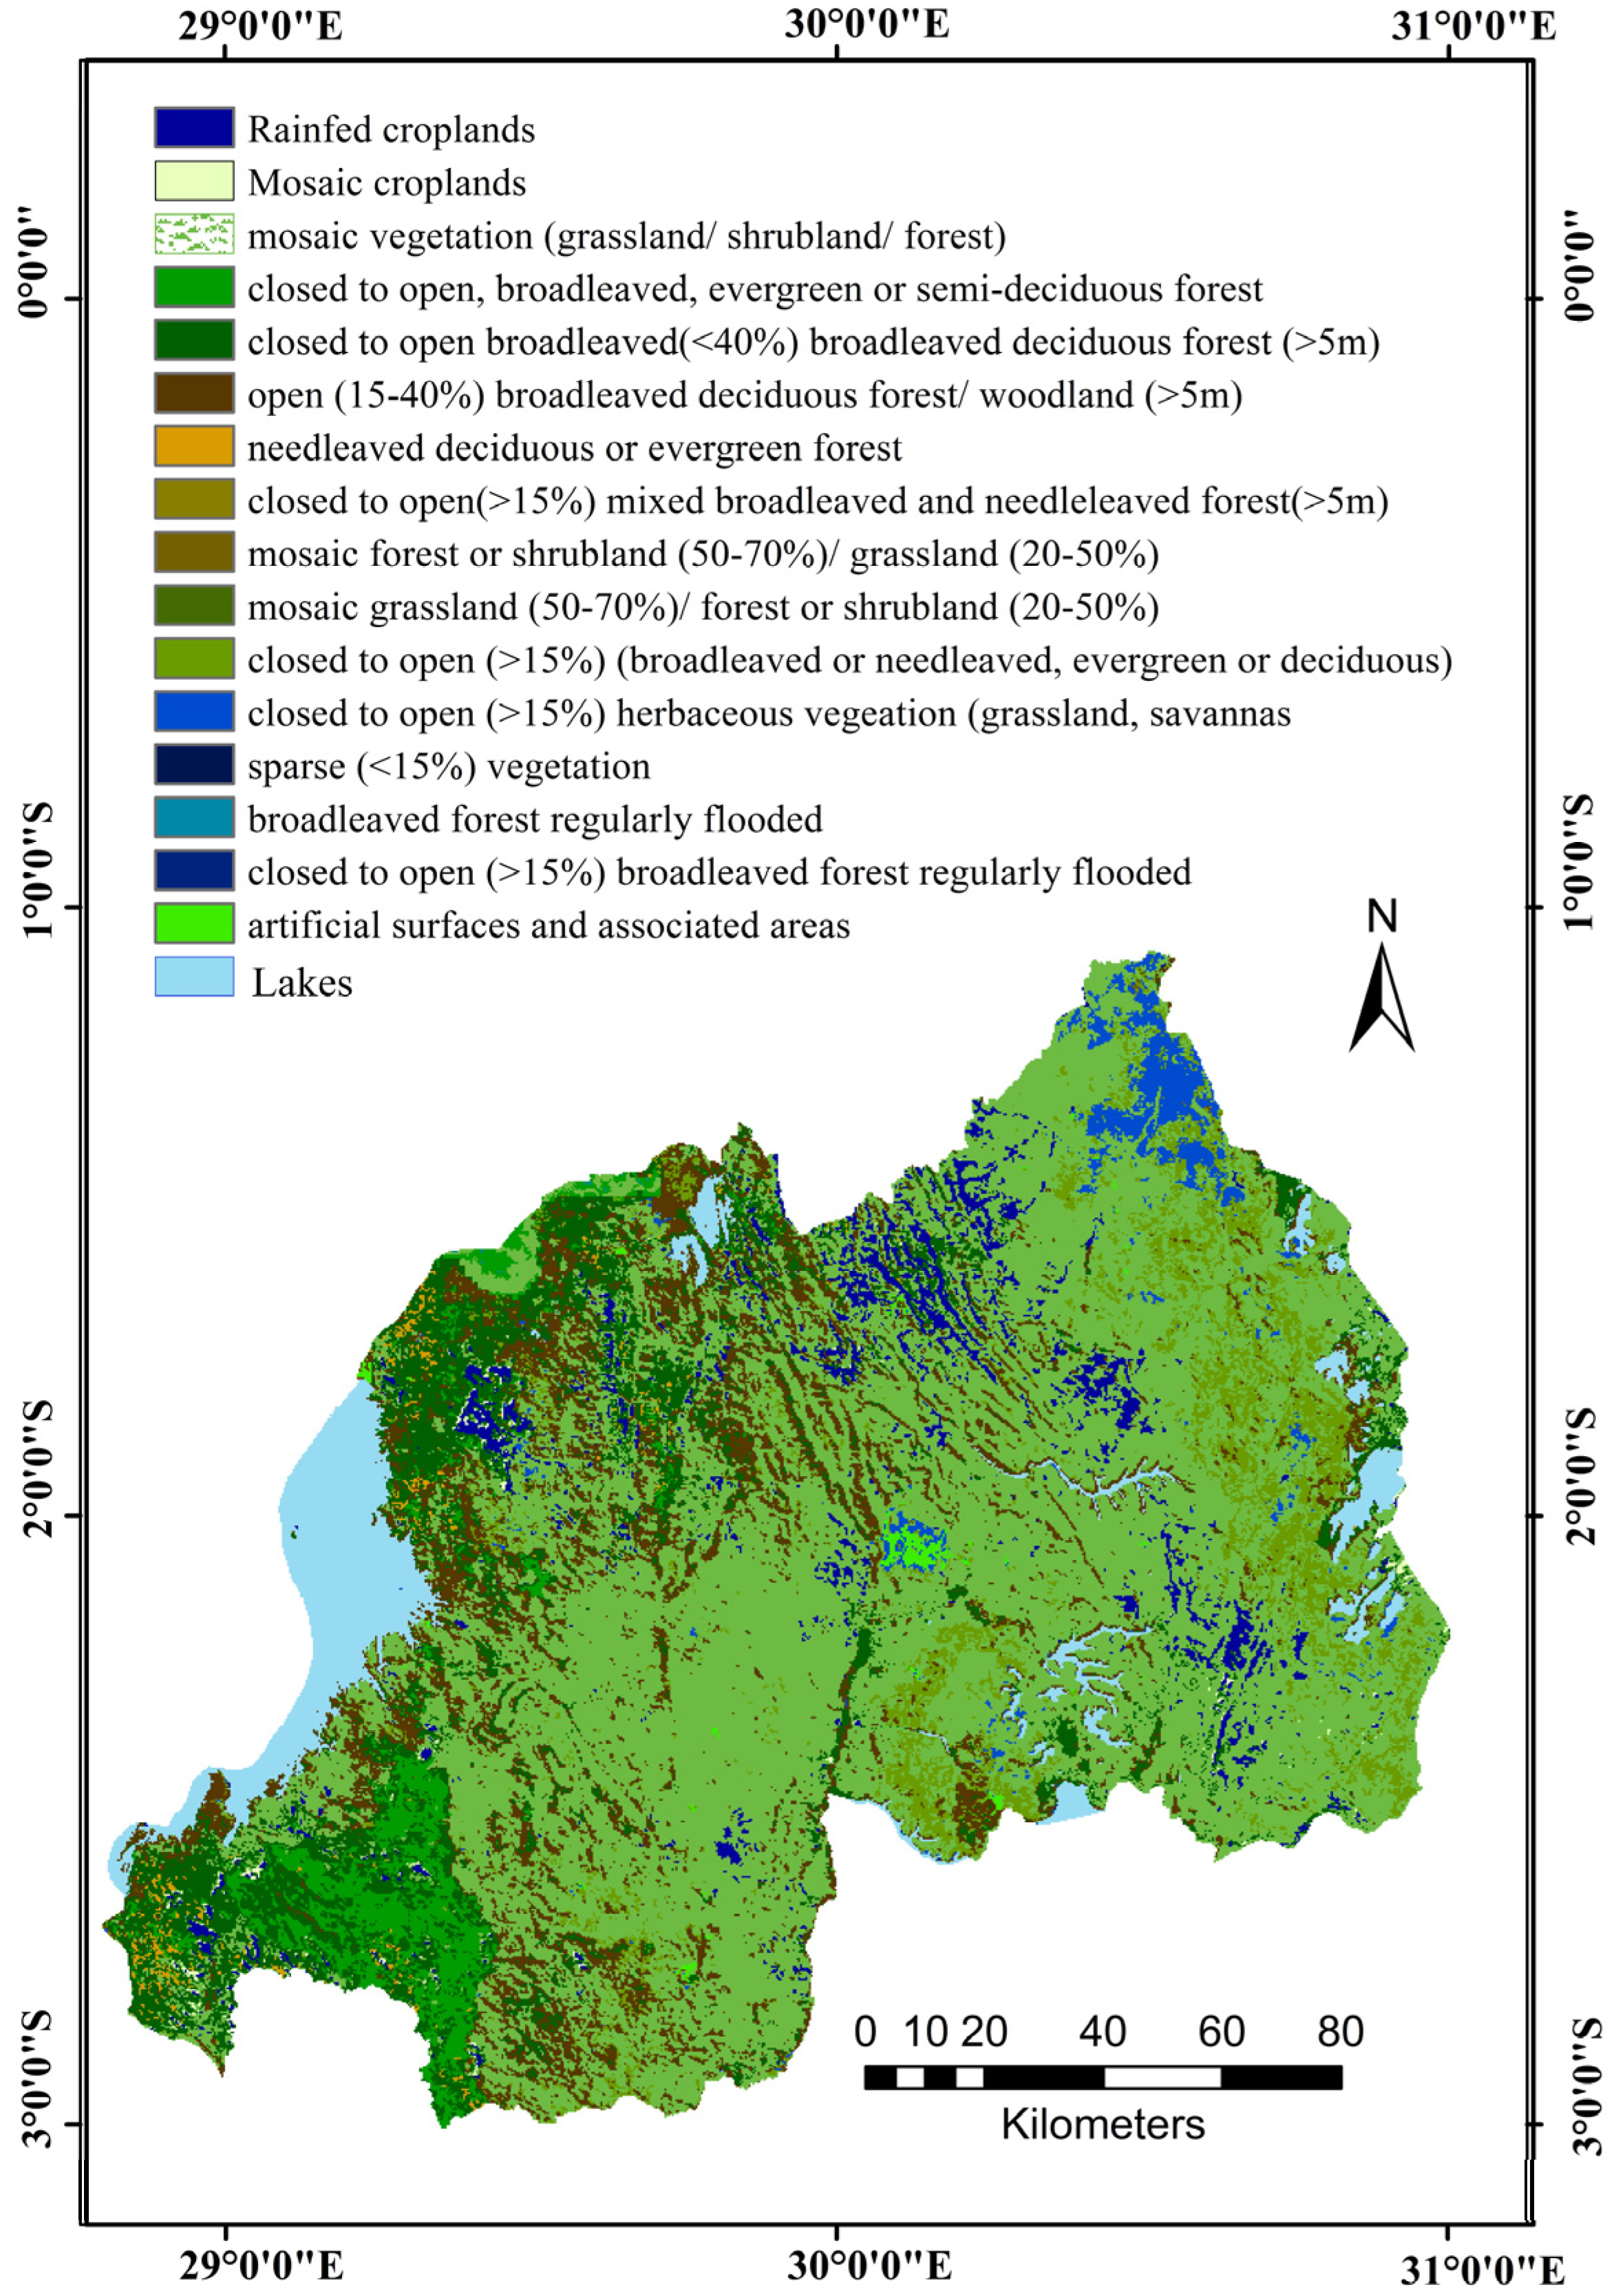
3.5. Change Status per Vegetation Type
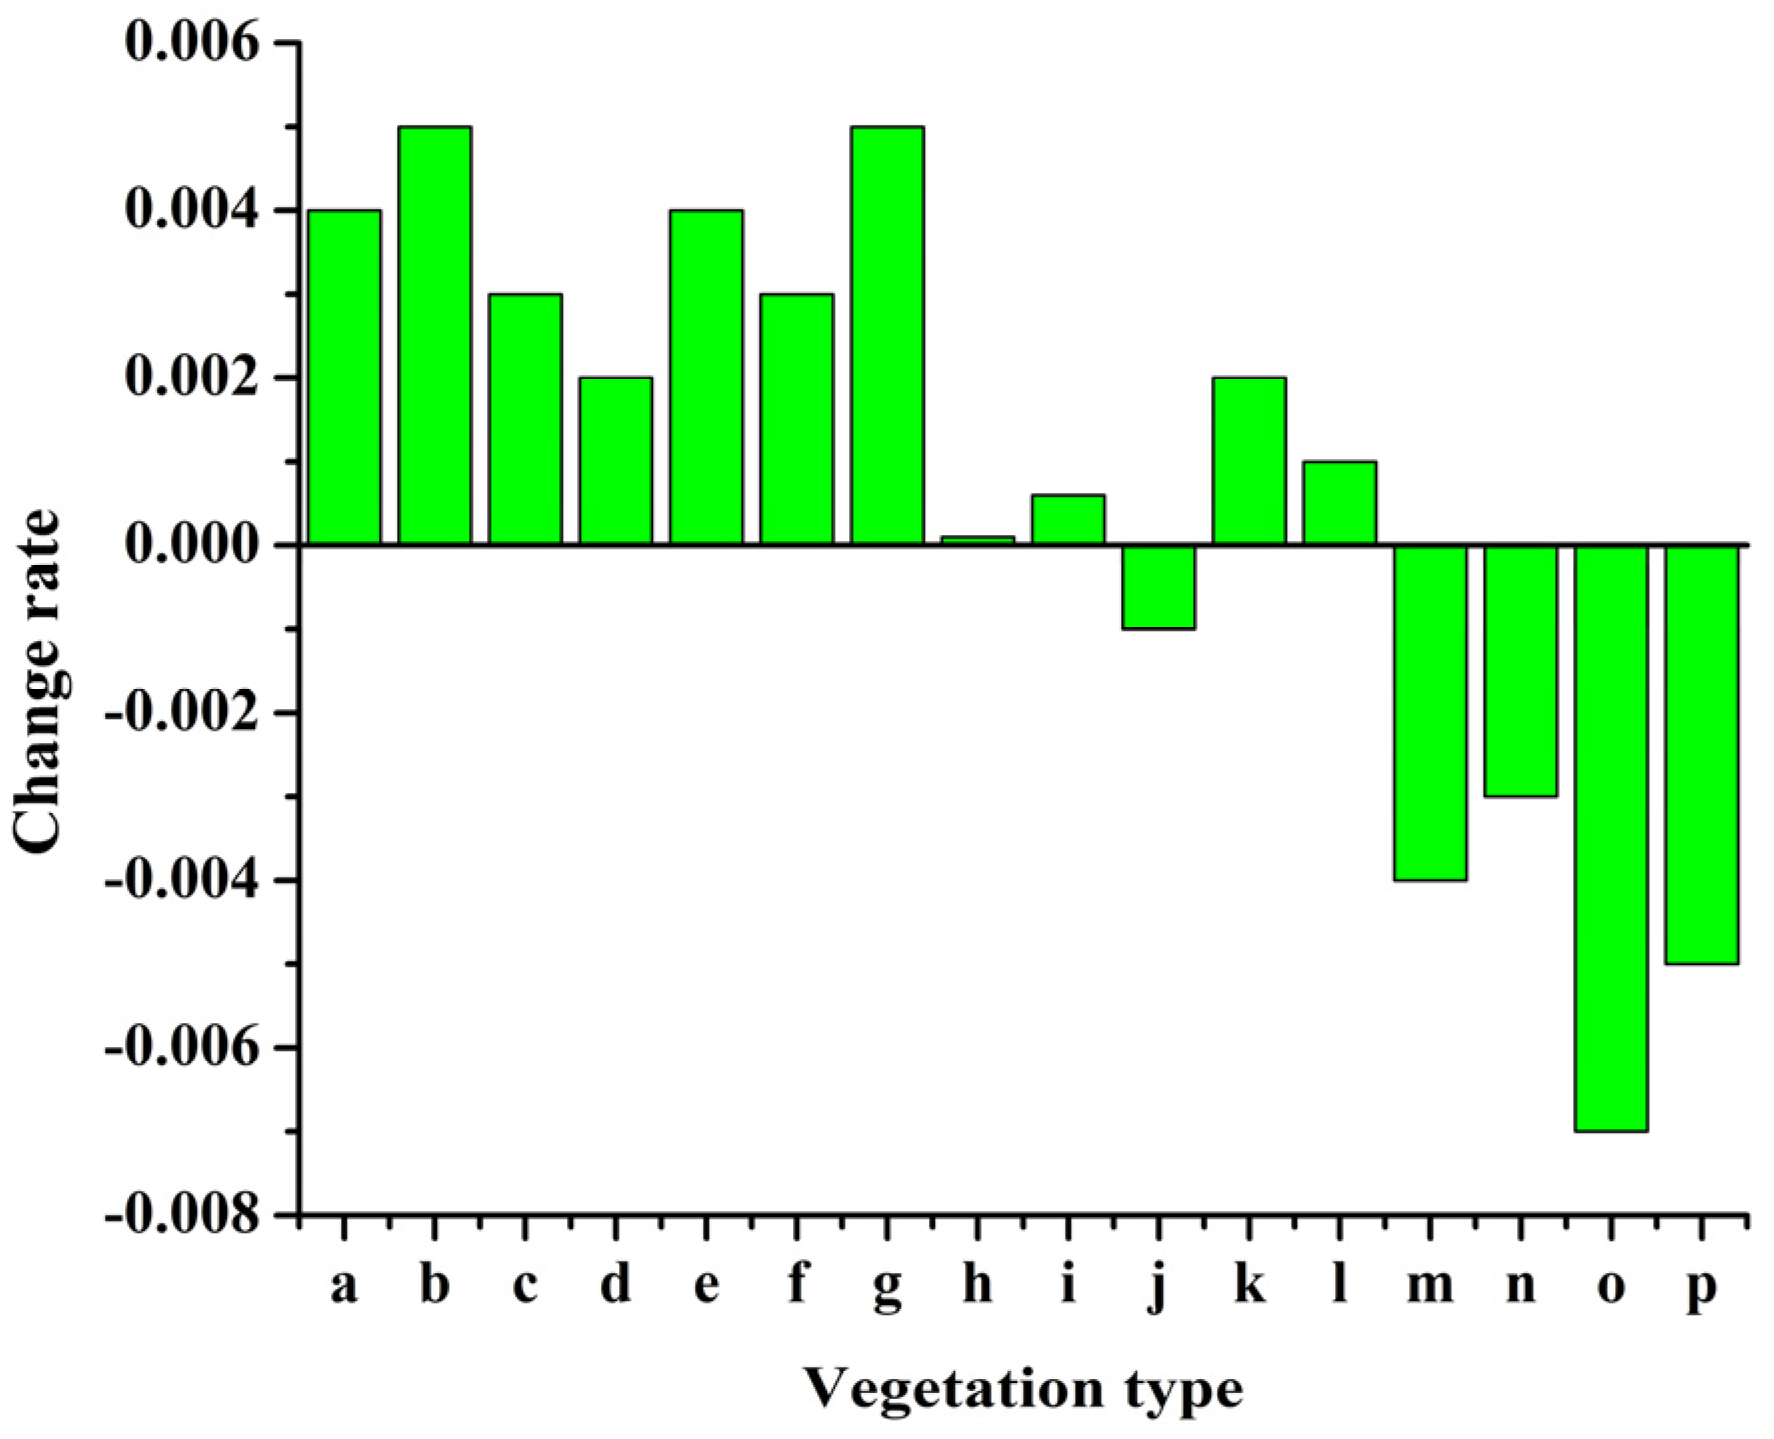
- a: Rainfed croplands
- b: Mosaic cropland (50%–70%)/vegetation (grassland/shrubland/forest) (20%–50%)
- c: Mosaic vegetation (grassland/shrubland/forest) (50%–70%)/cropland (20%–50%)
- d: Closed to open (>15%) broadleaved evergreen or semi-deciduous forest (>5 m)
- e: Closed (>40%) broadleaved deciduous forest (>5 m)
- f: Open (15%–40%) broadleaved deciduous forest/woodland (>5 m)
- g: Open (15%–40%) needleleaved deciduous or evergreen forest (>5 m)
- h: Closed to open (>15%) mixed broadleaved and needleleaved forest (>5 m)
- i: Mosaic forest or shrubland (50%–70%)/grassland (20%–50%)
- j: Mosaic grassland (50%–70%)/forest or shrubland (20%–50%)
- k: Closed to open (>15%) (broadleaved or needleleaved, evergreen or deciduous) shrubland (<5 m)
- l: Closed to open (>15%) herbaceous vegetation (grassland, savannas or lichens/mosses)
- m: Sparse (<15%) vegetation
- n: Closed to open (>15%) broadleaved forest regularly flooded (semi-permanently or temporarily)—Fresh or brackish water
- o: Closed to open (>15%) grassland or woody vegetation on regularly flooded or waterlogged soil—Fresh, brackish or saline water
- p: Artificial surfaces and associated areas (Urban areas >50%)
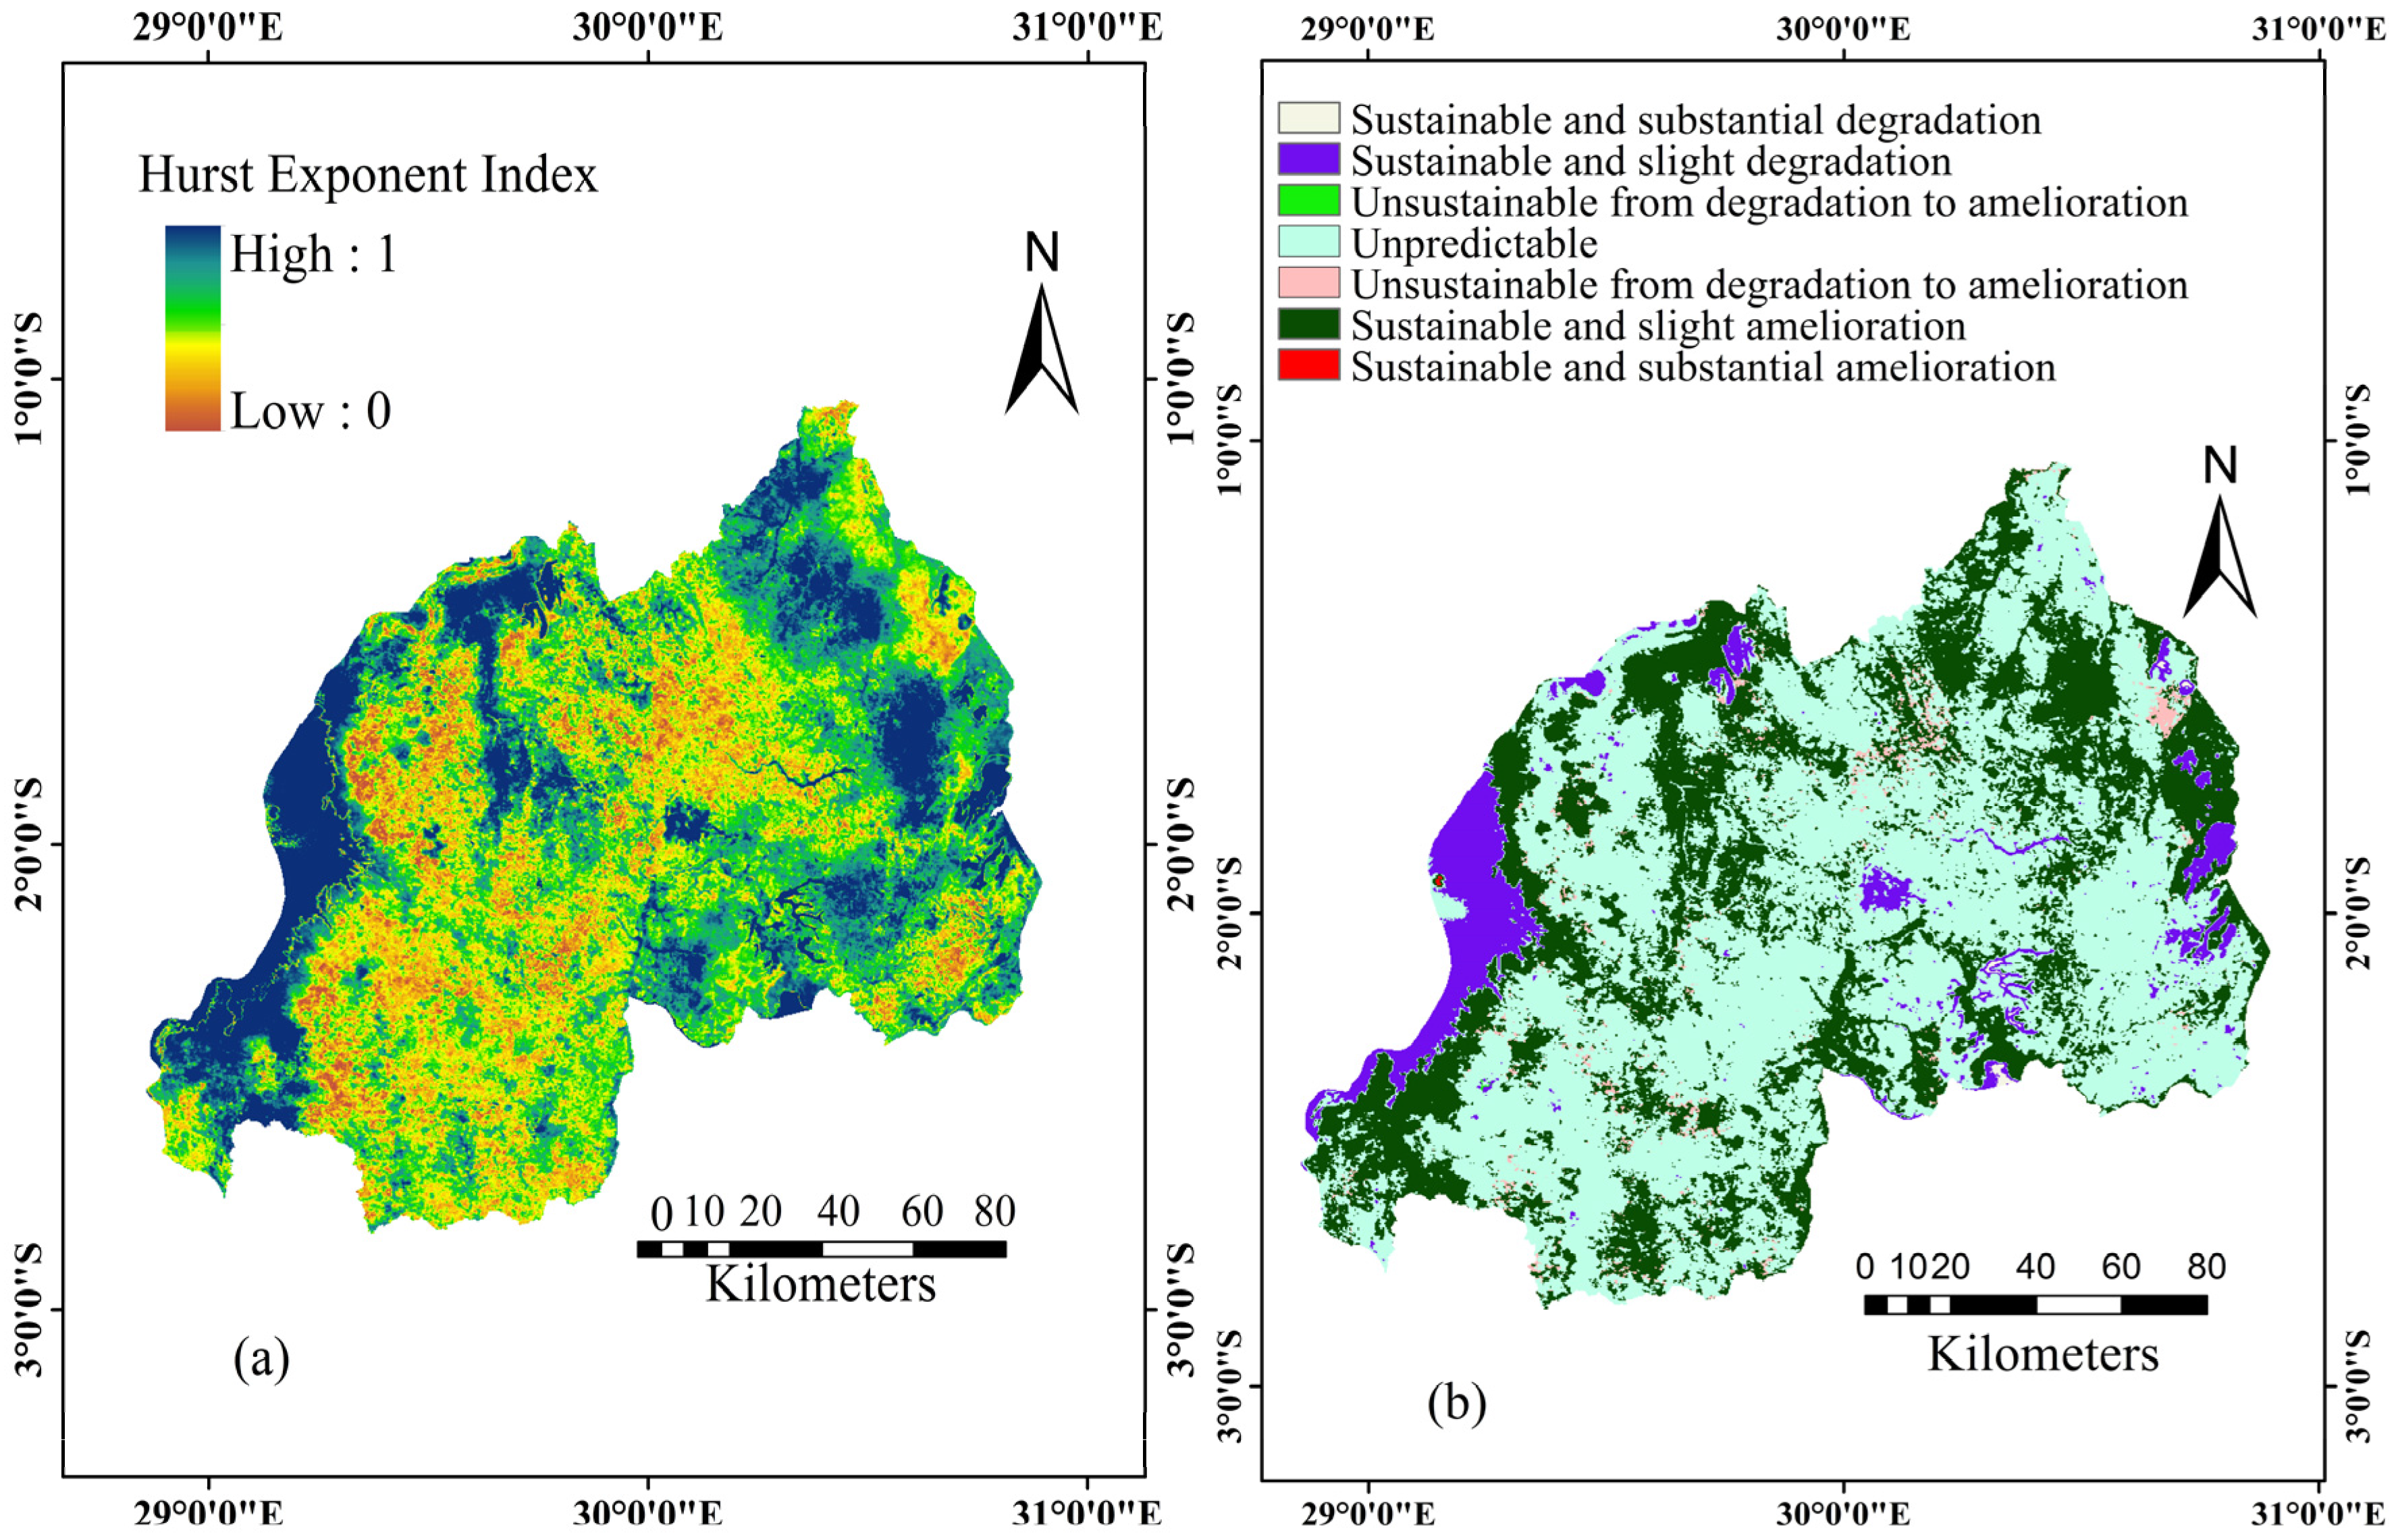
3.6. Consistency of Trends in Vegetation Dynamics
| SNDVI | Hurst | Variation Type | Percentage (%) |
|---|---|---|---|
| ≥0.03 | >0.5 | Sustainable and substantial amelioration | 0.01 |
| 0.0004–0.03 | >0.5 | Sustainable and slight amelioration | 28.027 |
| >0.0004 | <0.5 | Unsustainable, from degradation to amelioration | 0.1 |
| 0.0004–0.03 | ≈0.5 | Unpredictable (Brownian time series) | 58.18 |
| <−0.0004 | <0.5 | Unsustainable, from amelioration to degradation | 1.57 |
| −0.03–0.0004 | >0.5 | Sustainable and slight degradation | 6.17 |
| <−0.03 | >0.5 | Sustainable and substantial degradation | 0.008 |
| - | - | Lakes, rivers, artificial surfaces | 5.935 |
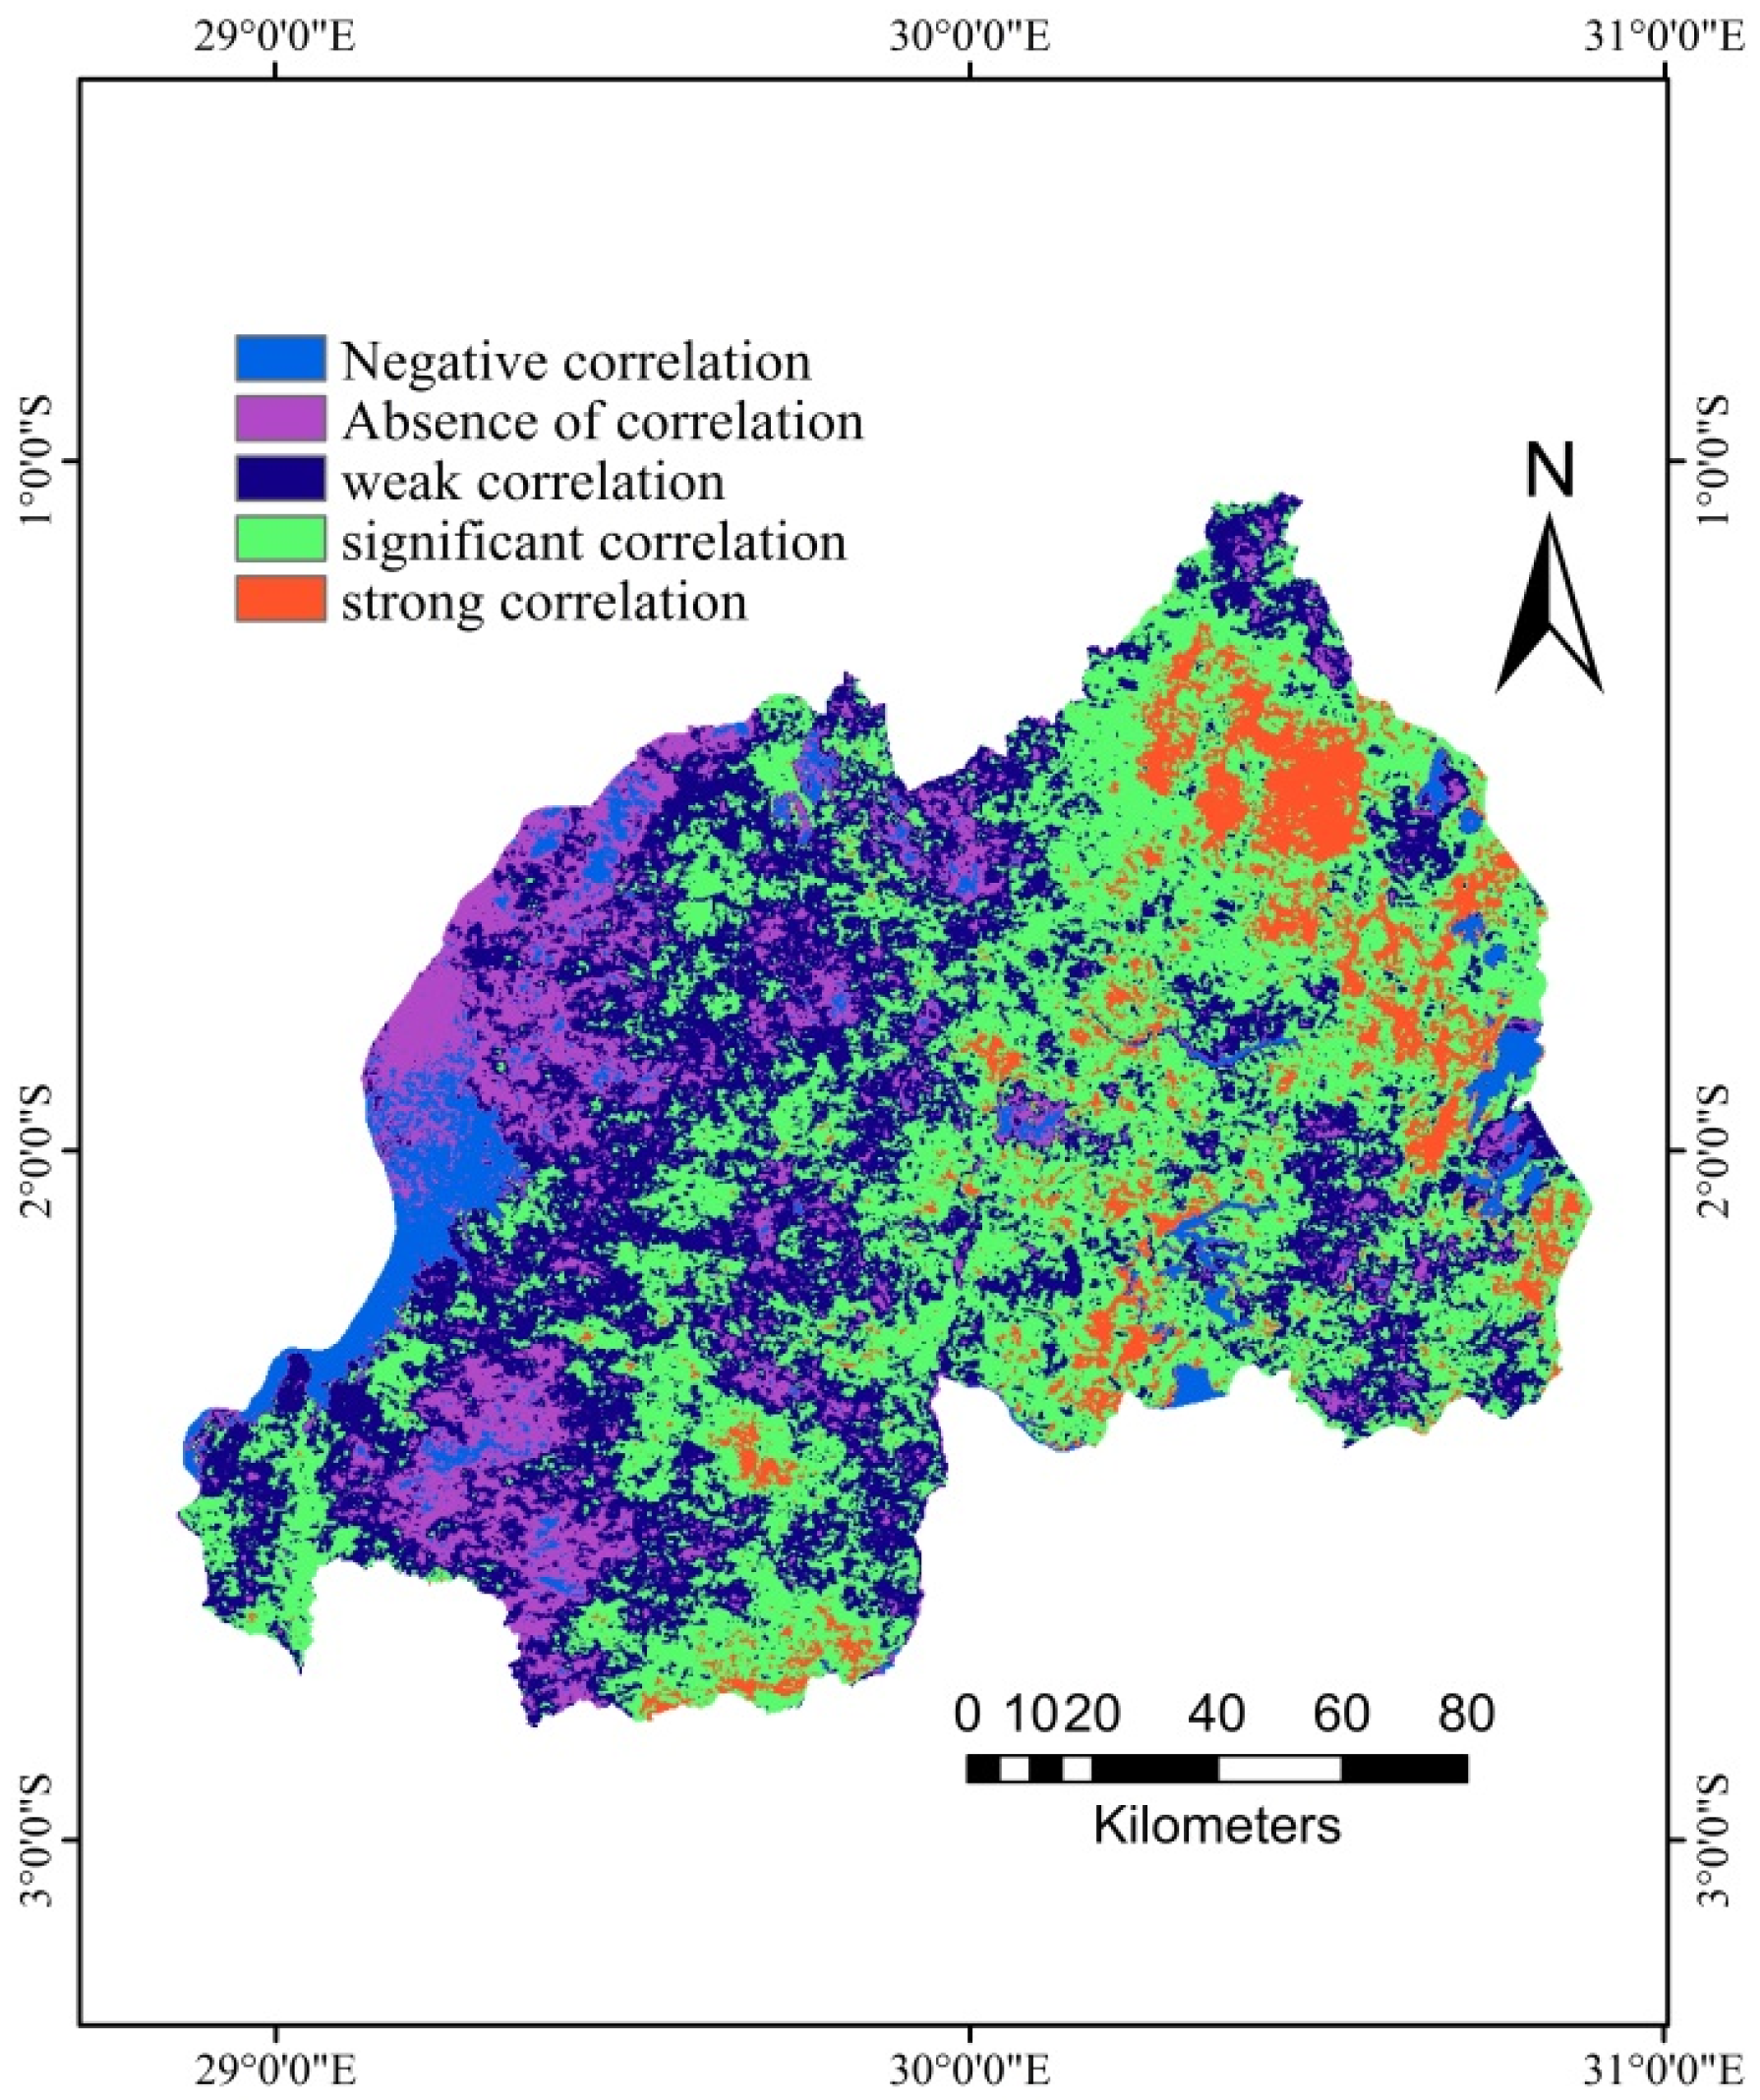
3.7. Spatial Analysis of the Correlation between Mean GS NDVI and Precipitation in Rwanda
4. Discussion
4.1. Statistical Analysis of Mean Growing Season NDVI Evolution Since 1990
4.2. Investigating on the Correlation between Rainfall and Mean Growing Season NDVI
4.3. On the Variability of Mean GS NDVI throughout the Growing Season
4.4. Analysis of Vegetation Trend Dynamics
4.5. Analysis of Trend Dynamics per Vegetation Type
4.6. Analysis of the Hurst Exponent and the Trends’ Sustainability
4.7. Uncertainties, Errors and Accuracies
5. Conclusions
Acknowledgments
Author Contributions
Conflicts of Interest
References
- Shisanya, C.; Recha, C.; Anyamba, A. Rainfall variability and its impact on Normalized Difference Vegetation Index in arid and semi-arid lands of Kenya. Int. J. Geosci. 2011, 2, 36–47. [Google Scholar] [CrossRef]
- Xie, Y.C.; Sha, Z.Y.; Yu, M. Remote sensing imagery in vegetation mapping: A review. J. Plant Ecol. 2008, 1, 9–23. [Google Scholar] [CrossRef]
- Turvey, C.G.; Mclaurin, M.K. Applicability of the Normalized Difference Vegetation Index (NDVI) in index-based crop insurance design. Weather Clim. Soc. 2012, 4, 271–284. [Google Scholar] [CrossRef]
- Jackson, R.D.; Huete, A.R. Interpreting vegetation indexes. Prev. Vet. Med. 1991, 11, 185–200. [Google Scholar] [CrossRef]
- Clements, N.; Sarkar, S.K.; Zhao, Z.G.; Kim, D.Y. Applying multiple testing procedures to detect change in East African vegetation. Ann. Appl. Stat. 2014, 8, 286–308. [Google Scholar] [CrossRef]
- Rulinda, C.M.; Dilo, A.; Bijker, W.; Stein, A. Characterising and quantifying vegetative drought in East Africa using fuzzy modelling and NDVI data. J. Arid Environ. 2012, 78, 169–178. [Google Scholar] [CrossRef]
- Pfeifer, M.; Lefebvre, V.; Gonsamo, A.; Pellikka, P.K.E.; Marchant, R.; Denu, D.; Platts, P.J. Validating and linking the GIMMS Leaf Area Index (LAI3g) with environmental controls in tropical Africa. Remote Sens. 2014, 6, 1973–1990. [Google Scholar] [CrossRef]
- Davenport, M.L.; Nicholson, S.E. On the relation between rainfall and the Normalized Difference Vegetation Index for diverse vegetation types in East-Africa. Int. J. Remote Sens. 1993, 14, 2369–2389. [Google Scholar] [CrossRef]
- Carreiras, J.M.B.; Melo, J.B.; Vasconcelos, M.J. Estimating the above-ground biomass in miombo savanna woodlands (Mozambique, East Africa) using l-band synthetic aperture radar data. Remote Sens. 2013, 5, 1524–1548. [Google Scholar] [CrossRef]
- Rulinda, C.M.; Bijker, W.; Stein, A. The chlorophyll variability in meteosat derived NDVI in a context of drought monitoring. Procedia Environ. Sci. 2011, 3, 32–37. [Google Scholar] [CrossRef]
- Muhire, I.; Ahmed, F.; Abd Elbasit,, M.M.M. Spatio-temporal variations of rainfall erosivity in Rwanda. J. Soil Sci. Environ. Manag. 2015, 6, 72–83. [Google Scholar]
- Mukashema, A. Mapping and Modelling Landscape-Based Soil Fertility Change in Relation to Human Induction. Case Study: Gishwati Watershed of the Rwandan Highlands. Master’s Thesis, Faculty of Geo-Information Science and Earth Observation, Enschede, The Netherlands, 2007. [Google Scholar]
- Ibrahim, Y.Z.; Balzter, H.; Kaduk, J.; Tucker, C.J. Land degradation assessment using residual trend analysis of GIMMS NDVI3g, soil moisture and rainfall in Sub-Saharan West Africa from 1982 to 2012. Remote Sens. 2015, 7, 5471–5494. [Google Scholar] [CrossRef]
- Piao, S.L.; Mohammat, A.; Fang, J.Y.; Cai, Q.; Feng, J.M. NDVI-based increase in growth of temperate grasslands and its responses to climate changes in China. Glob. Environ. Chang. 2006, 16, 340–348. [Google Scholar] [CrossRef]
- Tucker, C.J.; Pinzon, J.E.; Brown, M.E.; Slayback, D.A.; Pak, E.W.; Mahoney, R.; Vermote, E.F.; El Saleous, N. An extended avhrr 8-km NDVI dataset compatible with MODIS and SPOT vegetation NDVI data. Int. J. Remote Sens. 2005, 26, 4485–4498. [Google Scholar] [CrossRef]
- Yuan, X.; Li, L.; Chen, X. Increased grass NDVI under contrasting trends of precipitation change over north China during 1982–2011. Remote Sens. Lett. 2015, 6, 69–77. [Google Scholar] [CrossRef]
- Wang, J.; Rich, P.M.; Price, K.P. Temporal responses of NDVI to precipitation and temperature in the central great plains, USA. Int. J. Remote Sens. 2003, 24, 2345–2364. [Google Scholar] [CrossRef]
- Peng, S.S.; Chen, A.P.; Xu, L.; Cao, C.X.; Fang, J.Y.; Myneni, R.B.; Pinzon, J.E.; Tucker, C.J.; Piao, S.L. Recent change of vegetation growth trend in China. Environ. Res. Lett. 2011, 6, 044027. [Google Scholar] [CrossRef]
- Geng, L.Y.; Ma, M.G.; Wang, X.F.; Yu, W.P.; Jia, S.Z.; Wang, H.B. Comparison of eight techniques for reconstructing multi-satellite sensor time-series NDVI data sets in the Heihe river basin, China. Remote Sens. 2014, 6, 2024–2049. [Google Scholar] [CrossRef]
- Duan, H.C.; Yan, C.Z.; Tsunekawa, A.; Song, X.; Li, S.; Xie, J.L. Assessing vegetation dynamics in the three-north shelter forest region of China using AVHRR NDVI data. Environ. Earth Sci. 2011, 64, 1011–1020. [Google Scholar] [CrossRef]
- Hurst, H.E. Long-term storage capacity of reservoirs. Trans. Am. Soc. Civ. Eng. 1951, 116, 770–808. [Google Scholar]
- Peng, J.; Liu, Z.; Liu, Y.; Wu, J.; Han, Y. Trend analysis of vegetation dynamics in Qinghai–Tibet plateau using hurst exponent. Ecol. Indic. 2012, 14, 28–39. [Google Scholar] [CrossRef]
- Jiang, W.G.; Yuan, L.H.; Wang, W.J.; Cao, R.; Zhang, Y.F.; Shen, W.M. Spatio-temporal analysis of vegetation variation in the Yellow river basin. Ecol. Indic. 2015, 51, 117–126. [Google Scholar] [CrossRef]
- Jiapaer, G.; Liang, S.L.; Yi, Q.X.; Liu, J.P. Vegetation dynamics and responses to recent climate change in Xinjiang using Leaf Area Index as an indicator. Ecol. Indic. 2015, 58, 64–76. [Google Scholar]
- Shongwe, M.E.; van Oldenborgh, G.J.; van den Hurk, B.; van Aalst, M. Projected changes in mean and extreme precipitation in Africa under global warming. Part II: East Africa. J. Clim. 2011, 24, 3718–3733. [Google Scholar]
- Justice, C.O.; Townshend, J.R.G.; Holben, B.N.; Tucker, C.J. Analysis of the phenology of global vegetation using meteorological satellite data. Int. J. Remote Sens. 1985, 6, 1271–1318. [Google Scholar] [CrossRef]
- Nicholson, S.E.; Davenport, M.L.; Malo, A.R. A comparison of the vegetation response to rainfall in the Sahel and East-Africa, using Normalized Difference Vegetation Index from NOAA AVHRR. Clim. Chang. 1990, 17, 209–241. [Google Scholar] [CrossRef]
- Rwaka, M. An Attempt to Investigate the Impact of 1994 Tutsi Genocide in Rwanda on Landscape Using Remote Sensing and GIS Analysis; Student thesis series INES; Lund University Libraries: Lund, Sweden, 2014. [Google Scholar]
- Mkhabela, M.S.; Mkhabela, M.S.; Mashinini, N.N. Early maize yield forecasting in the four agro-ecological regions of Swaziland using NDVI data derived from NOAA’s-AVHRR. Agr. For. Meteorol. 2005, 129, 1–9. [Google Scholar] [CrossRef]
- La, H.P.; Patrick, T.R.; Park, B.W.; Eo, Y.D. Analysis of the relationship between MODIS NDVI, Lai and rainfall in the forest region of Rwanda. Int. J. Digit. Content Technol. Appl. 2013, 7, 559. [Google Scholar]
- Reed, B.C. Trend analysis of time-series phenology of North America derived from satellite data. GIScience Remote Sens. 2006, 43, 24–38. [Google Scholar] [CrossRef]
- Jacquin, A.; Sheeren, D.; Lacombe, J.P. Vegetation cover degradation assessment in Madagascar savanna based on trend analysis of MODIS NDVI time series. Int. J. Appl. Earth Obs. 2010, 12, S3–S10. [Google Scholar] [CrossRef]
- Liu, J.G.; Daily, G.C.; Ehrlich, P.R.; Luck, G.W. Effects of household dynamics on resource consumption and biodiversity. Nature 2003, 421, 530–533. [Google Scholar] [CrossRef] [PubMed]
- Ndegwa Mundia, C.; Murayama, Y. Analysis of land use/cover changes and animal population dynamics in a wildlife sanctuary in East Africa. Remote Sens. 2009, 1, 952–970. [Google Scholar] [CrossRef]
- Munyaneza, O.; Ndayisaba, C.; Wali, U.; Mulungu, M.; Dulo, O. Integrated flood and drought management for sustainable development in the Kagera river basin. Nile Water Sci. Eng. J. 2011, 4, 60–70. [Google Scholar]
- Blackwell, J.M.; Goodwillie, R.N.; Webb, R. Environment and Development in Africa. Selected Case Studies; Economic Development Institute, World Bank: Washington, DC, USA, 1991. [Google Scholar]
- Santos, P.; Negri, A.J. A comparison of the Normalized Difference Vegetation Index and Rainfall for the Amazon and Northeastern Brazil. J. Appl. Meteorol. 1997, 36, 958–965. [Google Scholar] [CrossRef]
- Evans, J.; Geerken, R. Discrimination between climate and human-induced dryland degradation. J. Arid Environ. 2004, 57, 535–554. [Google Scholar] [CrossRef]
© 2016 by the authors; licensee MDPI, Basel, Switzerland. This article is an open access article distributed under the terms and conditions of the Creative Commons by Attribution (CC-BY) license (http://creativecommons.org/licenses/by/4.0/).
Share and Cite
Ndayisaba, F.; Guo, H.; Bao, A.; Guo, H.; Karamage, F.; Kayiranga, A. Understanding the Spatial Temporal Vegetation Dynamics in Rwanda. Remote Sens. 2016, 8, 129. https://doi.org/10.3390/rs8020129
Ndayisaba F, Guo H, Bao A, Guo H, Karamage F, Kayiranga A. Understanding the Spatial Temporal Vegetation Dynamics in Rwanda. Remote Sensing. 2016; 8(2):129. https://doi.org/10.3390/rs8020129
Chicago/Turabian StyleNdayisaba, Felix, Hao Guo, Anming Bao, Hui Guo, Fidele Karamage, and Alphonse Kayiranga. 2016. "Understanding the Spatial Temporal Vegetation Dynamics in Rwanda" Remote Sensing 8, no. 2: 129. https://doi.org/10.3390/rs8020129
APA StyleNdayisaba, F., Guo, H., Bao, A., Guo, H., Karamage, F., & Kayiranga, A. (2016). Understanding the Spatial Temporal Vegetation Dynamics in Rwanda. Remote Sensing, 8(2), 129. https://doi.org/10.3390/rs8020129


