Article

An Assessment of the Cultivated Cropland Class of NLCD 2006 Using a Multi-Source and Multi-Criteria Approach

1
Stinger Ghaffarian Technologies (SGT), Contractor to the U.S. Geological Survey (USGS) Earth Resources Observation and Science (EROS) Center, Sioux Falls, SD 57198, USA
2
InuTeq, Contractor to the USGS EROS Center, Sioux Falls, SD 57198, USA
3
USGS EROS Center, Sioux Falls, SD 57198, USA
4
Department of Geography, South Dakota State University, Brookings, SD 57007, USA
*
Author to whom correspondence should be addressed.
These authors contributed equally to this work.
Remote Sens. 2016, 8(2), 101; https://doi.org/10.3390/rs8020101
Submission received: 29 July 2015 / Accepted: 13 January 2016 / Published: 28 January 2016

Abstract

:
We developed a method that analyzes the quality of the cultivated cropland class mapped in the USA National Land Cover Database (NLCD) 2006. The method integrates multiple geospatial datasets and a Multi Index Integrated Change Analysis (MIICA) change detection method that captures spectral changes to identify the spatial distribution and magnitude of potential commission and omission errors for the cultivated cropland class in NLCD 2006. The majority of the commission and omission errors in NLCD 2006 are in areas where cultivated cropland is not the most dominant land cover type. The errors are primarily attributed to the less accurate training dataset derived from the National Agricultural Statistics Service Cropland Data Layer dataset. In contrast, error rates are low in areas where cultivated cropland is the dominant land cover. Agreement between model-identified commission errors and independently interpreted reference data was high (79%). Agreement was low (40%) for omission error comparison. The majority of the commission errors in the NLCD 2006 cultivated crops were confused with low-intensity developed classes, while the majority of omission errors were from herbaceous and shrub classes. Some errors were caused by inaccurate land cover change from misclassification in NLCD 2001 and the subsequent land cover post-classification process.

Graphical Abstract

1. Introduction

Land cover change (LCC) is one of the most important topics for global environmental change studies. Information on LCC is essential to understanding the relationship and feedbacks between land cover and the climate system, and its impacts on environmental and socioeconomic processes [1,2,3]. Changes in agricultural lands link closely to both natural and anthropogenic drivers. Studies of agricultural land change require accurate and spatially explicit estimates of cropland area, types, and qualities over large geographic regions. Currently in the United States, two national digital classification maps contain agricultural classes: the National Land Cover Database (NLCD) [4,5,6] and the U.S. Department of Agriculture (USDA) National Agricultural Statistics Service (NASS) Cropland Data Layer (CDL) [7]. These two datasets have been widely used for many applications, often to quantify change across time. For example, Wright and Wimberly [8] quantified the grassland conversion in the Western Corn Belt by comparing each Landsat 30-m resolution pixel from the 2006 CDL to the 2011 CDL. Lark et al. [9] used the CDL from 2008 to 2012 and NLCD 2001 and 2006 to find areas that were converted from and to cropland. Faber et al. [10] used the CDL datasets from 2008–2011 to estimate the amount of grassland, wetlands, and shrub that was converted to crops. Cox and Rundquist [11] used the CDL datasets from 2008 to 2012 to estimate the conversion from wetland to cropland. Johnston [12] used the 2010 and 2011 CDL data and U.S. Fish & Wildlife Service’s National Wetland Inventory (NWI) and NLCD 2001 to determine wetland loss due to row crop expansion in the Dakota Prairie Pothole Region. Johnston [13] used the CDL from 2006–2012 to analyze all major crops and non-crop vegetation transitions to help quantify agricultural expansion in the U.S Northern Plains. Stern et al. [14] used CDL from 2001 to 2010 and NLCD for training data in non-agricultural areas to help determine changes in crop rotation in Iowa. Howard et al. [15] used all available CDL from 2000 to 2011 as training data and used NLCD 2001 and 2006 to constrict to areas only mapped as cultivated crops or hay. Although formal national assessments of these products are completed [16] for many applications, the accuracy of these baseline datasets (e.g., CDL and NLCD) still can be challenging to understand for specific applications or categories [17]. Laingen [18] has cautioned that dubious conclusions can be made when reporting land use and land cover change based on classification results using remotely sensed data if the classification errors are not known and accounted for during interpretation. He pointed out a wide range of computed cropland area in 2012 and cropland changes from 2006 to 2012 in South Dakota by using different datasets. Further understanding of the quality of these datasets through additional accuracy assessments can provide new information about class and data quality that potentially enhances the ability for users to form accurate conclusions and decisions with applications that use these data.
In this research, we developed a method to assess the quality of the cultivated cropland class mapped in NLCD 2006 using a multi-source and multi-criteria approach. Cultivated cropland (class 82) is defined as “areas used for the production of annual crops, such as corn, soybeans, vegetables, tobacco, and cotton, and also perennial woody crops such as orchards and vineyards. Crop vegetation accounts for greater than 20% of total vegetation. This class also includes all land being actively tilled” [4]. Traditionally, most accuracy assessments for land cover classification have used an error matrix approach [19]. Although informative, the method does not provide a spatial distribution of the classification error and possible causes of the misclassification [20,21]. The method described in this study allows spatially explicit identification of potential commission and omission errors of the mapped agricultural class in NLCD 2006. We quantify the magnitude of these errors across different geographic areas, present the spatial distribution of the error, and analyze the plausible causes of the errors regarding the land cover classification processes.

1.1. Review of NLCD 2006 Methodology

It is important to review how NLCD 2006 was generated because the assessment of the agricultural class mapped in NLCD 2006 is the major focus of this research. The NLCD 2006 land cover product was designed to update NLCD 2001 to 2006 and to meet the needs of the user community for more frequent land cover monitoring.
As a major data source for NLCD 2006 development, Landsat images were compiled by selecting a two-date pair from circa 2001 and circa 2006 for the same path and row for change detection and land cover classification. In addition, to reduce impacts caused by seasonal and phenological variation, images were selected in the same season for all path/rows. The temporal ranges were restricted to within one month for most scenes. All Landsat image preprocessing was done by the National Landsat Archive Production System (NLAPS), which does image geometric and radiometric calibrations. Each image was then converted to top-of-atmosphere (TOA) reflectance [22].
Change detection was done by the Multi Index Integrated Change Analysis (MIICA) model [23]. The MIICA model uses four spectral indices to obtain the spectral change pixels and to determine the change trajectory that occurred between the two image dates. The four spectral indices are Change Vector (CV), Relative Change Vector Maximum (RCVMAX), differenced Normalized Burn Ratio (dNBR), and differenced Normalized Difference Vegetation Index (dNDVI) [23]. The change map consisted of two change classes: Biomass Increase (BI) and Biomass Decrease (BD). For NLCD 2006 we used one image pair for change detection [23].
A decision tree algorithm (See5) was used to generate classification rules for 2006 land cover classification. See5 uses an entropy criterion, which means the classification trees grow based on the variable that has the biggest entropy or amount of information [24]. To build classification, a classification and regression tree (CART) model was applied [5], which is part of the NLCD mapping module [25]. Training data representing different land cover types were generated from unchanged areas by a random stratified sampling procedure. The training data for each land cover class were held proportional to the total number of pixels for that class. The training data served as a dependent variable as input for a decision tree model, while the 2006 Landsat reflectance, thermal band, tasseled cap, and Digital Elevation Model (DEM) derivatives (aspect, slope, position index, compound topographic index) served as the independent variable. Land cover classification was done using the Decision Tree Classification [5]. Once the classification was generated, changes were assessed from 2001 to 2006 by analyzing the change pixels from the two-date land cover maps. Finally, post-mapping analysis was applied to generate the 2001–2006 change pixels, which were then used to produce the 2006 land cover product [5].

1.2. Review of NLCD 2011 Methodology

Since the methodology developed in this study also uses the NLCD 2011 classification map as one input file, it is useful to briefly review the NLCD 2011 land cover development method. The 2011 method consists of two parts: change detection and 2011 land cover classification and labeling.
Change detection is done by a robust Comprehensive Change Detection Method (CCDM), including the Multi Index Integrated Change Analysis (MIICA) model and a novel change model called ZONE. The CCDM is designed as a key component for the development of NLCD 2011 [23]. The CCDM uses two Landsat image pairs to extract change information. The purpose of using two image pairs for change analysis is to reduce commission and omission errors caused by seasonal and phenology change [23]. The core module of the change detection strategy is the MIICA model, which was also used in NLCD 2006. The ZONE model is designed specifically to detect the changes related to forest disturbance such as forest fire, forest harvest, and forest regeneration. The MIICA and ZONE will each generate a spectral change map [23]. The change map will consist of two change classes: Biomass Increase (BI) and Biomass Decrease (BD).
A decision tree algorithm (See5) was used to generate classification rules for 2011 land cover classification. To build the See5 classification a CART model was used [5], which is part of the NLCD mapping module [25]. Within the NLCD mapping module, a sampling tool was executed to generate sample training data [25]. For independent variables, the sampling tool uses six reflective bands of Landsat image, and for each path and row three images acquired in 2011 growing season were used. Also included as independent variables was the DEM and derivatives, which includes aspect, slope, position index, compound topographic index, and a maximum potential wetland data layer. Maximum potential wetland is generated based on Hydric Soil, National Wetland Inventory (NWI), and NLCD. For dependent variables, sampling tool uses the land cover type label. From the training data 5% of the total pixels was drawn and 2% for validation.
From our sampling method a decision tree was built by See5 followed by a classification for each pixel of the image using the rules developed. Once the 2011 classification image was created, a post-classification process was applied, which includes running the Smart Eliminate Tool [25]. Smart Eliminate is an aggregation algorithm that was applied to set a Minimum Mapping Unit (MMU) for a given pixel. As a result of this, patches that are less than five pixels are relabeled based on its neighborhood pixels to reduce the “salt and pepper” effect in the original land cover map [6].

1.3. Review of National Agricultural Statistics Service (NASS) Cropland Data Layer (CDL)

The CDL is an important dataset to review because the CDL is used both in creating NLCD 2011 and as an input file for this study. As a USDA NASS program, a CDL has been produced annually since 2006 using medium resolution satellite imagery such as Landsat 5, Landsat 7, and IRS-1C LISS satellites. The product is a comprehensive, raster formatted, and georeferenced crop specific dataset with a 56-m spatial resolution for CDL 2006 and 2007 and a 30-m spatial resolution for CDL after 2007 [7]. The USDA mission is to provide accurate, timely, and useful statistics for U.S. agriculture [26]. The NASS cropland classifications are integrated with field survey through regression analysis to provide a robust method to reduce statistical variation. The regression estimation methodology is superior to simple pixel counting, which is often biased. Over the last few years, greater access to imagery and ground truth data has allowed NASS to expand its coverage to include the conterminous United States [7].
These products use orthorectified imagery to geospatially and accurately identify many crop types [26]. The CDLs were generated using a supervised classification methodology [7]. The geo-referenced images and ancillary data were stacked regionally by state using Environmental Systems Research Institute (ESRI) Geographic Information Systems (GIS) software. Next, samples were generated across the image stack using ground truth data, which identified the pixel locations of specific crops. The sample stacks were then data mined to determine the set of multi-spectral rules from the time series of imagery that would best predict what land cover category was found at ground truth locations. Once the classification rules were established, all the pixels within the scene were placed into the class that best fit building a statewide classification [7]. A high quality ground truth dataset is the key to the classification process. The field level information provides spatially detailed field information that includes the “Common Land Unit” (CLU), a large and timely USDA database of agricultural land use of many farms across the country. The database provided a very good sample for training the image classifier [26]. For this research, we used CDL 2006 and 2007, which is based on the Advanced Wide Field Sensor (AWiFS) at 56-m resolution, and the CDL 2011 based on Landsat 30-m resolution imagery.

2. Study Area and Data
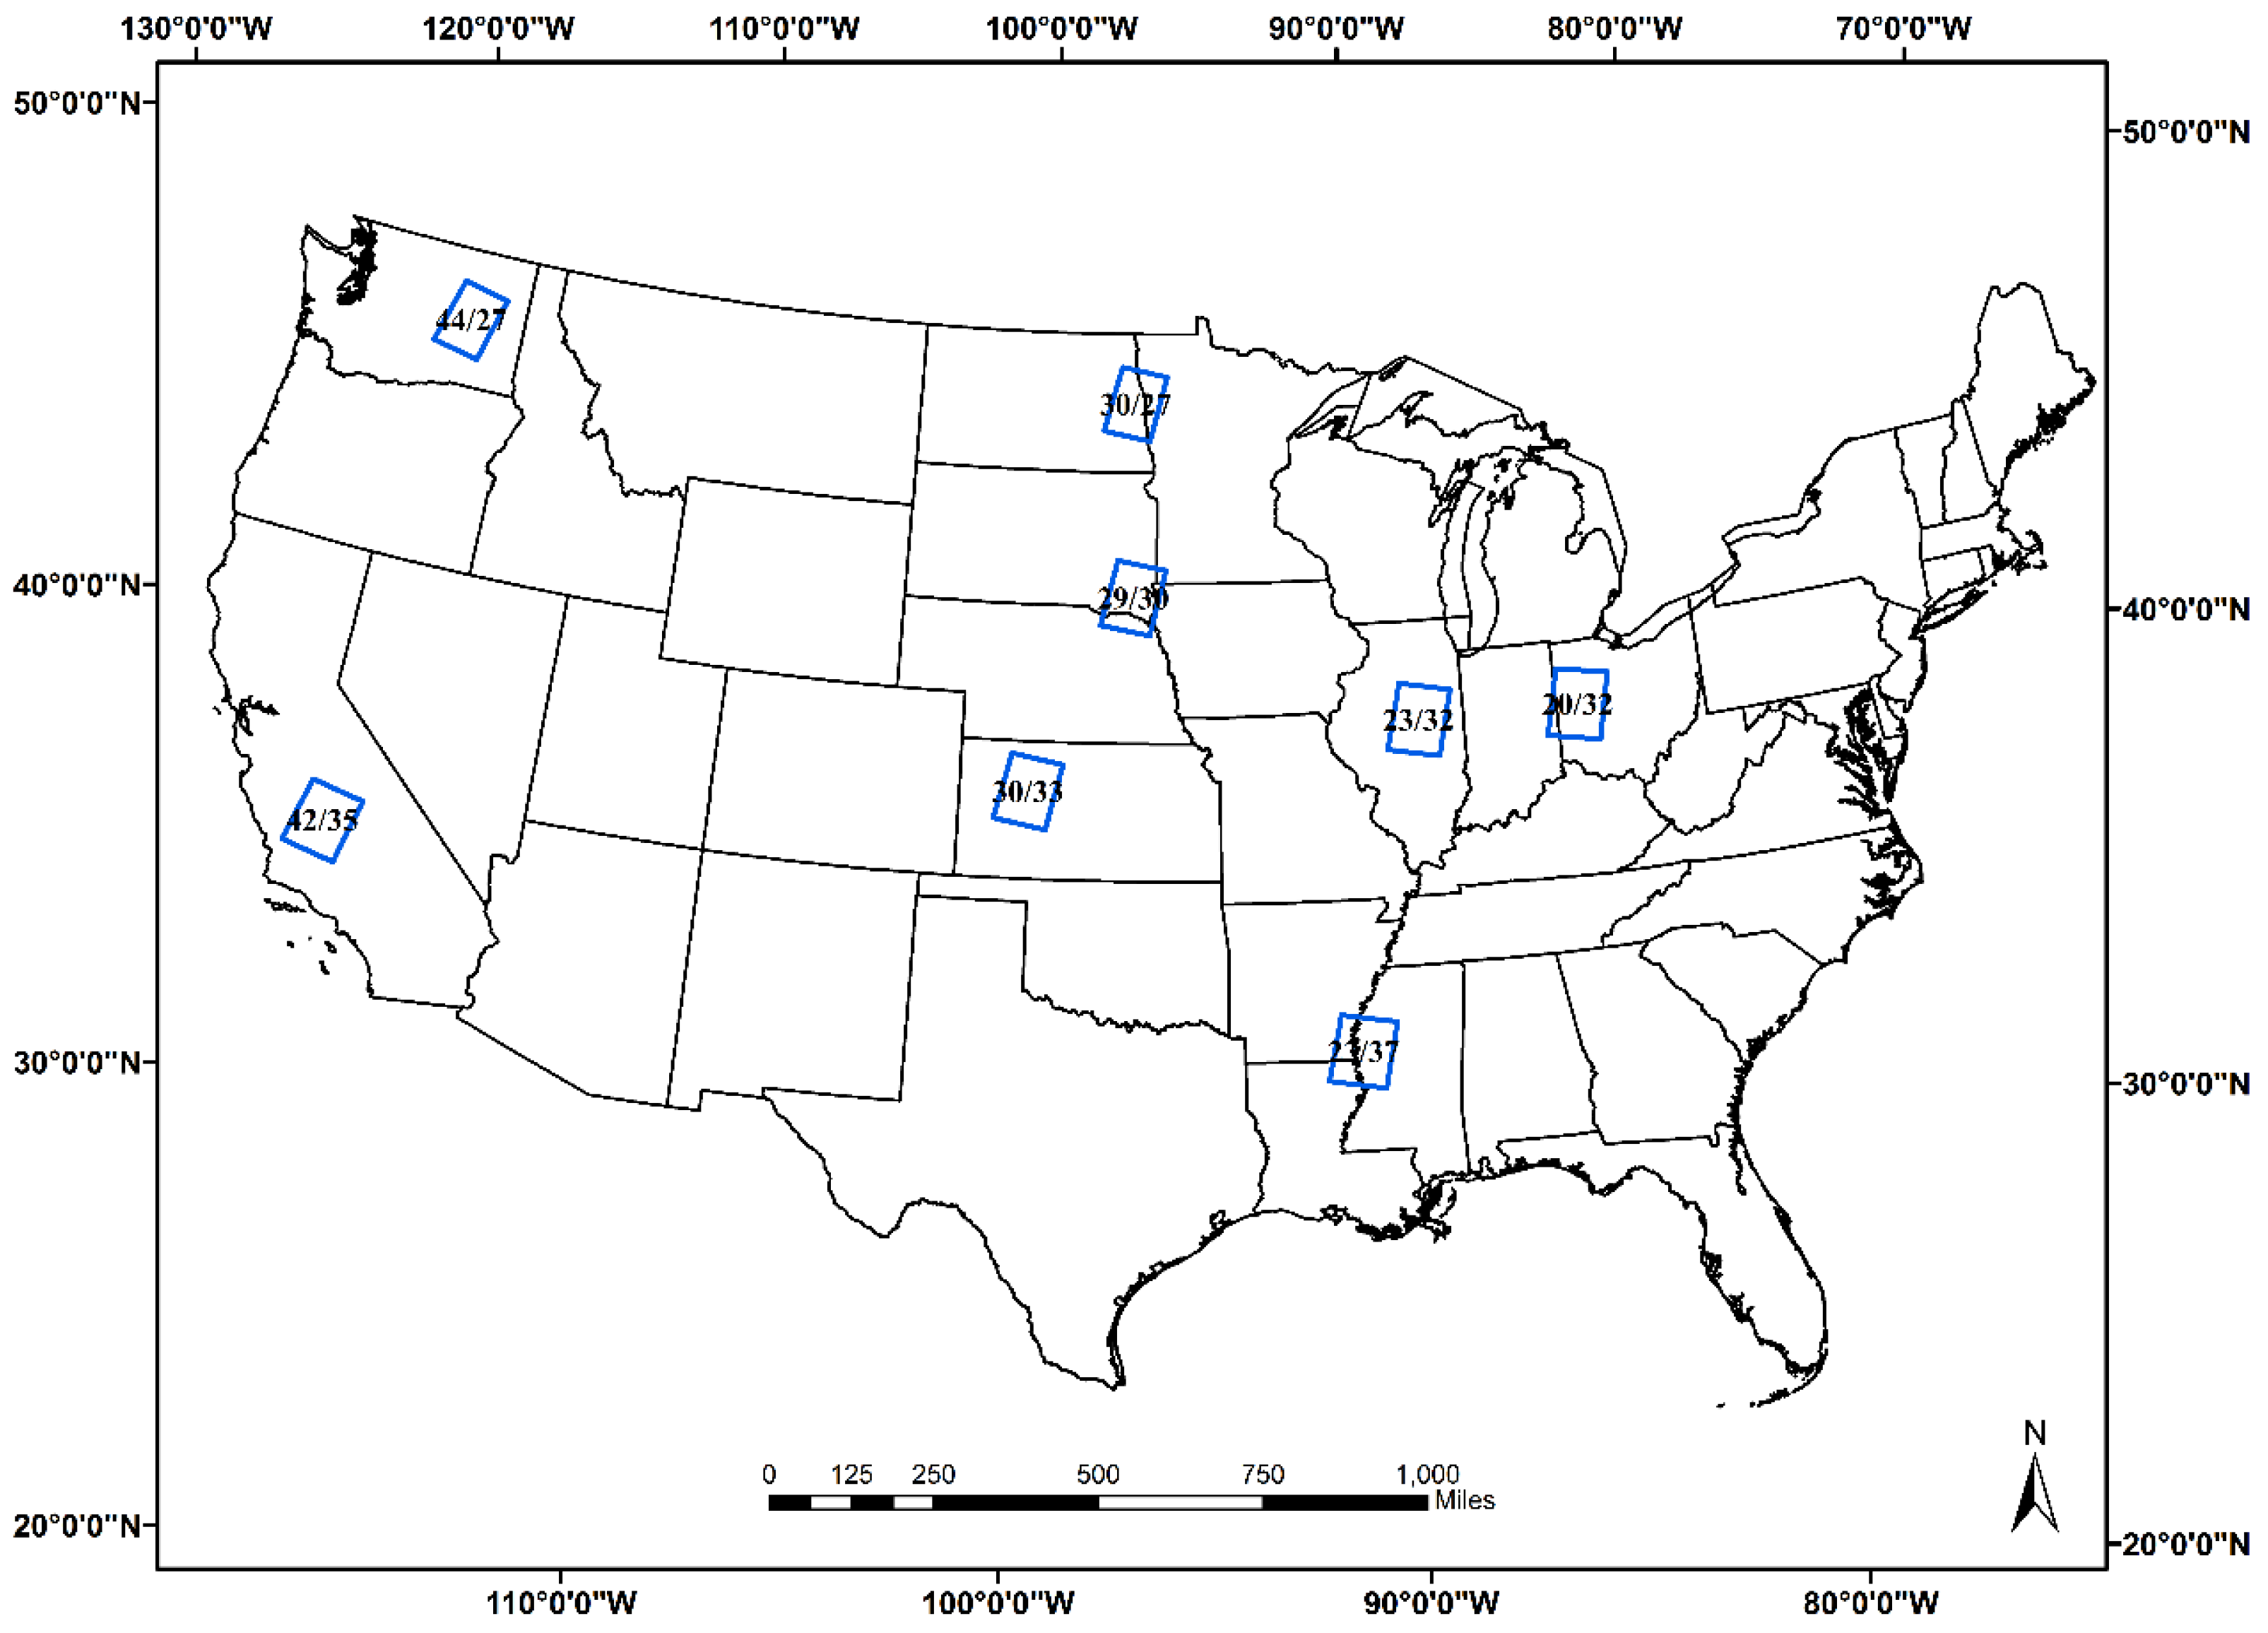
2.1. Study Area

The study area consists of eight Landsat Worldwide Reference System-2 (WRS-2) path/rows located in the conterminous United States (Figure 1). Each path/row was selected where cultivated cropland was mapped and where we had CDL data available in 2006 (or 2007). For the eight path/rows, the percentage of the land cover that was cultivated crops ranges from 36.08% in path/row 44/27 to 80.18% in path/row 23/32 (Table 1).
For this study, the main constraint for selecting those path/rows is the availability of CDL datasets (Figure 2). The eight path/rows selected cover major agricultural areas within the United States and the selection process is not based on a statistical sampling design. Path/rows 29/30, 23/32, 20/32, and 30/27 are located in the Corn Belt region. Path/row 23/37 is located in the Mississippi River alluvial valley region. Path/row 30/33 is located primarily in western Kansas. Path/row 42/35 is located in the Central Valley of California, and 44/27 is located on the Columbia Plateau.
Figure 1. National Land Cover Database (NLCD) area with specific Landsat path/row study areas in blue.
Remotesensing 08 00101 g001
Table 1. NLCD 2006 land cover percentages by path/row.
NLCD Land Cover Classes20/3223/3223/3729/3030/2730/3342/3544/27
Open Water (11)0.75%1.00%4.42%1.43%1.68%0.46%0.42%2.21%
Perennial Ice/Snow (12)0.00%0.00%0.00%0.00%0.00%0.00%0.00%0.00%
Developed-Open Space (21)7.03%4.31%4.34%4.79%4.59%2.99%3.86%2.33%
Developed-Low Intensity (22)3.06%4.03%0.92%0.85%0.80%0.43%1.46%0.79%
Developed-Medium Intensity (23)0.86%0.96%0.24%0.34%0.23%0.06%1.72%0.27%
High Intensity (24)0.35%0.29%0.08%0.11%0.08%0.01%0.33%0.04%
Barren Land (31)0.08%0.04%0.16%0.05%0.01%0.12%3.99%0.04%
Deciduous Forest (41)7.43%5.27%8.01%2.17%1.68%0.22%0.83%0.05%
Evergreen Forest (42)0.08%0.01%4.88%0.08%0.09%0.00%9.03%10.07%
Mixed Forest (43)0.24%0.00%2.09%0.03%0.05%0.00%0.43%0.00%
Shrub/Scrub (52)0.02%0.00%3.64%0.16%0.01%0.06%10.28%41.70%
Grassland/Herbaceous (71)1.15%0.23%0.55%12.88%2.48%40.92%26.64%3.05%
Pasture/Hay (81)5.60%3.01%3.40%13.52%5.49%0.94%4.42%1.89%
Cultivated Crops (82)73.07%80.18%49.79%61.56%77.14%52.93%36.35%36.08%
Woody Wetlands (90)0.09%0.63%17.00%0.33%1.54%0.85%0.12%0.25%
Herbaceous Wetlands (95)0.20%0.04%0.48%1.72%4.11%0.03%0.11%1.21%
Figure 2. (a) National Agricultural Statistics Service (NASS) Cropland Data Layer (CDL) 2006; (b) CDL 2006 cross-walked; (c) CDL 2007; (d) CDL 2007 cross-walked; (e) CDL 2011; and (f) CDL 2011 cross-walked.
Remotesensing 08 00101 g002

2.2. Data

The method developed in this study incorporates several data sources to detect misclassified pixels of the cropland class in NLCD 2006. In order to identify potential commission and omission errors in classified cropland type through the modeling approach, the following datasets were used: NLCD 2006, NLCD 2011, CDL 2011, and CDL 2006 or 2007. Spectral change output from a MIICA [23] model using Landsat images was also used. These datasets were used as inputs to a geospatial model to generate a map depicting where potential omission and commission errors exist in NLCD 2006. The following two sections describe how the datasets were prepared for the study.

2.2.1. Landsat Imagery

Landsat 5 imagery was used to extract spectral change information from circa 2006 to circa 2011. All Landsat scenes were acquired from the U.S. Geological Survey (USGS) Earth Resources Observation and Science (EROS) Center where they were processed to TOA reflectance through the Level 1 Product Generation System (LPGS). In order to extract spectral change information, we used a MIICA model and a ZONE model [23].

2.2.2. NASS Cropland Data Layer (CDL) Datasets

The CDL 2006 and CDL 2007 were both used in this study. The spatial coverage of the CDL 2006 was limited to the Midwest and Alaska, and the CDL 2007 covered the Midwest and the West Coast regions. Some of the study areas were located where CDL did not have coverage in 2006 but had coverage in 2007. In addition, the CDL 2011 was used both in the NLCD 2011 process and in this study.
The CDL data preparation involves five steps: (1) downloading and mosaicking CDL data; (2) cross-walking the CDL to NLCD classification schemes; (3) resampling the 2006 and 2007 cross-walked datasets from 56 m to 30 m using Nearest Neighbor resampling; (4) running Smart Eliminate Tool v2.08 [25], which is part of the NLCD mapping module; and (5) creating a final CDL dataset that has the same spatial extent as that of NLCD 2006.
The specific cropland classes in the CDL 2006 (Figure 2a), CDL 2007 (Figure 2c), and CDL 2011 (Figure 2e) mosaics were cross-walked to NLCD classification schemes (Table 1).
The last step is to run NLCD Smart Eliminate Tool [25] on all resampled and cross-walked CDL maps using a minimum mapping unit (MMU) of 16, similar to NLCD.

3. Methodology

A method was developed to identify and analyze the potential commission and omission errors of the cultivated cropland class mapped in NLCD 2006. The method provided spatially explicit information on the error distribution, and quantified the magnitude of these errors over different geographic areas in the United States. This method integrates multiple geospatial datasets and a change detection algorithm and utilizes both spectral and land cover change information to identify crop areas that are likely to be misclassified in NLCD 2006.

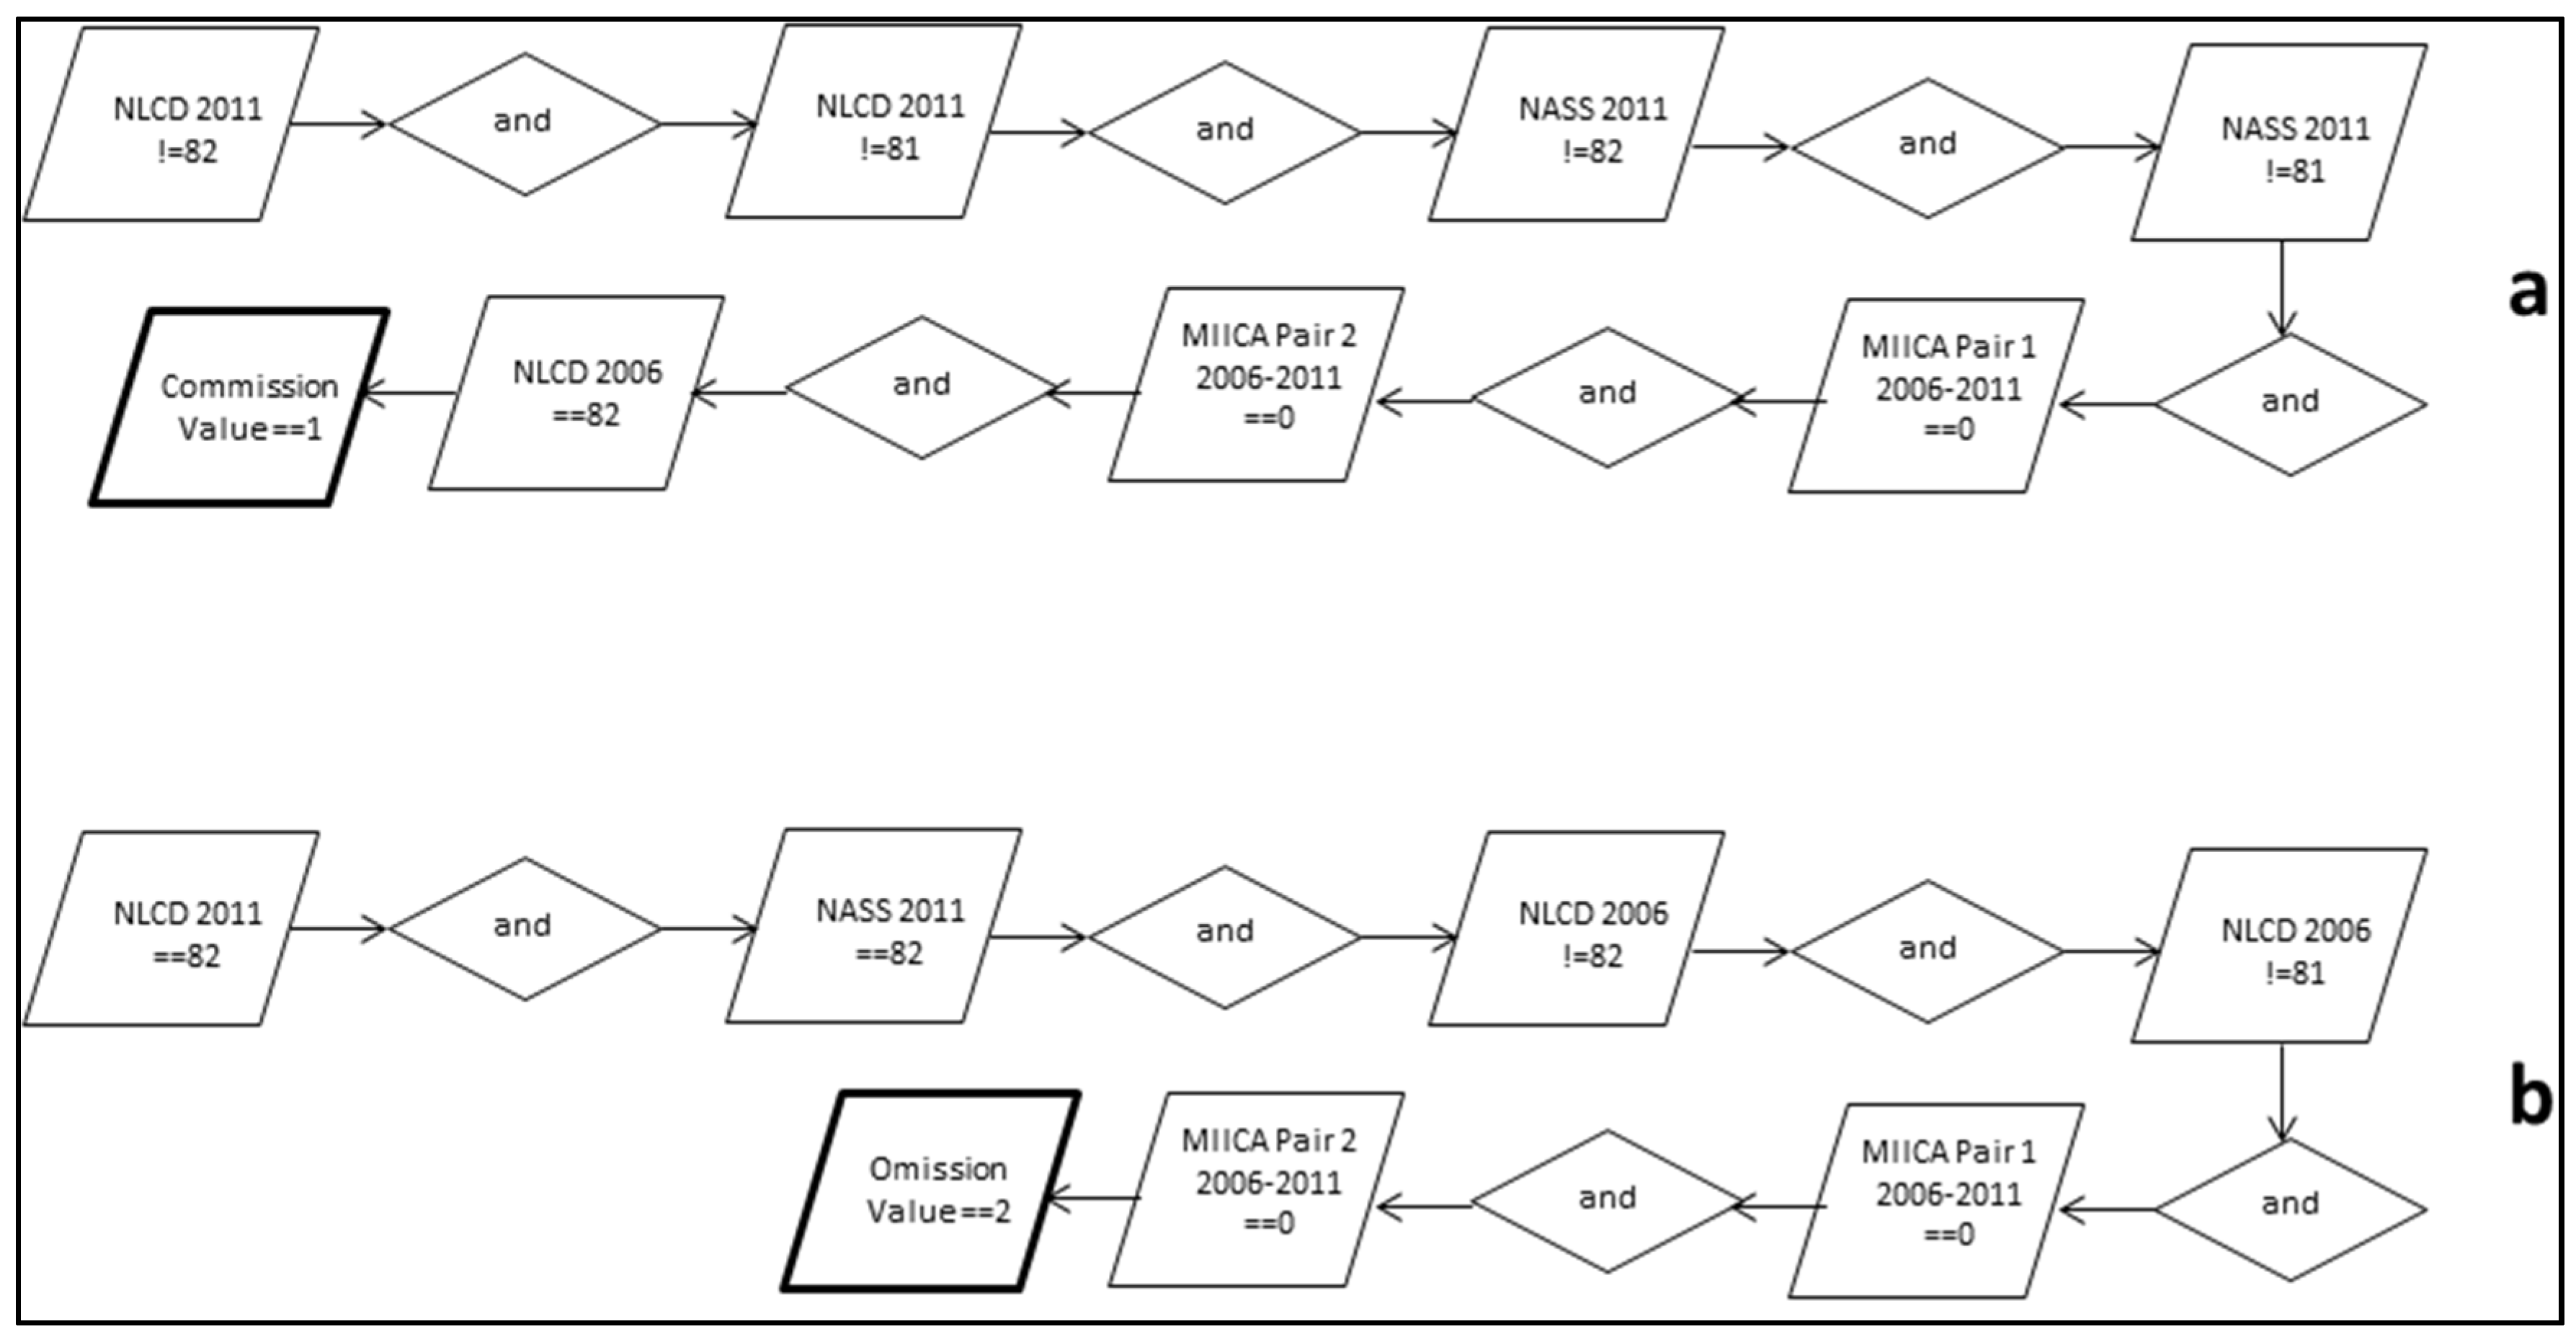
3.1. Models for Identifying Potential Commission or Omission Errors

We created a model to spatially identify where the potential commission or omission errors are in NLCD 2006 for the cultivated cropland class. The general logic of the model (Figure 3a) is that if NLCD 2011, CDL 2011, and CDL 2006 all labeled a pixel as non-cultivated cropland, and the MIICA spectral change detection using Landsat images shows no change between circa 2006 and circa 2011, and the NLCD 2006 classification is cultivated crop, then there is a very high likelihood that the pixel was misclassified as cropland by NLCD 2006. Subsequently, it is identified and labeled as a pixel with potential commission error.
For identifying potential omission error (Figure 3b), we took advantage of the high accuracy of the mapped CDL [7,27] in building the model. If both NLCD 2011 and CDL 2011 mapped a pixel as cultivated crop, and MIICA change detection results show no spectral change between 2006 and 2011, and NLCD 2006 did not classify it as agricultural class (81 or 82), then the model identifies this pixel as misclassified in NLCD 2006 and identifies it as a potential omission error.
Figure 3. (a) Flowchart of the developed method for identifying potential commission errors in the NLCD 2006 Cultivated Class; and (b) flowchart of the developed method for identifying potential omission errors in the NLCD 2006 Cultivated Class.
Remotesensing 08 00101 g003
After the model output was generated, we computed several descriptive statistics to quantify the classification quality of NLCD 2006, including total combined number of pixels identified as commission and omission based on the model results, total combined percentage of the pixels identified by the model as commission and omission in NLCD 2006, and the total combined percentage of the pixels identified by the model as commission and omission for cultivated crops (Class 82) in NLCD 2006. We also analyzed the potential causes of classification errors in NLCD 2006 using a “from and to” approach. The “from” is the land cover label in NLCD 2006 and the “to” is the NLCD 2011 label. This approach allows identification of possible causes of classification errors regarding the land cover classification process.

3.2. Method for Assessing Model Performance

In order to assess the model performance, a procedure was designed and implemented that consists of three steps: a sampling process, an interpretation protocol, and an analysis procedure. Eighty sample units were randomly selected for the assessment: among them, 40 units both for potential commission error and for omission error for each path/row (Figure 4). Each sample unit consists of a 3 × 3 Landsat pixel block with a homogenous land cover type (contains only one land cover class).
Once the sample units were generated, a reference land cover label for years 2006 and 2011 for each unit was assigned via interpretations from high-resolution imagery from the National Agriculture Imagery Program (NAIP), Google Earth, Bing Maps, and Flash Earth as close to the interpretation date as possible. Figure 5 provides an interpretation example and the corresponding datasets and images used. Based on the reference data, we compared the commission and omission errors identified by the model of each sample unit to the corresponding reference data. If the sample unit with potential commission error is confirmed by the reference data (same for the pixel with potential omission error), then the validation code 1 (or 2 for omission) was assigned. If the potential commission or omission point is not confirmed by reference data, then a code of −9998 was assigned (−9999 for omission).
A set of accuracy parameters that can be interpreted as probabilities defined for the map being assessed in this study includes the following:
(a)
Probability of a commission error, which is the conditional probability that a randomly selected point classified as category i by the map is classified as category k by the reference data ( p i k / p i + . ) ,
where p i + . = k = 1 q p i k , is the proportion of the area mapped as land-cover class i.
(b)
Probability of an omission error, which is the conditional probability that a randomly selected point classified as category j by the reference data is classified as category k by the map ( p k j / p + j . )
where p + j . = k = 1 q p k j , is the true proportion of an area in land-cover class j (q=number of land-cover classes). These two statistical measures are used to quantify the accuracy of the model performance from this study, and the analysis results are reported in section four of this paper.
Figure 4. One path/row example of the spatial distribution of the model’s assessment protocol for path/row 42/35. Commission error samples are represented in blue and omission error samples are represented in brown.
Remotesensing 08 00101 g004
After the comparisons and analyses were complete for each path/row, we assessed the quality of NLCD 2006 cropland classification including agreement/disagreement for potential commission between reference data and model output, and agreement/disagreement for potential omission between reference data and model output. In addition, for each pixel we identified the cause of the commission or omission error. We were particularly interested in knowing if the differences were due to a change of land cover in 2006 or 2011, or if they were due to classification errors from NLCD 2001 or NLCD 2011.
Figure 5. Provides an interpretation example and the corresponding datasets and images used. Based on the reference data, we compared the commission and omission error identified by the model of each sample unit to the corresponding reference data: (a) commission pixels; (b) NLCD 2006; (c) NLCD 2011; (d) NLCD 2001; (e) CDL 2011; (f) 8 October 2010, Landsat scene; (g) CDL 2006; (h) 13 October 2006, Landsat scene; (i) 5 July 2006, Google Earth image; and (j) 15 July 2010, Google Earth image.
Remotesensing 08 00101 g005

4. Results

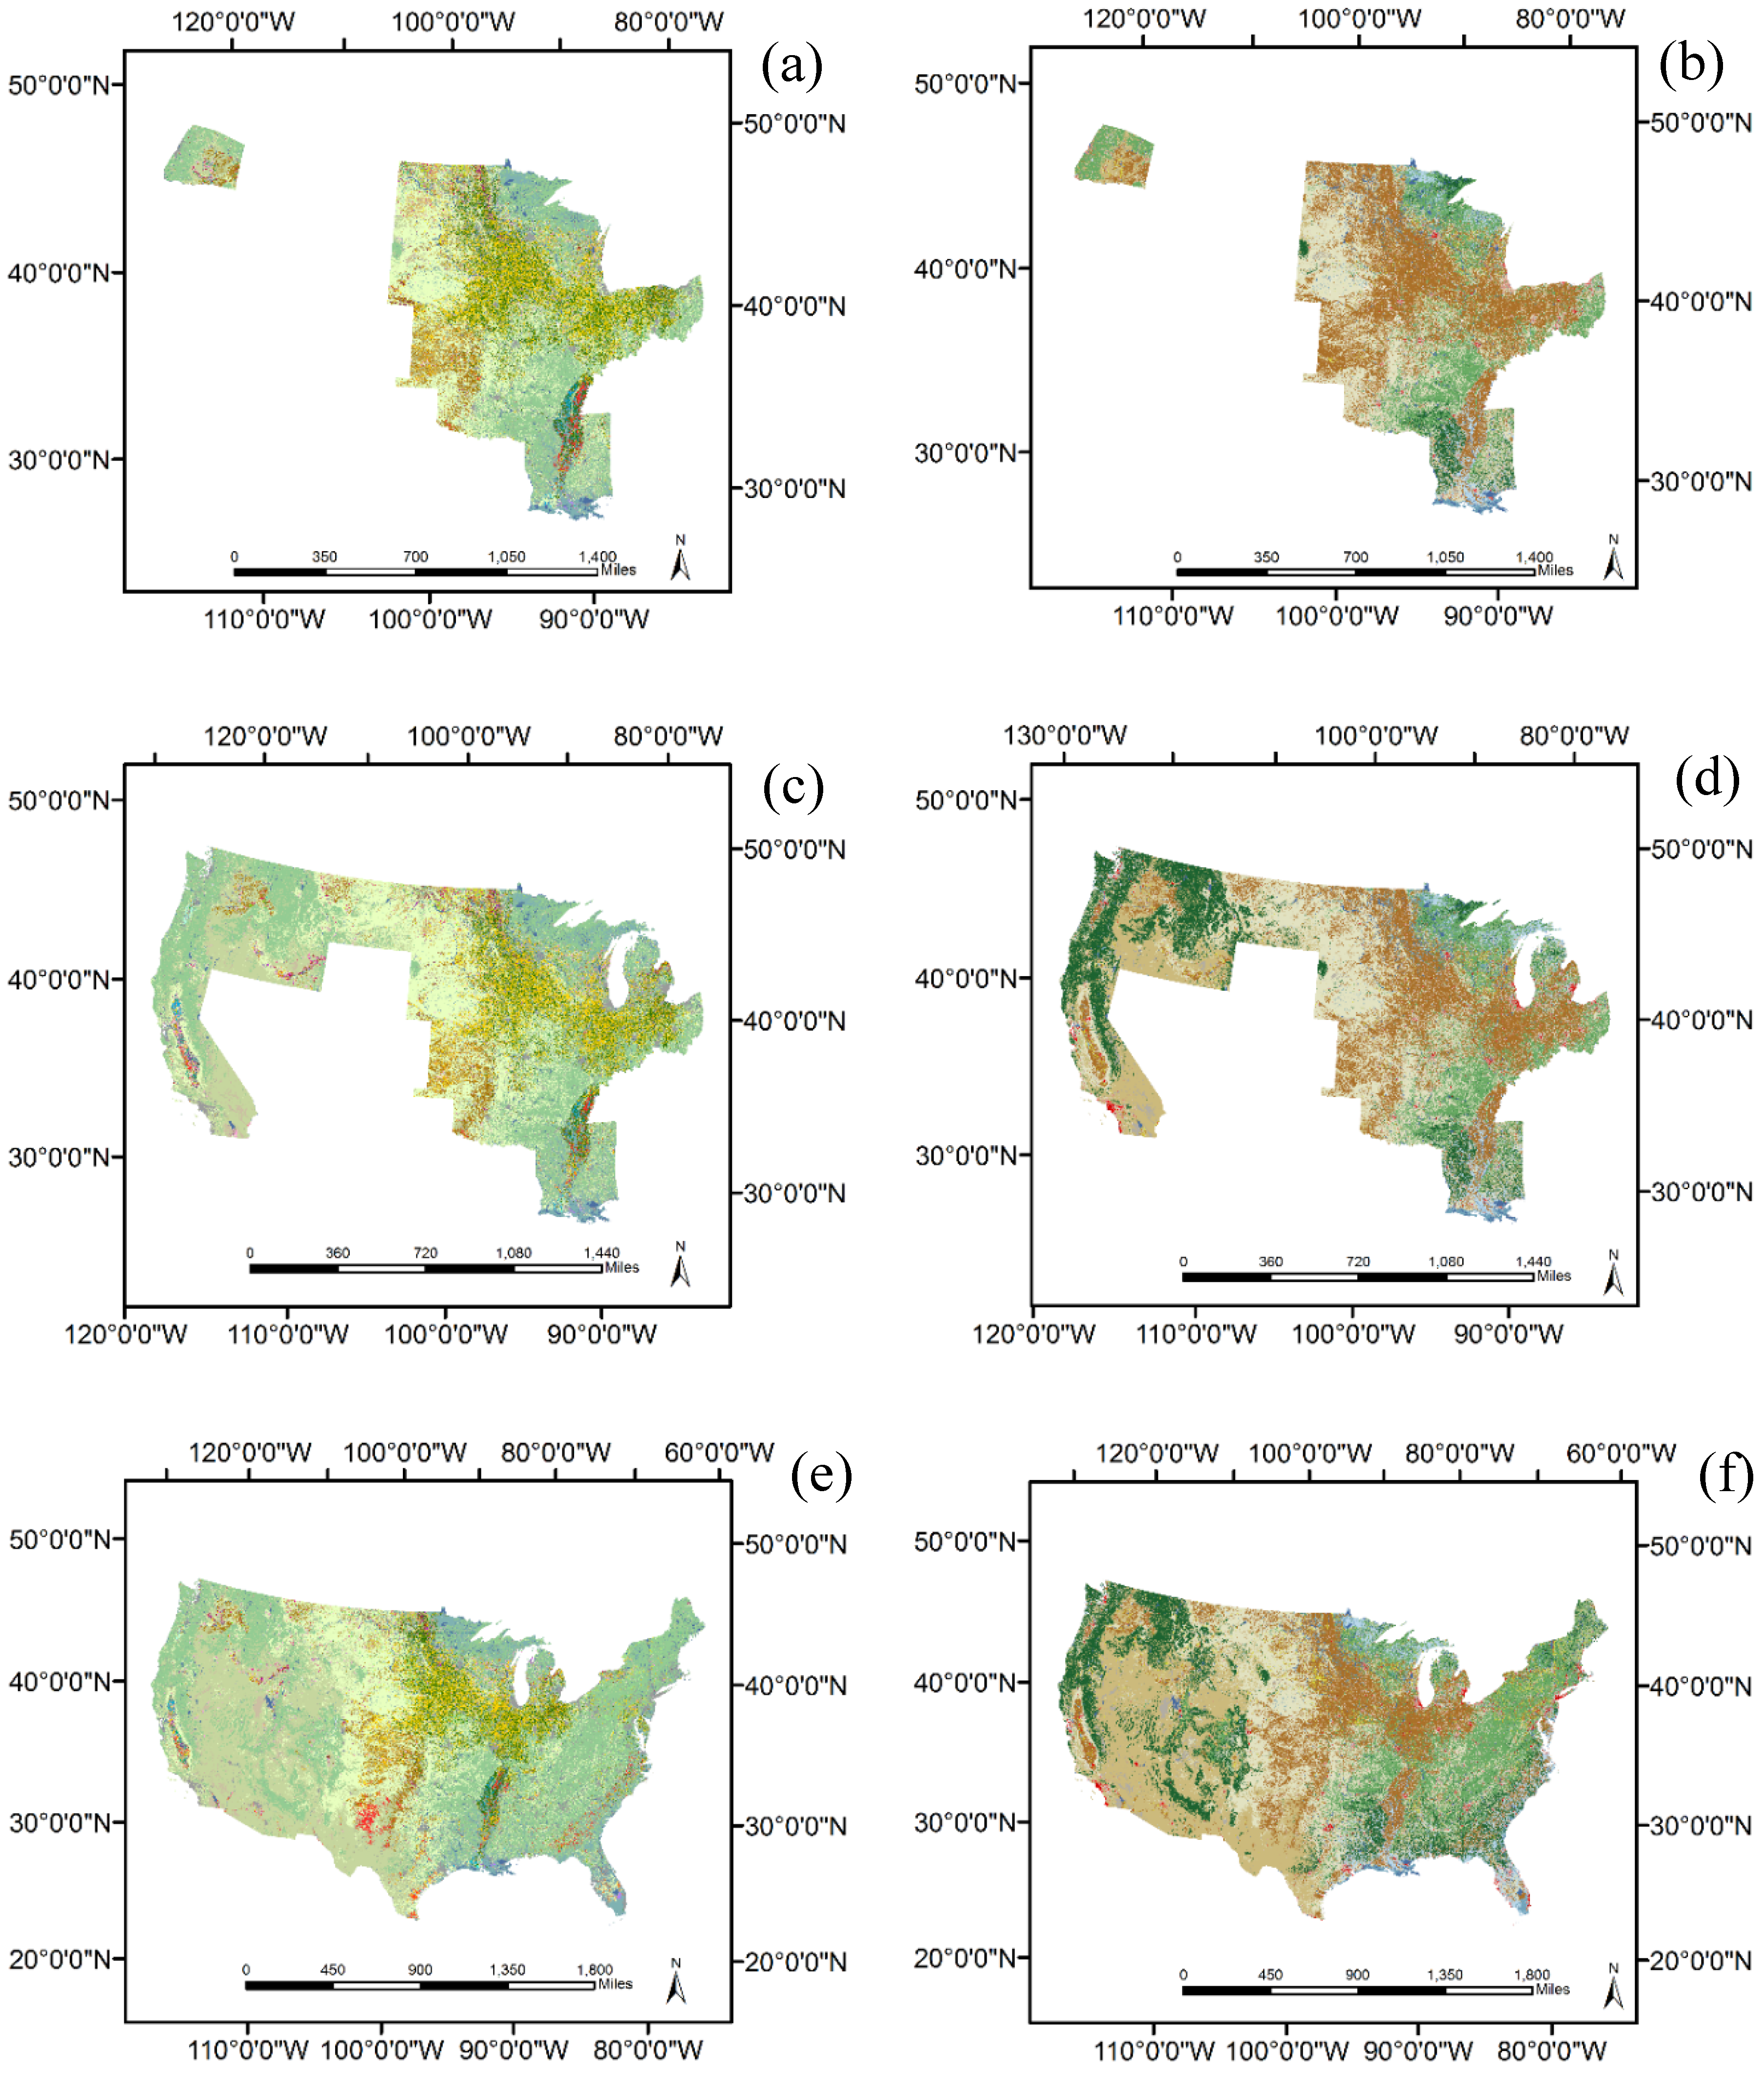
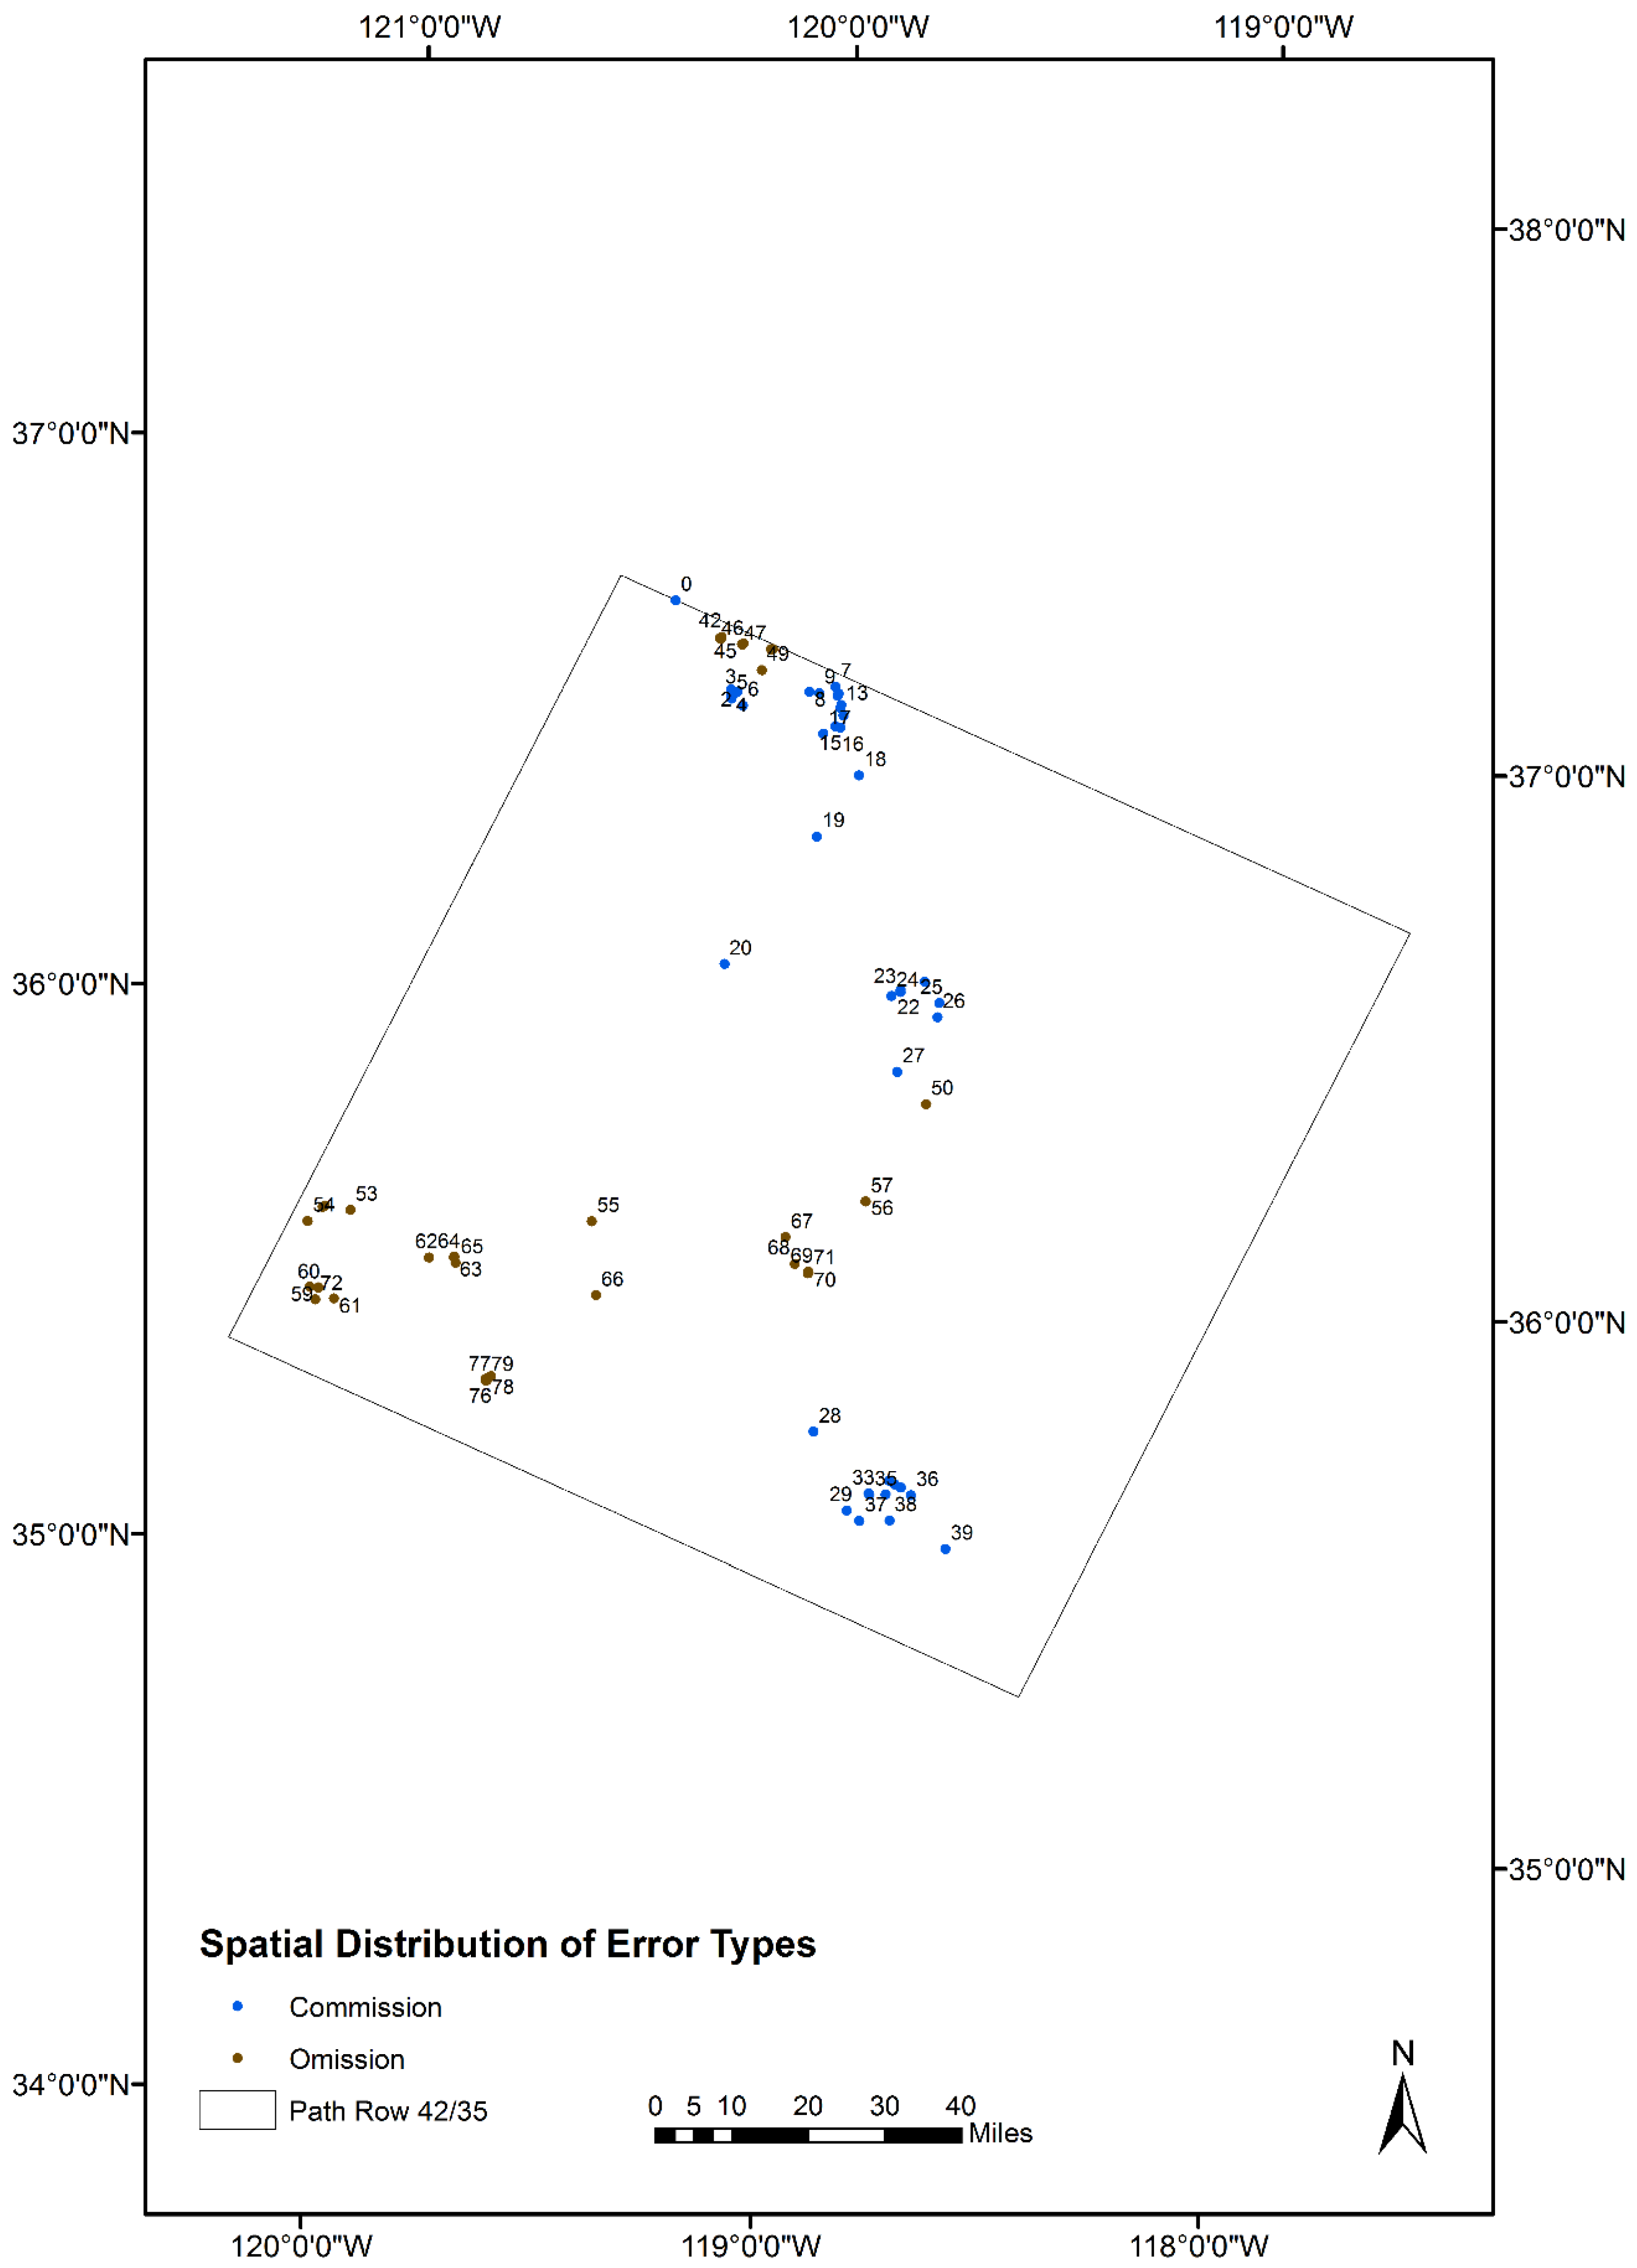
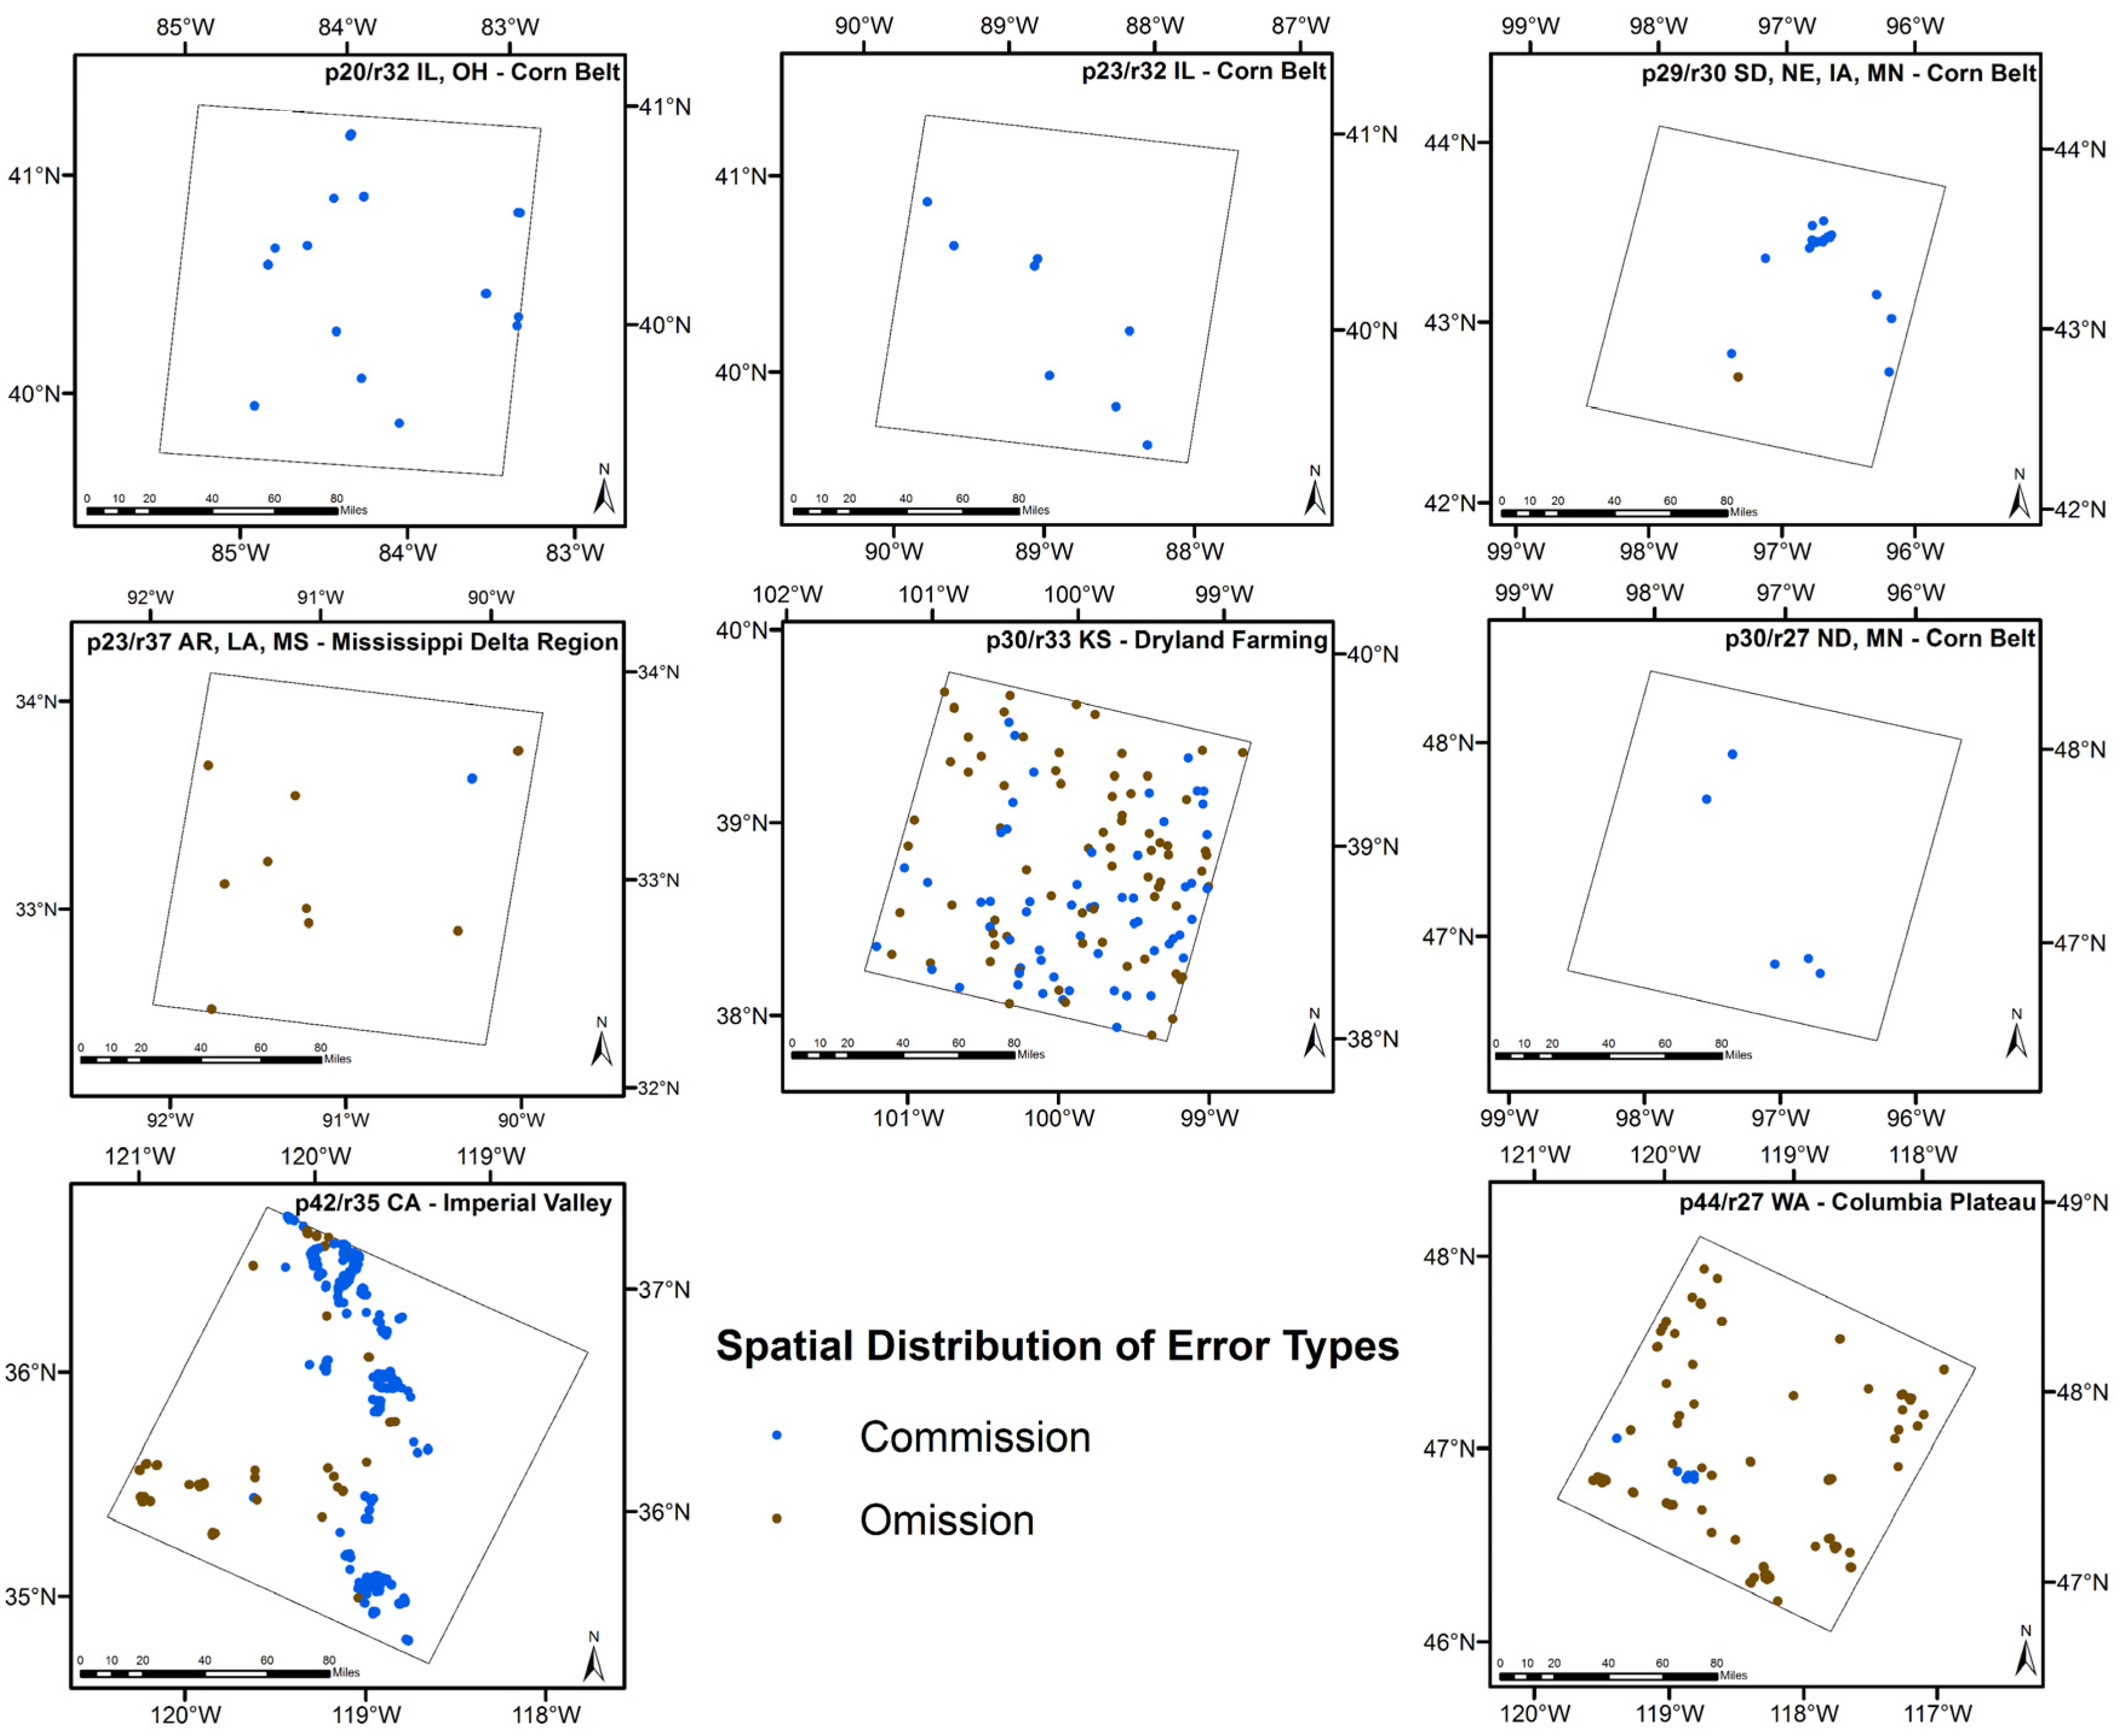
4.1. Spatial Pattern and Statistical Measures

Eight path/rows of NLCD 2006 were analyzed for commission and omission errors of the cultivated crop class (Figure 6). Path/rows with the most commission or omission errors included path/row 30/33 (KA), 42/35 (CA), and 44/27 (WA) where the cultivated cropland accounts for less than 53% of the total area (Table 1). Pixel counts for these three path/rows ranged from 6833 to 510,029 (Table 2c). In contrast, commission or omission error was much less in the agricultural dominant areas of path/row 20/32 (IL, OH), 23/32 (IL), and 29/30 (SD, NE, IA, MN) of the Corn Belt region (Figure 6), with pixel counts ranging from 131 to 770 pixels (Table 2c).
Figure 6. Spatial location of pixels identified as commission and omission for the cultivated crops in NLCD 2006. Commission error samples are represented in blue and omission error samples are represented in brown. The symbols used in this figure (row 2 columns 2) are not to proportion but for illustration purposes only.
Remotesensing 08 00101 g006
The total combined percentage of the pixels identified by the model as commission and omission for cultivated crops (Class 82) in NLCD 2006 is shown in Table 2i. The highest error rate is 2.04% in path/row 30/33 (KS), followed by 42/35 (0.11%) and 44/27 (0.04%), with the remaining path/rows having less than a 0.002% error rate. In addition, the percentage of pixels identified by the model as either commission or omission errors was also calculated using all pixels in each path/row. In this case for omission in NLCD 2006 (Table 2d), the highest number is 0.48% in path/row 30/33 (KS), followed by 44/27 (0.01%) and 42/35 (0.0034%), with the remaining five path/rows having less than 0.00045%. Considering the total number of pixels mapped in each path/row, the overall percentage of potential errors for the cultivated cropland is very low due to high quality training data from CDL in those path/rows.
Path/row 30/33 (KS) has the highest potential commission and omission errors among all path/rows (Table 2c). Land cover classification in this area is rather difficult because this path/row is located in western Kansas where the crop types include both irrigated and dryland farming [28]. As water resources become depleted, the farmers might revert to new technologies and cropping systems so that the crop types can be variable from time to time [28]. The major land cover type besides cropland is the herbaceous grassland, which spectrally is often very similar to the dryland cropland (e.g., winter wheat) in this region. Thus, the model may not be able to distinguish these two types of land cover. Path/rows 42/35 (CA) and 44/27 (WA) also have higher rates of commission and omission error (Table 2c). Like 33/33 (KS), both of these path/rows contain many land cover types in addition to cropland; therefore, it is difficult to achieve a high classification accuracy for these areas.
Table 2. (a) Total number of pixels identified as omission based on the model results; (b) Total number of pixels identified as commission based on the model results; (c) Total combined number of pixels identified as commission and omission based on the model results; (d) Total percentage of the pixels identified by the model as omission in NLCD 2006; (e) Total percentage of the pixels identified by the model as commission in NLCD 2006; (f) Total combined percentage of the pixels identified by the model as commission and omission in NLCD 2006; (g) Total percentage of the pixels identified by the model as omission for cultivated crops (Class 82) in NLCD 2006; (h) Total percentage of the pixels identified by the model as commission for cultivated crops (Class 82) in NLCD 2006; (i) Total combined percentage of the pixels identified by the model as commission and omission for cultivated crops (Class 82) in NLCD 2006.
Descriptive Statistics29/30 SD, NE, IA, MN23/32 IL20/32 IL, OH30/27 ND, MN23/37 AR, LA, MS30/33 KS42/35 CA44/27 WA
(a)21000272309,86929236655
(b)74923748213133200,16013,630178
(c)770237482131305510,02916,5536833
(d)0.000034%0.00%0.00%0.00%0.00045%0.48%0.0034%0.01%
(e)0.0012%0.00033%0.00071%0.00021%0.000054%0.31%0.016%0.00019%
(f)0.0012%0.00033%0.00071%0.00021%0.00050%0.79%0.02%0.01%
(g)0.000072%0.00000%0.00000%0.00000%0.0013%1.24%0.02%0.04%
(h)0.0026%0.00063%0.0015%0.00038%0.00016%0.80%0.09%0.0011%
(i)0.0027%0.00063%0.0015%0.00038%0.0015%2.04%0.11%0.04%

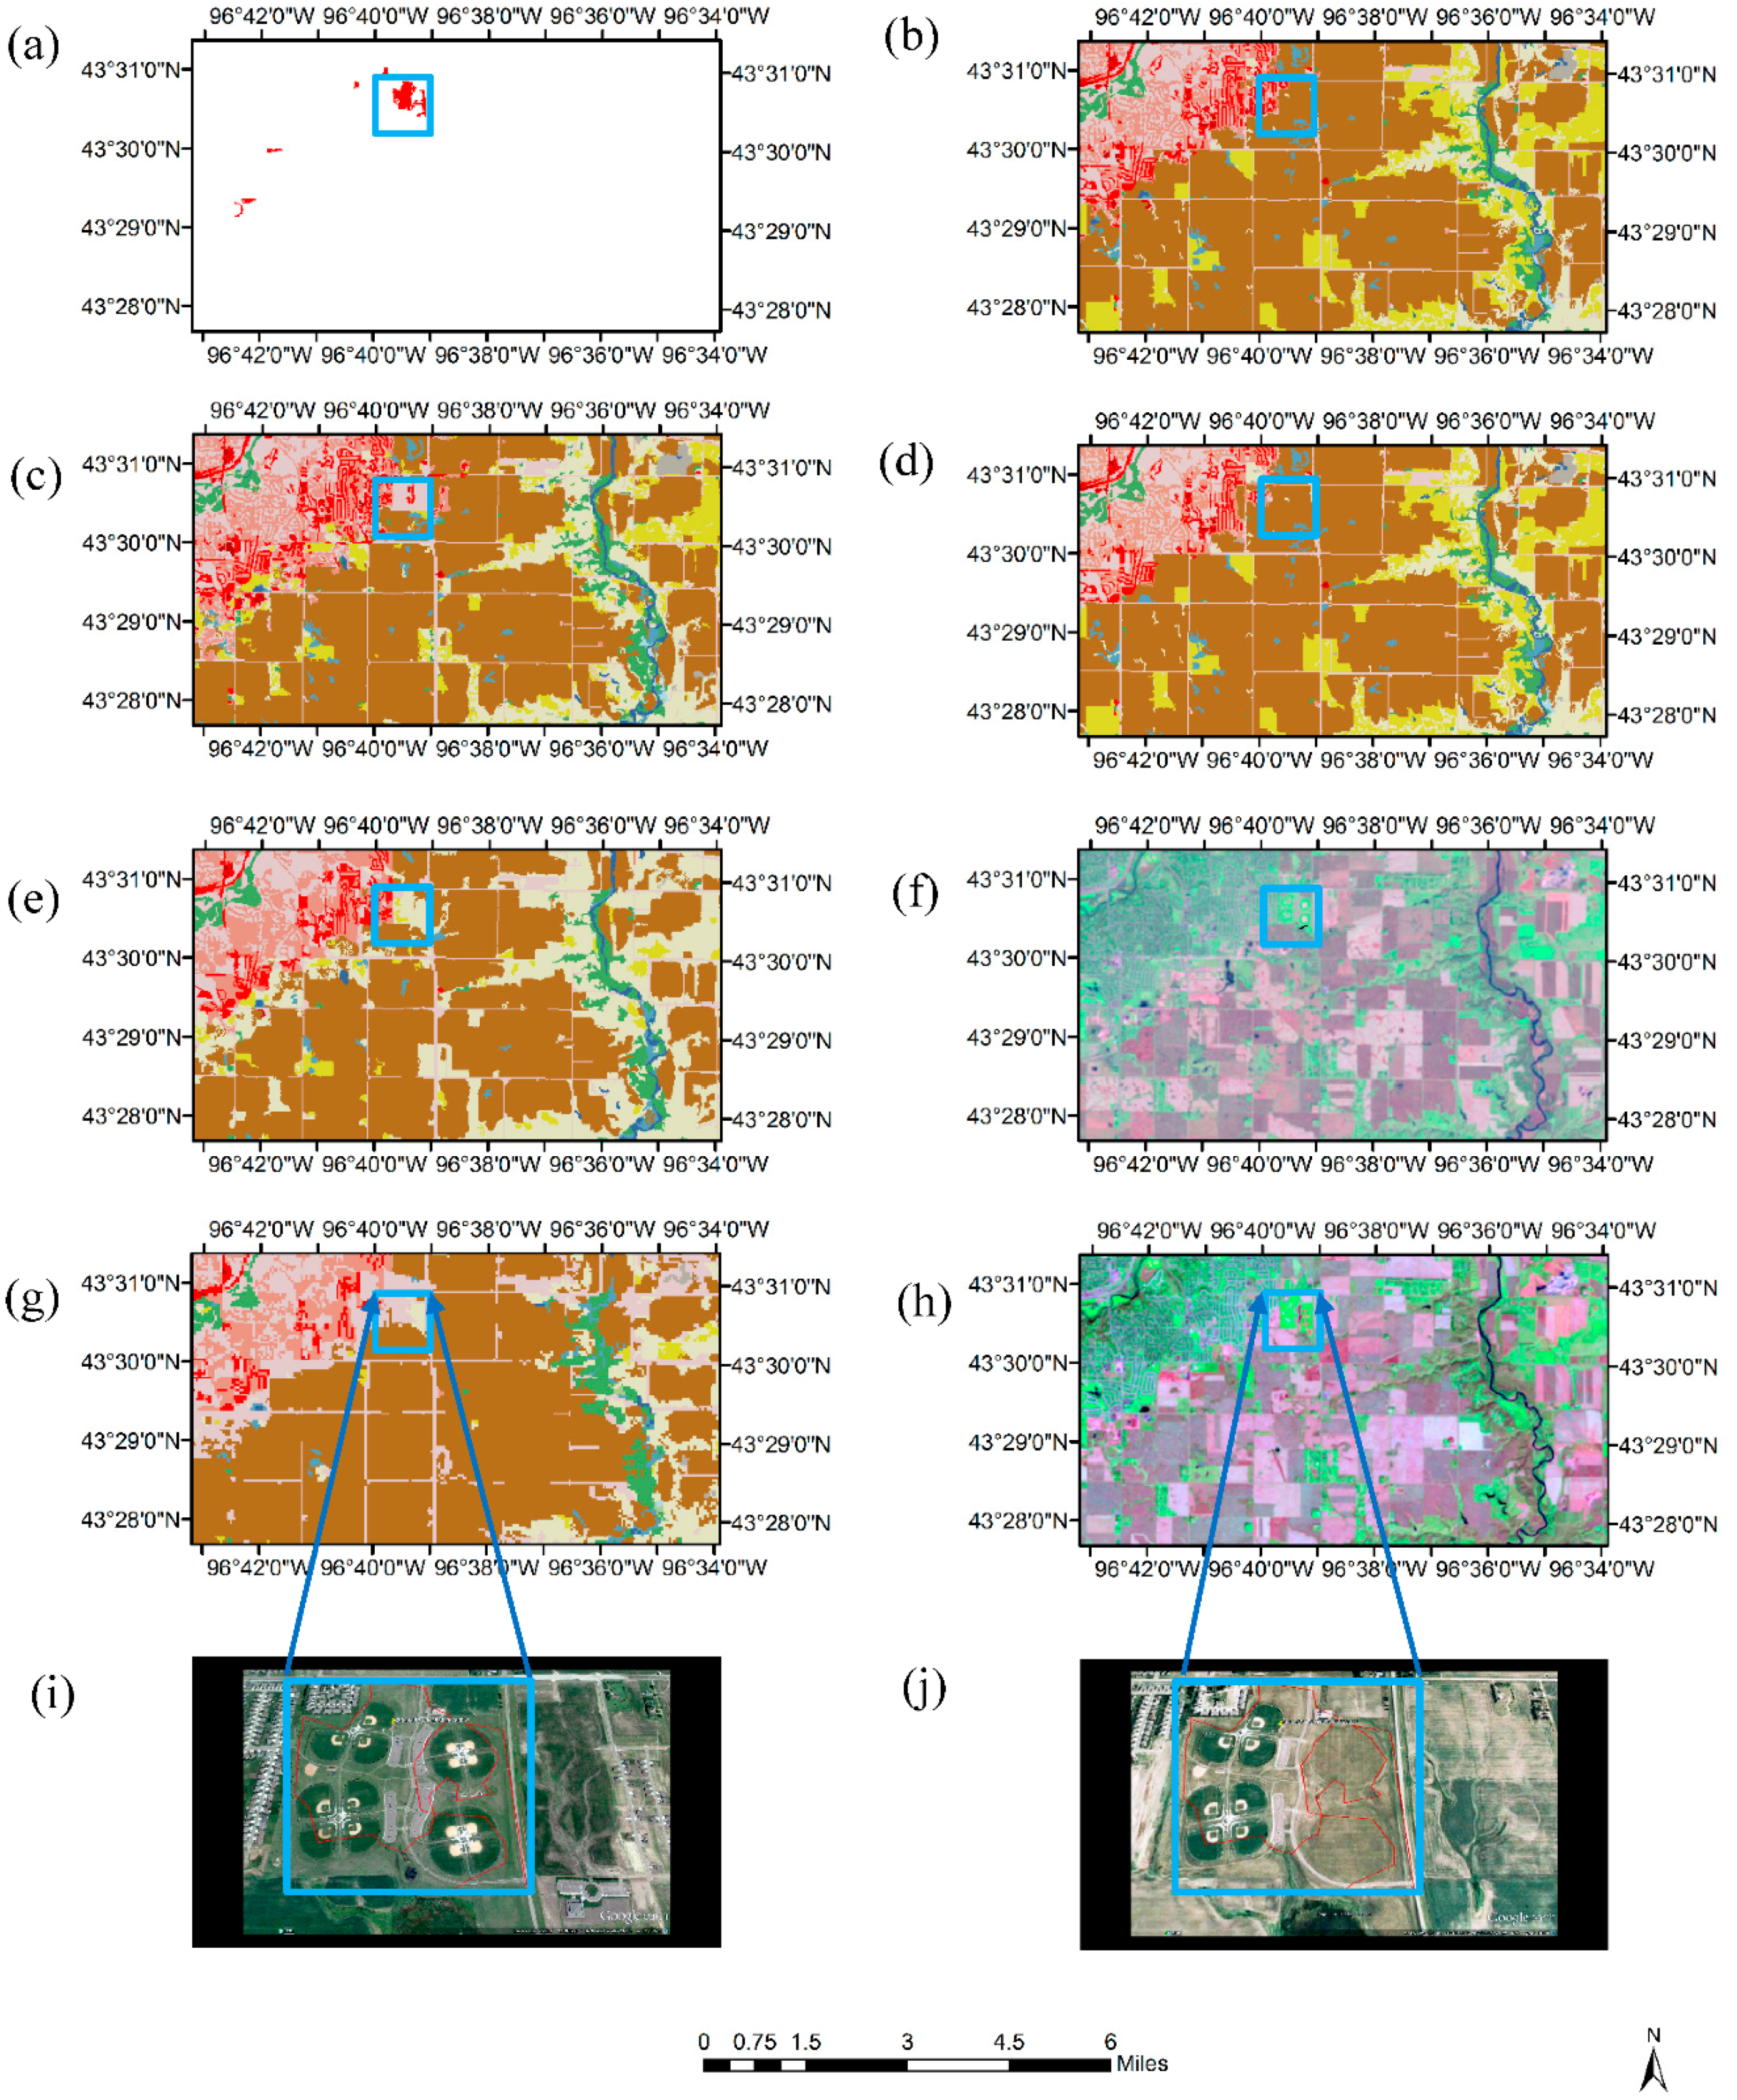
4.2. Sources of Commission and Omission Errors

A majority of commission errors in the NLCD 2006 cultivated cropland class was from the developed urban classes (Table 3); these misclassified cropland pixels were located in areas at or near the urban fringe within 3 km of urban areas. The second most common “from-to” error was from the herbaceous class, likely related to the spectral and phenological similarities between herbaceous vegetation and croplands. The third most common error was from agricultural to barren, mostly related to spectral confusion between barren land and tilled lands.
The majority of omission errors are from herbaceous to cropland (Table 3), which is likely due to spectral similarity of the two classes. The second highest number of omission errors is from shrub to cropland, followed by forest to cropland, wetland to cropland, and water to cropland.
Examination of the pixels identified as commission or omission errors in NLCD 2006 indicated that the majority of the errors are legacy errors from NLCD 2001 (Figure 7). The other errors were due to misclassification of change in NLCD 2006, or were mapped correctly in NLCD 2001 and NLCD 2006 but misclassified in NLCD 2011 (Figure 7).
Table 3. Commission and Omission Agreement/Disagreement From and To Classes.
From and To ClassesCommission Agreement Total PixelsCommission Disagreement Total PixelsOmission Agreement Total PixelsOmission Disagreement Total Pixels
Cropland to Urban23538
Cropland to Herbaceous930
Cropland to Barren1
Herbaceous to Cropland 7826
Shrub to Cropland 2034
Forest to Cropland 66
Wetland to Cropland 45
Water to Cropland 2
Figure 7. Source of commission and omission errors.
Remotesensing 08 00101 g007

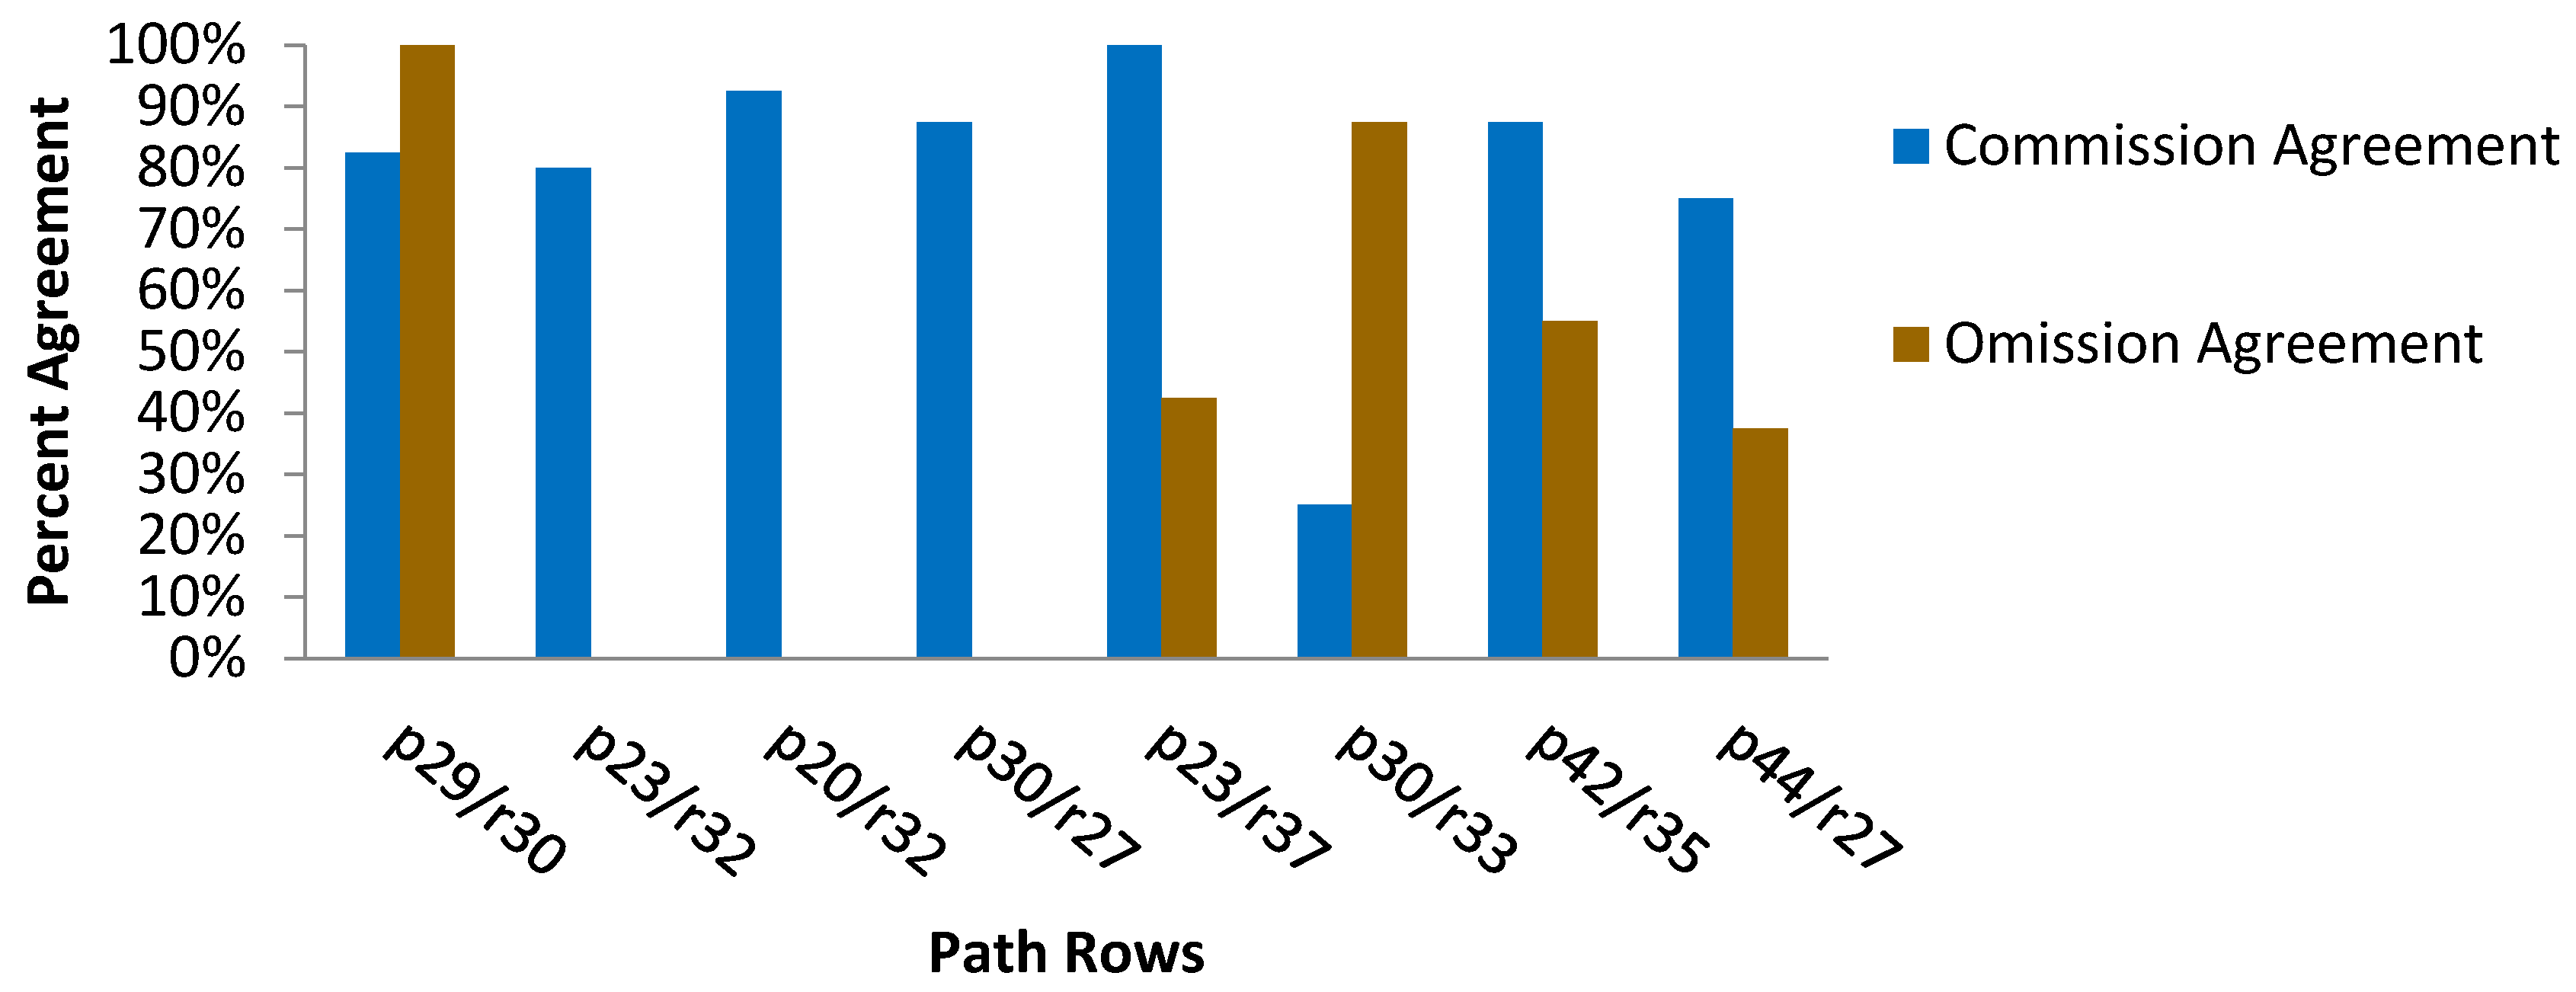
4.3. Evaluation of Model Performance

The effectiveness of the model was assessed by comparing model-identified potential commission/omission errors against the independent referenced data. All eight path/rows covering a range of different landscapes were evaluated. Each path/row had 80 sample points, and a total of 640 points were used for validation.
The average agreement between modeled and reference data (commission error) for the eight path/rows was 79%, but the agreement of individual path/rows varied from 25% to 100% (Figure 8). The path/rows located in the agricultural dominant areas 29/30 (SD, NE, IA, and MN) and 23/32 (AR, LA, and MS) had an agreement greater than 79%. Path/rows located in areas that have more diverse land cover types are 30/33 (KS) and 44/27 (WA), both of which had an agreement of less than 79% (Figure 8).
Figure 8. Agreement/disagreement between referenced data and model output (commission and omission).
Remotesensing 08 00101 g008
The average agreement between modeled and reference data (omission error) for all eight path/rows was 40%. The highest percentage of agreement was 100% for path/row 29/30 (SD, NE, IA, and MN), and the lowest percentage was 37.5% for 44/27 (WA), reflecting the difficulty in correctly identifying cultivated crops in some of the more heterogeneous areas (Figure 8). There are no sample points in path/rows 23/32 (AR, LA, and MS), 20/32 (IL and OH), and 30/27 (ND and MN), because the output file of model-identified omission error was spatially filtered using a 16-pixel Minimum Mapping Unit (MMU), which resulted in no omission sample units with a patch size smaller than 16 MMU (Figure 8).

5. Conclusions

Reporting land use and land cover change based on classification results using remotely sensed data requires that the classification errors be known and accounted for. An understanding of the quality of these datasets through accuracy assessments provides a scientifically defensible basis from which accurate conclusions and decisions can be made. In this research, we developed a method to assess the quality of the cultivated cropland class mapped in NLCD 2006 using a multi-source and multi-criteria approach. Unlike the traditional accuracy assessments for land cover classification using an error matrix approach, which does not provide a spatial distribution of the classification error and plausible causes of the misclassification, the method developed in this study allows spatially explicit identification of potential commission and omission errors of the mapped land cover classes.
The results from this research conclude that the majority of the commission and omission errors identified by the models are located in areas that have diverse land cover types. Conversely, areas that have cultivated cropland as the dominant land cover have very low error rates. Geographically, path/rows 20/32, 23/32, 29/30, and 30/27 within the Corn Belt region had consistently very low commission and omission errors (all less than 0.01%). Path/row 30/33 had the highest total combined percentage of the pixels as commission and omission for cultivated crops (Class 82) in NLCD 2006 (2.04%), followed by path row 42/35 (0.11%) and 44/27 (0.04%).
For model performance evaluation, results show that the average agreement between model-identified commission error and that from independent reference data was 79%, indicating the effectiveness of the developed model. On the other hand, the average agreement between model-identified omission error and that of reference data was 40%. Based on these results, it can be concluded that the NLCD 2006 cultivated crop class was mapped well in NLCD 2006, especially when the area contained a large number of pixels mapped as cultivated cropland. Overall, this analysis showed that nearly 2% of the pixels are likely misclassified. This finding provides new evidence that the cultivated crop class of NLCD 2006 can be used with relatively high confidence for a variety of agricultural applications.
The strength of the method is that it is simple and easy to operate yet capable of capturing major classification errors of cropland class of NLCD on a variety of landscapes. The main weakness of the method is that it relies heavily on the accuracy of the input datasets (e.g., CDL and NLCD 2011) to identify classification errors. For developing future NLCD, this method has been used to identify potential errors in the past NLCD product so that the errors can be fixed to serve as a base from which an accurate and consistent multi-temporal land cover and land cover change database can be developed in the future.

Acknowledgments

This work was supported by National Land Cover Database (NLCD) project. The authors would like to thank Joyce Fry, Jon Dewitz, Charles Larson and George Xian for their suggestions made to this study. We thank the three anonymous reviewers for their constructive comments. Any use of trade, firm, or product names is for descriptive purposes only and does not imply endorsement by the U.S. Government. Patrick Danielson and Limin Yang work performed under USGS contract G15PC00012, Suming Jin work performed under USGS contract G13PC00028.

Author Contributions

This research idea and design was conceived by Patrick Danielson and Limin Yang. The experiments were performed by Patrick Danielson. The data were analyzed and interpreted by Patrick Danielson and Limin Yang. The manuscript was written by Patrick Danielson and Limin Yang. Suming Jin, Collin Homer and Darrell Napton revised the initial version of the manuscript.

Conflicts of Interest

The authors declare no conflict of interest.

References

  1. Matthews, H.D.; Weaver, A.J.; Meissner, K.J.; Gillett, N.P.; Eby, M. Natural and anthropogenic climate change—Incorporating historical land cover change, vegetation dynamics and the global carbon cycle. Clim. Dyn. 2004, 22, 461–479. [Google Scholar] [CrossRef]
  2. Foley, J.A.; DeFries, R.; Asner, G.P.; Barford, C.; Bonan, G.; Carpenter, S.R.; Chapin, F.S.; Coe, M.T.; Daily, G.C.; Gibbs, H.K.; et al. Global consequences of land use. Science 2005, 309, 570–574. [Google Scholar] [CrossRef] [PubMed]
  3. Turner, B.L., II; Lambin, E.F.; Reenberg, A. The emergence of land change science for global environmental change and sustainability. Proc. Natl. Acad. Sci. USA 2007, 104, 20666–20671. [Google Scholar] [CrossRef] [PubMed]
  4. Homer, C.; Dewitz, J.; Fry, J.; Coan, M.; Hossain, N.; Larson, C.; Herold, N.; McKerrow, A.; VanDriel, J.N.; Wickham, J. Completion of the 2001 National Land Cover Database for the conterminous United States. Photogramm. Eng. Remote Sens. 2007, 73, 337–341. [Google Scholar]
  5. Fry, J.A.; Xian, G.; Jin, S.; Dewitz, J.A.; Homer, C.G.; Yang, L.; Barnes, C.A.; Herold, N.D.; Wickham, J.D. Completion of the 2006 National Land Cover Database for the conterminous United States. Photogramm. Eng. Remote Sens. 2011, 77, 858–864. [Google Scholar]
  6. Homer, C.; Dewitz, J.; Yang, L.; Jin, S.; Danielson, P.; Xian, G.; Coulston, J.; Herold, N.; Wickham, J.; Megown, K. Completion of the 2011 National Land Cover Database for the conterminous United States—Representing a decade of land cover change information. Photogramm. Eng. Remote Sens. 2015, 81, 346–354. [Google Scholar]
  7. Johnson, D.M.; Mueller, R. The 2009 Cropland Data Layer. Photogramm. Eng. Remote Sens. 2010, 76, 1201–1205. [Google Scholar]
  8. Wright, C.K.; Wimberly, M.C. Recent land use change in the Western Corn Belt threatens grasslands and wetlands. Proc. Natl. Acad. Sci. USA 2013, 110, 4134–4139. [Google Scholar] [CrossRef] [PubMed]
  9. Lark, T.J.; Meghan Salmon, J.; Gibbs, H.K. Cropland expansion outpaces agricultural and biofuel policies in the United States. Environ. Res. Lett. 2015, 10. [Google Scholar] [CrossRef]
  10. Faber, S.; Rundquist, S.; Male, T. Plowed Under—How Crop Subsidies Contribute to Massive Habitat Losses; Environmental Working Group: Washington, DC, USA, 2012; Available online: http://www.ewg.org/node/15941 (accessed on 23 June 2015).
  11. Cox, C.; Rundquist, S. Going, Going, Gone! Millions of Acres of Wetlands and Fragile Land go Under the Plow; Enviornmental Working Group: Washington, DC, USA, 2013. Available online: http://www.ewg.org/research/going-going-gone (accessed on 23 June 2015).
  12. Johnston, C.A. Wetland losses due to row crop expansion in the Dakota Prairie Pothole region. Wetlands 2013, 33, 175–182. [Google Scholar] [CrossRef]
  13. Johnston, C.A. Agricultural expansion—Land use shell game in the U.S. Northern Plains. Landsc. Ecol. 2014, 29, 81–95. [Google Scholar] [CrossRef]
  14. Stern, A.J.; Doraiswamy, P.C.; Hunt, E.R., Jr. Changes of crop rotation in Iowa determined from the United States Department of Agriculture, National Agricultural Statistics Service cropland data layer product. J. Appl. Remote Sens. 2012, 6. [Google Scholar] [CrossRef]
  15. Howard, D.M.; Wylie, B.K. Annual crop type classification of the U.S. Great Plains for 2000–2011. Photogramm. Eng. Remote Sens. 2014, 80, 537–549. [Google Scholar] [CrossRef]
  16. Wickham, J.D.; Stehman, S.V.; Gass, L.; Dewitz, J.; Fry, J.A.; Wade, T.G. Accuracy assessment of NLCD 2006 land cover and impervious surface. Remote Sens. Environ. 2013, 130, 294–304. [Google Scholar] [CrossRef]
  17. Stehman, S.V.; Wickham, J.D. Pixels, blocks of pixels, and polygons—Choosing a spatial unit for thematic accuracy assessment. Remote Sens. Environ. 2011, 115, 3044–3055. [Google Scholar] [CrossRef]
  18. Laingen, C. Measuring cropland change: A cautionary tale. Pap. Appl. Geogr. 2015, 1, 65–72. [Google Scholar] [CrossRef]
  19. Congalton, R.G. A review of assessing the accuracy of classifications of remotely sensed data. Remote Sens. Environ. 1991, 37, 35–46. [Google Scholar] [CrossRef]
  20. Friedl, M.A.; Brodley, C.E.; Strahler, A.H. Maximizing land cover classification accuracies produced by decision trees at continental to global scales. IEEE Trans. Geosci. Remote Sens. 1999, 37, 969–977. [Google Scholar] [CrossRef]
  21. Wang, Y.; Civco, D.L. Post-Classification of Misclassified Pixels by Evidential Reasoning—A GIS Approach for Improving Classification Accuracy of RS Data. In Proceedings of the XVIIth ISPRS Congress, Technical Commission VII: Interpretation of Photographic and Remote Sensing Data, Washington, DC, USA, 2–14 August 1992; Fritz, L.W., Lucas, J.R., Eds.; International Society for Photogrammetry and Remote Sensing: Bethesda, MD, USA, 1992; pp. 80–86. Available online: http://www.isprs.org/proceedings/XXIX/congress/part7/ (accessed on 20 June 2015). [Google Scholar]
  22. Xian, G.; Homer, C.; Fry, J. Updating the 2001 National Land Cover Database land cover classification to 2006 by using Landsat imagery change detection methods. Remote Sens. Environ. 2009, 113, 1133–1147. [Google Scholar] [CrossRef]
  23. Jin, S.; Yang, L.; Danielson, P.; Homer, C.; Fry, J.; Xian, G. A comprehensive change detection method for updating the National Land Cover Database to circa 2011. Remote Sens. Environ. 2013, 132, 159–175. [Google Scholar] [CrossRef]
  24. Quinlan, J.R. C4.5 Programs for Machine Learning; Morgan Kaufmann Publishers: San Mateo, CA, USA, 1993; p. 302. [Google Scholar]
  25. Multi-Resolution Land Characteristics Concortium (MRLC). National Land Cover Database (NLCD). Available online: http://www.mrlc.gov/ (accessed on 26 November 2012).
  26. Boryan, C.; Yang, Z.; Mueller, R.; Craig, M. Monitoring US agriculture—The US Department of Agriculture, National Agricultural Statistics Service, Cropland Data Layer Program. Geocarto Int. 2011, 26, 341–358. [Google Scholar] [CrossRef]
  27. Johnson, D.M. A 2010 map estimate of annually tilled cropland within the conterminous United States. Agric. Syst. 2013, 114, 95–105. [Google Scholar] [CrossRef]
  28. Rogers, D.H.; Lamm, F.R. Kansas irrigation trends. In Proceedings of the Annual Central Plains Irrigation Conference, 24th, Colby, KS, USA, 21–22 February 2012; Central Plains Irrigation Association: Colby, KS, USA, 2012; pp. 1–15. Available online: http://www.k-state.edu/irrigate/oow/cpic12.html (accessed on 20 June 2015). [Google Scholar]

