
Correction: Pimont, F. et al. Estimating Leaf Bulk Density Distribution in a Tree Canopy Using Terrestrial LiDAR and a Straightforward Calibration Procedure. Remote Sens. 2015, 7(6), 7995-8018


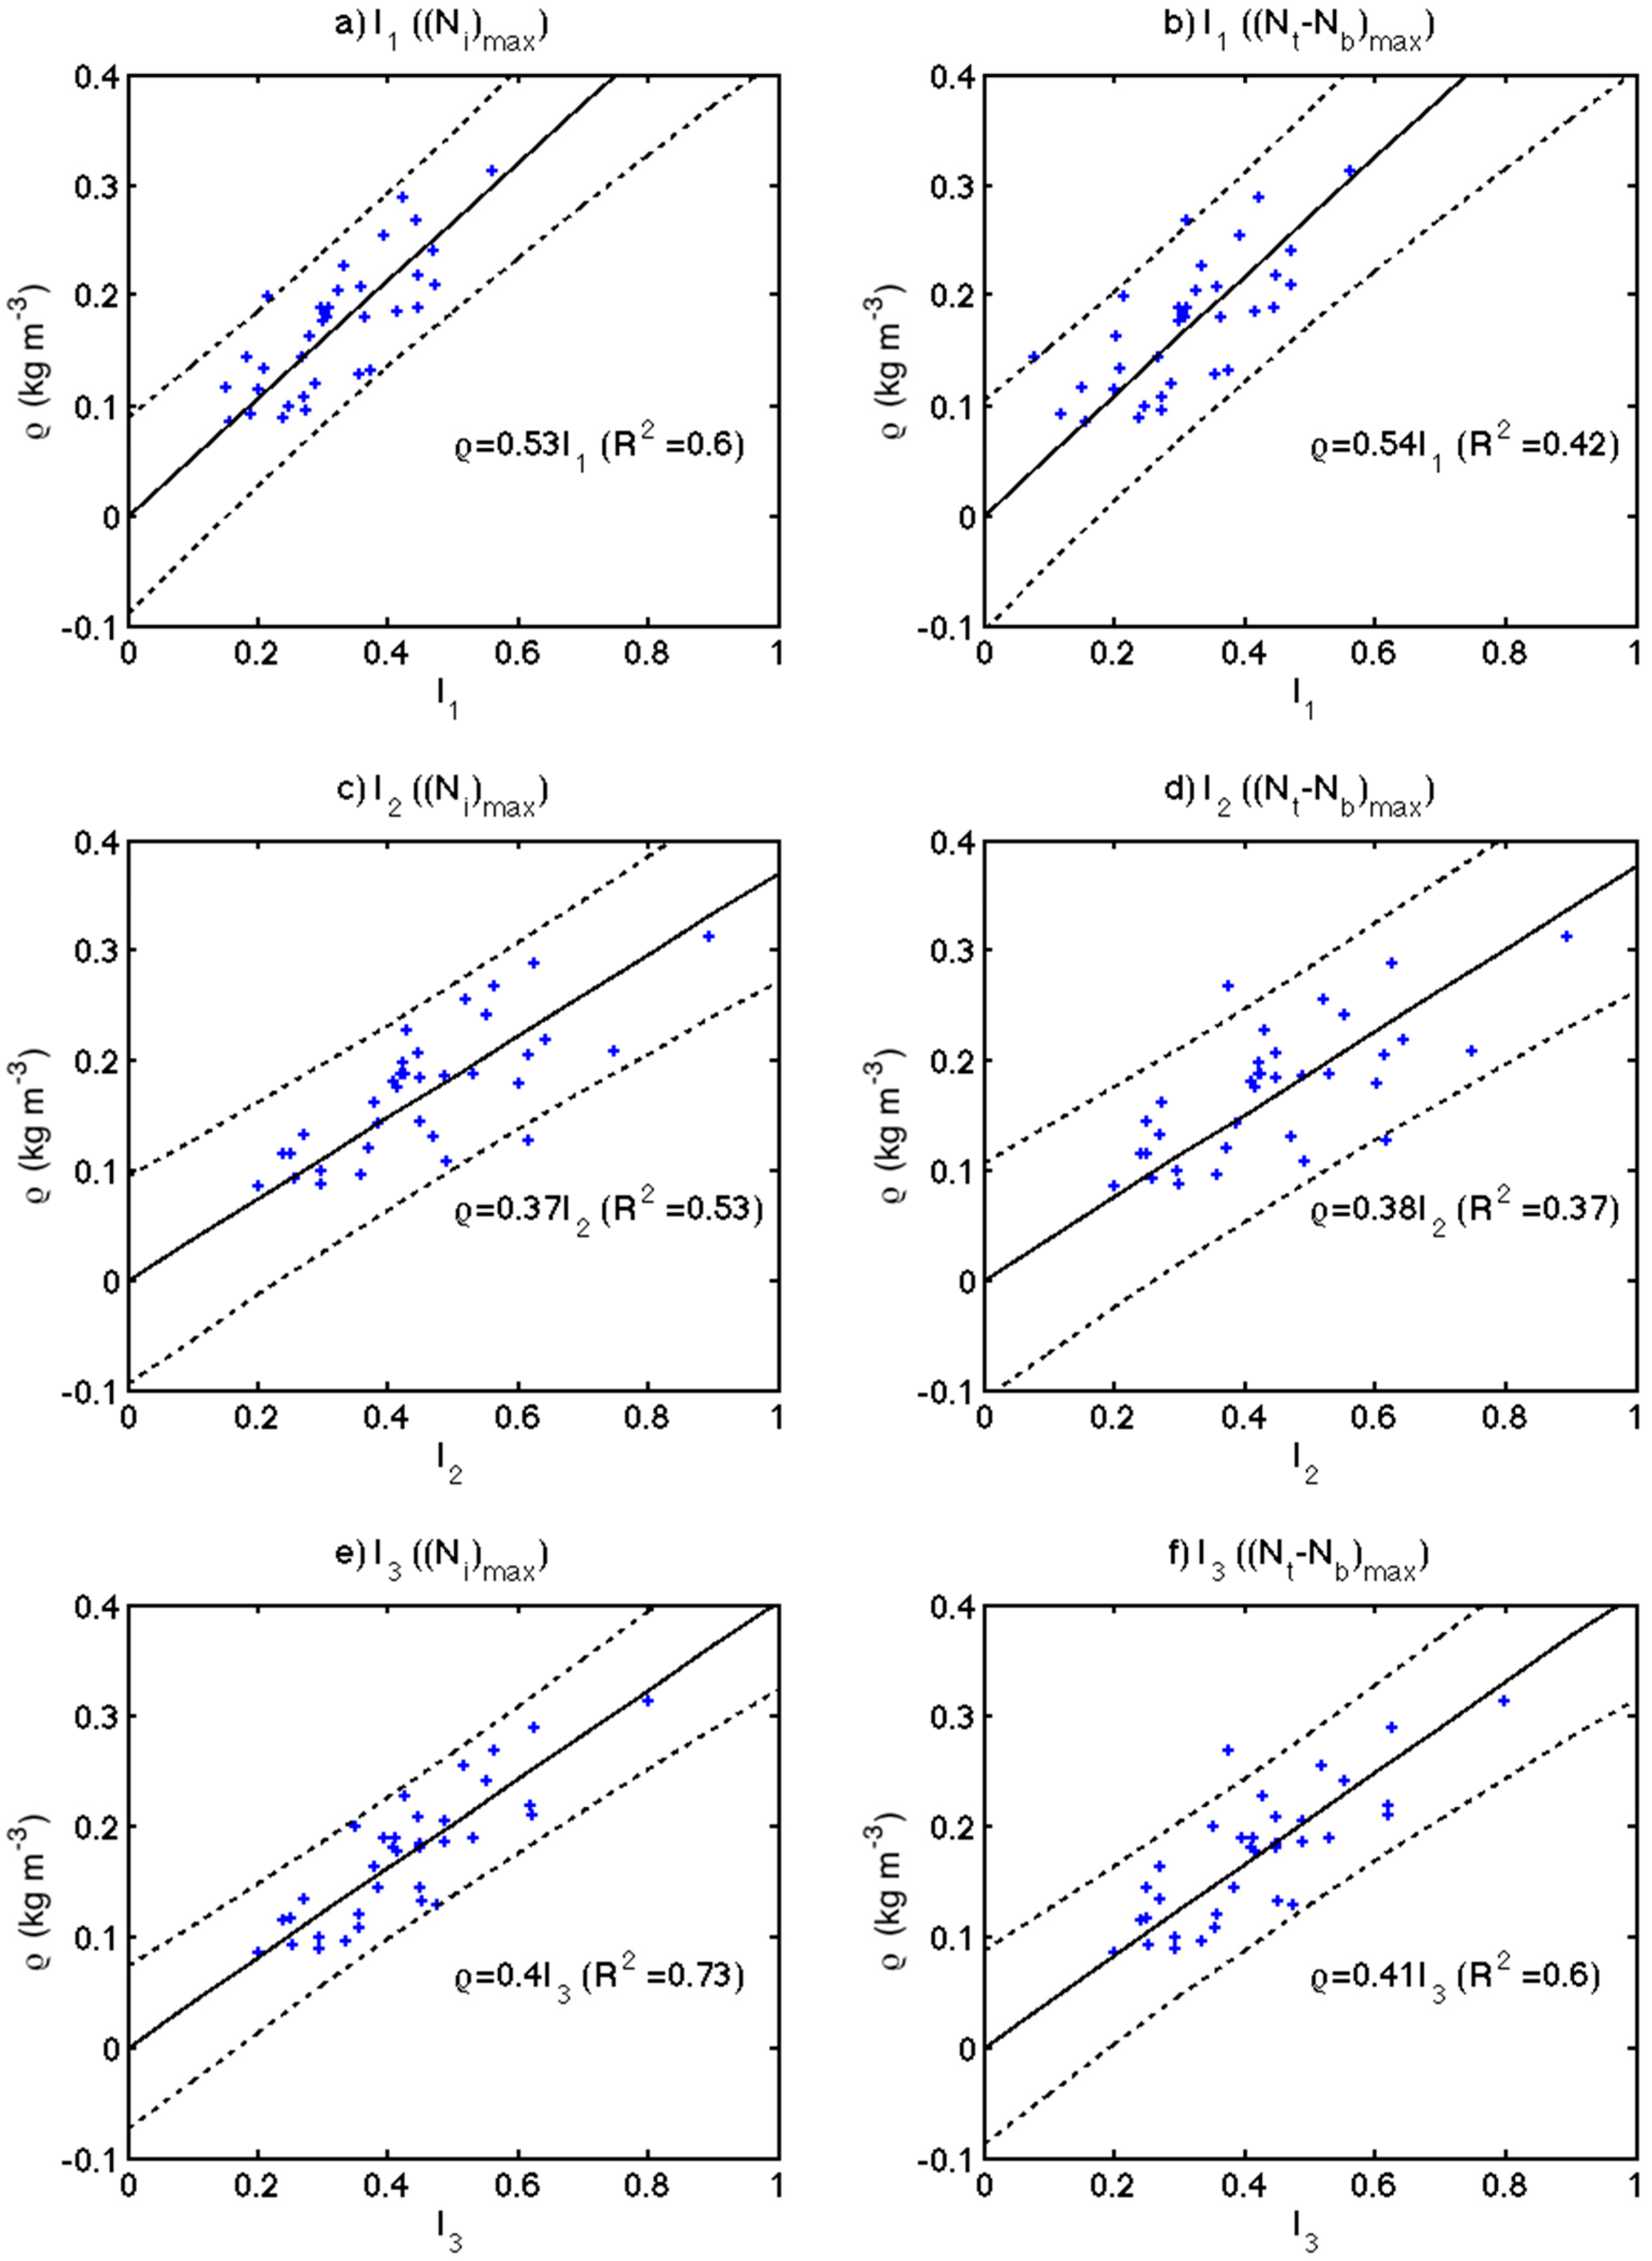
| Index I | Element Distribution | Criteria | Calibration Parameter | Standard Error | R2 | R2 (on CV with Ni>1000) |
|---|---|---|---|---|---|---|
| I1 | Spherical | (Ni)max | 0.534 | 0.0194 | 0.60 | −0.19 |
| I1 | Spherical | (Nt − Nb)max | 0.542 | 0.0239 | 0.42 | −0.16 |
| I2 | Spherical | (Ni)max | 0.370 | 0.0145 | 0.53 | 0.34 |
| I2 | Spherical | (Nt − Nb)max | 0.376 | 0.0172 | 0.37 | 0.36 |
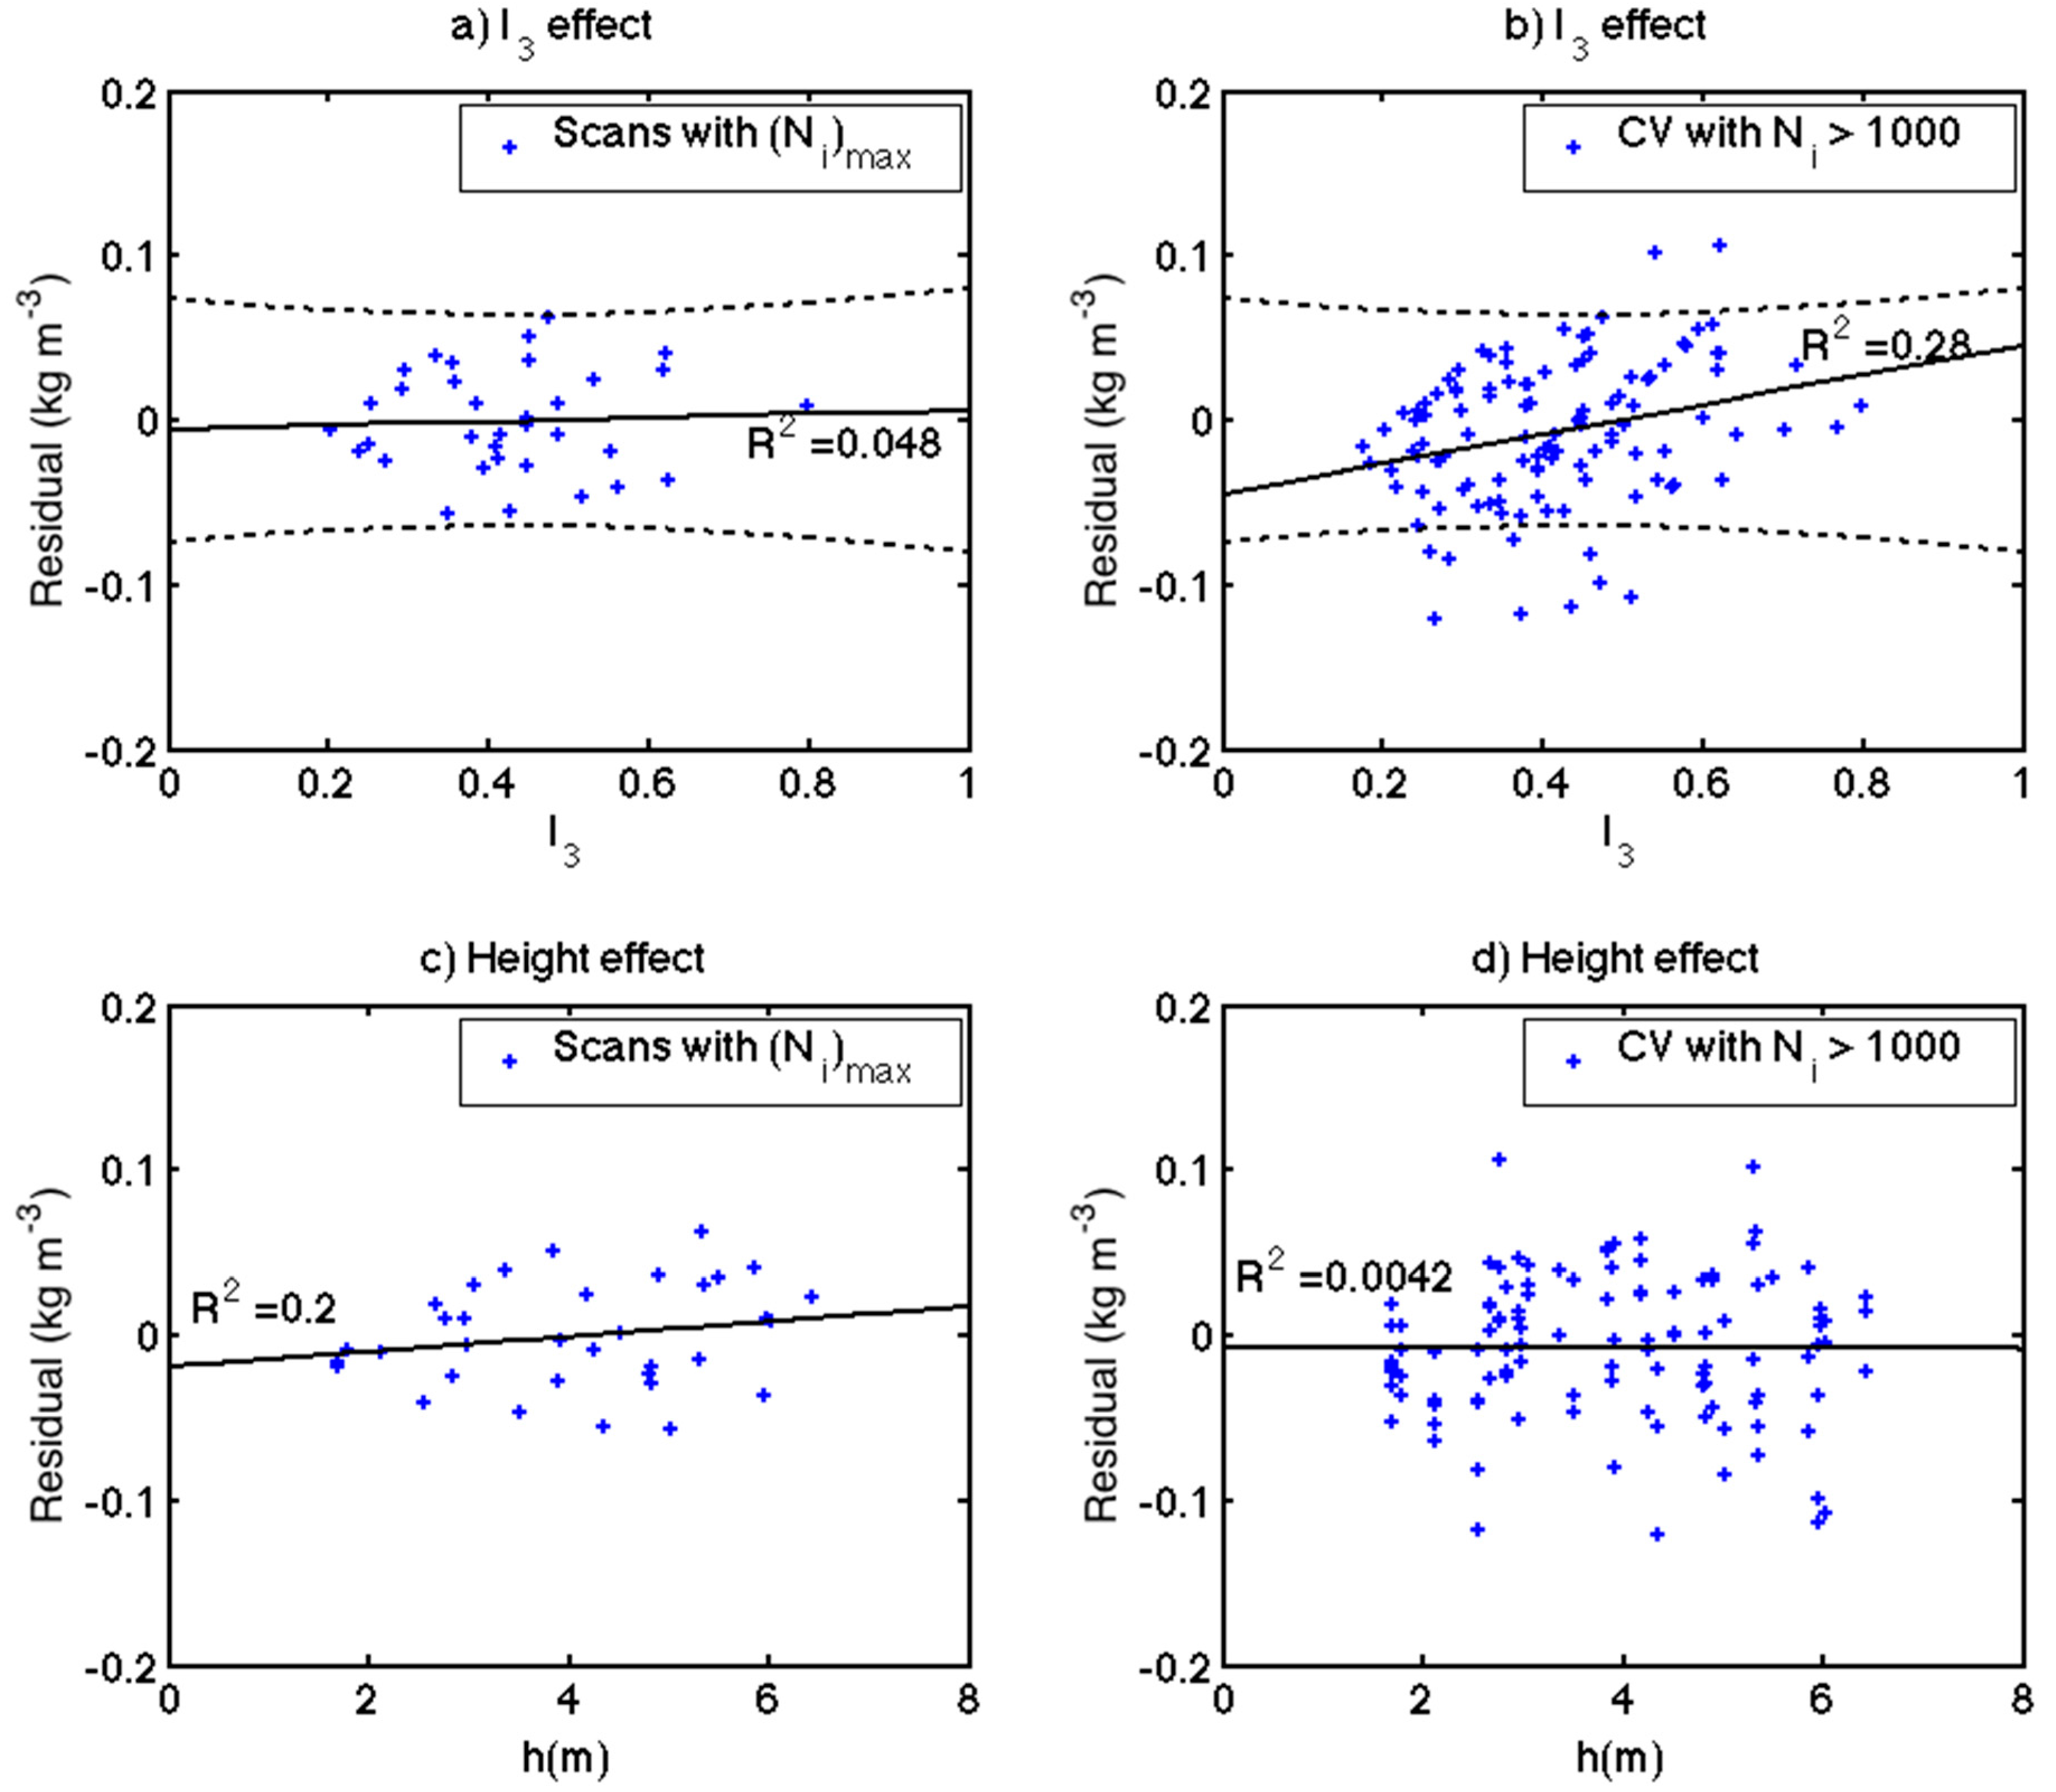
| I3 | Spherical | (Ni)max | 0.403 | 0.0120 | 0.73 | 0.45 |
| I3 | Spherical | (Nt − Nb)max | 0.412 | 0.0149 | 0.60 | 0.45 |
| I3 | Plagiophile | (Ni)max | 0.427 | 0.0122 | 0.74 | 0.32 |
| I3 | Uniform | (Ni)max | 0.432 | 0.0125 | 0.74 | 0.29 |
| I3 | Erectophile | (Ni)max | 0.380 | 0.0137 | 0.60 | 0.36 |
| I3 | Planophile | (Ni)max | 0.426 | 0.0220 | 0.22 | −0.78 |


Reference
- Pimont, F.; Dupuy, J.-L.; Rigolot, E.; Prat, V.; Piboule, A. Estimating leaf bulk density distribution in a tree canopy using terrestrial LiDAR and a straightforward calibration procedure. Remote Sens. 2015, 7, 7995–8018. [Google Scholar] [CrossRef]
© 2016 by the authors; licensee MDPI, Basel, Switzerland. This article is an open access article distributed under the terms and conditions of the Creative Commons by Attribution (CC-BY) license (http://creativecommons.org/licenses/by/4.0/).
Share and Cite
Pimont, F.; Dupuy, J.-L.; Rigolot, E.; Prat, V.; Piboule, A. Correction: Pimont, F. et al. Estimating Leaf Bulk Density Distribution in a Tree Canopy Using Terrestrial LiDAR and a Straightforward Calibration Procedure. Remote Sens. 2015, 7(6), 7995-8018. Remote Sens. 2016, 8, 64. https://doi.org/10.3390/rs8010064
Pimont F, Dupuy J-L, Rigolot E, Prat V, Piboule A. Correction: Pimont, F. et al. Estimating Leaf Bulk Density Distribution in a Tree Canopy Using Terrestrial LiDAR and a Straightforward Calibration Procedure. Remote Sens. 2015, 7(6), 7995-8018. Remote Sensing. 2016; 8(1):64. https://doi.org/10.3390/rs8010064
Chicago/Turabian StylePimont, François, Jean-Luc Dupuy, Eric Rigolot, Vincent Prat, and Alexandre Piboule. 2016. "Correction: Pimont, F. et al. Estimating Leaf Bulk Density Distribution in a Tree Canopy Using Terrestrial LiDAR and a Straightforward Calibration Procedure. Remote Sens. 2015, 7(6), 7995-8018" Remote Sensing 8, no. 1: 64. https://doi.org/10.3390/rs8010064
APA StylePimont, F., Dupuy, J.-L., Rigolot, E., Prat, V., & Piboule, A. (2016). Correction: Pimont, F. et al. Estimating Leaf Bulk Density Distribution in a Tree Canopy Using Terrestrial LiDAR and a Straightforward Calibration Procedure. Remote Sens. 2015, 7(6), 7995-8018. Remote Sensing, 8(1), 64. https://doi.org/10.3390/rs8010064