1. Introduction
Mangroves are salt-tolerant evergreen forests that grow in the intertidal zones of marine, coastal and estuarine ecosystems of tropical and subtropical areas [
1]. Mangrove forests are irreplaceable habitats that sustain unique biodiversity and provide crucial ecosystem services to humans [
2], yet despite their socio-economic value to coastal communities they are among the most highly threatened habitats globally [
3]. As of 2000, mangrove forests covered an area of approximately 137,760 km
2 in 118 countries and territories [
4], with the largest extent located in Asia. One of the most representative areas in Asia is the Mai Po Nature Reserve in the New Territories, which comprises the largest protected zone for mangroves in Hong Kong. As mangrove forests are extremely sensitive to changes in climate, water pollution and other environmental factors, analysis of their distribution and species composition has become an area of great interest to both researchers and governments [
5,
6,
7,
8,
9].
Given their geographic locations and physical structure, mangrove forests are often very difficult to access for the purpose of extensive field sampling; as a consequence, remote sensing is often used for mapping, classifying, assessing, and determining species composition of mangrove forests [
4,
10]. In recent years, numerous studies employing remote sensing methods have been undertaken to discover the economic and ecological values of mangrove ecosystems and to provide data useful for effective forest management [
11,
12]. Multispectral sensors on satellite platforms, including synthetic aperture radar (SAR), Landsat TM, and SPOT XS, are most commonly used in studies of mangrove forests due to their cost-effectiveness and large-scale coverage [
13], but such approaches are often inadequate for fine-scale species recognition. However, the commercial availability of high-spatial-resolution satellite imagery has created new opportunities for mapping mangrove forests at local scales [
14]. IKONOS and QuickBird satellite imagery have been combined with different image processing techniques to distinguish three mangrove species on the Caribbean coast of Panama, for instance [
15], and QuickBird imagery was used to map black mangrove forests along the Gulf Coast of Texas to the species level [
16]. Further application of high-spatial-resolution aerial photography or satellite imaging would also provide for more detailed and accurate mapping of wetland areas [
5].
Reliance on coarse-spectral-resolution imagery limited the number of species that could be distinguished. Heumann [
17] further demonstrated that mapping mangrove species composition using high-spatial-resolution data presents further challenges: (i) the accurate demarcation of the precise community boundaries of mangrove forests is extremely difficult, due to the seasonal, tidal and spectral variability of the communities [
13,
14,
18]; (ii) spectral reflectance values of mangrove vegetation are often difficult to separate from those of underlying mudflat and water [
7]; and (iii) the spectral differences among species of mangroves are subtle [
19,
20]. As a result, the difficulty in differentiating between mangrove species and differentiating mangroves from other types of vegetation and mudflats reduces classification accuracy [
6,
19]. Using the Mai Po Nature Reserve as an example, more than six perennial mangrove species have been reported [
21,
22]. It is difficult to obtain accurate classification results directly from high-spatial-resolution images with only several bands.
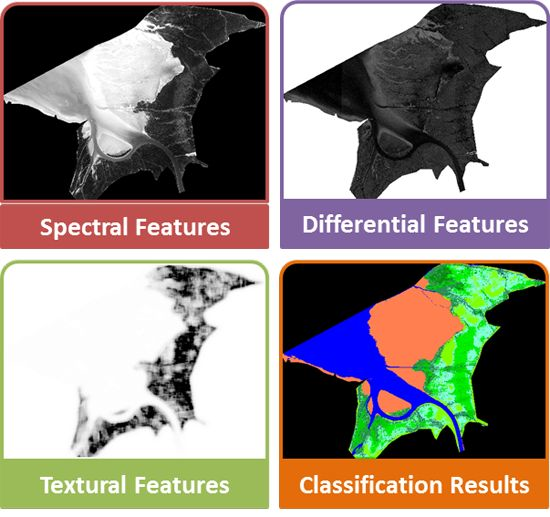
Grey-Level Co-Occurrence Matrix (GLCM) based features are widely used in image texture analyses, particularly for stochastic texture [
23]. Due to the similar spectral responses between different mangrove species, and between mangroves and other types of vegetation, it is necessary to integrate spectral and textural information for more accurate mapping results [
24]. As different species of mangroves display distinctive texture patterns, classification based on textural features could fit the demands for mangrove inter-species recognition. From field surveys we found that leaf arrangement, branch density, and average height and size differ among species; these distinctive textures should be identifiable in the image, for instance as “bushy” for
Kandelia obovata or “smooth” for
Acanthus ilicifoliu. When the spectral features of these two species are similar, two forms of
Acanthus ilicifoliu with different leaf shape will show discrepancies in textural features, which are helpful when trying to discriminate between them.
Derivation of the slope of spectral curves is known as derivative spectroscopy [
25]. Differential of a spectrum curve or its mathematical function estimates the slope over the entire interval [
26]. These methods were originally developed in analytical chemistry to eliminate background signals and resolve overlapping spectral features, but the concepts could be applied to differentiate spectra from remote-sensing imagery, as it can be used to highlight desired information while suppressing or eliminating information of no interest. For example, background absorption or reflectance signals caused by stray light can be eliminated [
27]. Spectral curves with sharp structures could also be enhanced [
28]. Derivative spectra are sometimes more informative than zero-order reflectance spectra when attempting to glean certain information or relationships from the data; for example, first-order derivative spectra in the visible wavelengths has been shown to be more highly correlated with percent leaf surface area infected by a certain type of fungus than the original zero-order reflectance data [
26].
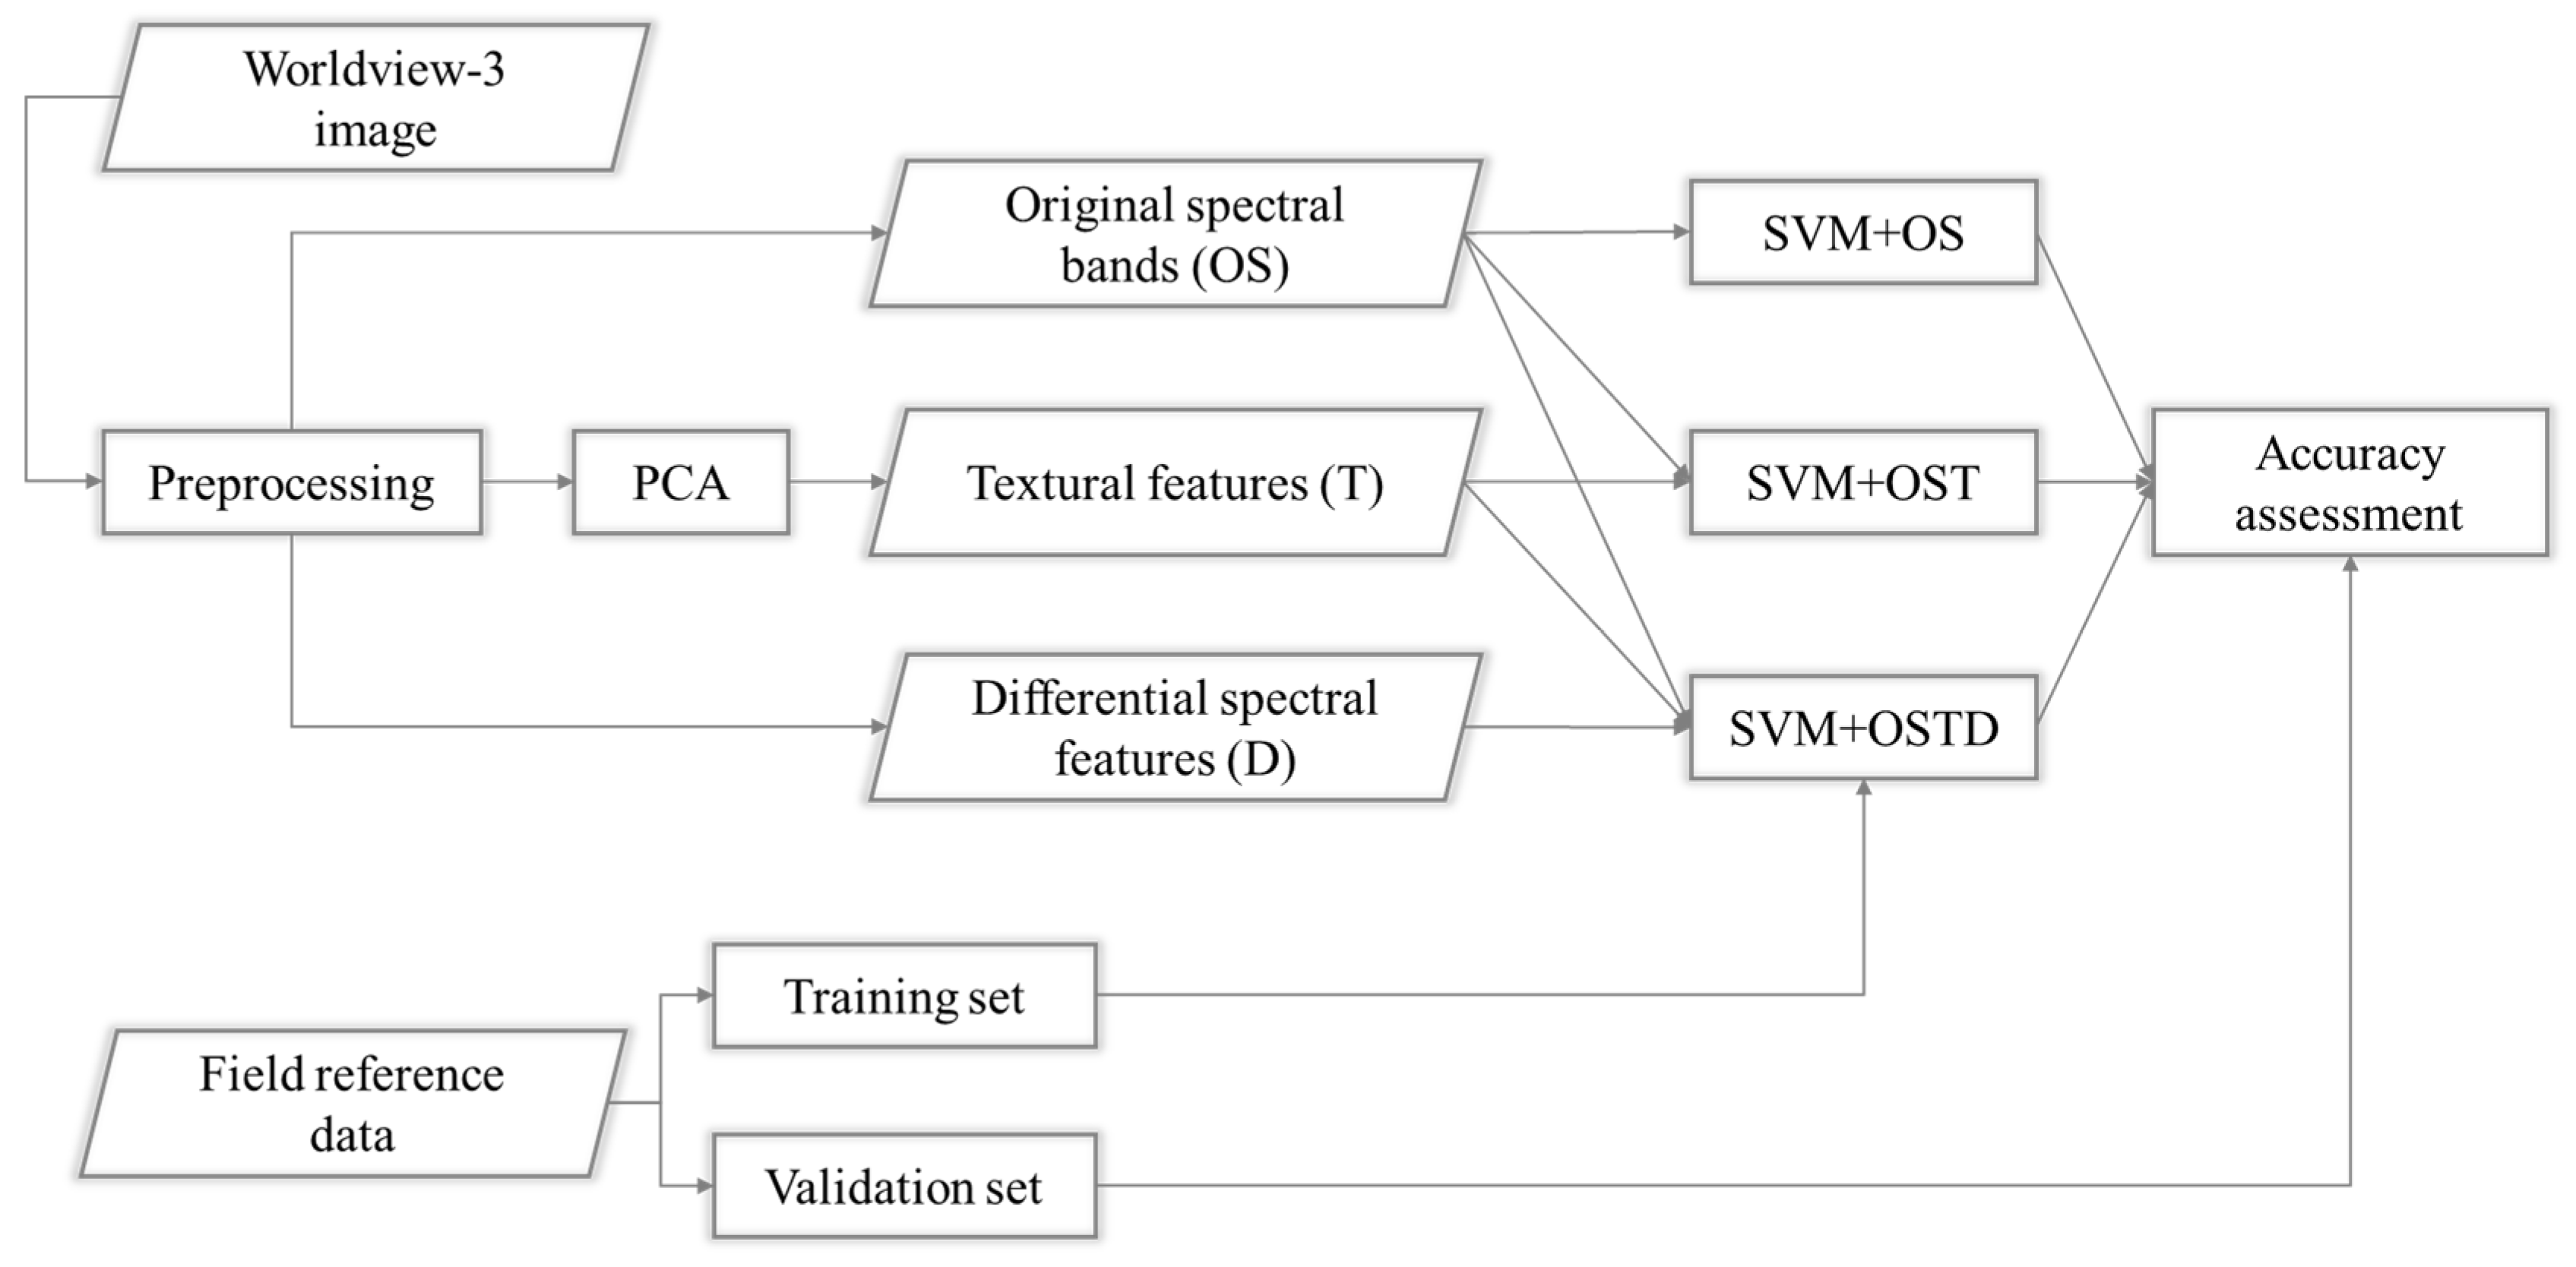
The goal of this study was to investigate the value of a WorldView-3 image in mapping different mangrove species, using both spectral and textural features. To make comparisons, three types of features were tested to evaluate their relative effectiveness. More specifically, this study intended to achieve the following three objectives:
- (1)
To evaluate the use of the eight original bands of WorldView-3 imagery for mapping mangrove species;
- (2)
To evaluate the use of a combination of the original bands and textural features for mapping mangrove species; and
- (3)
To evaluate the use of a combination of the original bands, textural features and differential spectral features for mapping mangrove species.
The remainder of the paper is organized as follows:
Section 2 illustrates the study area and data;
Section 3 briefly reviews the textural and differential spectral features that were used;
Section 4 reports the experimental results that were obtained; and finally, a discussion of the results is provided, along with concluding remarks.
2. Study Area and Data
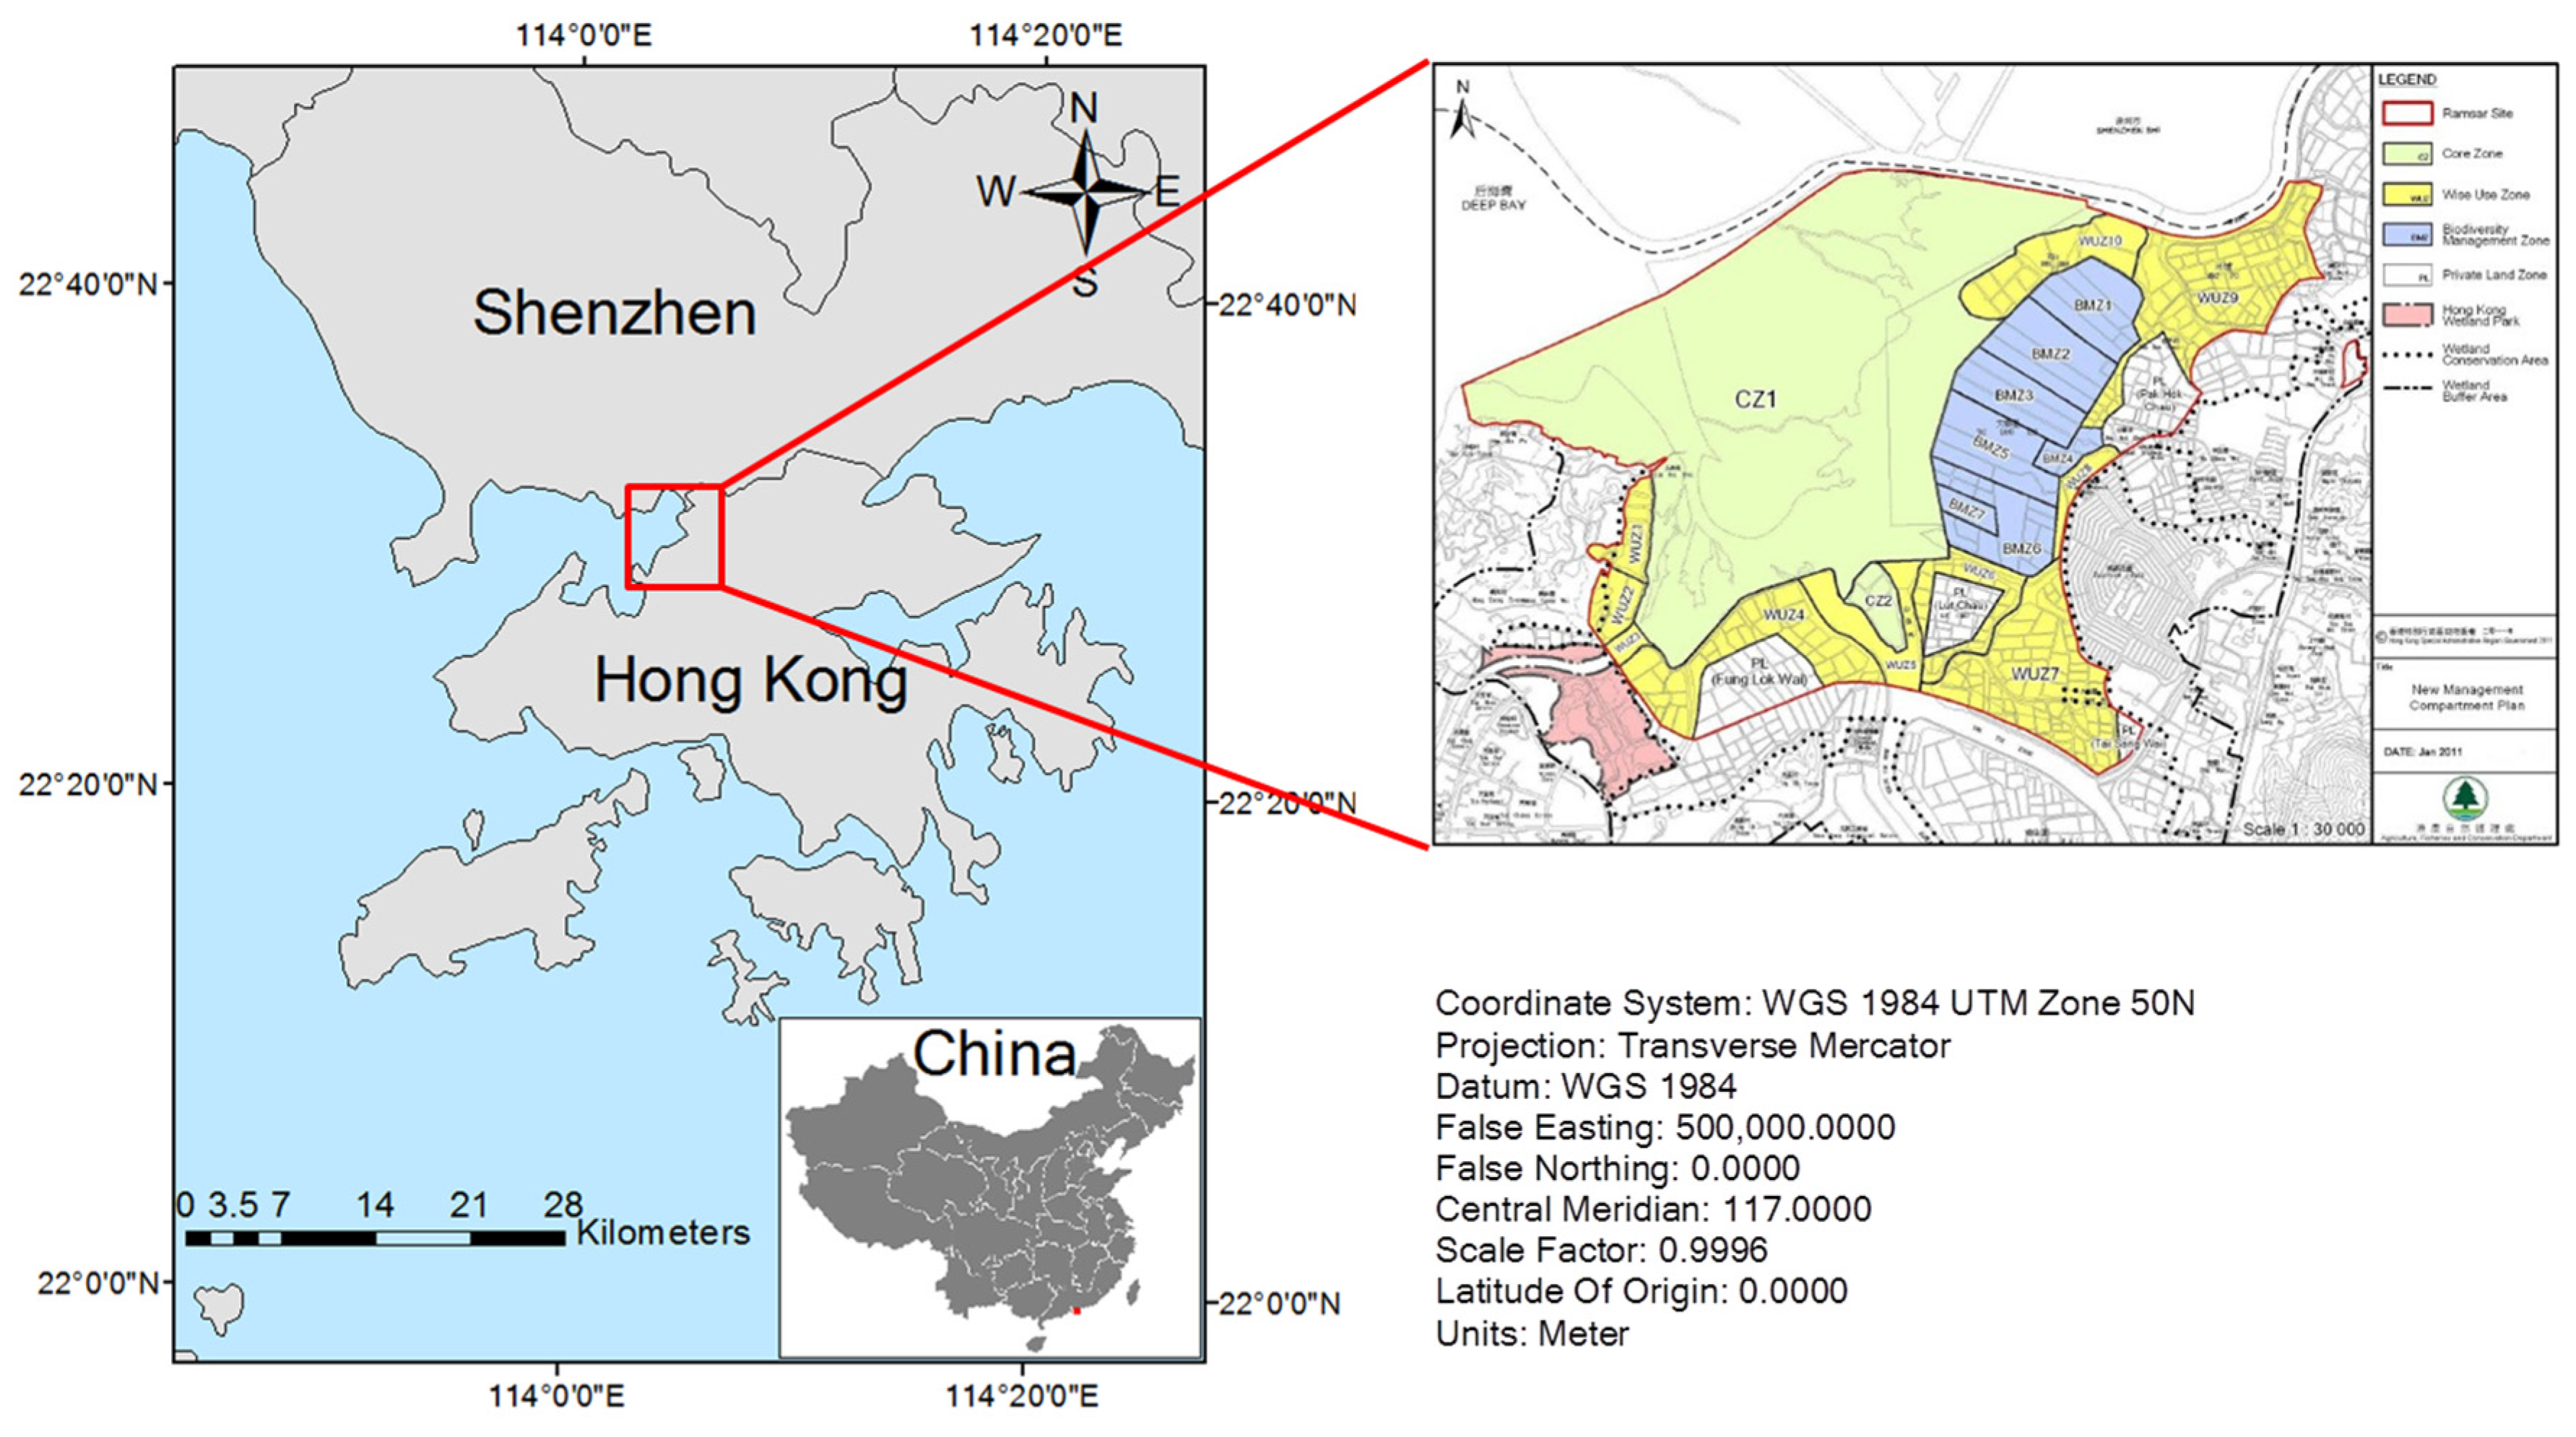
The Mai Po Marshes Nature Reserve is located in the northwestern New Territories of Hong Kong and borders the Shenzhen Special Economic Zone of Guangdong Province, China [
29] (
Figure 1). The geographic coordinates of the reserve are roughly 113°59′E–114°03′E and 22°28′N–22°32′N, bordering the mudflats and mangrove forests of Inner Deep Bay. This area is influenced by the Pearl River and, specifically, by the Shen Zhen River and Deep Bay. The climate of the region is largely governed by the continent of mainland China [
8]. The entirety of the Mai Po marshes complex encompasses dwarf mangroves, shrimp ponds and fish ponds, and supports numerous species of wildlife. The Mai Po reserve provides significant habitat for migratory birds and for this reason is considered to be a wetland of international importance under the 1995 Ramsar Convention, a designation that confers some protection for the wide range of natural and man-made habitats in the reserve, especially with regard to the mangrove forests [
30].
Figure 1.
The location of the study area.
Figure 1.
The location of the study area.
The mangroves that ring Inner Deep Bay are the most prominent feature of the reserve. These mangroves are the largest remaining mangrove forest in Hong Kong and one of the few extensive mangrove forests left in southern China. To improve management, the reserve has been divided into five separate administrative zones based on habitat type, ecological values and existing land uses by the Agriculture, Fisheries and Conservation Department (AFCD) of Hong Kong. These zones consist of the core zone, the biodiversity management zone, the wise-use zone, the public-access zone, and the private-land zone. The core area of mangrove forest in Inner Deep Bay is approximately 3000 m long and 500 m wide and is intersected by several water channels. Mai Po was first declared a nature conservation area in 1975, and designated as a Site of Special Scientific Interest (SSSI) the following year; it was named a nature reserve in 1984 and is presently under the management of the World Wide Fund for Nature (WWF). The ecological significance of the Mai Po reserve is also reflected in the designation of its associated wetland areas as a Wetland of International Importance under the Ramsar Convention. Such international recognition of the site’s ecological significance is mainly due to the large number of endemic bird species, many of which are rare species. Despite this, little research has been conducted in this area, primarily because the reserve is restricted to a small area at specific locations, and because of its limited accessibility and its politically sensitive location bordering China.
Eight species of mangrove are found in the Mai Po reserve [
31], four of which are dominant native species, according to field studies and a report published by the Agriculture, Fisheries and Conservation Department of Hong Kong. These four spceis are
Kandelia obovata and
Avicennia marina, which reach the canopy stratum; and
Aegiceras corniculatum and
Acanthus ilicifolius, which occupy the understory and usually grow along coastal edges. Two other native species,
Bruguiera gymnorrhiza and
Excoecaria agallocha, are less common, and two exotic tropical species—
Sonneratia apetala and
Sonneratia caseolaris—were propagated from a plantation located along the Shenzhen River in the Futian National Nature Reserve, in Shenzhen city [
21]. According to a previous study [
8], four main species of mangroves have been of primary focus, namely
Avicennia marina,
Acanthus ilicifolius,
Kandelia obovata, and
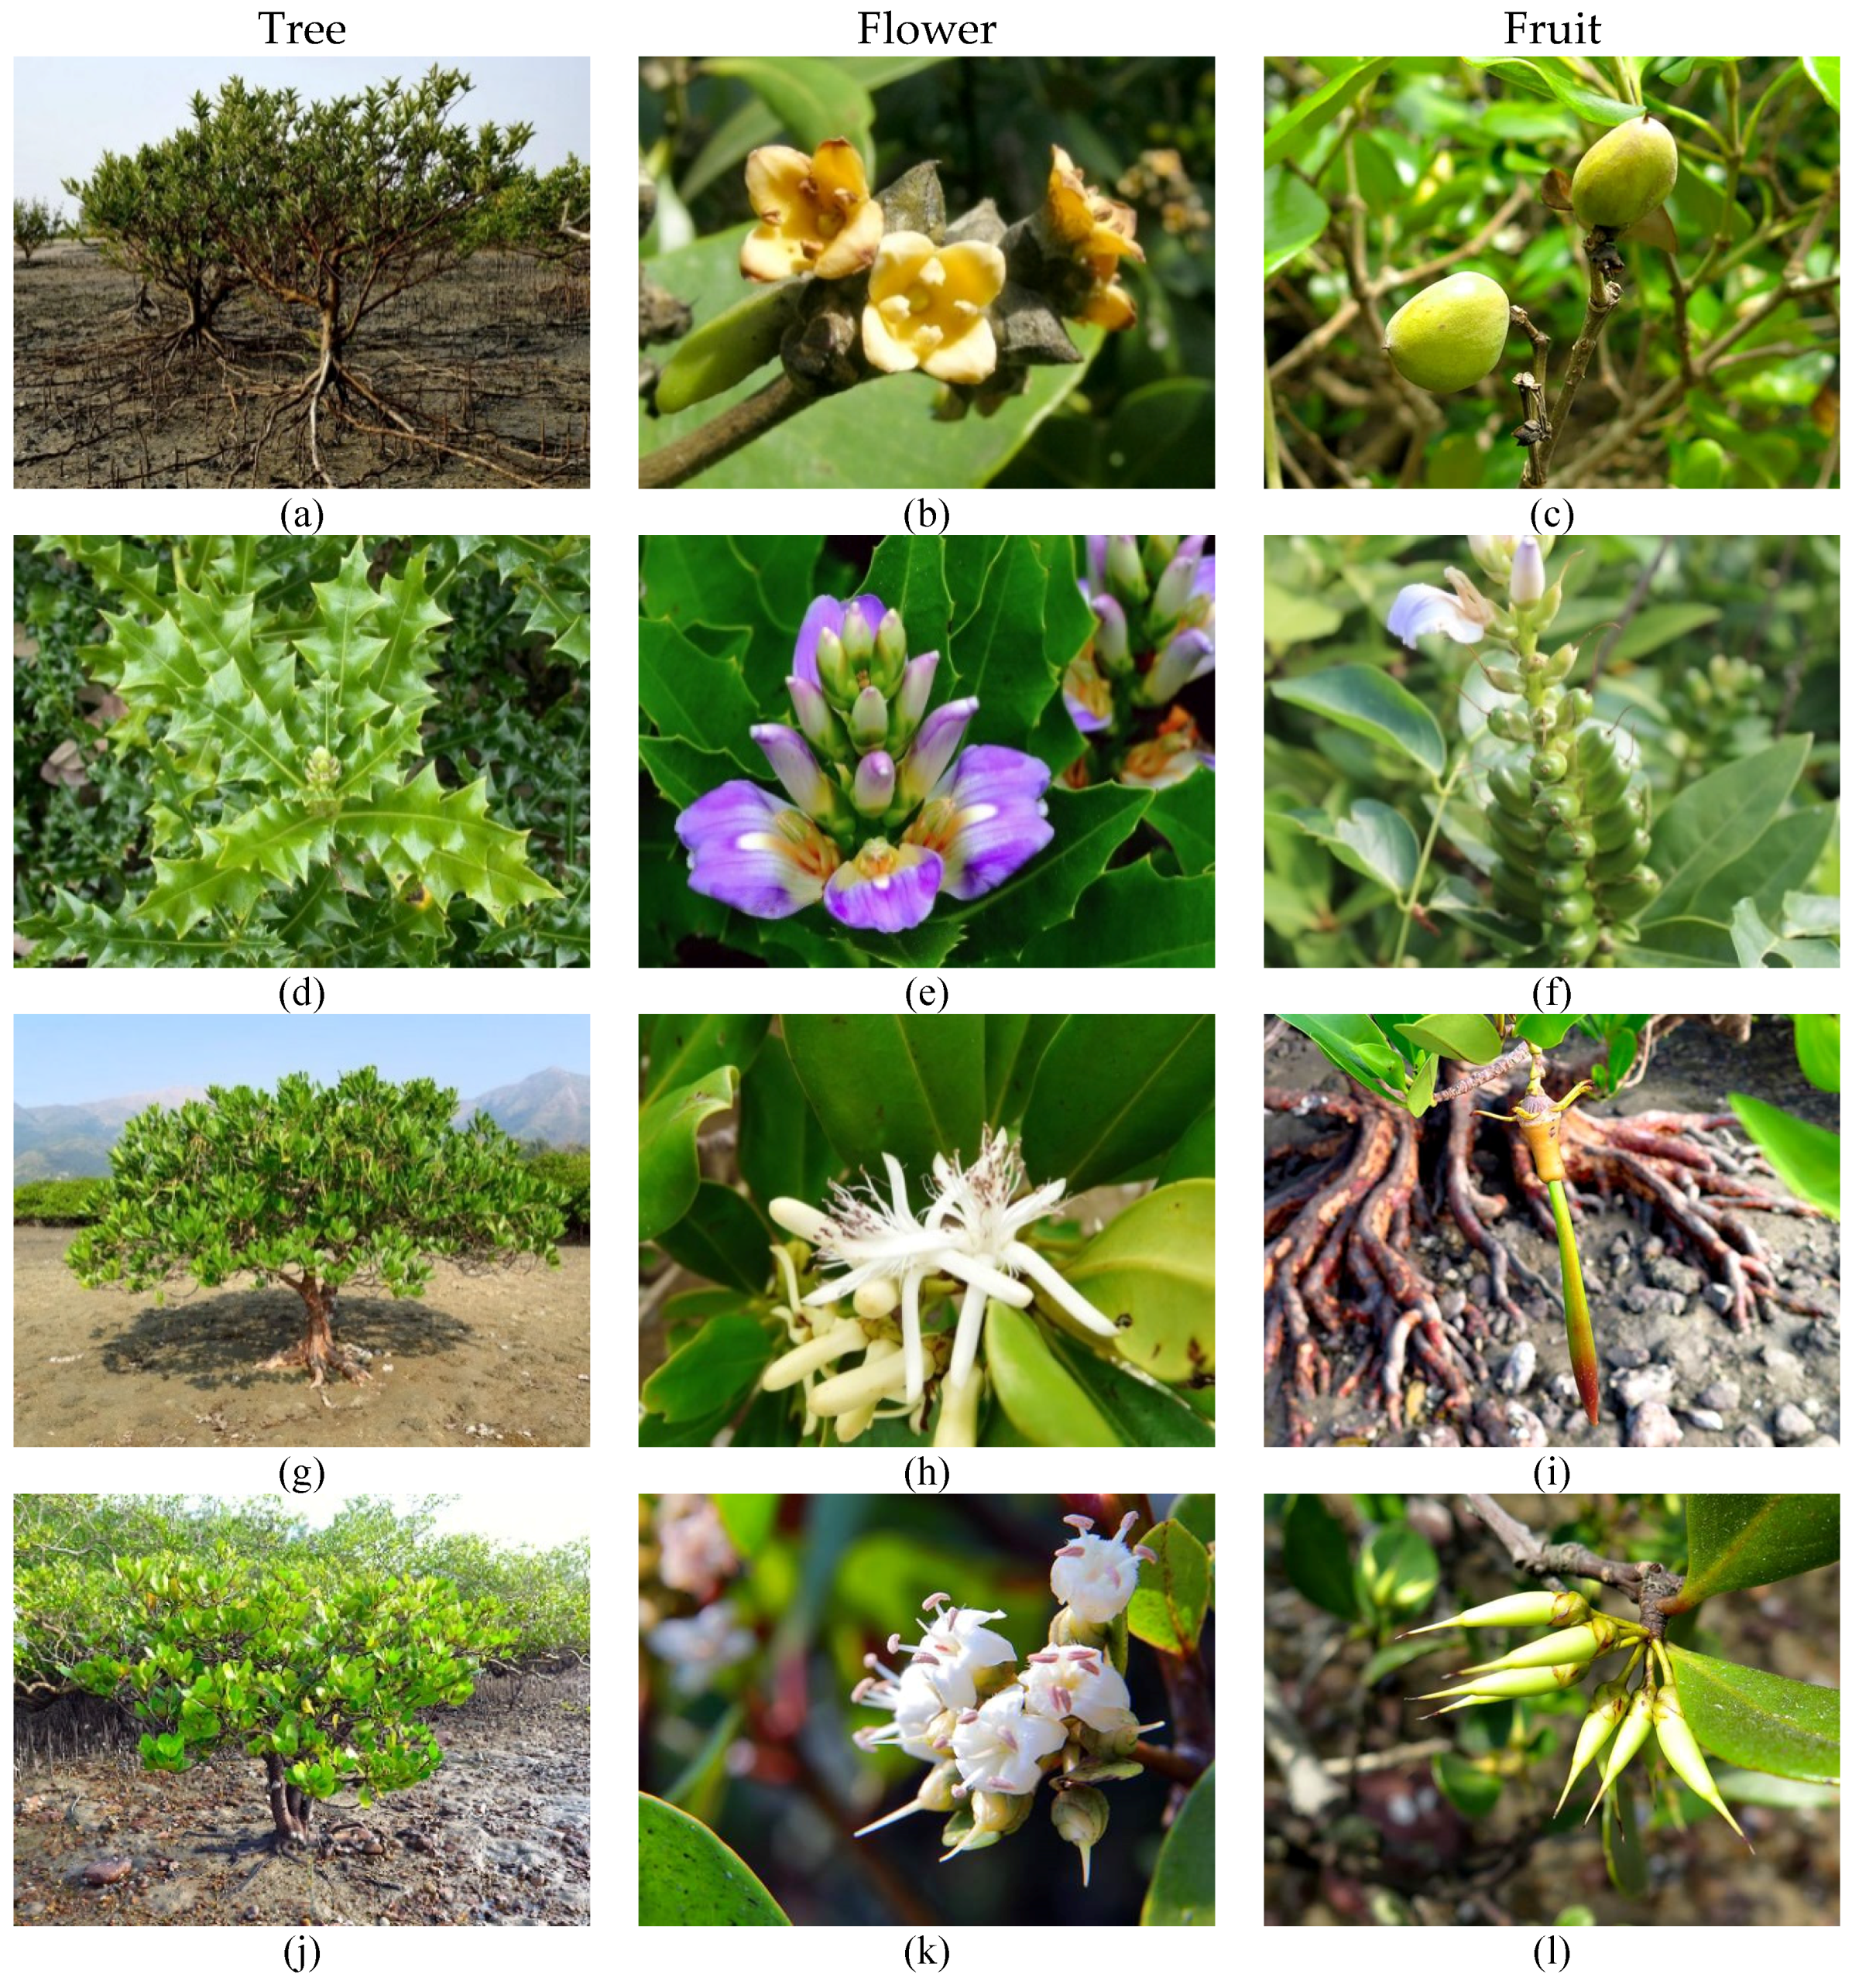
Aegiceras corniculatum. Photographs of these four species taken during different phenological periods are shown in
Figure 2.
Field studies were conducted in July 2013. A differential GPS (Global Positioning System) was used to match the geographical location between field survey data and image pixel data. Conducting fieldwork in summer is more effective for identifying species because of the presence of flowers. The flowering phase of mangrove forests in Hong Kong is relatively long due to the humid subtropical climate, with some species continuing to blossom as late as November; the spectral features of mangrove leaves are not affected by the presence of these small flowers. According to reserve staff, the distribution of the mangrove species of interest was unchanged between July 2013 and present.
Acanthus ilicifolius and
Kandelia obovata can both be further separated into two spectral classes, based on differences in their locations and leaf shapes [
22]. From field studies it is known that (i) there are two types of
Acanthus ilicifolius, one of which has leaves with serrated edges whereas the other has rounded leaves; and (ii)
Kandelia obovata is divided into two distinct populations growing on the landward and seaward sides that differ in height and leaf density. Previous studies have divided each of these species into two subclasses [
8,
21], a classification criterion we follow here.
Launched on the 13th of August 2014, WorldView-3 is a fourth-generation high-spatial-resolution optical satellite operated by the American company DigitalGlobe. With an image-resolution capability 31 cm, WorldView-3 is the highest spatial resolution optical satellite available for civilian use. It can also provide 8-band multispectral imagery with 1.24 m resolution and 8-band shortwave infrared imagery with 3.7 m resolution. Because of this range of spectral coverage and near infrared and shortwave infrared capabilities, WorldView-3 images are used for a variety of purposes, including monitoring of vegetation, mineral exploration, coastal monitoring, and other broad applications [
9]. Images of the Mai Po Nature Reserve were acquired in January 2015, and cover the entirety of the reserve, with the eight multispectral bands ranging from 400 to 1040 nm.
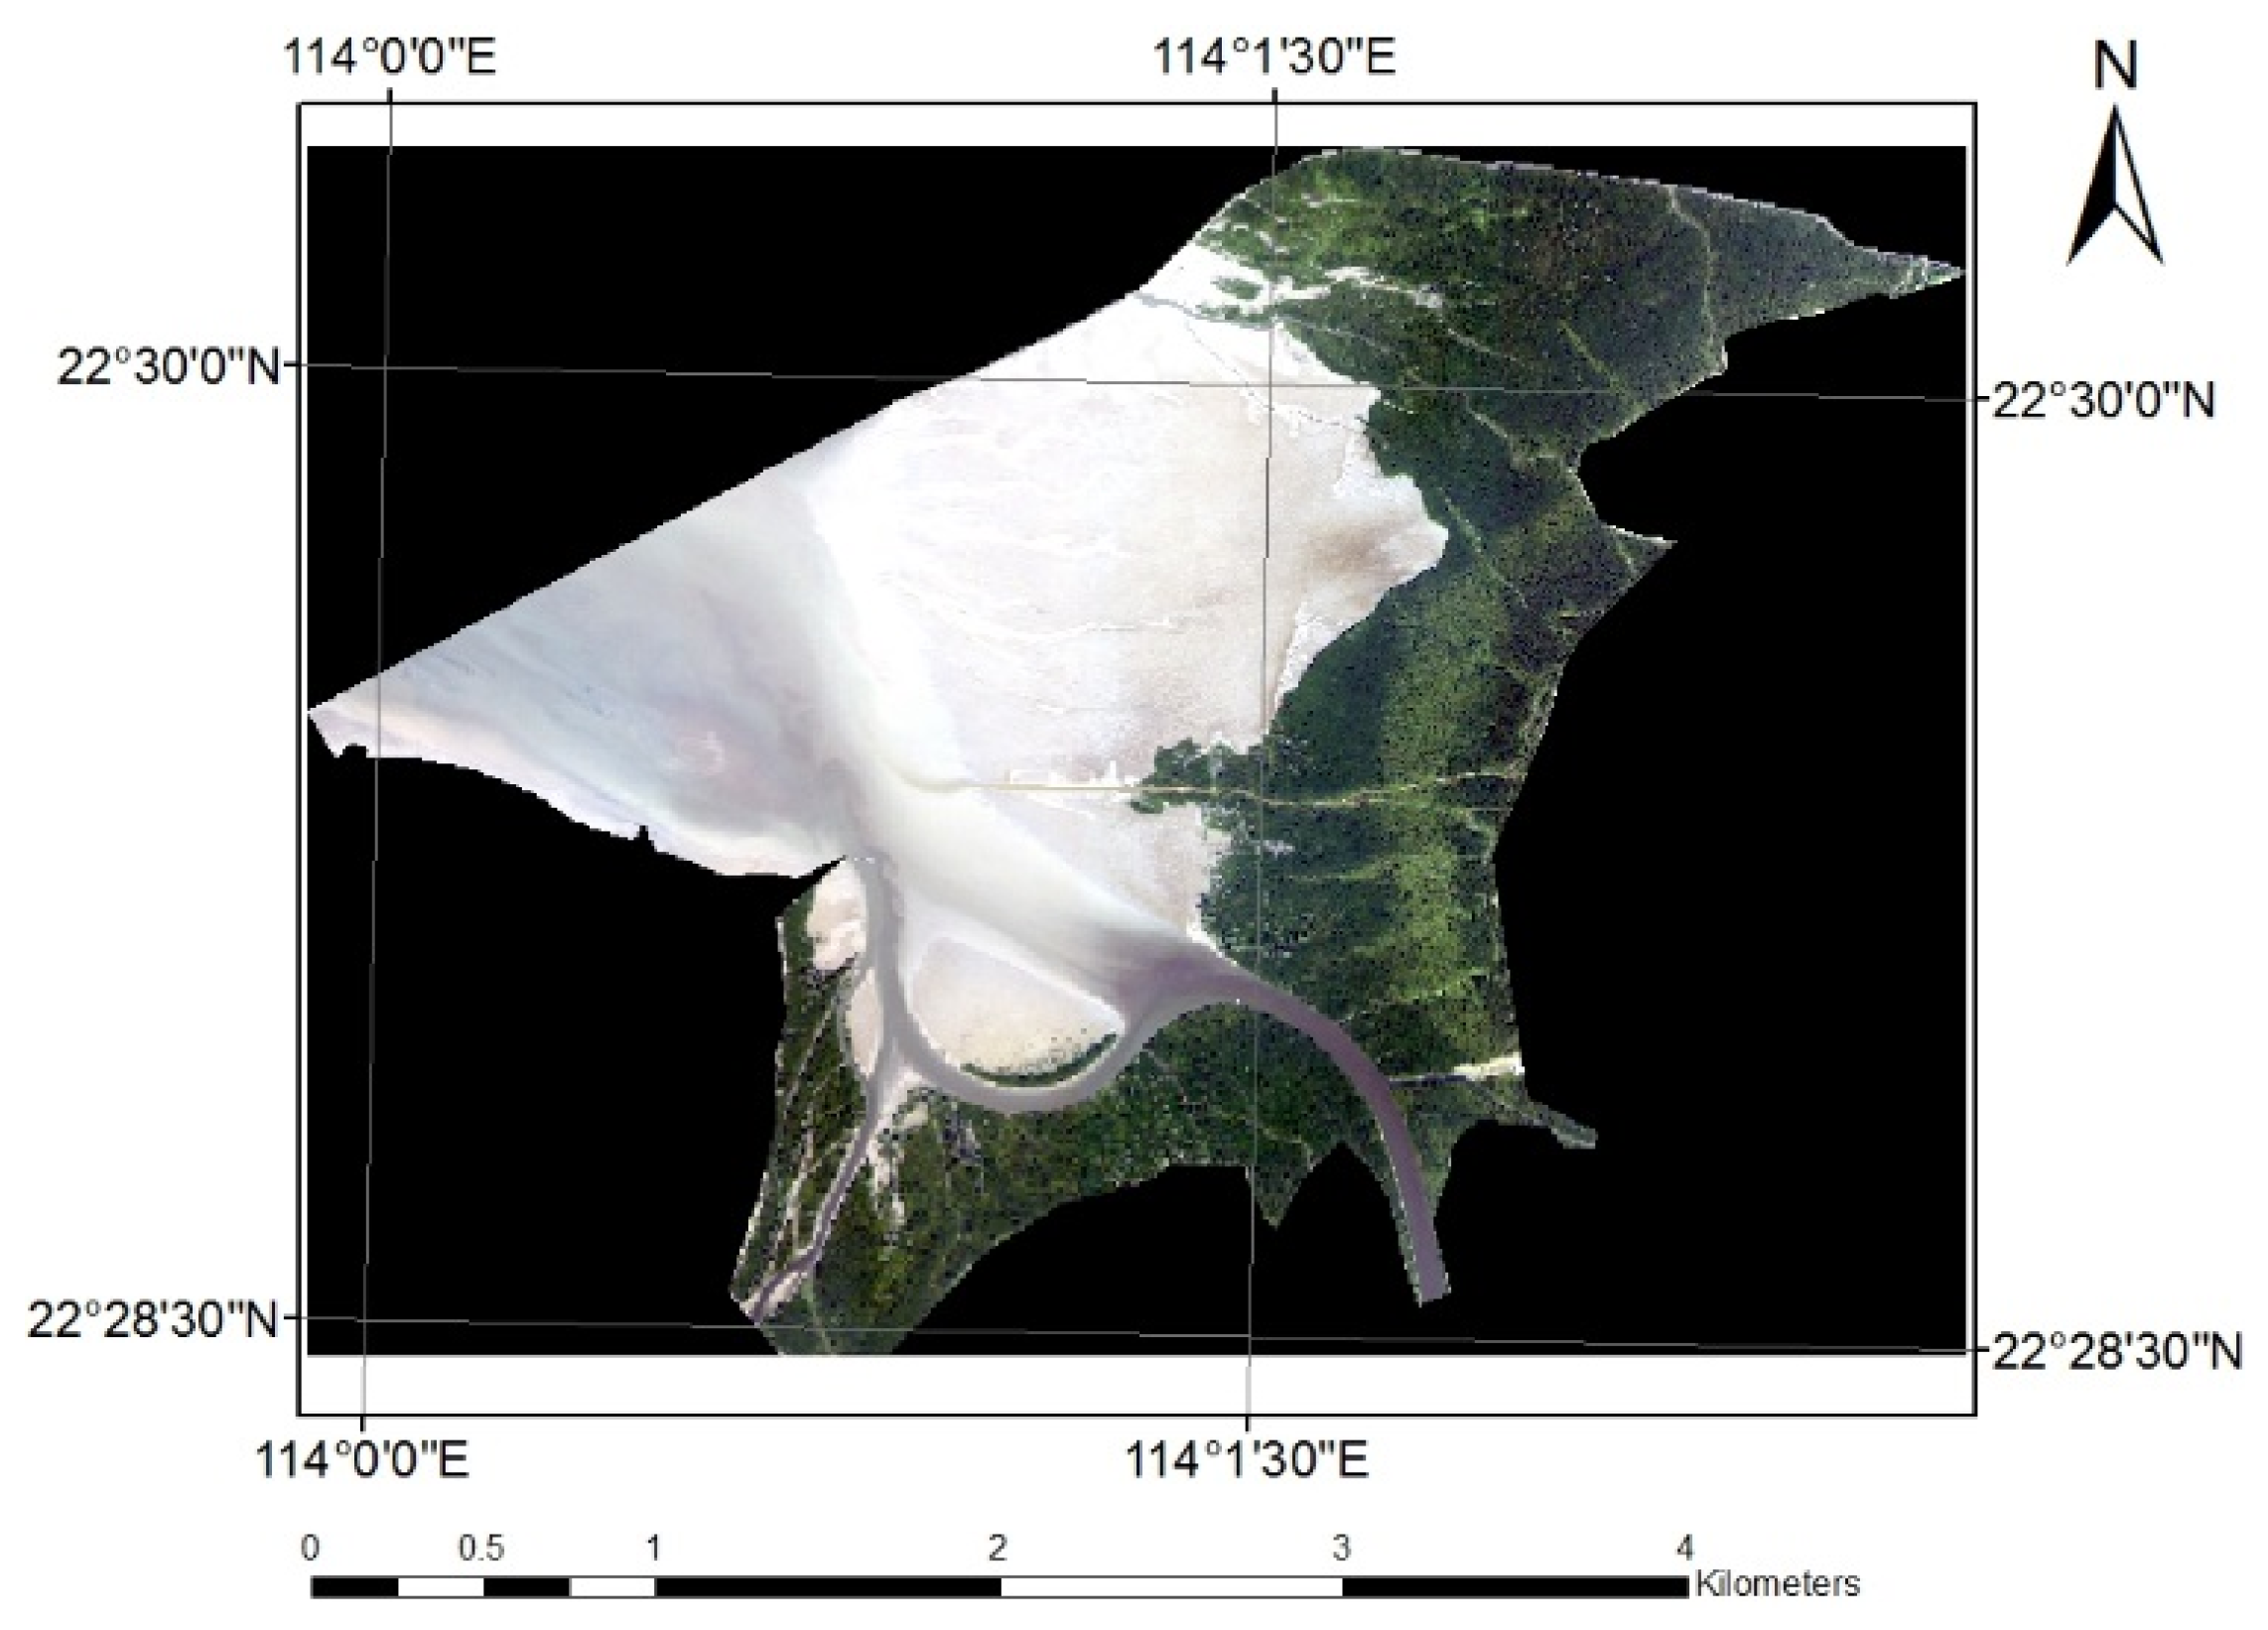
For this study, we focused solely on the core zone, which is dominated by large extents of mangrove forests; a true-colour image of the core zone is presented in
Figure 3. The rectangular data cover 59.24 ha; after carefully drawing the border of this area, the core-zone image covers 26.59 ha that remain to be classified.
Figure 2.
The four primary species of mangroves in Hong Kong during different phenological periods. (a–c) Avicennia marina; (d–f) Acanthus ilicifolius; (g–i) Kandelia obovata; (j–l) Aegiceras corniculatum.
Figure 2.
The four primary species of mangroves in Hong Kong during different phenological periods. (a–c) Avicennia marina; (d–f) Acanthus ilicifolius; (g–i) Kandelia obovata; (j–l) Aegiceras corniculatum.
Figure 3.
A true-colour image of the core zone.
Figure 3.
A true-colour image of the core zone.
4. Results and Discussion
We apply the same SVM classifier with three groups of features, respectively. They are: (i) features from Original eight bands Spectral data (OS); (ii) features combining Original Spectra and calculated Textures (OST); and (iii) features combing Original Spectra, calculated Textures and Differential spectral features (OSTD).
For each classifier, cross-validation was used to identify the best model for final classification (see
Figure 5). As can be observed, the classification maps of mangrove species are smoother when textural and differential spectral features are included. Considering the density of the mangrove forests in Mai Po, it is thought that smooth maps are more reliable than speckled maps. Moreover, the classification results of the combined features showed an increased agreement with field survey data. The overall accuracy of the map was estimated to provide preliminary comparison results (
Table 3).
Figure 5.
Classification results of Support Vector Machine (SVM) using different features. (a) SVM + Original Spectra (OS); (b) SVM + Original Spectra and calculated Textures (OST); (c) SVM + Original Spectra, calculated Textures and Differential spectral features (OSTD).
Figure 5.
Classification results of Support Vector Machine (SVM) using different features. (a) SVM + Original Spectra (OS); (b) SVM + Original Spectra and calculated Textures (OST); (c) SVM + Original Spectra, calculated Textures and Differential spectral features (OSTD).
Table 3.
Overall mapping accuracy using the three different sets of features.
Table 3.
Overall mapping accuracy using the three different sets of features.
| | SVM + OS | SVM + OST | SVM + OSTD |
|---|
| Features Number | 8 | 16 | 23 |
| Test Sample Overall Accuracy | 83.7838% | 90.9266% | 94.4015% |
| Confusion Matrix | Table 4 | Table 5 | Table 6 |
The inclusion of textural features improves accuracy of the distribution of mangrove species, which smooths the results and reduces the number of errors from other classes. Here, four types of textural features were adopted, as outlined in
Section 3. However, the edge effect caused by the window-based textural features renders the results concerning transitional sections somewhat inaccurate and unreliable.
Classification accuracy can be further enhanced with differential spectral features that are sensitive to essential characteristics of the plant, as noted in
Section 3. The second-degree deviation of the spectrum is utilized as the differential spectral feature. Accuracy was assessed base on the validation set of the field collected reference data (
Table 3), which shows that incorporating OSTD features into the SVM classifier greatly improves the classification performance of the SVM. For a more detailed analysis, confusion matrices that include both producer and user accuracy were constructed; these are presented in
Table 4 for SVM + OS features,
Table 5 for SVM + OST features and
Table 6 for SVM + OSTD features.
Table 4.
Confusion matrix calculated from SVM + OS classification results.
Table 4.
Confusion matrix calculated from SVM + OS classification results.
| Class | AM | AI1 | AI2 | KO1 | KO2 | AC | Mudflat | Water | Prod. Acc. | User Acc. |
|---|
| AM | 77.42 | 17.07 | 11.90 | 7.41 | 0.00 | 7.32 | 0.00 | 0.00 | 77.42 | 71.64 |
| AI1 | 3.23 | 19.51 | 4.76 | 1.85 | 0.00 | 0.00 | 0.00 | 0.00 | 19.51 | 61.54 |
| AI2 | 9.68 | 56.10 | 73.81 | 0.00 | 0.00 | 0.00 | 0.00 | 0.00 | 73.81 | 51.67 |
| KO1 | 4.84 | 0.00 | 2.38 | 79.63 | 7.84 | 2.44 | 0.00 | 0.00 | 79.63 | 82.69 |
| KO2 | 0.00 | 0.00 | 2.38 | 11.11 | 88.24 | 12.2 | 0.00 | 0.00 | 88.24 | 78.95 |
| AC | 4.84 | 4.88 | 4.76 | 0.00 | 3.92 | 78.05 | 0.00 | 0.00 | 78.05 | 78.05 |
| Mudflat | 0.00 | 0.00 | 0.00 | 0.00 | 0.00 | 0.00 | 100.00 | 0.00 | 100.00 | 100.00 |
| Waterbody | 0.00 | 2.44 | 0.00 | 0.00 | 0.00 | 0.00 | 0.00 | 100.00 | 100.00 | 98.67 |
Table 5.
Confusion matrix calculated from SVM + OST classification results.
Table 5.
Confusion matrix calculated from SVM + OST classification results.
| Class | AM | AI1 | AI2 | KO1 | KO2 | AC | Mudflat | Water | Prod. Acc. | User Acc. |
|---|
| AM | 85.48 | 14.63 | 16.67 | 5.56 | 0.00 | 2.44 | 0.00 | 0.00 | 85.48 | 75.71 |
| AI1 | 1.61 | 65.85 | 0.00 | 1.85 | 0.00 | 0.00 | 0.00 | 0.00 | 65.85 | 93.10 |
| AI2 | 4.84 | 17.07 | 73.81 | 0.00 | 0.00 | 7.32 | 0.00 | 0.00 | 73.81 | 70.45 |
| KO1 | 3.23 | 0.00 | 2.38 | 88.89 | 5.88 | 0.00 | 0.00 | 0.00 | 88.89 | 88.89 |
| KO2 | 3.23 | 0.00 | 0.00 | 1.85 | 94.12 | 0.00 | 0.00 | 0.00 | 94.12 | 94.12 |
| AC | 1.61 | 2.44 | 7.14 | 1.85 | 0.00 | 90.24 | 0.00 | 0.00 | 90.24 | 86.05 |
| Mudflat | 0.00 | 0.00 | 0.00 | 0.00 | 0.00 | 0.00 | 100.00 | 0.00 | 100.00 | 100.00 |
| Waterbody | 0.00 | 0.00 | 0.00 | 0.00 | 0.00 | 0.00 | 0.00 | 100.00 | 100.00 | 100.00 |
Table 6.
Confusion matrix calculated from SVM + OSTD classification results.
Table 6.
Confusion matrix calculated from SVM + OSTD classification results.
| Class | AM | AI1 | AI2 | KO1 | KO2 | AC | Mudflat | Water | Prod. Acc. | User Acc. |
|---|
| AM | 95.16 | 14.63 | 14.29 | 0.00 | 0.00 | 0.00 | 0.00 | 0.00 | 95.16 | 83.10 |
| AI1 | 4.84 | 68.29 | 2.38 | 1.85 | 0.00 | 0.00 | 0.00 | 0.00 | 68.29 | 84.85 |
| AI2 | 0.00 | 4.88 | 78.57 | 0.00 | 0.00 | 4.88 | 0.00 | 0.00 | 78.57 | 89.19 |
| KO1 | 0.00 | 2.44 | 2.38 | 98.15 | 1.96 | 0.00 | 0.00 | 0.00 | 98.15 | 94.64 |
| KO2 | 0.00 | 0.00 | 0.00 | 0.00 | 98.04 | 0.00 | 0.00 | 0.00 | 98.04 | 100.00 |
| AC | 0.00 | 7.43 | 2.38 | 0.00 | 0.00 | 95.12 | 0.00 | 0.00 | 95.12 | 90.70 |
| Mudflat | 0.00 | 0.00 | 0.00 | 0.00 | 0.00 | 0.00 | 100.00 | 0.00 | 100.00 | 100.00 |
| Waterbody | 0.00 | 2.44 | 0.00 | 0.00 | 0.00 | 0.00 | 0.00 | 100.00 | 100.00 | 98.67 |
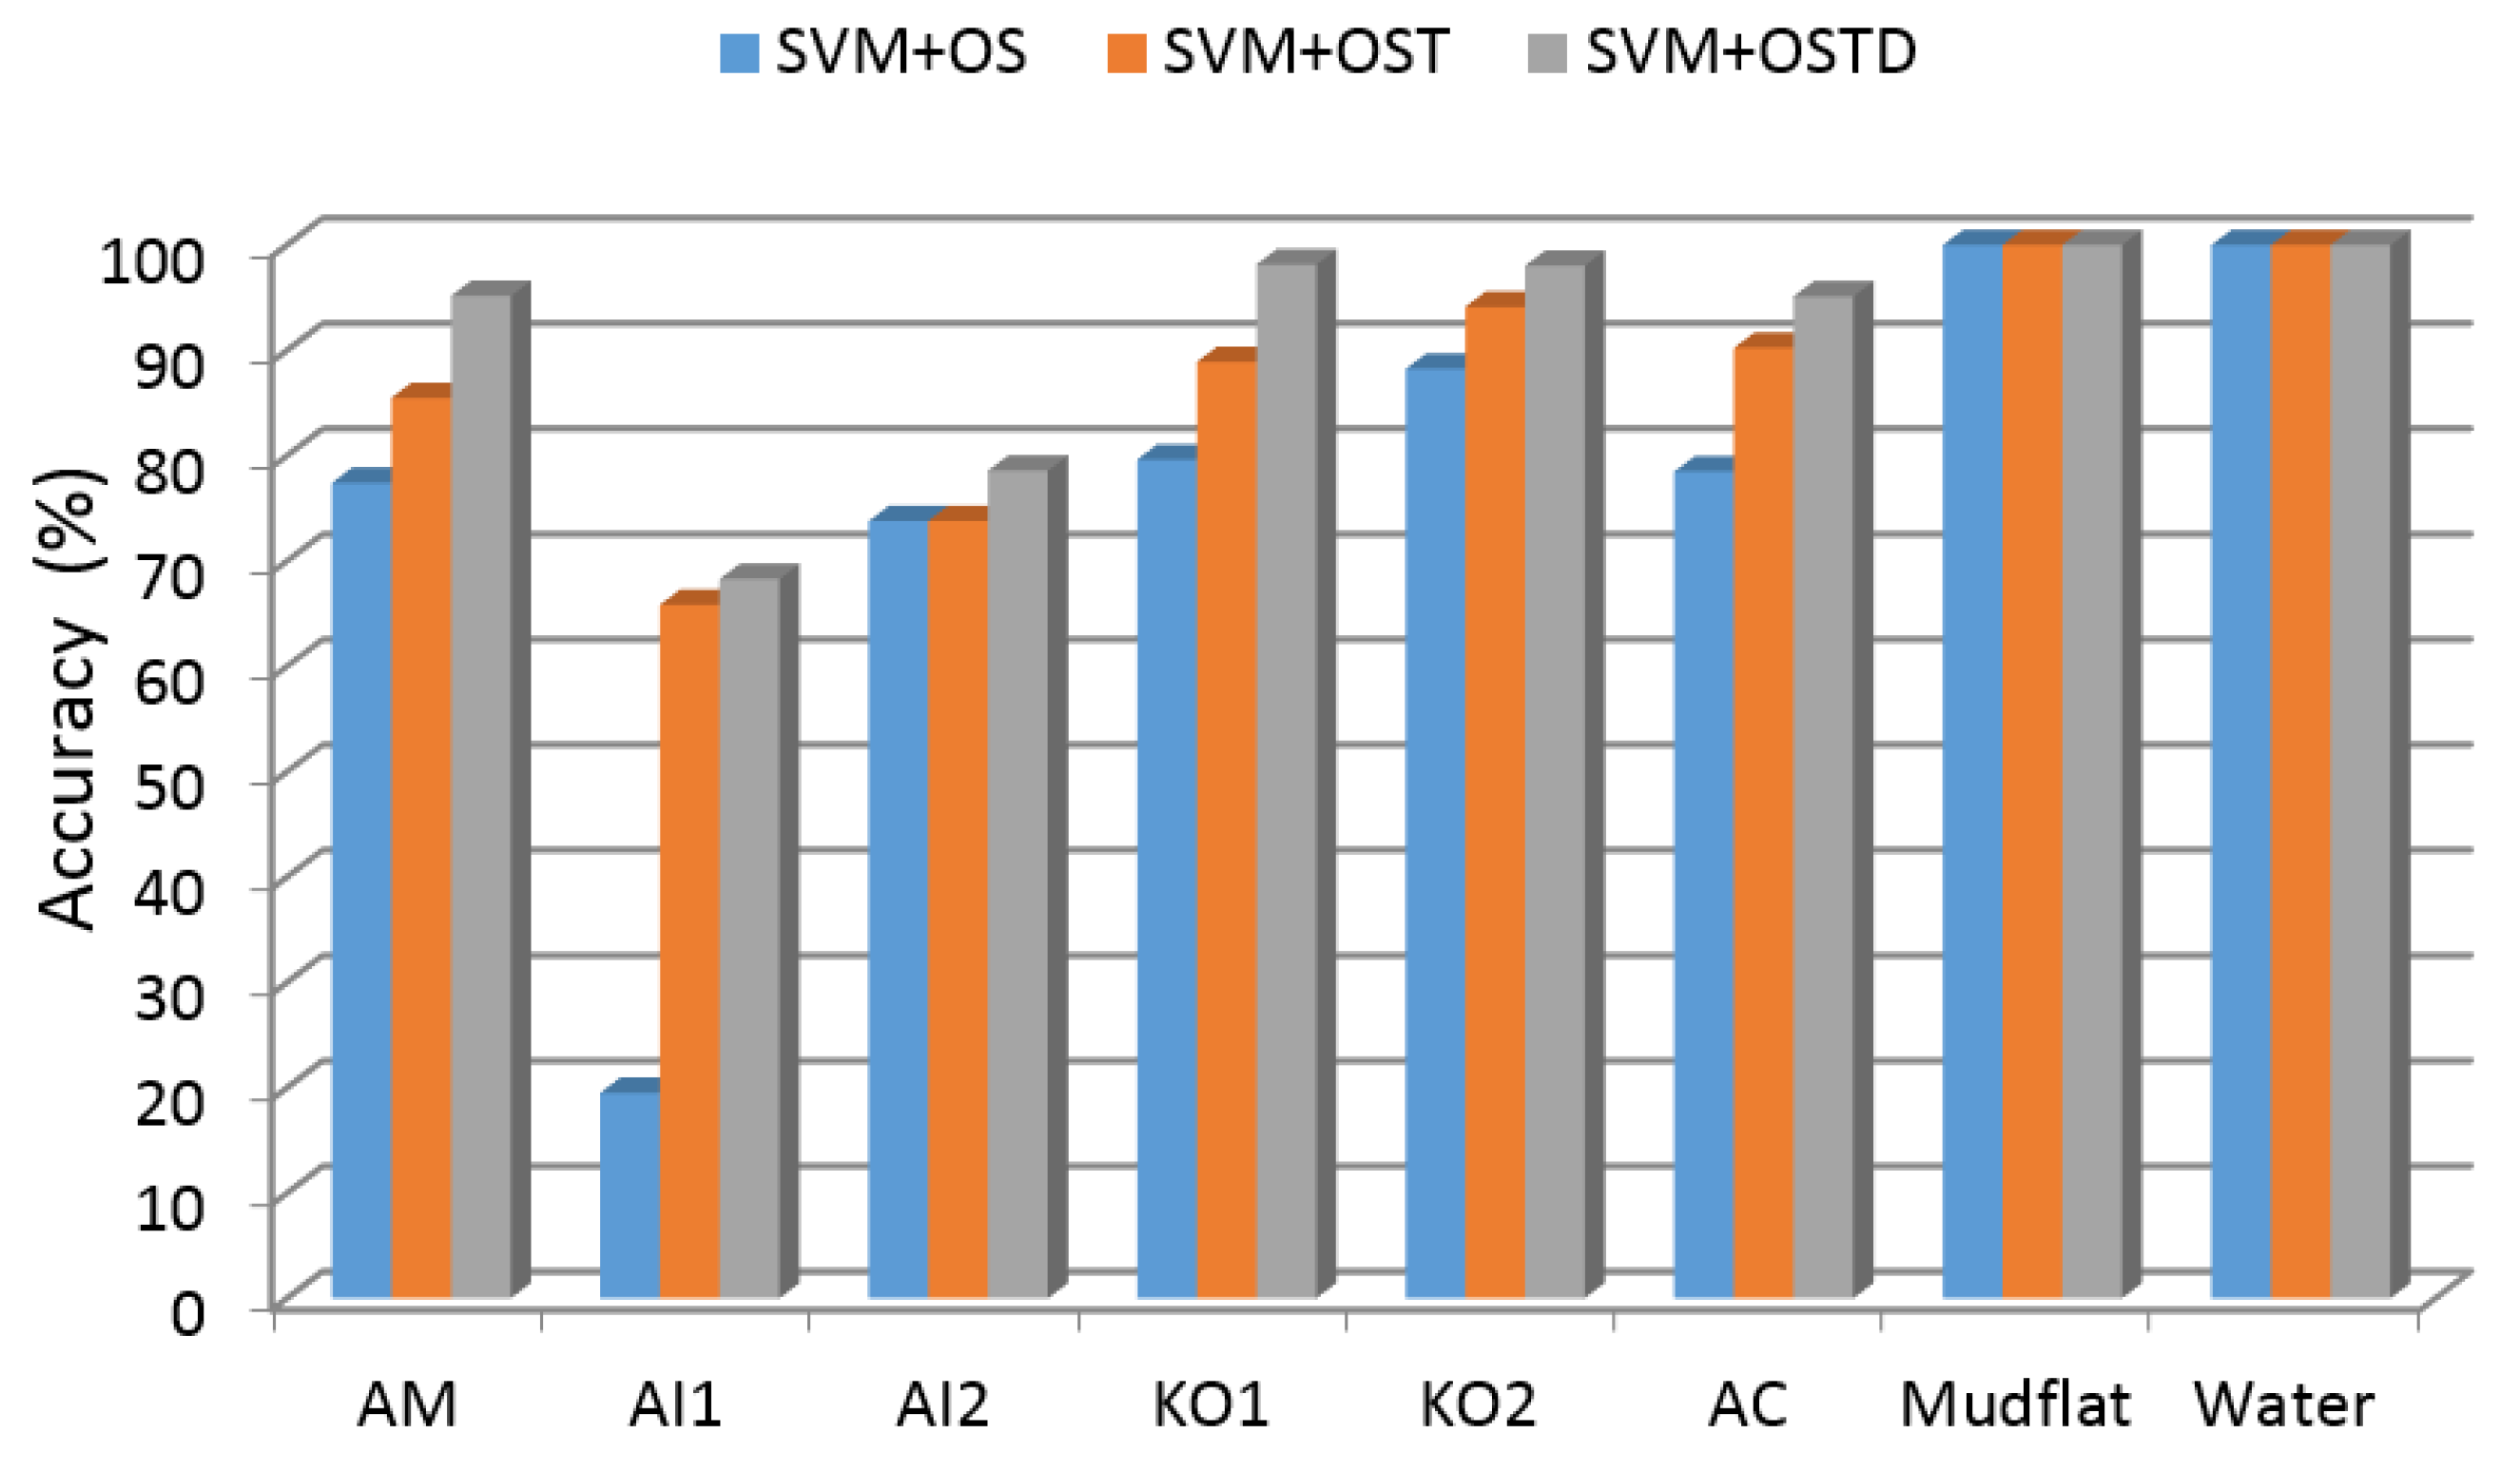
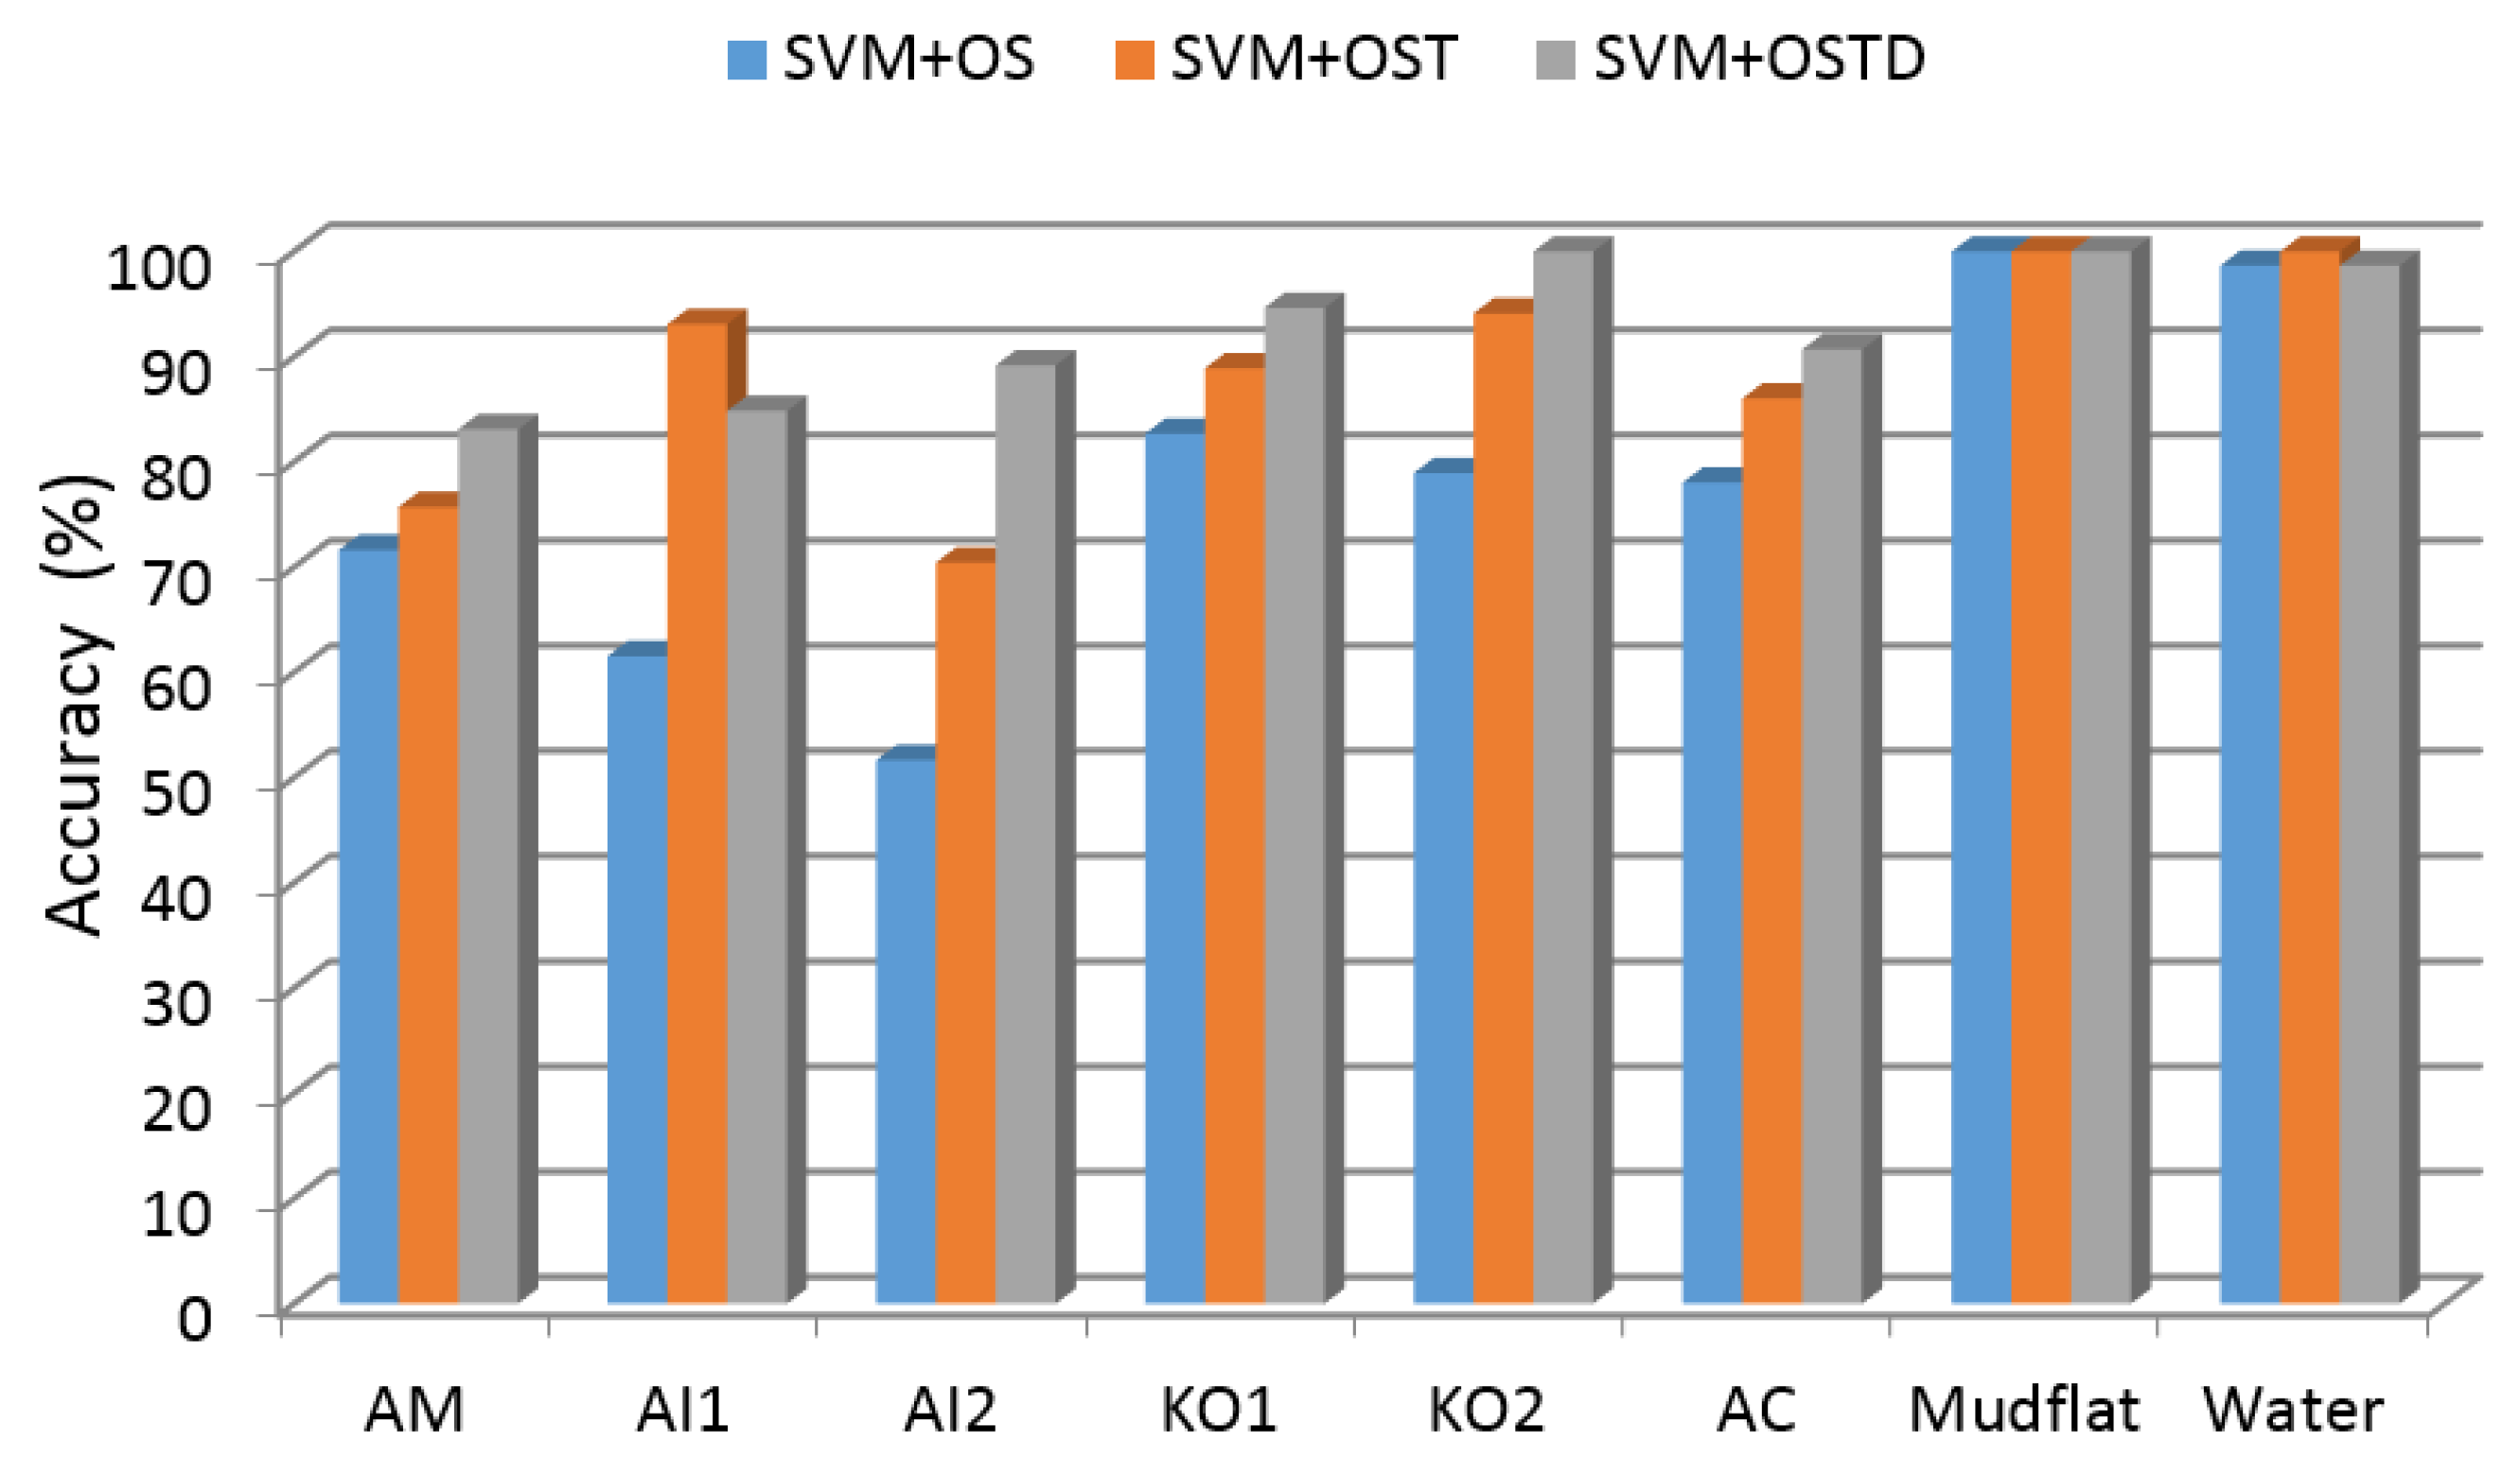
Improvements made to both producer and user accuracy are illustrated in
Figure 6 and
Figure 7. From the tables, it was found that mapping accuracy was enhanced for all six species when textural features are combined, especially with regard to
Acanthus ilicifolius Group1, which was inadequately classified using SVM and original spectral features. As can be observed from the AI1 row of
Table 4, this species is often confused with AI2 and vice versa, as their spectral features are similar. However, because these two species exhibit different textural features, inclusion of textural features in image analysis greatly improves their classification accuracy, in our case by 45%.
Figure 6.
Producer’s accuracy.
Figure 6.
Producer’s accuracy.
Figure 7.
User’s accuracy.
Figure 7.
User’s accuracy.
The differential spectral features could further suppress the background interference signals and exploit the intrinsic features of each species. By combining these features, the inter-species differences could be further increased, and intra-species variances could be decreased to some extent, thereby improving classification performance. By optimizing the parameters of the SVM classifier, user’s and producer’s accuracy had also been greatly improved. Moreover, this approach requires no additional data or parameters, which makes it both a practical and effective method.
We also calculated the area of each species counted by pixels from the classification results in order to make a more comprehensive comparison. The areas are in direct proportion to the pixels and their percentages are shown in
Table 7. According to reserve employees,
Kandelia obovata is the dominant species of mangrove in Mai Po, which accords with our findings using the SVM + OSTD method.
Table 7.
Class area statistics for SVM classifiers with different features.
Table 7.
Class area statistics for SVM classifiers with different features.
| Area | AM | AI1 | AI2 | KO1 | KO2 | AC | Overall |
|---|
| SVM + OS | 27.3% | 3.3% | 7.1% | 22.3% | 19.7% | 20.3% | 12.25 Ha (100%) |
| SVM + OST | 21.4% | 11.9% | 9.7% | 23.6% | 11.6% | 22.6% | 12.67 Ha (100%) |
| SVM + OSTD | 18.8% | 11.5% | 4.4% | 28.2% | 19.2% | 17.9% | 12.57 Ha (100%) |
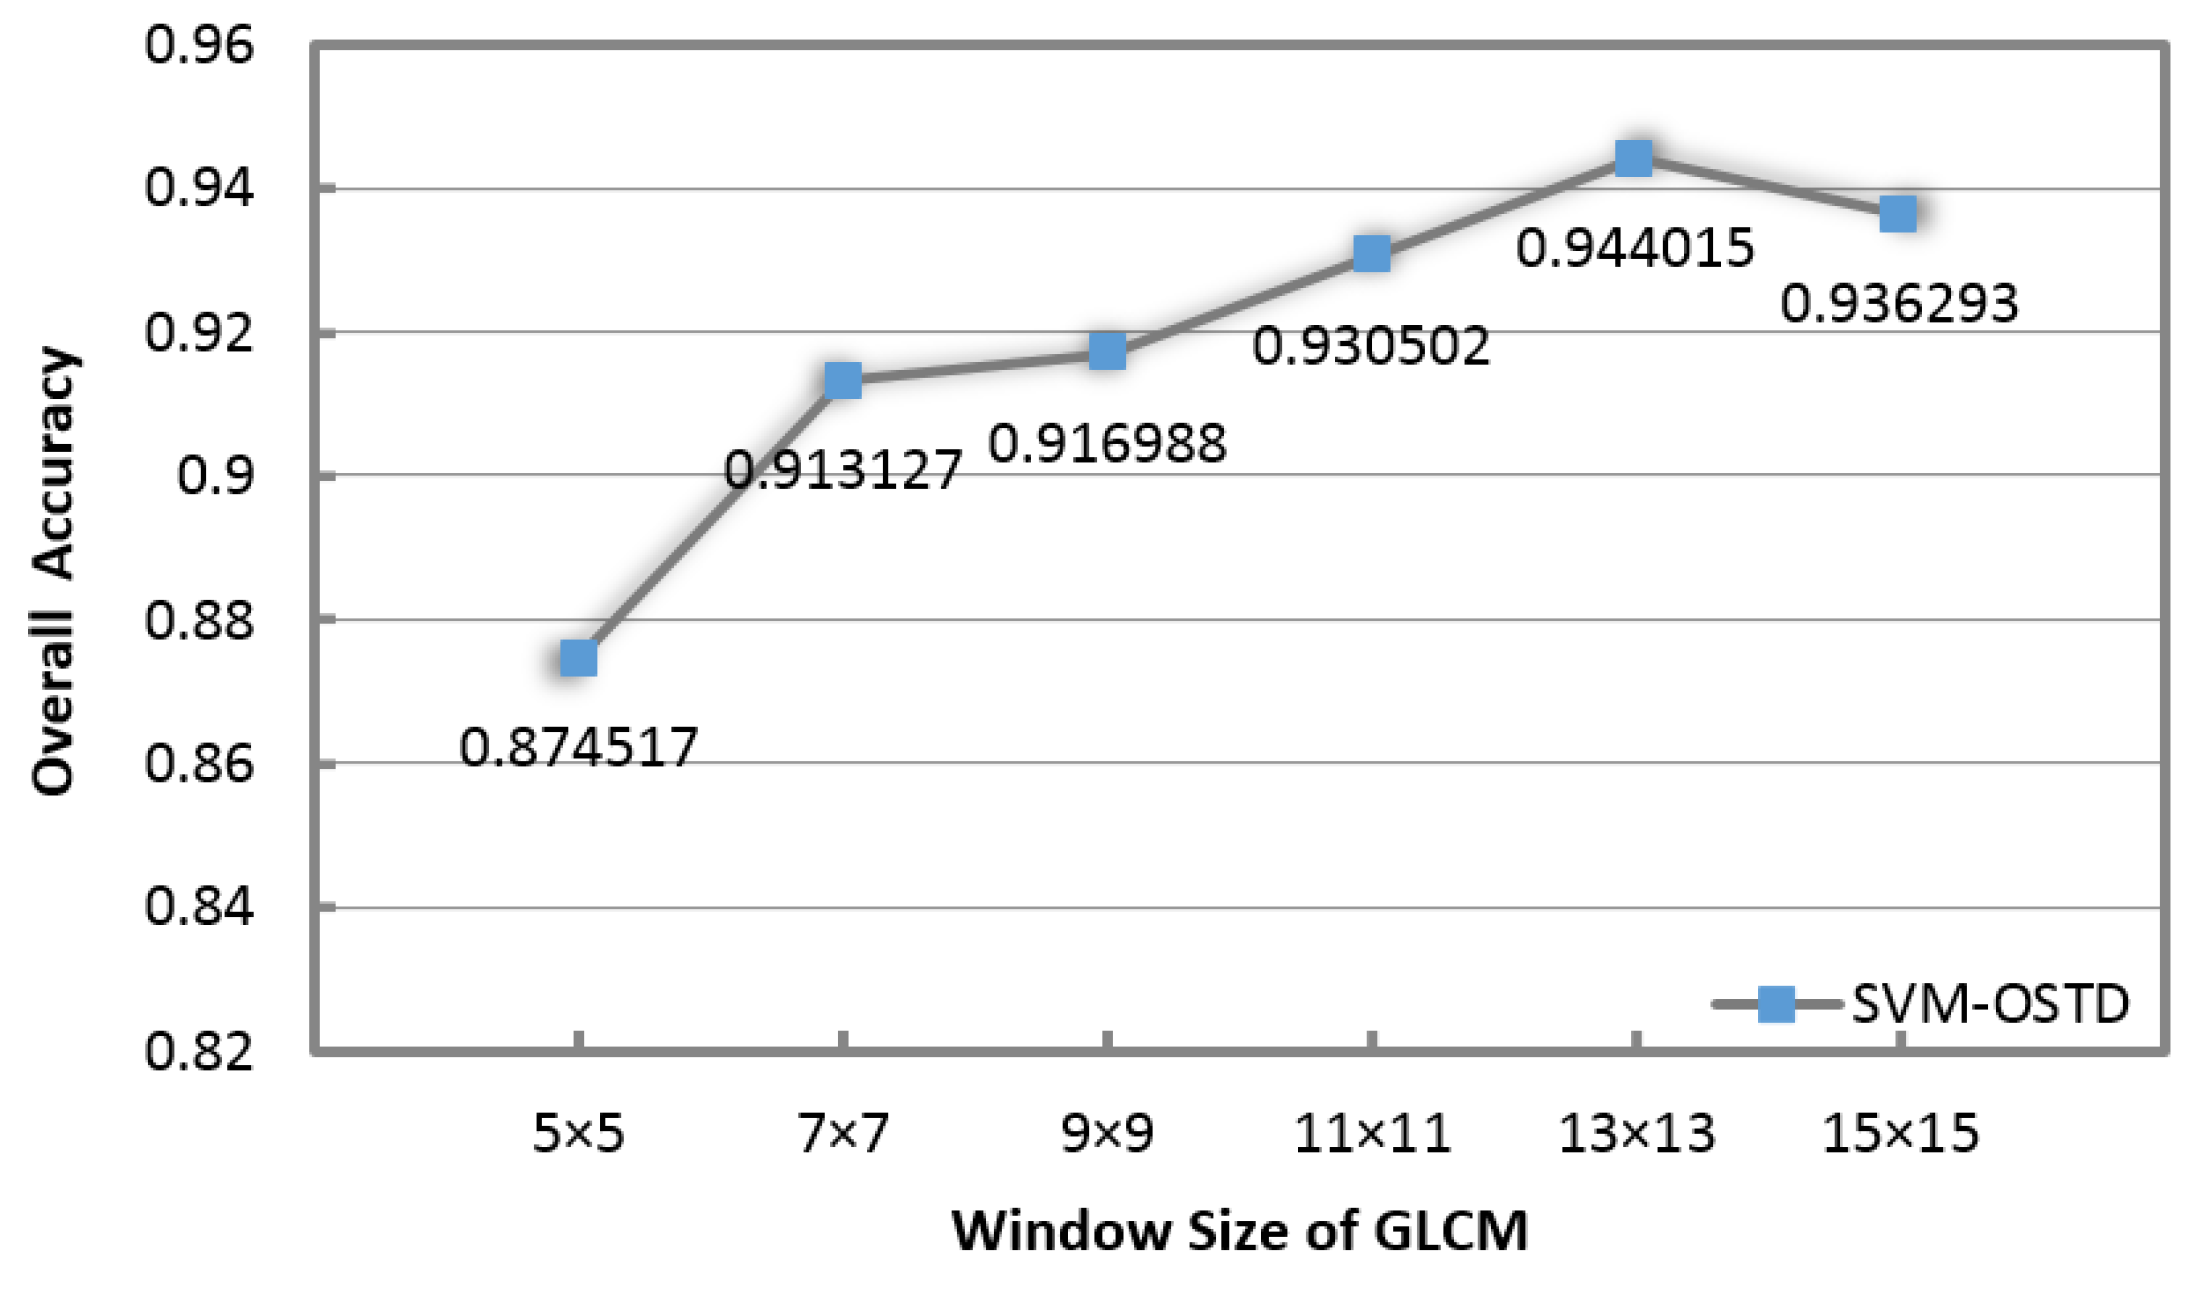
Determining the optimal window size of textural features is important, as an undersized window will fail to fully exploit the textural arrangement of the objects of interest, whereas an oversized window will result in blurring of the object boundaries [
38]. For classification tasks, because the scales of different objects of interest are not identical, a referential window size is preferred. We conducted a sensitivity analysis aimed at determining the optimal window size for calculation of the GLCM matrix. From
Figure 8 it can be observed that the best classification result attained was 94.4% based on a window size of 13 × 13 pixels.
Figure 8.
Sensitivity analysis of the spatial scale adopted in the textural features.
Figure 8.
Sensitivity analysis of the spatial scale adopted in the textural features.
When conducting this method, no more data inputs are required besides all the eight multispectral bands of WorldView-3 imagery. There is only one parameter in the feature extraction process: the window size of GLCM, which should be settled according to difference cases. The optimal value of the window size is determined by many factors, such as the scale of the interested object. In the classification process using these integrating features, cross validation could be resorted to as an easy-way to tune the parameters in SVM classifier for best performances. We’ve reduced the level of difficulty of classification by focusing solely on the mangrove area. However, when the area covers a more complex distribution of landscapes, the effectiveness of the proposed method should be further tested and discussed.


