Article

Responses of Natural Vegetation Dynamics to Climate Drivers in China from 1982 to 2011

State Key Laboratory of Hydroscience and Engineering, Department of Hydraulic Engineering, Tsinghua University, Beijing 100084, China
*
Author to whom correspondence should be addressed.
Current Address: Nicholas School of the Environment, Duke University, Durham, NC 27708, USA
Remote Sens. 2015, 7(8), 10243-10268; https://doi.org/10.3390/rs70810243
Submission received: 23 March 2015 / Revised: 6 July 2015 / Accepted: 23 July 2015 / Published: 11 August 2015

Abstract

:
This study investigated the spatiotemporal variation of vegetation growth and the influence of climatic drivers from 1982 to 2011 across China using datasets from the Normalized Difference Vegetation Index (NDVI) and climatic drivers. Long term trends, significance and abrupt change points of interannual NDVI time series were analyzed. We applied both simple regression and multi-regression models to quantify the effects of climatic drivers on vegetation growth and compare their relative contributions. Results show that on average, the growing season NDVI significantly increased by 0.0007 year 1 , with 76.5% of the research area showed increasing NDVI from 1982 to 2011. Seasonally, NDVI increased at high rates during the spring and autumn while changed slightly during the summer. At a national scale, the growing season NDVI was significantly and positively correlated to temperature and precipitation, with temperature being the dominant factor. At regional scales, the growing season NDVI was dominated by increasing temperature in most forest-covered areas in southern China and dominated by precipitation in most grassland in northern China. Within the past three decades, the increasing trend of national mean NDVI abruptly changed in 1994, slowing down from 0.0008 year 1 to 0.0003 year 1 . To be regional specific, the growing season NDVI in forest covered southern China has accelerated together with temperature since mid 1990s, while parts of the grassland in northern China have undergone stalled NDVI trends corresponding to slowed temperature increment and dropped precipitation since around 2000. Typical region analysis suggested that apart from long term trends and abrupt change points of climatic drivers, the processes of NDVI variation were also affected by other external factors such as drought and afforestation. Further studies are needed to investigate the nonlinear responses of vegetation growth to climatic drivers and effects of non-climate factors on vegetation growth.

1. Introduction

Vegetation as a component of terrestrial biosphere, is a pivotal link between land surface and atmosphere [1,2]. It exerts significant influence on water balance, via evapotranspiration [3,4,5], interception [6] and rooting strategy [7]. Vegetation also shows its ecological importance in regulating carbon cycle with processes of respiration and photosynthesis [8,9,10,11]. Changes in vegetation coverage and biomass can lead to changes in water cycle and ecology balance. Studies have shown that vegetation growth has been strongly influenced by global climate change [12,13]. Hence, understanding the influence of climate on vegetation dynamics is crucial for further evaluation of hydrology and ecology response, and meanwhile helps clarify the relative contribution of human activities to vegetation dynamics.
The influence of climate on vegetation dynamics has drawn increasing attention in the past few decades [14,15,16,17,18,19,20]. Long-term remote sensing observations provide effective methods to investigate interannual vegetation dynamics. The Normalized Difference Vegetation Index (NDVI), which is correlated to Leaf Area Index (LAI) [21] and Gross Primary Production (GPP) [22], is a good indicator for vegetation coverage and biomass, and has been widely used to analyze vegetation dynamics [23,24,25,26,27]. Many researches have investigated NDVI trends in different regions, showing that despite great spatial heterogeneity, NDVI generally increased in national and regional scale in China [19,28], North America [2], east Asia [29] and Euraisa [30]. However, the increasing trends in these areas have slowed down or reversed since mid-1990s, which could be attributed to slowed down temperature trends or more frequent and severe drought [29,31]. The change in NDVI trends were analyzed by comparing trends before and after certain change points. Relationships between NDVI and climatic drivers were typically analyzed with regression method, indicating that NDVI was more sensitive to temperature than precipitation in North America and China and increased corresponding to global warming [2,32]. Most previous studies mainly focused on mean NDVI values within a fixed time period, such as the whole year or uniform growing season (April to October) [20,30,33], which may not properly reflect vegetation growth condition in the growing season that varies with region and vegetation types [34,35]. Especially for China, with its large land area and vegetation diversity, there can be significant difference among the growing seasons in different regions and vegetation types. For example, deciduous broad leaf vegetation in some areas of southern China can have high level of activity from April to late November or even December while grass in parts of Tibetan merely show high activity from late May to early October [28,35]. Moreover, relationships between climatic drivers and NDVI were considered individually with single regression model in previous studies [2,19,30,32]. But since climatic drivers are affecting vegetation growth simultaneously, the contribution of each climate driver to the coupled effect on vegetation dynamics remains unclear. Most previous studies mainly focused on the linear trends and correlations between vegetation growth and climatic drivers. Nevertheless, apart from the linear relationships, non-linear responses such as abrupt change, when the trends or mean values significantly altered before and after the change point, may also exist. The abrupt change points provide information on how and when the responding patterns have changed, which cannot be revealed in the overall linear relationships, hence still deserve further understanding.
The objective of this study is to investigate the interannual dynamics of natural vegetation and the influence of climatic drivers in China mainland during the past three decades, with the newest vegetation data and the ground observation based climate data with higher resolution than previous studies [19,32,36]. To clarify space ranges, we focus on area covered by natural vegetation, excluding cropland and urban area, to diminish effects of anthropologic activities [37,38] on vegetation growth. The time range is mainly confined to the growing season; cases in spring (March to May), summer (June to August) and autumn (September to November) are also investigated for deeper understanding of vegetation variation during different stages of the growing cycle. This study is motivated by the following questions: (1) What are the long term trends of vegetation growth across China and whether the trends have significantly changed within the past three decades? (2) How do climatic drivers influence NDVI variation and what are the dominant factors in different regions? (3) What are the regional specific reasons contributing to the heterogeneous NDVI variation processes? This paper first analyzed the long term trend, significance and abrupt change points in NDVI variation across China (Section 2) and then investigated the relationships with single climate driver and multiple climatic drivers as well as the corresponding abrupt change points of NDVI and climatic drivers (Section 3). Finally, in Section 4, several typical regions were selected as representative for further discussion on different reasons behind long term trends, including other regional specific factors such as drought and afforestation.

2. Datasets and Methods

2.1. Datasets

The NDVI dataset used in this study is the third-generation NDVI (NDVI3g), the newest dataset derived from NOAA/AVHRR produced by the Global Inventory Monitoring and Modeling Studies (GIMMS), at a spatial resolution of 1 / 12 degree ( 0 . 083 ) and 15-day interval, spanning from January 1982 to December 2011. The GIMMS NDVI3g data sets have been corrected to minimize the effects of stratospheric aerosol loadings from volcano eruptions, solar angle and sensor errors, thus are suitable to evaluate the long-term trends in vegetation activity [17,39].
The climate datasets include temperature at 2 m above ground level, precipitation and incoming shortwave solar radiation from1982 to 2010. The air temperature and solar radiation datasets with a high spatial resolution of 0 . 05 × 0 . 05 and 3-hour interval came from the Land-Atmosphere Interaction Research Group at Beijing Normal University [40], generated according to observation data from 700 stations within the mainland of China and handled with interpolation, correction and validation. The daily precipitation data product with resolution of 0 . 25 × 0 . 25 , coming from National Meteorological Information Center (NMIC) [41], was generated according to the meteorological observation data of 2419 stations across the country, which has a higher spatial resolution than 680 stations in the study by Piao et al. [36] and 728 stations by Peng et al. [32]. To uniform the spatial and temporal resolution, all of the climate and NDVI data sets were averaged to half-monthly values and resampled linearly to 0 . 25 × 0 . 25 grids.
The land cover data in 2000 was obtained from the 1-km product SYNMAP [42]. As in previous studies [19,32], dynamic changes of land cover are not considered in this study, which may bring in uncertainties due to change of vegetation type, urbanization, land reclamation, reforestation and etc. The main land cover types in China include evergreen needle forest (ENF), evergreen broadleaf forest (EBF), deciduous broadleaf forest (DBF), mixed forest (MF), shrubs, grasses, crops and barren (Figure 1). Among these land cover types, crops are greatly affected by agricultural management practices and barren shows little vegetation cover, therefore crops, barren and urban area are masked out and only natural vegetation are considered in this study. Human activities affecting natural vegetation were not considered in the study, which might bring in uncertainties to the following analysis. The land cover data were aggregated to grid cells of 0 . 05 × 0 . 05 via majority method in ArcGIS [43] to be consistent with climate and NDVI datasets.
Figure 1. Vegetation distribution in China. ENF, evergreen needle forest; EBF, evergreen broadleaf forest; DBF, deciduous broadleaf forest; MF, mixed forest.
Remotesensing 07 10243 g001

2.2. Methods

2.2.1. Trend Analysis

We fitted trends in NDVI and climate series linearly using ordinary least squares and the F-test was applied to test the statistical significance, taking 0.05 as the significance level in this study. The long term trends draw a general picture on the long term NDVI variation, though the trends might change throughout the 30 years. To address this concern, the non-parametric Pettitt test was applied to identify the abrupt change point [44]. Pettitt test has been widely applied in detecting abrupt change points in climate factors and hydrologic processes [45,46,47,48,49]. It tests the null hypothesis H 0 : the time series follows the same distribution, against the alternative hypothesis H 1 : before and after time t, the two parts of the time series follow different distribution functions [44]. The change point t represents the point when there is an abrupt jump that partitions the time series into two parts [46,50]. One of the advantages of Pettitt test is that it makes no assumption neither on the form of the distribution nor on the location of change. Pettitt test takes a time series with length of T as two groups, i.e., x 1 , ... , x t and x t + 1 , ... , x T . It calculates the statistical function V ( t ) and U ( t ) with the following equations
U t , T = U t = 1 , T + V t , T , t = 2 , ... , T
V t , T = j = 1 T sgn ( x t x j ) , sgn ( x ) = + 1 , x > 0 0 , x = 0 1 , x < 0
The most likely change point can be found at
p ( t ) = max | U t , T |
The approximate significance probability of the most likely change point would be calculated as follows:
P ( t ) = 1 exp ( 6 U t , T 2 T 3 + T 2 )
If P ( t ) > 0 . 95 , it can be considered as a significant change point. Otherwise the time series should be considered as stable.

2.2.2. Growing Season Detection

Growing season is the most active period in the phenology cycle of non-evergreen vegetation, hence it is often used to define developmental stages of vegetation [1]. Mean NDVI values during the growing season can be a better indicator for vegetation growth conditions than that of the whole year since it focuses on developmental stages with high activity and avoids spurious NDVI data outside the growing season, especially in winter [36]. To extract the growing seasons of vegetation across the country, we used a modified Harmonic ANalysis of Time Series (HANTS) algorithm [51,52], which aims to obtain smoother time series by removing abnormal NDVI values and minimizing non-vegetation effects including clouds, aerosol, snow, etc. HANTS uses Fourier analysis iteratively and describes seasonal NDVI variation with several low frequency cosine functions. More technical details of HANTS algorithm can be referred in reference [1].
Considering that the length, start and end of growing season have great impacts on the value of growing season NDVI, to avoid uncertainties in interannual NDVI variation resulting from different growing seasons in different years and grids, we separated the research area into 15 regions according to vegetation and climate types [53]. Each region with the same vegetation and climate type shares the same growing season calculated from the spatial and interannual averaged NDVI from 1982–2011. For non-evergreen vegetation, based on the HANTS smoothed NDVI series, we take the start of season (SoS) as the maximum of the first derivative (maximum change rate), following the method taken by de Jong et al. [1] and White et al. [13]. The end of season (EoS) is defined as the time when NDVI value equals to or drops below the value at SoS. According to the distribution of SoS (Figure 2a) and EoS (Figure 2b), for most of non-evergreen vegetation across the country, SoSs vary from April to May and EoSs vary from October to December. The growing seasons of vegetation in southern China begin earlier and end later than those in northern China. It should be noted that for evergreen vegetation, high activity lasts throughout the year thus the growing season is taken as entire year.
Figure 2. Spatial distribution of the growing season for non-evergreen vegetation in China. (a) start of season (SoS); (b) end of season (EoS). a and b in the legend denote the first half and the second half of a month respectively.
Remotesensing 07 10243 g002

2.2.3. Regression Analysis

(1) Single driver regression analysis
We conducted linear regressions to investigate the relationships between NDVI and single climate driver over the past 30 years as following:
NDVI = β 0 + β 1 CLM
where: CLM denotes climatic drivers, including air temperature, precipitation and incoming shortwave solar radiation; β 1 is the regression coefficient of climate driver to NDVI. Since there is no significant autocorrelation in the growing season NDVI series under 95% confidence bounds, autocorrelation will not be considered in our regression analysis. The influences of climatic factors on the variation of NDVI can be inferred via the linear regression coefficients. Despite the discrepancy between causation and correlation, as most of the previous studies [19,30,36,38], we assumed that it was highly possible that the NDVI variation was influenced by the correlated climatic factor, yet one should notice that uncertainties exist in this kind of “causation”. Here the single regression coefficients indicate the direct response of NDVI to unit change in single climate driver, meanwhile can be compared with previous studies to highlight our findings.
(2) Multiple drivers regression analysis
To consider the effects of multiple climate drivers simultaneously and compare their relative effects, a multiple regression model was applied:
NDVI NDVI ¯ σ NDVI = β 0 + β 1 CLM 1 CLM 1 ¯ σ 1 + ... + β n CLM n CLM n ¯ σ n
where: CLM 1 ( i = 1 , 2 , ... , n ) are climatic drivers; NDVI ¯ and CLM 1 ¯ are interannual mean values of NDVI and climatic drivers respectively; σ NDVI and σ i are standard deviations of NDVI and climatic drivers respectively. Each time series, was normalized by subtracting its mean value and divided by its standard deviation thus the unit change in each variable has the same statistical meaning. Therefore the regression coefficients β i reflect the relative effect or contribution of each climate driver on NDVI respectively and can be compared directly. T-test was used to test the significance of these regression coefficients. With the multi regression above, climatic factor with larger coefficient should have contributed more to the variation of NDVI, hence was identified as the dominant climatic factor for the NDVI variation.
Figure 3. Interannual variation of mean temperature and precipitation in (a) growing season; (b) spring; (c) summer and (d)autumn in China from 1982 to 2010.
Remotesensing 07 10243 g003

3. Results and Discussion

3.1. Trends of Climatic Drivers

During the period of 1982–2010, national mean temperature in each season significantly increased (Figure 3). In western China and parts of northern China, which are mainly covered by grass, temperature increased at high rates greater than 0.05 C per year on average (Figure 4a). However, the trends of precipitation were insignificant at a national scale (Figure 3), and showed great spatial heterogeneity across the country (Figure 4b). Precipitation increased in northern Xinjiang, northern Qinghai, western Tibetan and some parts of southern China while it decreased in most parts of northern China.
Figure 4. Map of growing season (a) temperature and (b) precipitation trends across China from 1982 to 2010.
Remotesensing 07 10243 g004

3.2. Trends of NDVI

3.2.1. Trends of Areal Average NDVI

At a national scale, a significant increasing trend of 0.0007 year 1 ( R 2 = 0 . 37 , p < 0 . 01 ) (Figure 5a) was observed in the mean growing season NDVI, indicating that the overall growing season NDVI has increased by 4.6% over the past 30 years. 1994 was a significant change point for the growing season NDVI. The increasing trend decreased by 62.5%, from 0.0008 year 1 before 1994 to 0.0003 year 1 after 1994, indicating that at a national scale, the increase of the growing season NDVI has slowed down since the mid of 1990s. This phenomenon was also reported in previous studies in North America [2], Eurasia [30] and East Asia [29]. These studies compared the change points in vegetation and climate factor series, and suggested that climate change is most likely to be responsible for the stalled or reversed trends of NDVI in mid-1990s. Although in this study, no significant abrupt change point corresponding to that in NDVI series was observed in either mean temperature or mean precipitation time series at a national scale, it is possible that these relations are regional specific hence cannot be revealed in terms of national average. Further relations between abrupt change points of climate factors and NDVI series will be discussed in Section 3.3.4. The overall trend of growing season mean NDVI (0.0007 year 1 ) was slightly higher than that of the whole year mean NDVI (0.0006 year 1 ) reported by Xu et al. [19]. This slight discrepancy implies that NDVI increased faster in the growing season than in the rest periods of a year, though the different areas that were masked out might also contribute to the difference.
Among the three seasons (Figure 5b–d), NDVI increased at the highest rate of 0.0009 year 1 ( R 2 = 0 . 29 , p < 0 . 01 ) in spring, followed by that in autumn (0.0006 year 1 , R 2 = 0 . 22 , p < 0 . 01 ). While in summer, the trend was almost zero. Moreover, the increasing trend in spring reversed at 1996, changing from 0.0008 year 1 to −0.0002 year 1 while no abrupt change points were observed in summer and autumn. Therefore, despite the slight discrepancy between the two change points of NDVI in the growing season and spring, the stalled trend of NDVI in the growing season can be mainly explained by the reverse trend in spring, which partly overlaps with early growing season.
Figure 5. Interannual variation of NDVI in (a) growing season; (b) spring; (c) summer and (d) autumn over the period of 1982–2011 in China. Solid lines are trend lines over the past 30 years and dash lines are trend lines before and after abrupt change point (TP).
Remotesensing 07 10243 g005

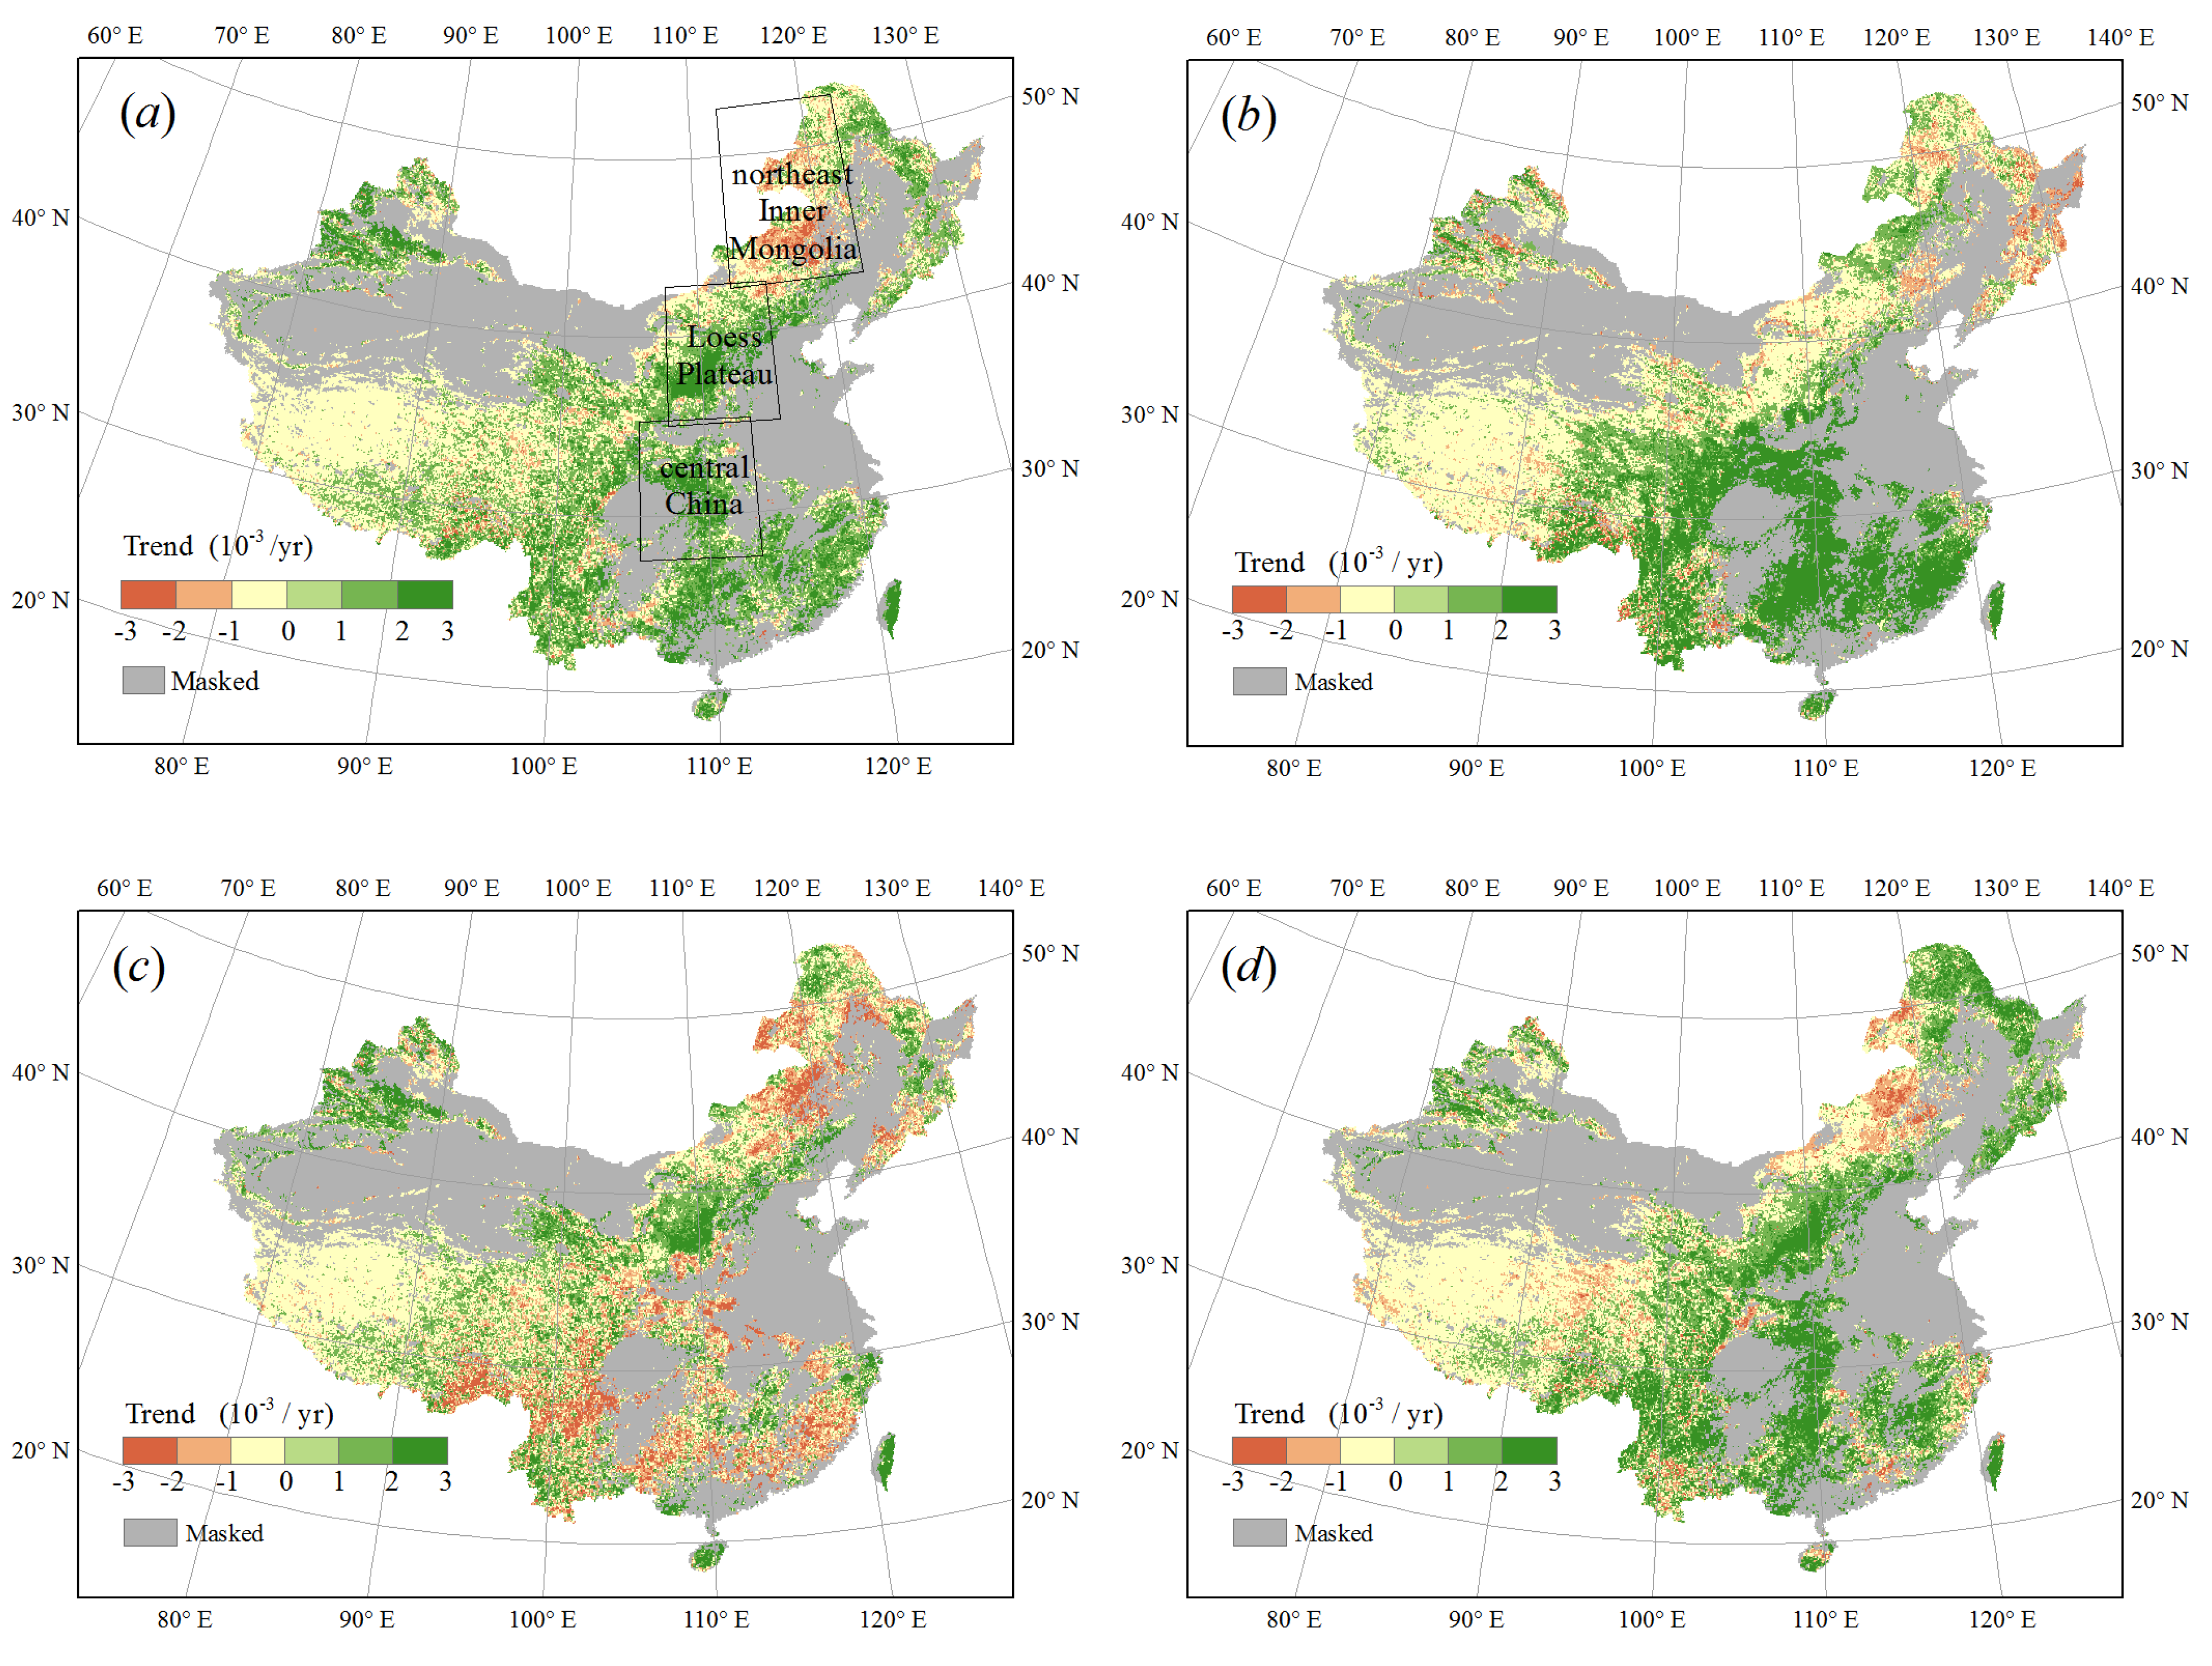
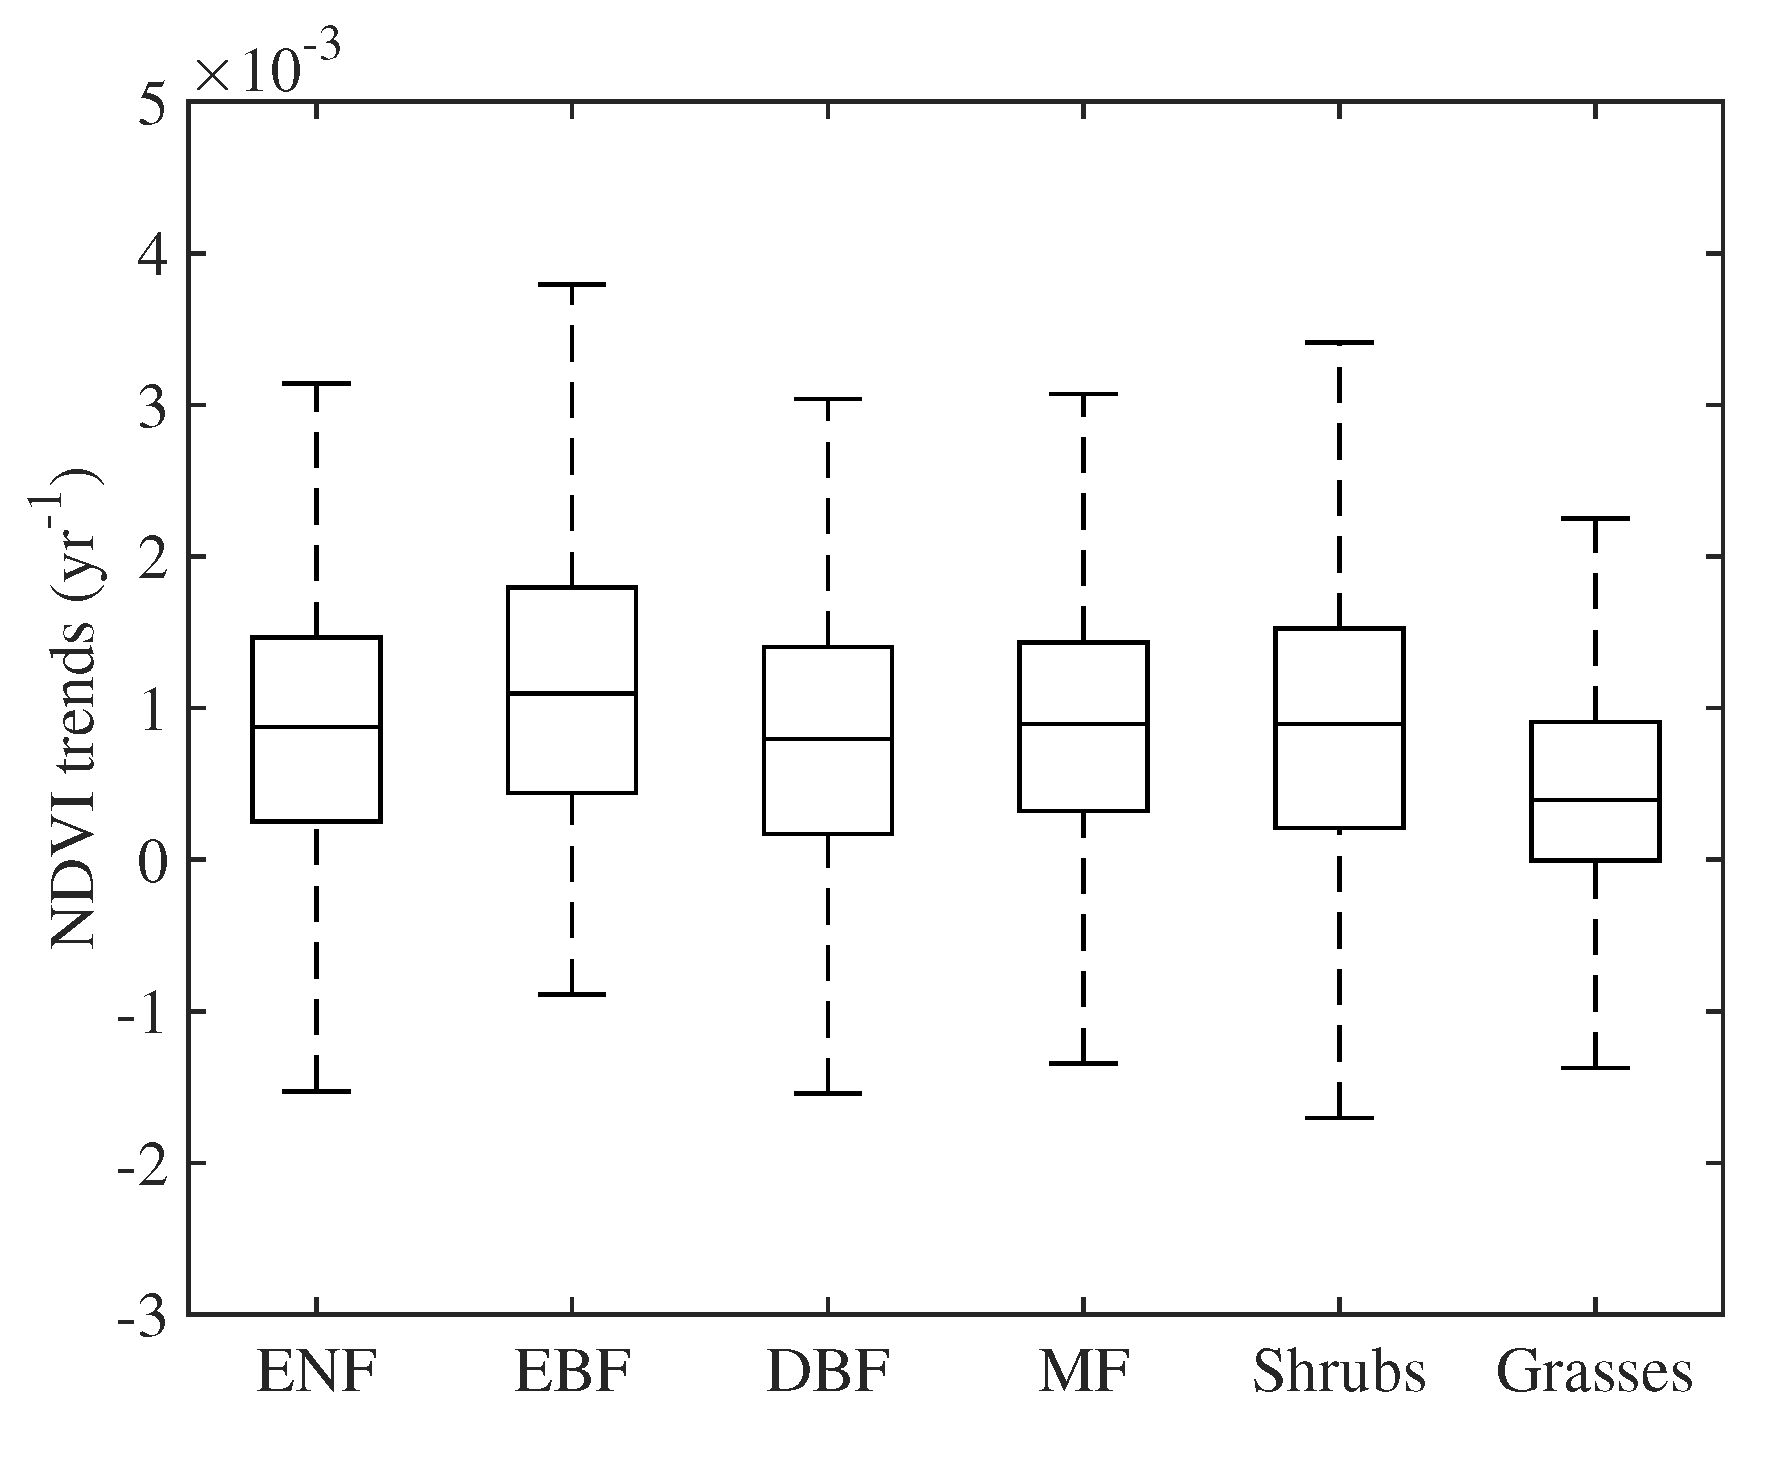
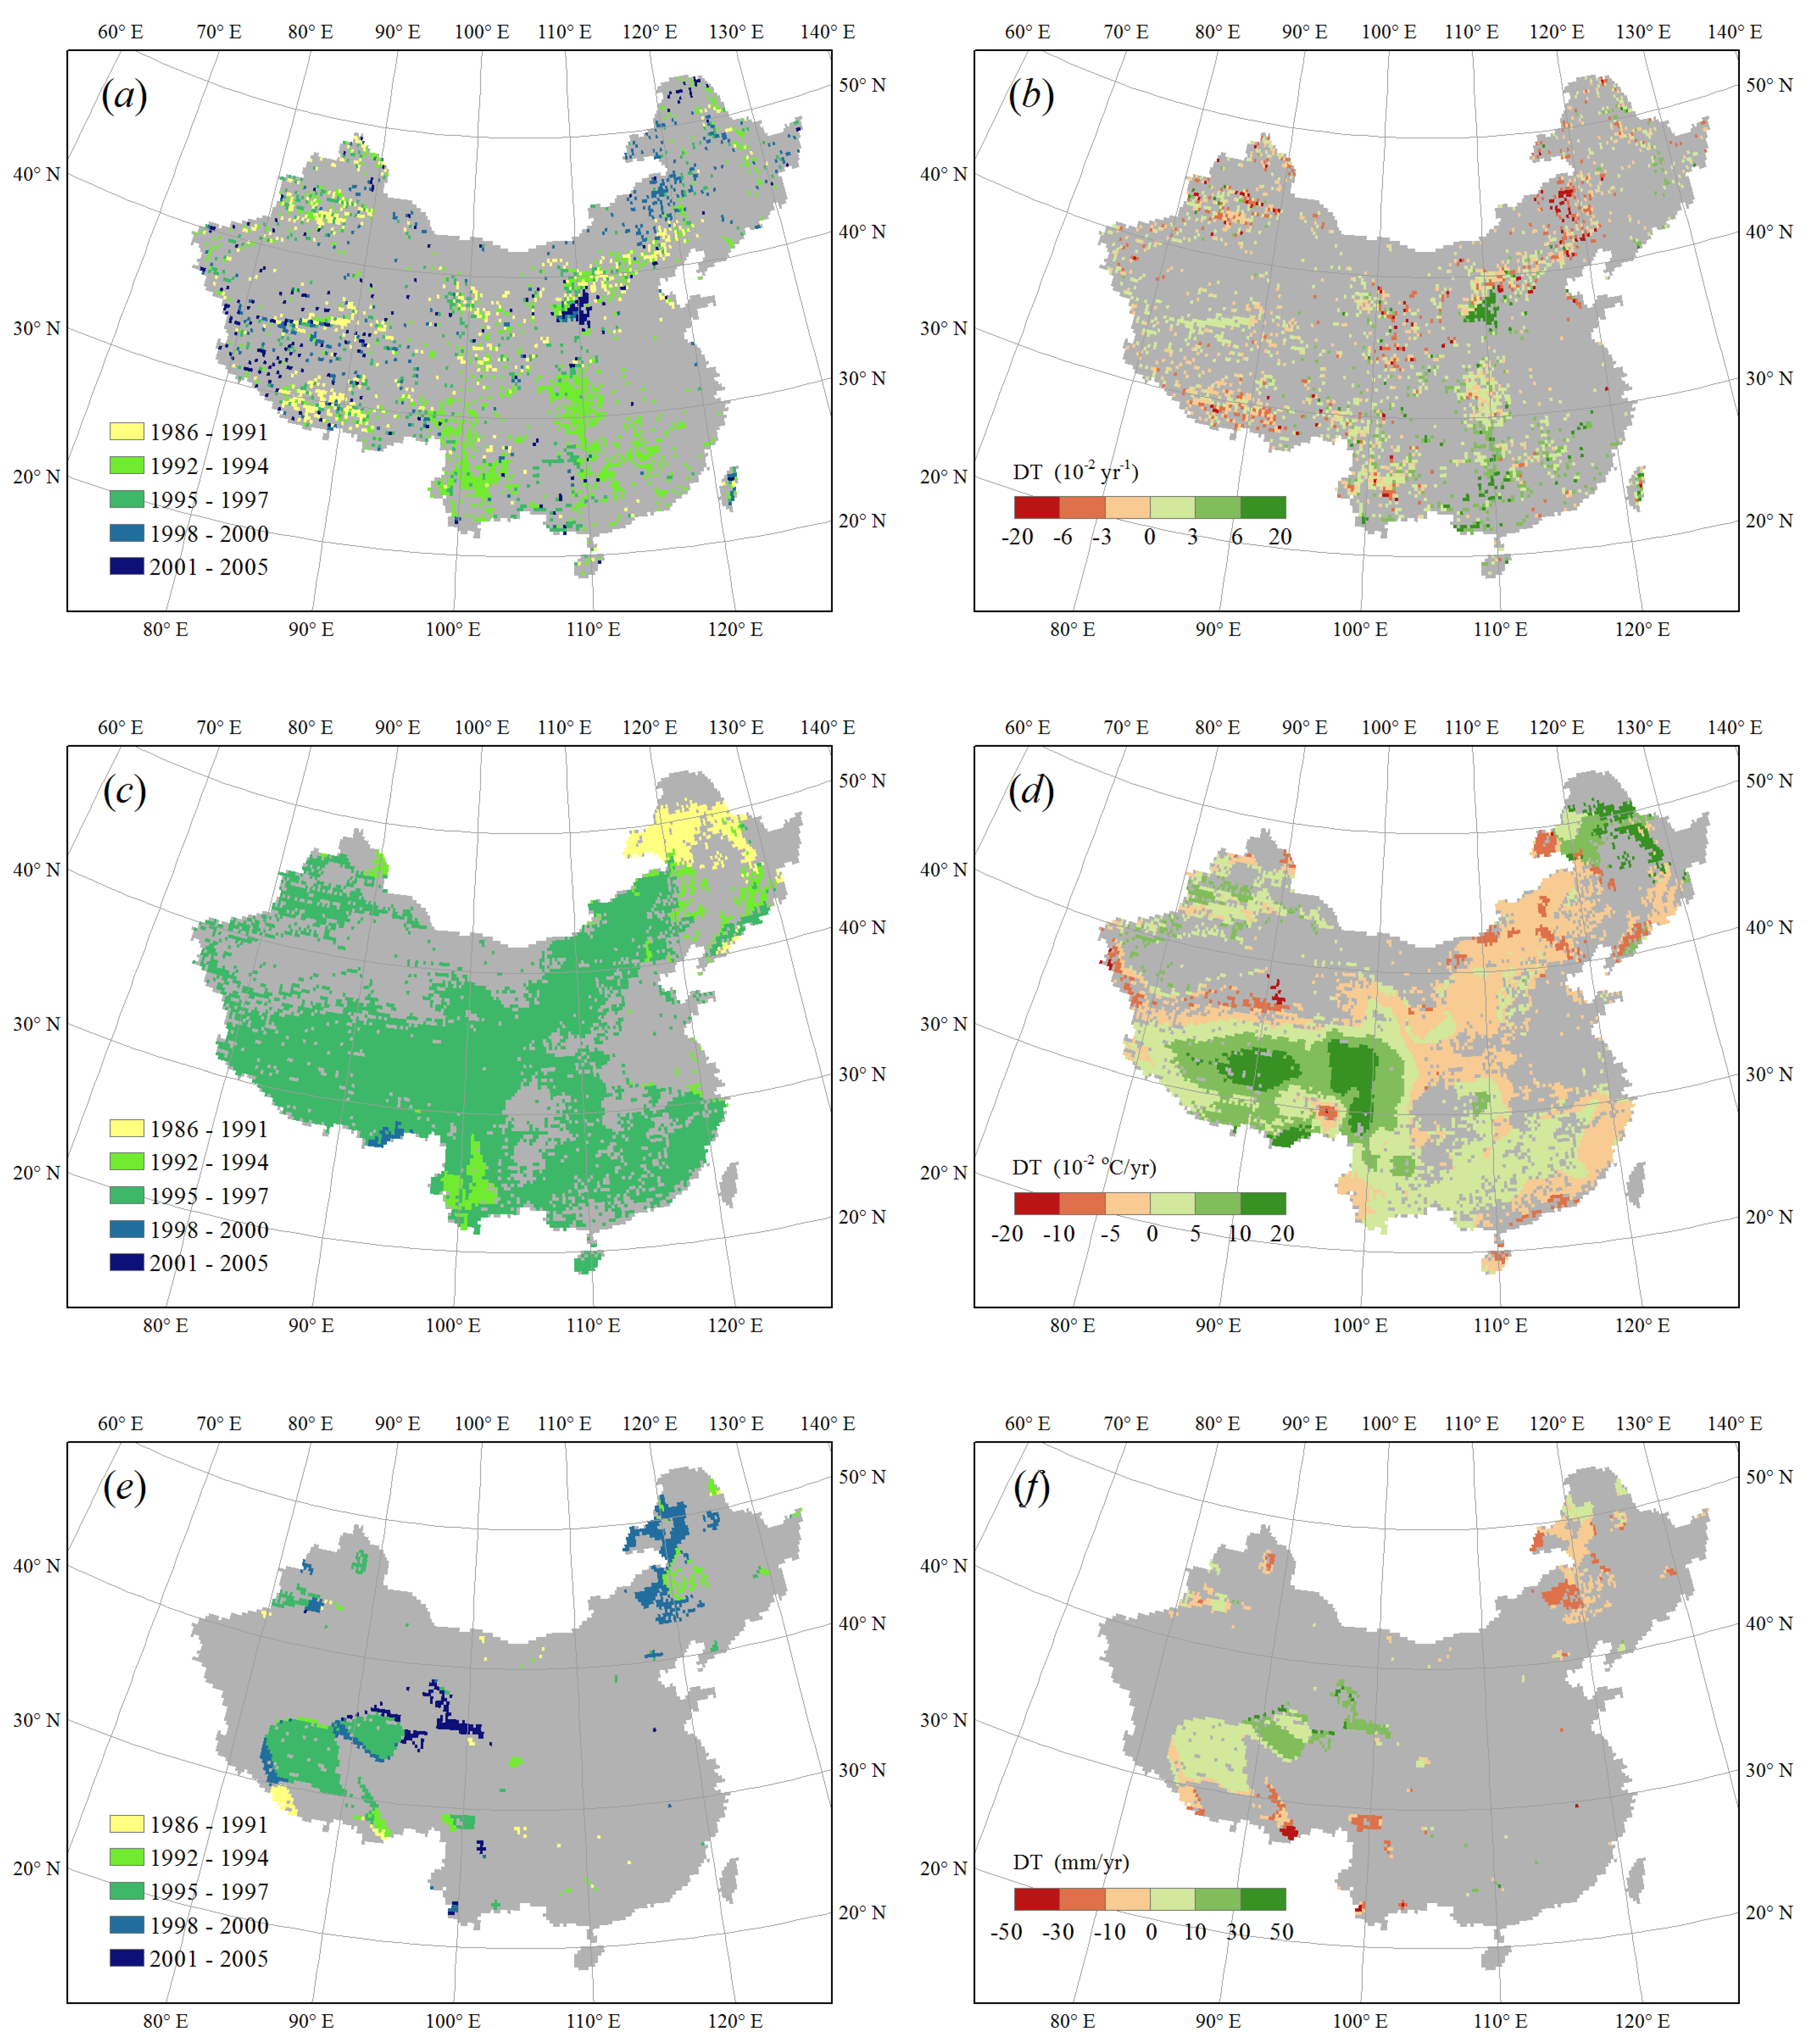
3.2.2. Spatial Pattern of NDVI Trends

The trend of NDVI showed strong spatial heterogeneity across China (Figure 6). From 1982 to 2011, the growing season NDVI in 75.6% of the research area increased (30.5% of the total increased significantly), especially in grass covered Loess Plateau and northern Xinjiang as well as forested northeastern and southern China (Figure 6a). Merely a small portion of research area such as grassland in northeast of Inner Mongolia showed sharp decreasing trends. In spring (Figure 6b), NDVI increased at high rates in 72.7% of the area, mainly evergreen broadleaf forest, evergreen needle forest and deciduous broadleaf forest in central and southern China, while NDVI in grasses and shrubs in northern China and west Tibetan only changed slightly. However in summer (Figure 6c), decreasing trends were found in a large portion of area (41.7%), despite grasslands in Loess Plateau and northern Xinjiang showed increasing trends. The pattern of NDVI trends in autumn (Figure 6d) was similar to that in the growing season, with increasing trends in 71.8% of the area. Despite the strong spatial heterogeneity in the growing season NDVI trends, the NDVI trends within each land cover type did not vary much in terms of both median and variation range (Figure 7). The medians of trends in ENF, EBF, DBF, MF, shrubs and grasses were 8 . 7 × 10 4 , 10 . 9 × 10 4 , 8 . 0 × 10 4 , 8 . 9 × 10 4 , 9 . 0 × 10 4 , 3 . 9 × 10 4 respectively. Despite the relatively higher trends in EBF and lower trends in grasses due to increased temperature and decreased precipitation respectively (see Section 3.3.2 for details), the differences among different land cover types were relatively small compared with the variation range within each type, suggesting that land cover type itself may not make a big difference in NDVI trends, yet climatic drivers could have led to the large heterogeneity within each type.
Figure 6. Spatial patterns of NDVI trends in (a) growing season; (b) spring; (c) summer and (d) autumn over the period of 1982–2011.
Remotesensing 07 10243 g006
Figure 7. Box plot for the trends of growing season NDVI of Evergreen Needle Forest (ENF), Evergreen Broadleaf Forest (EBF), Deciduous Broadleaf Forest (DBF), Mixed Forest (MF), Shrubs and Grasses from 1982 to 2011. The edges of the boxes are 25th and 75th percentiles [54].
Remotesensing 07 10243 g007

3.3. Responses of Vegetation Dynamics to Climatic Drivers

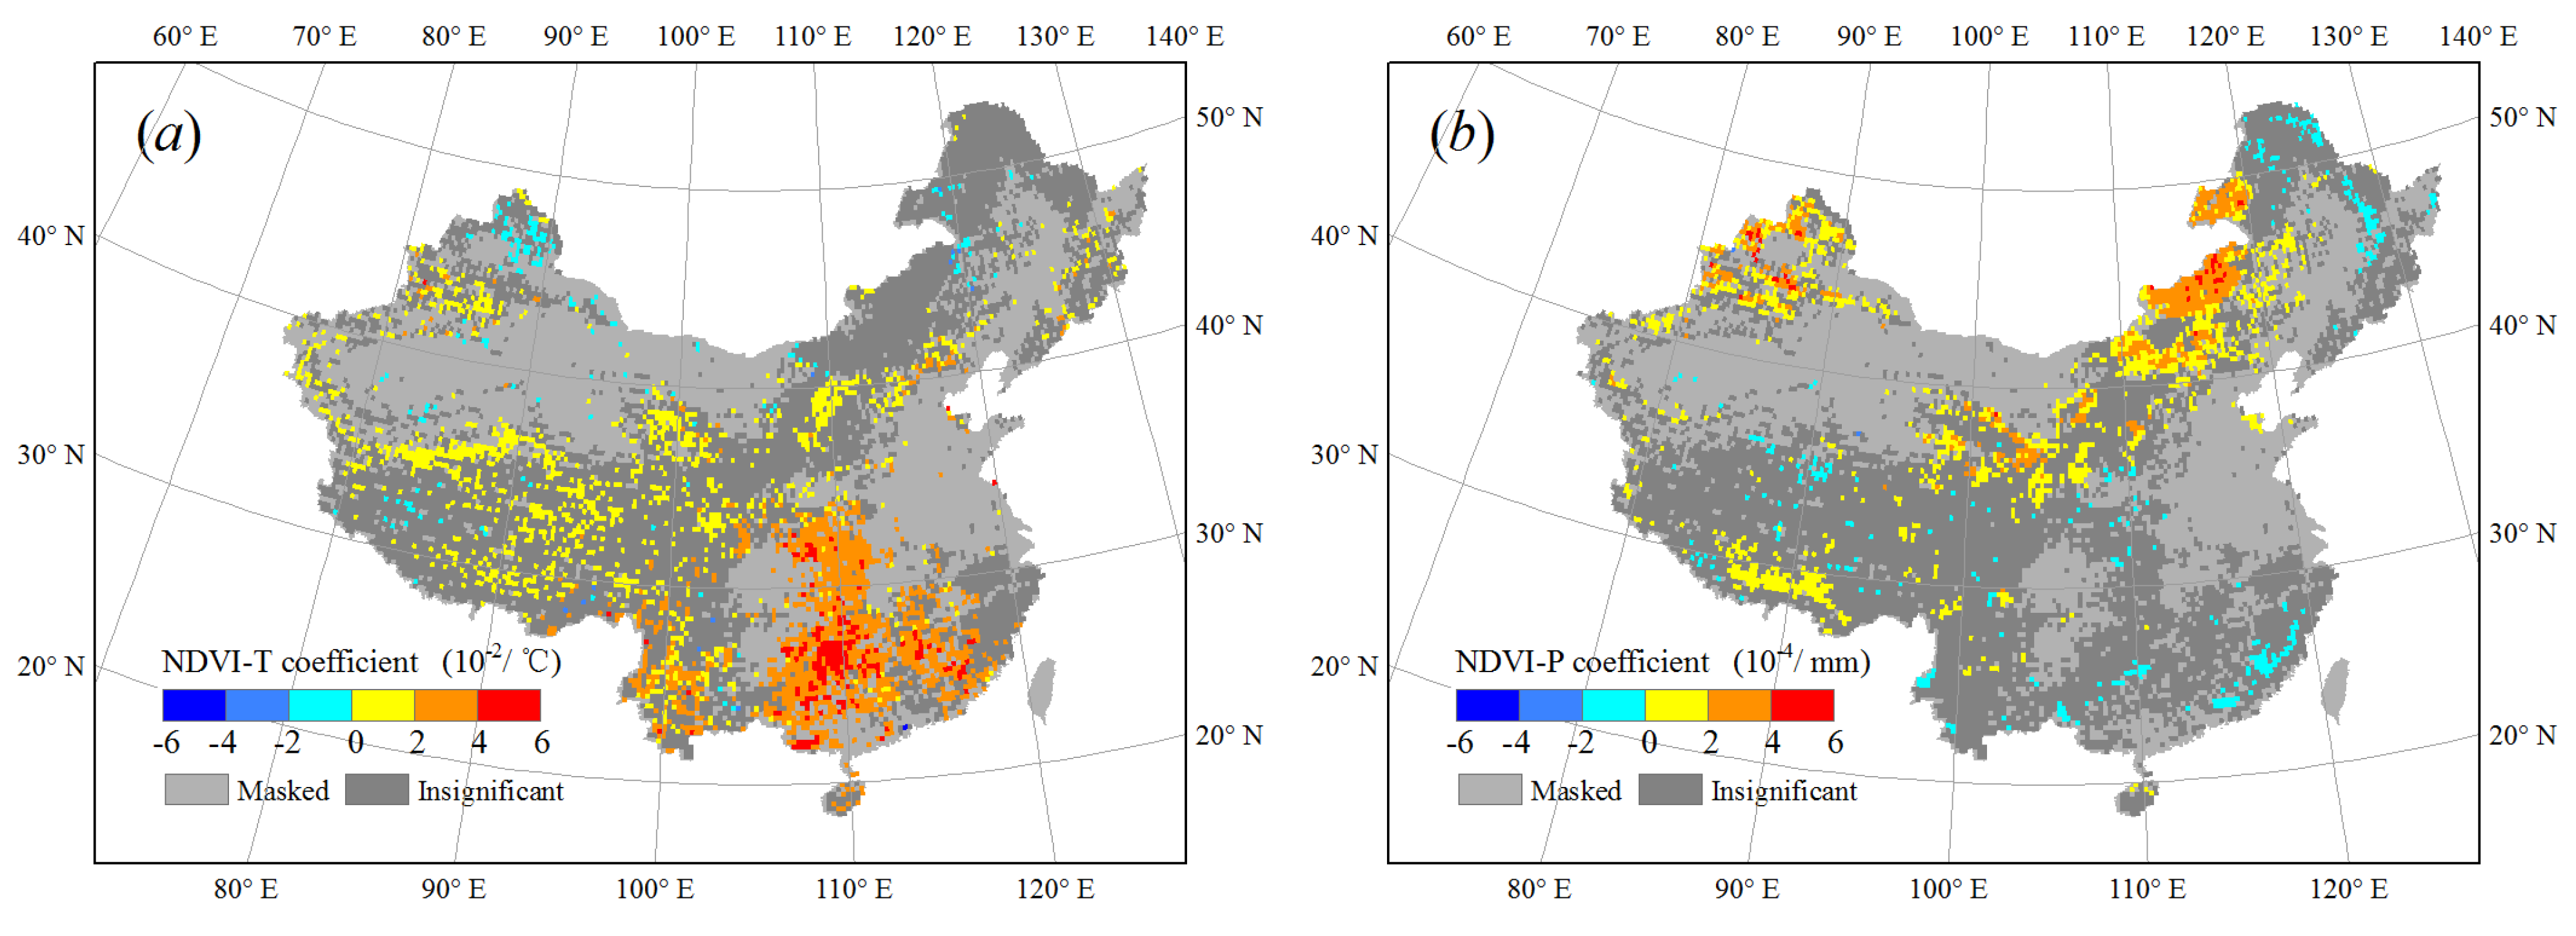
3.3.1. Relationships between NDVI and Single Climate Driver

Mean NDVI within the growing season, spring, summer and autumn were calculated for the following regression analysis. At a national scale, the growing season NDVI was significantly and positively correlated with temperature ( R 2 = 0 . 382 , p < 0 . 01 ) and precipitation ( R 2 = 0 . 103 , p < 0 . 05 ), but not significantly correlated with radiation over the period of 1982–2010 (Table 1). Seasonally, NDVI was significantly and positively correlated with temperature in spring ( R 2 = 0 . 525 , p < 0 . 01 ) and autumn ( R 2 = 0 . 291 , p < 0 . 01 ), especially in spring, when the high regression coefficient indicated a strong linkage between spring NDVI and temperature. No significant correlation between NDVI and precipitation was found in any of the other three seasons. The regression analysis at a national scale suggested that vegetation was greatly affected by temperature, consistent with previous studies [55,56]. Since radiation showed little correlation with NDVI and the influence directions were unstable, for simplification, it won’t be further discussed below.
Table 1. Regression coefficients between NDVI and temperature ( β T ), NDVI and precipitation ( β P ) and NDVI and radiation ( β R ) during the growing season, spring, summer and autumn from 1982 to 2010. (** p < 0 . 01 ; * p < 0 . 05 ).
Period β T ( × 10 3 / C) β P ( × 10 6 / mm ) β R ( × 10 3 / W / m 2 )
Growing season9.321 **8.349 *−3.107
Spring15.935 **7.8268.241
Summer3.9777.0785.334
Autumn8.903 **4.554−6.949
Figure 8 showed the spatial patterns of regression coefficients between temperature and NDVI, and precipitation and NDVI, respectively, in the growing season. Over the period of 1982-2010, NDVI was significantly and positively correlated with temperature in about 26.6% of the area (Figure 8a). Particularly, in southern China, where the main vegetation types are evergreen broadleaf forest and deciduous broadleaf forest (Figure 1), the high regression coefficients indicated that temperature rise has strongly promoted vegetation growth in these areas. In 17.7% of the area, NDVI was significantly and positively correlated with precipitation (Figure 8b), mainly in arid or semi-arid areas in northern China where the growth of grass is under water stress. In northeast Inner Mongolia, NDVI decreased (Figure 6a) due to severe water limitation with decreasing precipitation (Figure 4b) while in the grassland of northern Qinghai, NDVI increased (Figure 6a) with more water supply from precipitation (Figure 4b).
Our results indicated that NDVI was significantly and positively correlated with temperature in large amount of area in China, which is consistent with previous studies [2,19,28,32]. However, compared to the previous study [19] suggesting little significant correlations between annual NDVI and precipitation in these areas, the significant correlations in the growing season highlighted the strong effect of the growing season precipitation on the growth of grasses in arid and semi-arid areas.
Figure 8. Map of regression coefficients between the growing season mean NDVI and (a) growing season mean temperature; (b) growing season total precipitation. Light gray pixels are masked out according to land cover and dark gray pixels show insignificant trends.
Remotesensing 07 10243 g008
Table 2. Relative effects of temperature ( β NDVI T ) and precipitation ( β NDVI P ) on NDVI during the growing season, spring, summer and autumn at a national scale from 1982 to 2010. Significant coefficients verified with t-test are noted with “**” under significance level of 0.05 and noted with “*” under significance level of 0.10.
PeriodsGrowing SeasonSpringSummerAutumn
β NDVI T 0.583 **0.726 **0.1760.560 **
β NDVI P 0.228 *−0.0800.1280.177

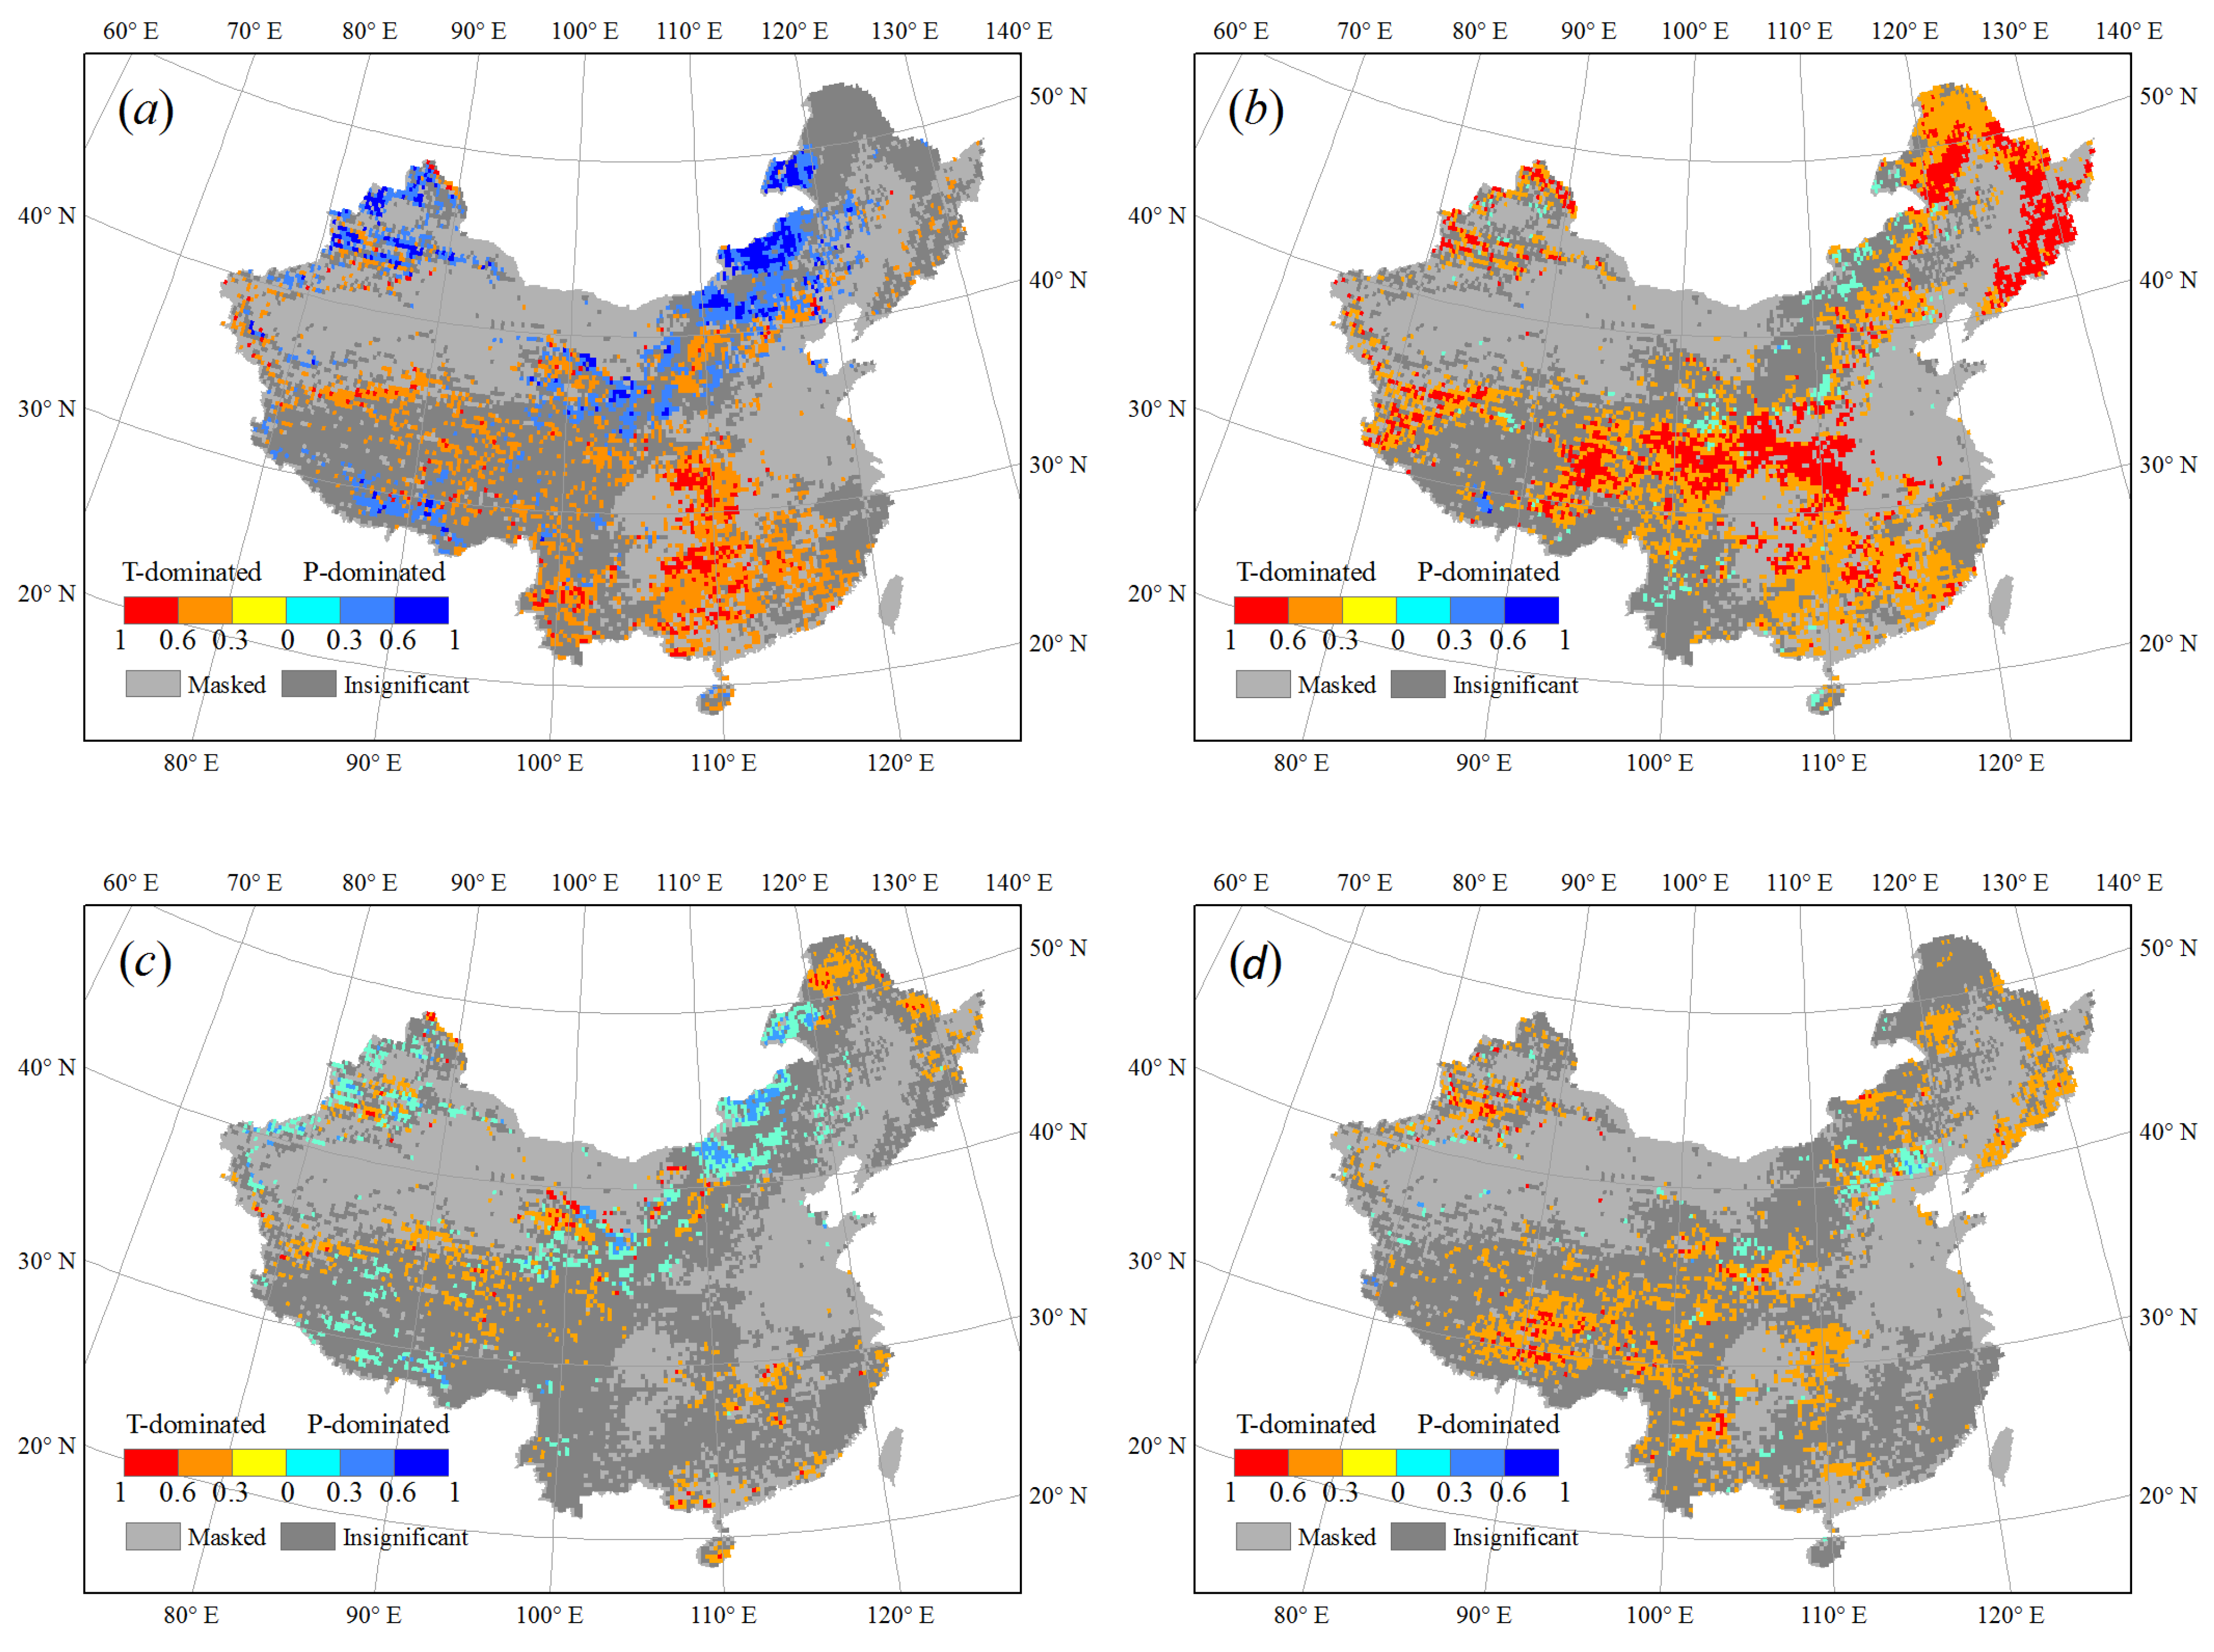
3.3.2. Relationships between NDVI and Multiple Climate Dirvers

According to the normalized multiple regression (Equation (6)), temperature had a larger relative effect on NDVI than precipitation at a national scale during the four periods (Table 2). This quantitatively illustrates that on average, vegetation growth was more affected by temperature than precipitation in China. The largest relative effect of temperature was in spring with value of 0.726, suggesting that temperature rise has greatly motivated vegetation growth in spring. Precipitation exerted larger relative effect in the growing season than any of the other three seasons. Growing seasons represent the periods when vegetations are highly active, while the other three seasons are only part of or partly included in the growing season. Hence the high correlation between growing season precipitation and NDVI highlighted the importance of precipitation during high vegetation activity periods.
Figure 9. Spatial distribution of dominant climatic drivers in (a) growing season; (b) spring; (c) summer and (d) autumn. Pixels in red are temperature-dominated and pixels in blue are precipitation-dominated. Darker color represents larger relative effect. Light gray pixels are masked out according to land cover and dark gray pixels show insignificant coefficients.
Remotesensing 07 10243 g009
Among temperature and precipitation, the one with larger and significant relative effect to NDVI was taken as the dominant climate driver for each pixel. Figure 9 illustrates the spatial patterns of dominant climatic drivers in the four periods. In the growing season (Figure 9a), vegetation growth was strongly dominated by temperature in most of the forest-covered (including EBF, ENF and DBF) southern China (26.5% of the research area) and by precipitation in grass-covered arid or semi-arid northern China (17.4% of research area). The study by Li and Guo [26] also found that precipitation has exerted more effects on NDVI than temperature in semi-arid grassland in Canada. A large portion (51.3%) of the research area was temperature-dominated in spring (Figure 9b), especially in northeastern and central China where the majority of vegetation is deciduous broadleaf forest (Figure 1). The large relative contributions of temperature highlight the crucial effect of spring temperature on vegetation growth again. In summer (Figure 9c), 10.7% of the area, mainly the grassland in northern China such as northeast Inner Mongolia, was slightly dominated by precipitation and 12.3% of the area was dominated by temperature. However, these two climatic drivers did not have significant controlling effect on NDVI in most parts of southern China during summer. In autumn (Figure 9d), there was little precipitation-dominated area, while 24.0% of the area, including deciduous broadleaf forest in northeastern and central China, grassland in eastern and southern Tibetan, west of Loess Plateau and northern Xinjiang showed increasing NDVI corresponding to temperature rise.
Both the national scale and pixel scale regressions highlighted the strong effects of the temperature in the spring and the precipitation in the whole growing season on the NDVI variation. With the multiple regression analysis, this study is among the first to reveal that the growing season NDVI in northern grassland was mostly dominated by precipitation while that in the southern forest was mostly dominated by temperature. Nevertheless, the variation of vegetation growth cannot be fully explained by the relationship with climatic drivers, other factors such as time lag [19], precipitation intensity, altitude [35], CO 2 concentration and nitrogen deposition [57] can also play vital roles in trends of vegetation growth, about which further study is needed.

3.3.3. Impacts of Time Lag on the Regression Analyses

It has been pointed out that the response of NDVI to climatic drivers could lag by several months. Under different contexts and purposes, the time lag could refer to the temporal discrepancy between the maximum trends of NDVI and climatic drivers [36], or the temporal discrepancy between the highly correlated NDVI and climatic drivers [19,58]. In our case, in order to evaluate (1) how much areas were significantly affected by lag effects and (2) within these areas, how much the difference would be by considering lag effects or not, we performed the regression below for each pixel:
NDVI = β 0 + β 1 CLM + β 2 CLM −1
where: NDVI and CLM are the NDVI and climatic drivers within the season (including growing season, spring, summer and autumn,) respectively; CLM −1 is the climatic drivers ahead of the season, with the same length as the season, representing the antecedent climatic conditions. Similar to the previous studies [58,59] investigating the effects of antecedent climatic conditions, we quantify the antecedent condition CLM −1 as the average within the period just ahead of and with the same length as the current season. There should not be an overlapping period between CLM and CLM −1 to avoid dependency. T-test was used to test the significance of each regressor. Pixels with significant β 2 were taken as areas showing significant lag effects.
Results show that only 4.13% and 3.99% of the whole research area showed significant lag effects of temperature and precipitation respectively on the growing season NDVI (Table 3). Within the 4.13% and 3.99% of the area, compared with the β 1 in Equation (5), the β 1 in Equation (7) were merely 8.43% and 4.48% smaller respectively on average. Hence the lag effects of climatic drivers on the NDVI were neglectable at the growing season scale. For the three seasons of spring, summer and autumn, significant lag effects were observed in less than 6% of the area for both temperature and precipitation, except that precipitation had significant lag effects on the summer and autumn NDVI in 12.29% and 14.78% of the area respectively, mainly in the grassland of Loess Plateau and northern Xinjiang. Nevertheless, within the 14.78% of the total area with significant lag effects of summer precipitation on autumn NDVI, the relationships between the autumn precipitation and the autumn NDVI and were merely 6.06% smaller on average if significant lag effects were considered than not. Similarly, within the 12.29% of the total area with significant lag effects of spring precipitation on summer NDVI, the relationships between the summer precipitation and the summer NDVI and were merely 9.22% smaller on average if significant lag effects were considered than not. Hence the seasonal lag effects would not largely affect our results either, yet still deserve notice. As a combination of single regression analysis (Equation (5)), the multiple regression analysis (Equation (6)) would be little affected by the time lag since the lag effects of both temperature and precipitation were small. Multiple regression analysis would not help explain the time lag hence would not be discussed further.
Table 3. Percentage of area showing significant lag effects of temperature and precipitation on the average NDVI of growing season, spring, summer and autumn (%).
Climatic DriverGrowing SeasonSpringSummerAutumn
Temperature4.135.120.521.81
Precipitation3.991.0512.2914.78
The lag effects of climatic drivers on NDVI were generally small in our case. Nevertheless, it is not consistent with the results in previous studies due to different spatial-temporal scales and the methods used to evaluate the lag effects. Piao et al. [36] investigated the lag effects on monthly NDVI at the national scale in China by comparing the maximum trends of monthly NDVI and temperature within one year, and pointed out that there was a 3-month lag in the response of monthly NDVI to temperature. Piao et al. [58] looked into the lag effects on the seasonal NDVI of the whole grassland in northern China by correlating the seasonal NDVI with the previous seasonal climatic factors, suggesting that the summer precipitation had lag effects on the autumn NDVI, but they did not discuss the lag effects on growing season NDVI. Xu et al. [19] calculated the distributed lag time for monthly NDVI in China, based on the number of months after which the NDVI would “show the highest significant correlation coefficient with previous temperature or precipitation”, finding out that around 80% areas showed zero and one-month lag and only part of the southern China showed longer lags yet less than 6 months. In our case, instead of discussing at a monthly scale, we assembled NDVI and climatic drivers into growing season, with lengths of 6 to 12 months, and the spring, summer and autumn with lengths of 3 months. The longer lengths of these time periods could attenuate the effects of time lag, compared to the lag effects at a monthly scale. Specifically, except for the climatic factors 1 to 2 months ahead of the growing season that were not considered, the lag effects of climatic factors within the growing season would not be expressed at the time scale of the whole growing season. For example, the temperature in July has been included in the growing season temperature, which may affect the NDVI in August or September, which is also included in the growing season, but would not be expressed to affect the average NDVI of the whole growing season. Hence the time lag effects may not be as significant as those in the previous studies. These different conclusions in the previous and current studies drawn with different methods reveal the complexity and uncertainty in the study of time lag itself. In this case, the effects of time lag would not be considered in the results of our regression analysis, though still deserve further investigation.

3.3.4. Abrupt Change in NDVI and Its Relationship to Climatic Drivers

As discussed in Section 3.2.1, the increasing trend of national mean NDVI has decreased since 1994. To further investigate how NDVI trends have changed in different regions and understand the reasons behind this, we detected the most likely abrupt change points in NDVI and climate divers. By comparing the abrupt change points in each time series, it can be inferred that the abrupt change of NDVI could be a result of climatic jumps if the change points were close to each other. Figure 10 shows the abrupt change points of the growing season NDVI, air temperature and precipitation, as well as the difference of trends (DT) before and after the change points. The trends of the growing season NDVI changes in 1992–1994 in southern forests and changes in around 2000 in grassland of northeast Inner Mongolia, Loess Plateau and west Tibetan (Figure 10a). In 14.61% of research areas (Table 4), mainly located in forested southern and central China and Loess Plateau, NDVI has increased faster since the change points (Figure 10b).
Accelerated NDVI trends in southern China can be attributed to higher temperature trends. Though the abrupt change points for NDVI and temperature in southern China were not exactly overlapping, they were close to each other and both accelerated in 1992–1997, which still helps explain the increasing trend of NDVI in southern China. 16.64% of areas have undergone slowed down NDVI trends, especially in northern grassland, which could be partly contributed by the slowed down trends of temperature in these areas since mid 1990s (Figure 10c,d). The study by Bao et al. [20] also indicated the decreasing trends of NDVI in the Mongolian Plateau since mid or late 1990s. In some arid and semi-arid areas such as southern Tibetan and northern Xinjiang, speeded up temperature increment could limit the water availability for vegetation hence led to stalled NDVI trends [55]. In northeast Inner Mongolia, both NDVI and precipitation (Figure 10e,f) changed in late 1990s. It can be inferred that the abruptly decreased precipitation has led to the stalled or reversed NDVI trends in this area.
Seasonally, spring NDVI showed more abrupt change points compare to the other two seasons (see supplementary material, Figures S1a, S2a and S3a), indicating that the changes of NDVI behaviors mainly happened in spring. Both NDVI and temperature changed in mid 1990s in most areas (Figure S1a,c), despite little change in precipitation occurred (Figure S1e). Spring NDVI in forested southern and central China (24.65% of the research areas) have speeded up together with temperature while slowed down in parts of southwest and southeast China and Qinghai province (15.42% of the areas) as the increasing trend of temperature decreased (Figure S1b,d). The summer NDVI changed in the late 1990s (Figure S2a), mainly corresponding to precipitation (Figure S2e). Summer precipitation dropped in northeast Inner Mongolia, northern Xinjiang and south Tibetan (Figure S2f), where summer NDVI trends slowed down as well (11.49% of the areas) (FigureS2b). The higher temperature and dropped precipitation could lead to the abrupt decrease of summer NDVI in these areas. In autumn, temperature increased faster in southern and central China since mid-1990s (Figure S3c,d) and promoted vegetation growth (Figure S3b). While higher temperature and dropped precipitation (Figure S3e,f) could have limited the vegetation growth in northeast Inner Mongolia.
Figure 10. Spatial distribution of abrupt change points in the growing season mean (a) NDVI; The difference of trends (DT) before and after abrupt change points in the growing season mean (b) NDVI; (c) air temperature; (d) air temperature; (e) precipitation and (f) precipitation. DT was calculated by trends after abrupt change points minus trends before abrupt change points.
Remotesensing 07 10243 g010
Table 4. Proportion of areas with slowed down or speeded up NDVI trends since abrupt change points (%).
Change DirectionGrowing SeasonSpringSummerAutumn
Slowed down16.6415.4211.498.05
Speeded up14.6124.655.9614.52
It should be noted that the sequence of abrupt change points in series does not necessarily reflect the causal and effect relationship, i.e., series with earlier change point does not have to be the causal factor. Similar change points in NDVI and climatic drivers provide potential explanations for the accelerated or slowed down NDVI trends. The abrupt change points in NDVI and climatic drivers did not fully match with each other, either due to the fluctuation in the data or the change of NDVI trends cannot be fully attributed to the change in climatic drivers. For example, the accelerated growing season NDVI trends in Loess Plateau cannot be explained by jumps in either temperature or precipitation. The changes of NDVI trends in Loess Plateau could mainly be a result of non-climatic factors, which will be discussed further in Section 3.3.5. Nevertheless, the comparison between the abrupt change of climatic drivers and NDVI provides explanations for the nonlinear NDVI behaviors in most regions.

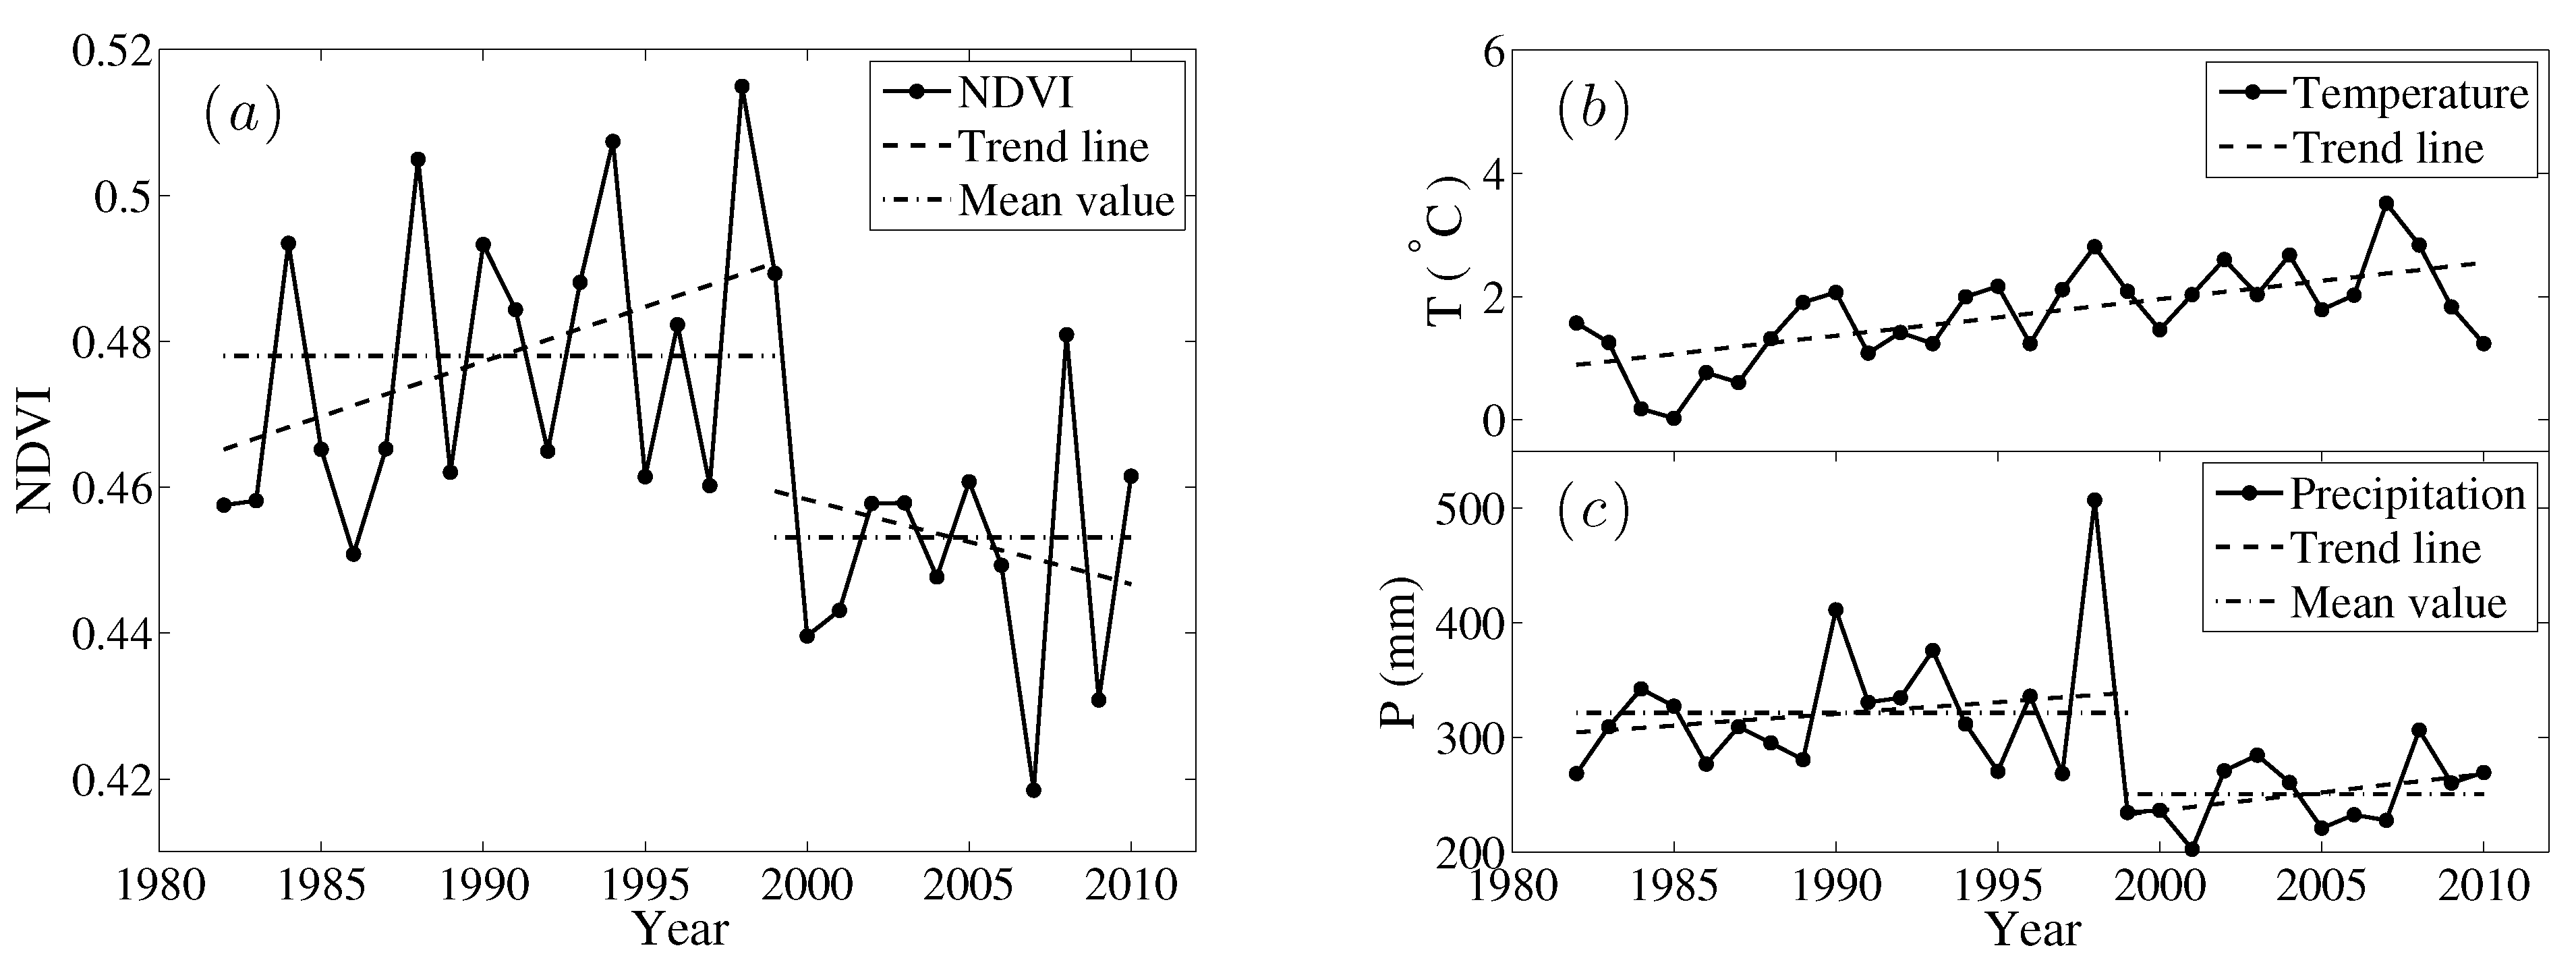
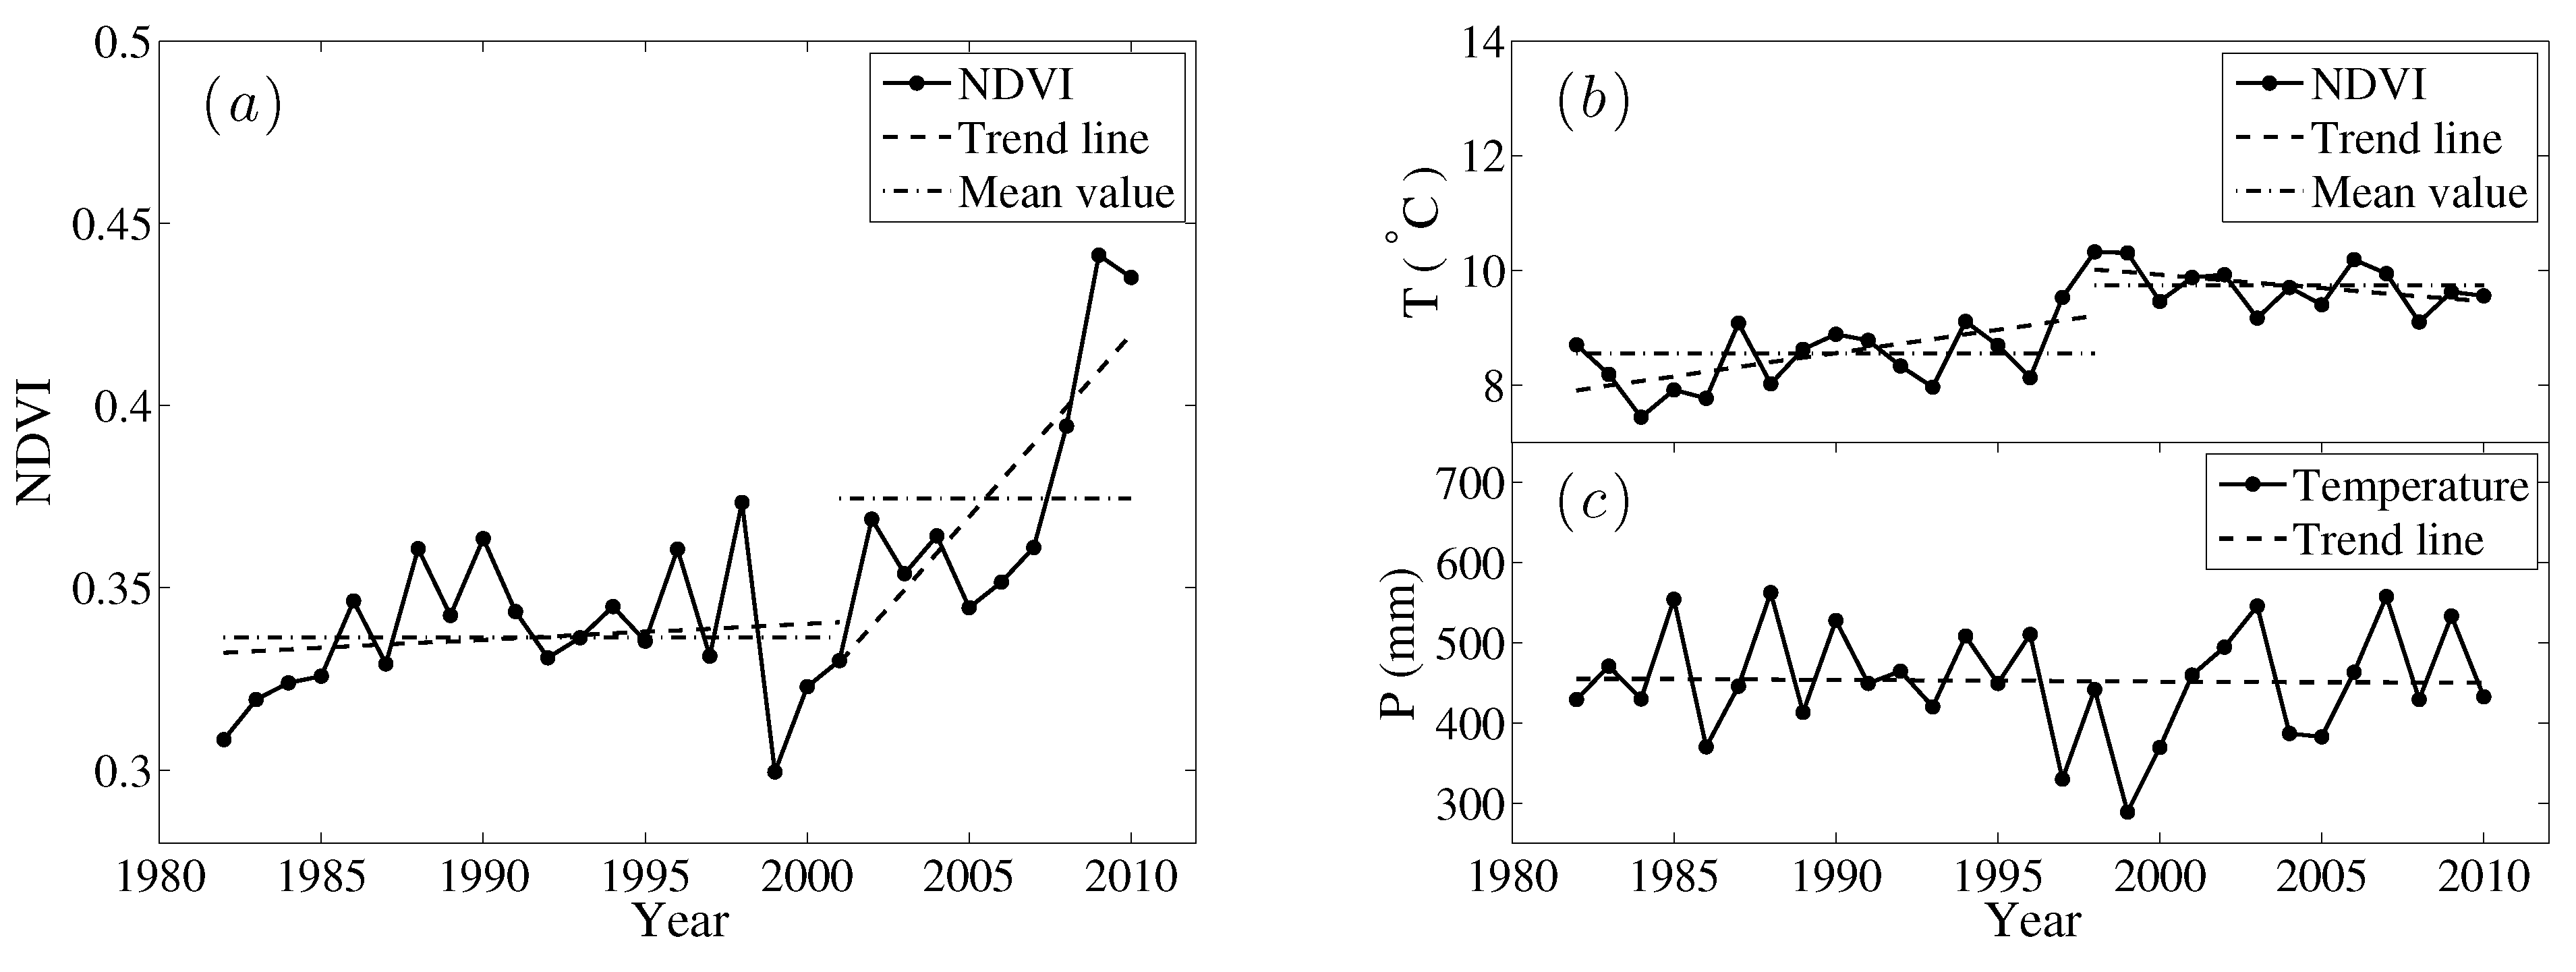
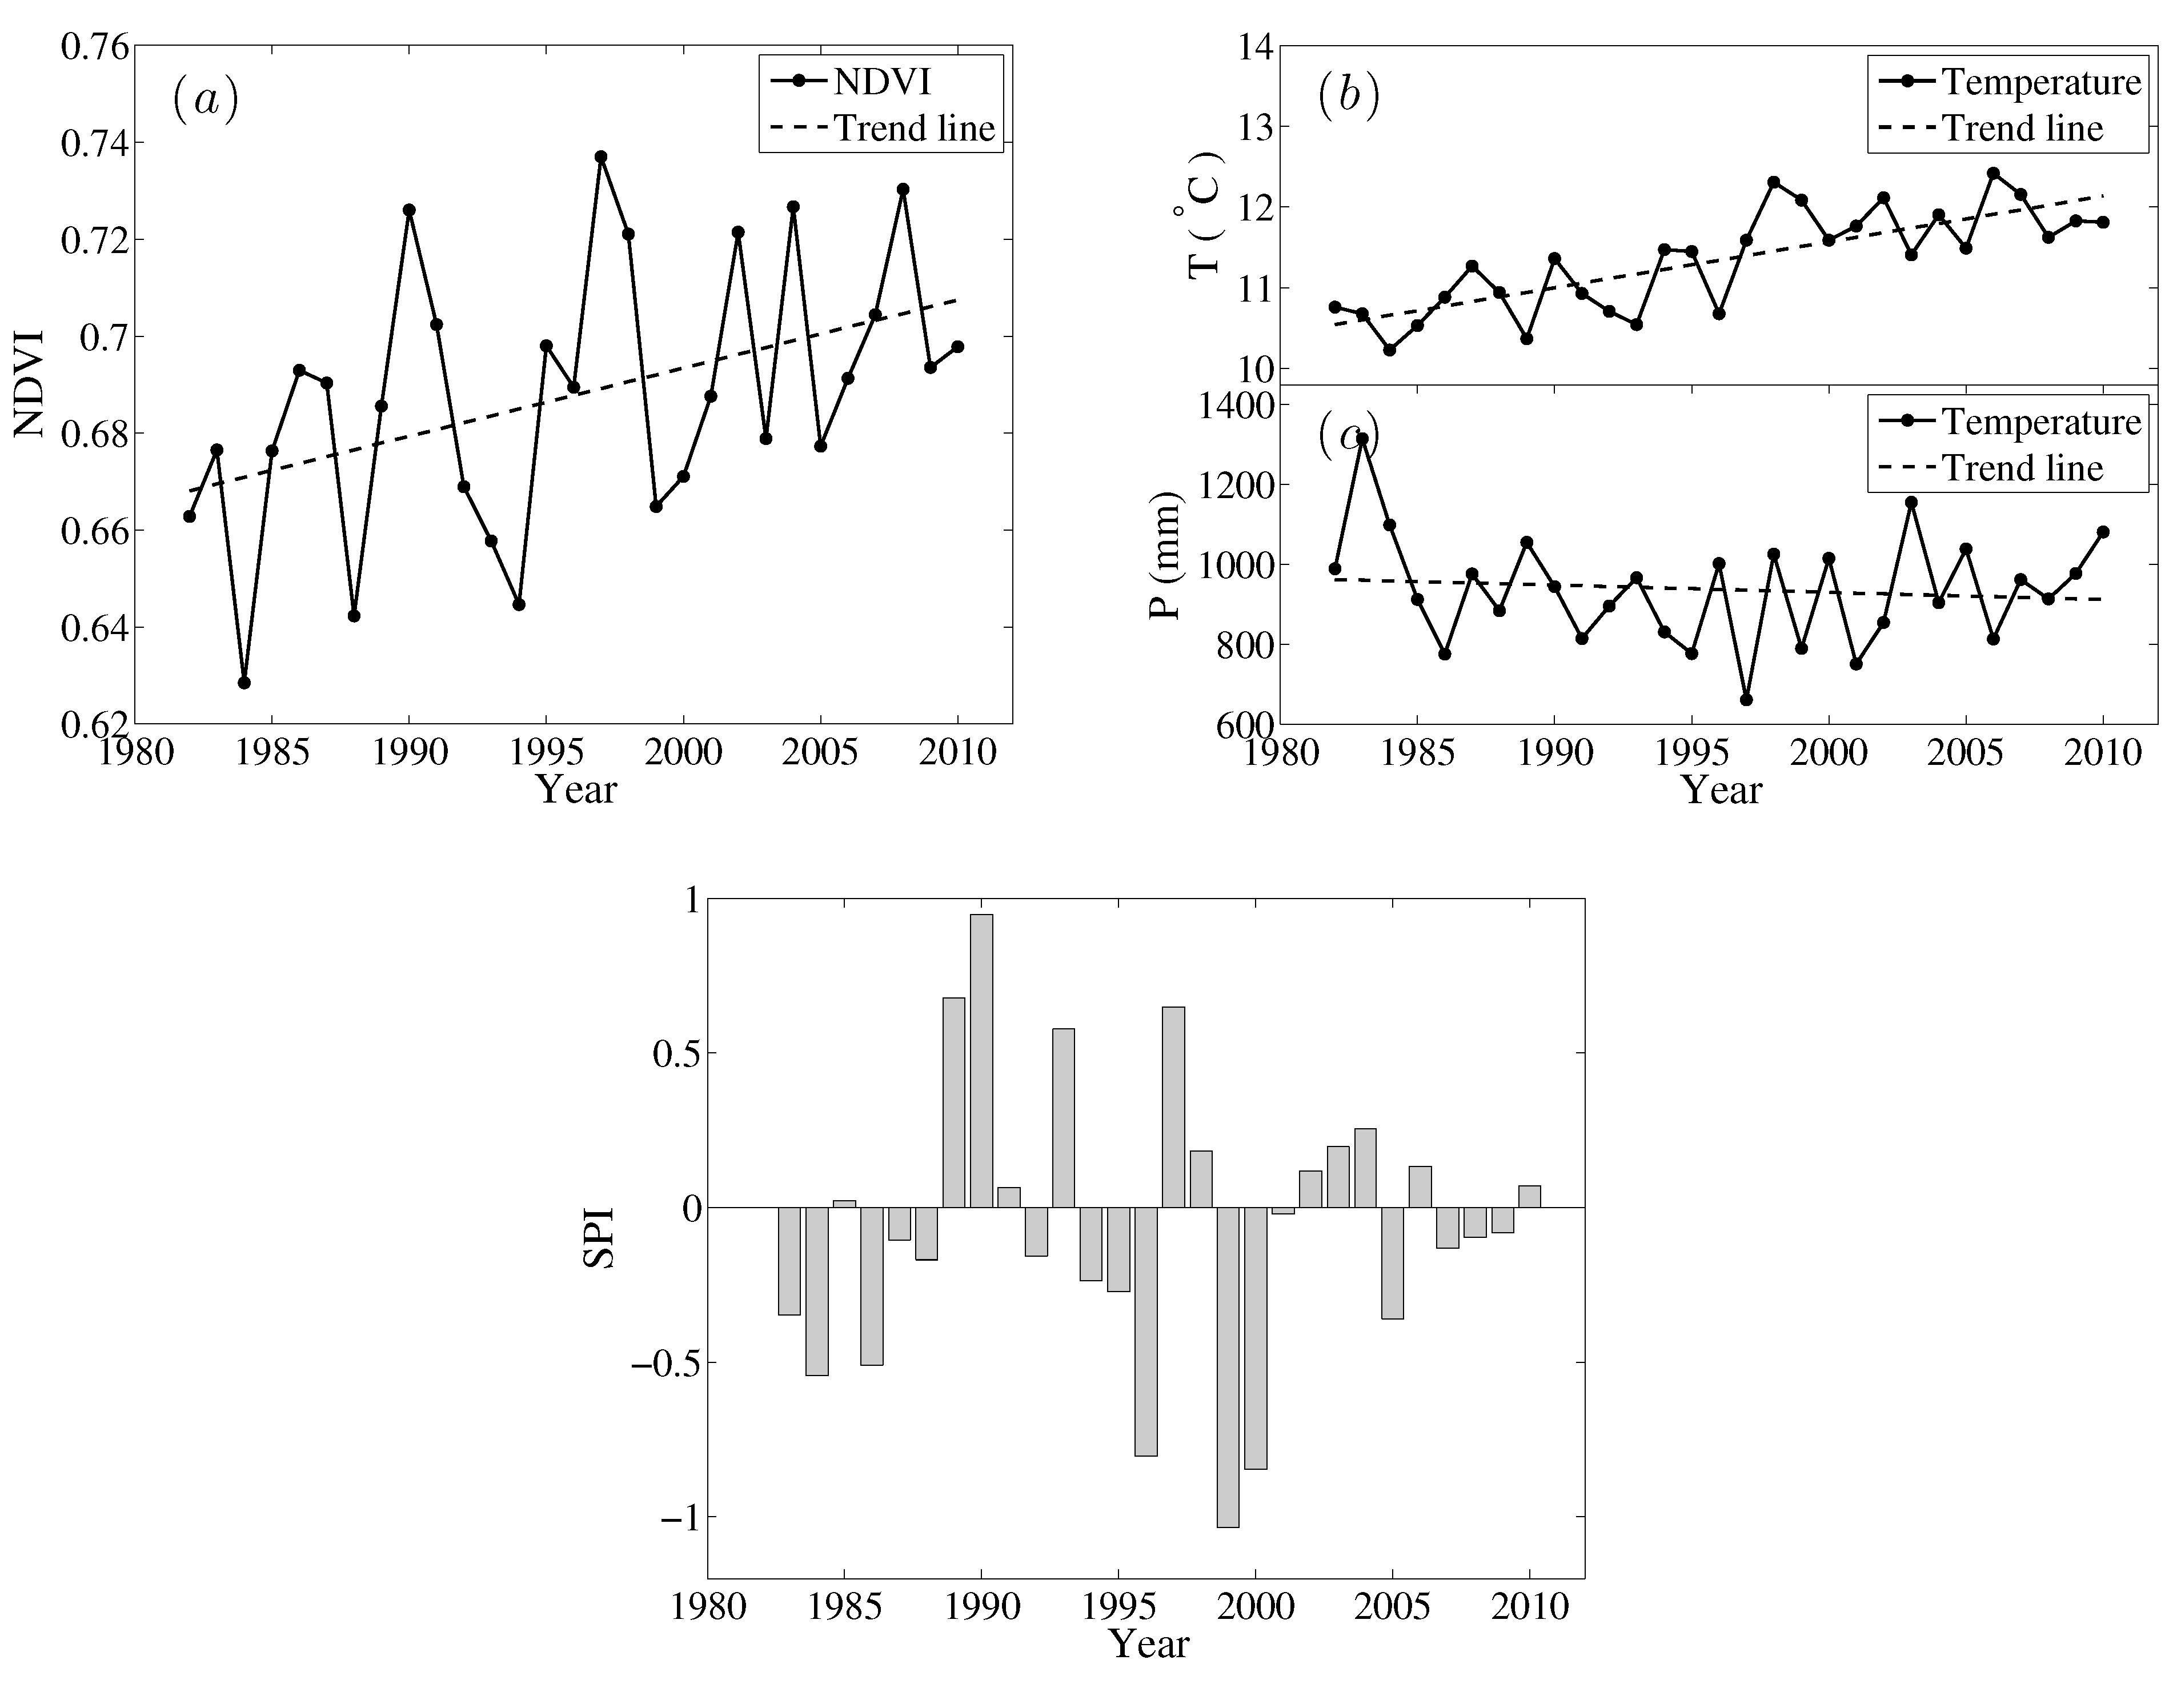
3.3.5. Temporal Variation in NDVI in Typical Regions

According to the spatial distribution of the growing season NDVI trends (Figure 6a), NDVI in some regions sharply increased or decreased, such as those in northeast Inner Mongolia, Loess Plateau and central China. Since trends cannot completely reflect the variation process of NDVI time series, we took these areas as typical regions (Figure 6a) to analyze the relationships between the variation process of NDVI and climatic drivers as well as the influence of other external factors that can help explain the reason behind long term NDVI trends.
(1) Northeast Inner Mongolia
Northeast Inner Mongolia ( 42 . 5 N 52 . 5 N, 112 . 5 E 122 . 5 E), is located in a semi-arid temperate climate zone and mainly covered by grass. The mean growing season NDVI in this area decreased significantly at rate of 0 . 98 × 10 3 / year on average from 1982 to 2011(Figure 11a). However, previous study showed that NDVI in this area slightly increased from 1982 to 1999 [36]. According to the Pettitt test, 1999 is an abrupt change point. The trend reversed from 1 . 51 × 10 3 / year to 1 . 16 × 10 3 / year and NDVI mean values decreased from 0.478 to 0.453 before and after 1999. As for climatic drivers, the temperature time series was stable (Figure 11b) while the precipitation series also significantly changed at 1999 (Figure 11c), before and after which the mean value dropped from 321.5 mm to 250.4 mm. The research by Yuan et al. [60] also revealed that the mean values of precipitation from 1999 to 2011 in northeastern China sharply decreased compared to that from 1982 to 1998. Seasonally, according to the detected abrupt change points (Figures S1f, S2f and S3f), it was mainly in summer and autumn when precipitation dropped. Though it is difficult to separate the effects of precipitation and grazing [26], the correlation and corresponding abrupt change points in NDVI and precipitation partly provide explanations for the decreasing NDVI in this area. Less precipitation limited the growth of grass or even partly destroyed the grassland ecosystem with low ecological resilience, and meanwhile rising temperature could have aggravated water limitation. This suggests that the decrease of growing season NDVI in northeast Inner Mongolia occurred after 1999, as a result of decreased precipitation, consistent with the result in Section 3.2.2 that the vegetation growth in this area was dominated by precipitation (Figure 9a).
Figure 11. (a) Mean NDVI; (b) mean temperature and (c) accumulate precipitation in the growing season in northeast Inner Mongolia from 1982 to 2010.
Remotesensing 07 10243 g011
Figure 12. (a) Mean NDVI; (b) mean temperature and (c) accumulate precipitation in the growing season in Loess Plateau from 1982 to 2010.
Remotesensing 07 10243 g012
(2) Loess Plateau
Loess Plateau ( 35 N 42 . 5 N, 107 . 5 E 115 E), where the majority vegetation types are grasses and shrubs, belongs to semi-arid warm temperate zone. Growing season NDVI in this area increased at an extremely high rate of 2 . 35 × 10 3 / year on average over the past 30 years. The NDVI series significantly changed at 2001 (Figure 12a), before and after which the increasing trends were 1 . 59 × 10 3 / year and 7 . 78 × 10 3 / year respectively. In spite of the stable precipitation series, the growing season temperature in Loess Plateau also abruptly changed in 1998, with the mean value increasing by 1.3 C at 1998, which promoted vegetation growth (Figure 12c,b). However, the increasing trend of NDVI in Loess Plateau after 2001 was much higher than any other regions in China that it can hardly be only explained by temperature rise. The study by Gao et al. [61] showed that from 1999 to 2010, the total afforestation area was 5165 × 103 hm 2 in Shanxi province, mainly located in Loess Plateau, ranked the second in all provinces of China, which can partly explain the extremely high increasing rate of NDVI in this area. Therefore in Loess Plateau, NDVI increased rapidly after 2001 due to temperature rise and afforestation.
Figure 13. (a) Mean NDVI; (b) mean temperature; (c) accumulate precipitation in the growing season and (d) mean SPI in winter and spring in Central China from 1982 to 2010.
Remotesensing 07 10243 g013
(3) Central China
Central China ( 27 . 5 N 35 N, 105 E 115 E), mainly covered with deciduous broadleaf forest, belongs to the humid or semi-humid zone. The vegetation growth was dominated by temperature in this area (Figure 9a). As Figure 13 shows, in response to increasing temperature, the growing season NDVI in this area strongly increased by 1 . 41 × 10 3 / year on average. Although both NDVI and climatic drivers varied stably without an abrupt change point, the interannual fluctuation of the NDVI series was quite large. Peng et al. [32] and Mohammat et al. [62] suggested that extreme climate such as drought and floods could have great impact on vegetation growth. The influence of extreme climate can be universal while here we only take drought in central China as an example. We analyzed the relationship between NDVI and drought in central China using the 3-month Standard Precipitation Index (SPI) [63], a good indicator of drought in terms of soil water available for vegetation [64]. Negative lower SPI values mean more severe drought. NDVI series corresponded well with winter-spring mean SPI (mean SPI values from December of last year to May) (Figure 13d). For example, in 1984, 1999, 2000 and 2005 when NDVI fluctuated to minima (Figure 13a), the corresponding SPI values were low as well (Figure 13d), suggesting that drought before or during the early growing season could play important role in impeding vegetation growth in this area, which is consistent with previous study by Mohammat et al. [62] suggesting that spring drought has significant influence on vegetation growth in Inner Asia. Hence the growing season NDVI in central China was promoted by rising temperature, meanwhile the interannual fluctuation was influenced by drought.

4. Conclusions

We analyzed the spatial and temporal NDVI variation and the influence of climatic drivers from 1982 to 2011 in China via methods of regression and statistical tests. The key conclusions are as follows:
(1) At a national scale, the growing season NDVI significantly increased by 0.0007 year 1 on average from 1982 to 2011, though the trend abruptly changed at 1994, slowing down from 0.0008 year 1 to 0.0003 year 1 , which was mainly contributed by the stalled spring NDVI trend. NDVI trends showed great seasonal and regional heterogeneity. It increased rapidly in spring and autumn while no significant trend was observed in summer. In 76.5% of the research area, the growing season NDVI increased while in grassland of northeast Inner Mongolia, decreased trends were observed, mainly caused by decreased precipitation.
(2) The growing season NDVI was significantly and positively correlated to temperature and precipitation, while temperature contributed more to NDVI than precipitation at a national scale. Regionally, the growing season NDVI was dominated by rising temperature in most forested area in southern China and dominated by precipitation in most grassland in northern China, where water supply is limited. For example, NDVI in northern Xinjiang increased with more precipitation while that in northeast Inner Mongolia decreased due to less precipitation. During spring and autumn, NDVI was dominated by temperature in most research areas, and slightly dominated by precipitation in parts of grassland in northern China during summer. Hence rising temperature in spring and autumn prompted NDVI in southern China while falling precipitation in summer limited the vegetation growth in parts of northern China such as northeast Inner Mongolia.
(3) 16.64% of the research areas, mainly grassland covered northern China, have undergone slowed down NDVI trends corresponding with slowed down temperature increment since mid 1990s and dropped precipitation since around 2000. While in 14.61% of the research area, mainly forests in southern and central China, growing season NDVI has speeded up together with temperature since mid 1990s. Seasonally, spring and autumn NDVI in southern China has accelerated together with temperature since mid 1990s while summer NDVI in parts of northern China has slowed down due to dropped precipitation since around 2000.
(4) The reasons leading to similar long term NDVI trends can be various and regional specific. NDVI in northeast Inner Mongolia decreased sharply since around 2000 due to falling precipitation. NDVI in Loess Plateau increased at extremely high rates, which has benefited from accelerated temperature and afforestation. In addition, NDVI in Central China also increased quickly with temperature while fluctuated widely under the effects of drought.
The results of this study illustrate an overall increasing trend of vegetation growth and the spatial pattern of dominant climatic drivers, which would help to better estimate and predict evapotranspiration and carbon processes. However, the interannual variation of vegetation growth cannot be fully explained by changes in climatic drivers, and further studies on the relationships and feedbacks between vegetation growth and carbon and nitrogen cycles are needed. Furthermore, the different spatial patterns highlight the necessity for more in-situ observations. Abrupt change points of vegetation growth indicate the non-linear response of vegetation growth to climate change, which increased the complexity and highlights the importance of further study on the mechanism of ecosystem processes corresponding to climate change.

Supplementary Files

Supplementary File 1

Acknowledgments

This research was supported by the National Natural Science Foundation of China (Project Nos. 51139002 and 51209117), the Basic Research Fund Program of State Key Laboratory of Hydroscience and Engineering (Grant No. 2014-KY-04), and the Tsinghua University Initiative Scientific Research Program (Project No. 20131089284).

Author Contributions

Huimin Lei designed the study. Yanlan Liu analyzed the data. Yanlan Liu and Huimin Lei interpreted the results and wrote the paper.

Conflicts of Interest

The authors declare no conflict of interest.

References

  1. De Jong, R.; de Bruin, S.; de Wit, A.; Schaepman, M.E.; Dent, D.L. Analysis of monotonic greening and browning trends from global NDVI time-series. Remote Sens. Environ. 2011, 115, 692–702. [Google Scholar] [CrossRef] [Green Version]
  2. Wang, X.; Piao, S.; Ciais, P.; Li, J.; Friedlingstein, P.; Koven, C.; Chen, A. Spring temperature change and its implication in the change of vegetation growth in North America from 1982 to 2006. Proc. Natl. Acad. Sci. USA 2011, 108, 1240–1245. [Google Scholar] [CrossRef] [PubMed]
  3. Qiu, G.; Feng, Y. Estimation of soil evaporation and plant transpiration of sparse steppes by using ground-based infrared thermal images. AGU Fall Meet. Abstr. 2011, 1, 4. [Google Scholar]
  4. Schlesinger, W.H.; Jasechko, S. Transpiration in the global water cycle. Agric. For. Meteorol. 2014, 189, 115–117. [Google Scholar] [CrossRef]
  5. Nouri, H.; Beecham, S.; Anderson, S.; Nagler, P. High spatial resolution WorldView-2 imagery for mapping NDVI and its relationship to temporal urban landscape evapotranspiration factors. Remote Sens. 2014, 6, 580–602. [Google Scholar] [CrossRef]
  6. Eckhardt, K.; Breuer, L.; Frede, H.G. Parameter uncertainty and the significance of simulated land use change effects. J. Hydrol. 2003, 273, 164–176. [Google Scholar] [CrossRef]
  7. Manusch, C.; Bugmann, H.; Wolf, A. Sensitivity of simulated productivity to soil characteristics and plant water uptake along drought gradients in the Swiss Alps. Ecol. Model. 2014, 282, 25–34. [Google Scholar] [CrossRef]
  8. Schimel, D.; Melillo, J.; Tian, H.; McGuire, A.D.; Kicklighter, D.; Kittel, T.; Rosenbloom, N.; Running, S.; Thornton, P.; Ojima, D.; et al. Contribution of increasing CO2 and climate to carbon storage by ecosystems in the United States. Science 2000, 287, 2004–2006. [Google Scholar] [CrossRef] [PubMed]
  9. Kucharik, C.J.; Foley, J.A.; Delire, C.; Fisher, V.A.; Coe, M.T.; Lenters, J.D.; Young-Molling, C.; Ramankutty, N.; Norman, J.M.; Gower, S.T. Testing the performance of a dynamic global ecosystem model: Water balance, carbon balance, and vegetation structure. Glob. Biogeochem. Cycles 2000, 14, 795–825. [Google Scholar] [CrossRef]
  10. Jackson, R.B.; Randerson, J.T.; Canadell, J.G.; Anderson, R.G.; Avissar, R.; Baldocchi, D.D.; Bonan, G.B.; Caldeira, K.; Diffenbaugh, N.S.; Field, C.B.; et al. Protecting climate with forests. Environ. Res. Lett. 2008, 3, 044006. [Google Scholar] [CrossRef]
  11. Yin, Z.; Dekker, S.; van den Hurk, B.; Dijkstra, H. Effects of vegetation structure on biomass accumulation in a Balanced Optimality Structure Vegetation Model (BOSVM v1. 0). Geosci. Model Dev. 2014, 7, 821–845. [Google Scholar] [CrossRef]
  12. Parry, M.L. Climate Change 2007: Impacts, Adaptation and Vulnerability: Contribution of Working Group II to the Fourth Assessment Report of the Intergovernmental Panel on Climate Change; Cambridge University Press: Cambridge, UK, 2007; Volume 4. [Google Scholar]
  13. White, M.A.; Beurs, D.; Kirsten, M.; Didan, K.; Inouye, D.W.; Richardson, A.D.; Jensen, O.P.; OâĂŹKeefe, J.; Zhang, G.; Nemani, R.R.; et al. Intercomparison, interpretation, and assessment of spring phenology in North America estimated from remote sensing for 1982–2006. Global Chang. Biol. 2009, 15, 2335–2359. [Google Scholar] [CrossRef]
  14. Myneni, R.B.; Keeling, C.; Tucker, C.; Asrar, G.; Nemani, R. Increased plant growth in the northern high latitudes from 1981 to 1991. Nature 1997, 386, 698–702. [Google Scholar] [CrossRef]
  15. Bradley, N.L.; Leopold, A.C.; Ross, J.; Huffaker, W. Phenological changes reflect climate change in Wisconsin. Proc. Natl. Acad. Sci. USA 1999, 96, 9701–9704. [Google Scholar] [CrossRef] [PubMed]
  16. Tucker, C.J.; Slayback, D.A.; Pinzon, J.E.; Los, S.O.; Myneni, R.B.; Taylor, M.G. Higher northern latitude normalized difference vegetation index and growing season trends from 1982 to 1999. Int. J. Biometeorol. 2001, 45, 184–190. [Google Scholar] [CrossRef] [PubMed]
  17. Zhou, L.; Kaufmann, R.; Tian, Y.; Myneni, R.; Tucker, C. Relation between interannual variations in satellite measures of northern forest greenness and climate between 1982 and 1999. J. Geophys. Res. Atmos. (1984–2012) 2003, 108, ACL3:1–ACL3:16. [Google Scholar] [CrossRef]
  18. Pettorelli, N.; Vik, J.O.; Mysterud, A.; Gaillard, J.M.; Tucker, C.J.; Stenseth, N.C. Using the satellite-derived NDVI to assess ecological responses to environmental change. Trends Ecol. Evol. 2005, 20, 503–510. [Google Scholar] [CrossRef] [PubMed]
  19. Xu, G.; Zhang, H.; Chen, B.; Zhang, H.; Innes, J.L.; Wang, G.; Yan, J.; Zheng, Y.; Zhu, Z.; Myneni, R.B. Changes in Vegetation Growth Dynamics and Relations with Climate over China Landmass from 1982 to 2011. Remote Sens. 2014, 6, 3263–3283. [Google Scholar] [CrossRef]
  20. Bao, G.; Qin, Z.; Bao, Y.; Zhou, Y.; Li, W.; Sanjjav, A. NDVI-Based Long-Term Vegetation Dynamics and Its Response to Climatic Change in the Mongolian Plateau. Remote Sens. 2014, 6, 8337–8358. [Google Scholar] [CrossRef]
  21. Steltzer, H.; Welker, J.M. Modeling the effect of photosynthetic vegetation properties on the NDVI-LAI relationship. Ecology 2006, 87, 2765–2772. [Google Scholar] [CrossRef]
  22. Phillips, L.B.; Hansen, A.J.; Flather, C.H. Evaluating the species energy relationship with the newest measures of ecosystem energy: NDVI versus MODIS primary production. Remote Sens. Environ. 2008, 112, 4381–4392. [Google Scholar] [CrossRef]
  23. Myneni, R.; Tucker, C.; Asrar, G.; Keeling, C. Interannual variations in satellite-sensed vegetation index data from 1981 to 1991. J. Geophys. Res. Atmos. (1984–2012) 1998, 103, 6145–6160. [Google Scholar] [CrossRef]
  24. Tucker, C.J.; Pinzon, J.E.; Brown, M.E.; Slayback, D.A.; Pak, E.W.; Mahoney, R.; Vermote, E.F.; El Saleous, N. An extended AVHRR 8-km NDVI dataset compatible with MODIS and SPOT vegetation NDVI data. Int. J. Remote Sens. 2005, 26, 4485–4498. [Google Scholar] [CrossRef]
  25. Beck, H.E.; McVicar, T.R.; van Dijk, A.I.; Schellekens, J.; de Jeu, R.A.; Bruijnzeel, L.A. Global evaluation of four AVHRR–NDVI data sets: Intercomparison and assessment against Landsat imagery. Remote Sens. Environ. 2011, 115, 2547–2563. [Google Scholar] [CrossRef]
  26. Li, Z.; Guo, X. Detecting climate effects on vegetation in northern mixed prairie using NOAA AVHRR 1-km time-series NDVI data. Remote Sens. 2012, 4, 120–134. [Google Scholar] [CrossRef]
  27. Eastman, J.R.; Sangermano, F.; Machado, E.A.; Rogan, J.; Anyamba, A. Global trends in seasonality of normalized difference vegetation index (NDVI), 1982–2011. Remote Sens. 2013, 5, 4799–4818. [Google Scholar] [CrossRef]
  28. Piao, S.; Cui, M.; Chen, A.; Wang, X.; Ciais, P.; Liu, J.; Tang, Y. Altitude and temperature dependence of change in the spring vegetation green-up date from 1982 to 2006 in the Qinghai-Xizang Plateau. Agric. For. Meteorol. 2011, 151, 1599–1608. [Google Scholar] [CrossRef]
  29. Park, H.S.; Sohn, B. Recent trends in changes of vegetation over East Asia coupled with temperature and rainfall variations. J. Geophys. Res. Atmos. (1984–2012) 2010, 115. [Google Scholar] [CrossRef]
  30. Piao, S.; Wang, X.; Ciais, P.; Zhu, B.; Wang, T.; Liu, J. Changes in satellite-derived vegetation growth trend in temperate and boreal Eurasia from 1982 to 2006. Global Chang. Biol. 2011, 17, 3228–3239. [Google Scholar] [CrossRef]
  31. Lotsch, A.; Friedl, M.A.; Anderson, B.T.; Tucker, C.J. Response of terrestrial ecosystems to recent Northern Hemispheric drought. Geophys. Res. Lett. 2005, 32. [Google Scholar] [CrossRef]
  32. Peng, S.; Chen, A.; Xu, L.; Cao, C.; Fang, J.; Myneni, R.B.; Pinzon, J.E.; Tucker, C.J.; Piao, S. Recent change of vegetation growth trend in China. Environ. Res. Lett. 2011, 6, 044027. [Google Scholar] [CrossRef]
  33. Zhou, L.; Tucker, C.J.; Kaufmann, R.K.; Slayback, D.; Shabanov, N.V.; Myneni, R.B. Variations in northern vegetation activity inferred from satellite data of vegetation index during 1981 to 1999. J. Geophys. Res. Atmos. (1984–2012) 2001, 106, 20069–20083. [Google Scholar] [CrossRef]
  34. Zhang, X.; Friedl, M.A.; Schaaf, C.B.; Strahler, A.H.; Hodges, J.C.; Gao, F.; Reed, B.C.; Huete, A. Monitoring vegetation phenology using MODIS. Remote Sens. Environ. 2003, 84, 471–475. [Google Scholar] [CrossRef]
  35. Che, M.; Chen, B.; Innes, J.L.; Wang, G.; Dou, X.; Zhou, T.; Zhang, H.; Yan, J.; Xu, G.; Zhao, H. Spatial and temporal variations in the end date of the vegetation growing season throughout the Qinghai–Tibetan Plateau from 1982 to 2011. Agric. For. Meteorol. 2014, 189, 81–90. [Google Scholar] [CrossRef]
  36. Piao, S.; Fang, J.; Zhou, L.; Guo, Q.; Henderson, M.; Ji, W.; Li, Y.; Tao, S. Interannual variations of monthly and seasonal normalized difference vegetation index (NDVI) in China from 1982 to 1999. J. Geophys. Res. Atmos. (1984–2012) 2003, 108. [Google Scholar] [CrossRef]
  37. Bradshaw, R.; Hannon, G. Climatic change, human influence and disturbance regime in the control of vegetation dynamics within Fiby Forest, Sweden. J. Ecol. 1992, 80, 625–632. [Google Scholar] [CrossRef]
  38. Liu, Y.Y.; Evans, J.P.; McCabe, M.F.; de Jeu, R.A.; van Dijk, A.I.; Dolman, A.J.; Saizen, I. Changing climate and overgrazing are decimating Mongolian steppes. PLoS One 2013, 8, e57599. [Google Scholar] [CrossRef] [PubMed]
  39. Slayback, D.A.; Pinzon, J.E.; Los, S.O.; Tucker, C.J. Northern hemisphere photosynthetic trends 1982–99. Global Chang. Biol. 2003, 9, 1–15. [Google Scholar] [CrossRef]
  40. Tao, L.; Xiaogu, Z.; Yongjiu, D.; Chi, Y.; Zhuoqi, C.; Shupeng, Z.; Guocan, W.; Zhonglei, W.; Chengcheng, H.; Yan, S.; et al. Mapping Near-surface Air Temperature, Pressure, Relative Humidity and Wind Speed over Mainland China with High Spatiotemporal Resolution. Adv. Atmos. Sci. 2014, 31, 73. [Google Scholar]
  41. Shen, Y.; Feng, M.N.; Zhang, H.Z.; Gao, F. Interpolation Methods of China Daily Precipitation Data. J. Appl. Meterol. Sci. 2010, 21, 279–286. [Google Scholar]
  42. Jung, M.; Henkel, K.; Herold, M.; Churkina, G. Exploiting synergies of global land cover products for carbon cycle modeling. Remote Sens. Environ. 2006, 101, 534–553. [Google Scholar] [CrossRef]
  43. Bera, A.K.; Singh, V.; Bankar, N.; Salunkhe, S.S.; Sharma, J. Watershed Delineation in Flat Terrain of Thar Desert Region in North West India–A Semi Automated Approach Using DEM. J. Indian Soc. Remote Sens. 2014, 42, 187–199. [Google Scholar] [CrossRef]
  44. Pettitt, A. A non-parametric approach to the change-point problem. Appl. Stat. 1979, 38, 126–135. [Google Scholar] [CrossRef]
  45. Mu, X.; Zhang, L.; McVicar, T.R.; Chille, B.; Gau, P. Analysis of the impact of conservation measures on stream flow regime in catchments of the Loess Plateau, China. Hydrol. Process. 2007, 21, 2124–2134. [Google Scholar] [CrossRef]
  46. Tarhule, A.; Woo, M.K. Changes in rainfall characteristics in northern Nigeria. Int. J. Climatol. 1998, 18, 1261–1271. [Google Scholar] [CrossRef]
  47. Samdi, M.M.; Zghoul, A. A sudden change in rainfall characteristics in Amman, Jordan during the mid 1950s. Am. J. Environ. Sci. 2006, 2, 84. [Google Scholar] [CrossRef]
  48. Lin, X.; Zhang, Y.; Yao, Z.; Gong, T.; Wang, H.; Chu, D.; Liu, L.; Zhang, F. The trend on runoff variations in the Lhasa River Basin. J. Geogr. Sci. 2008, 18, 95–106. [Google Scholar] [CrossRef]
  49. Beaulieu, C.; Chen, J.; Sarmiento, J.L. Change-point analysis as a tool to detect abrupt climate variations. Philos. Trans. R. Soc. A: Math. Phys. Eng. Sci. 2012, 370, 1228–1249. [Google Scholar] [CrossRef] [PubMed]
  50. Wijngaard, J.; Klein Tank, A.; Können, G. Homogeneity of 20th century European daily temperature and precipitation series. Int. J. Climatol. 2003, 23, 679–692. [Google Scholar] [CrossRef]
  51. De Wit, A.; Su, B. Deriving phenological indicators from SPOT-VGT data using the HANTS algorithm. In Proceedings of the 2nd International SPOT-VEGETATION User Conference, Antwerp, Belgium, 24–26 March 2004; pp. 195–201.
  52. Roerink, G.; Menenti, M.; Verhoef, W. Reconstructing cloudfree NDVI composites using Fourier analysis of time series. Int. J. Remote Sens. 2000, 21, 1911–1917. [Google Scholar] [CrossRef]
  53. Zheng, J.; Yin, Y.; Li, B. A new scheme for climate regionalization in China. Acta Geogr. Sin. 2010, 65, 3–12. [Google Scholar]
  54. McGill, R.; Tukey, J.W.; Larsen, W.A. Variations of box plots. Am. Stat. 1978, 32, 12–16. [Google Scholar]
  55. Song, Y.; Ma, M. A statistical analysis of the relationship between climatic factors and the Normalized Difference Vegetation Index in China. Int. J. Remote Sens. 2011, 32, 3947–3965. [Google Scholar] [CrossRef]
  56. Mao, D.; Wang, Z.; Luo, L.; Ren, C. Integrating AVHRR and MODIS data to monitor NDVI changes and their relationships with climatic parameters in Northeast China. Int. J. Appl. Earth Obs. Geoinf. 2012, 18, 528–536. [Google Scholar] [CrossRef]
  57. Piao, S.; Yin, G.; Tan, J.; Cheng, L.; Huang, M.; Li, Y.; Liu, R.; Mao, J.; Myneni, R.B.; Peng, S.; et al. Detection and attribution of vegetation greening trend in China over the last 30 years. Global Chang. Biol. 2014. [Google Scholar] [CrossRef] [PubMed]
  58. Piao, S.; Mohammat, A.; Fang, J.; Cai, Q.; Feng, J. NDVI-based increase in growth of temperate grasslands and its responses to climate changes in China. Glob. Environ. Chang. 2006, 16, 340–348. [Google Scholar] [CrossRef]
  59. Xu, X.; Yang, D.; Sivapalan, M. Assessing the impact of climate variability on catchment water balance and vegetation cover. Hydrol. Earth Syst. Sci. 2012, 16, 43–58. [Google Scholar] [CrossRef]
  60. Yuan, W.; Liu, D.; Dong, W.; Liu, S.; Zhou, G.; Yu, G.; Zhao, T.; Feng, J.; Ma, Z.; Chen, J.; et al. Multiyear precipitation reduction strongly decreases carbon uptake over northern China. J. Geophys. Res. Biogeosci. 2014. [Google Scholar] [CrossRef]
  61. Gao, Y.; Zhu, X.; Yu, G.; He, N.; Wang, Q.; Tian, J. Water use efficiency threshold for terrestrial ecosystem carbon sequestration in China under afforestation. Agric. For. Meteorol. 2014, 195, 32–37. [Google Scholar] [CrossRef]
  62. Mohammat, A.; Wang, X.; Xu, X.; Peng, L.; Yang, Y.; Zhang, X.; Myneni, R.B.; Piao, S. Drought and spring cooling induced recent decrease in vegetation growth in Inner Asia. Agric. For. Meteorol. 2013, 178, 21–30. [Google Scholar] [CrossRef]
  63. McKee, T.B.; Doesken, N.J.; Kleist, J. The relationship of drought frequency and duration to time scales. In Proceedings of the 8th Conference on Applied Climatology, Anaheim, CA, USA, 17–22 January 1993; American Meteorological Society: Boston, MA, USA, 1993; Volume 17, pp. 179–183. [Google Scholar]
  64. WMO. Standard Precipitation Index User Guide; World Meteorological Organization Publication: Geneva, Switzerland, 2012. [Google Scholar]

