
Mapping Tree Canopy Cover and Aboveground Biomass in Sudano-Sahelian Woodlands Using Landsat 8 and Random Forest

 ,
,
Abstract
:
1. Introduction
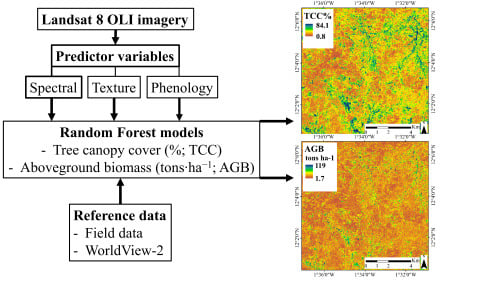
2. Materials and Methods
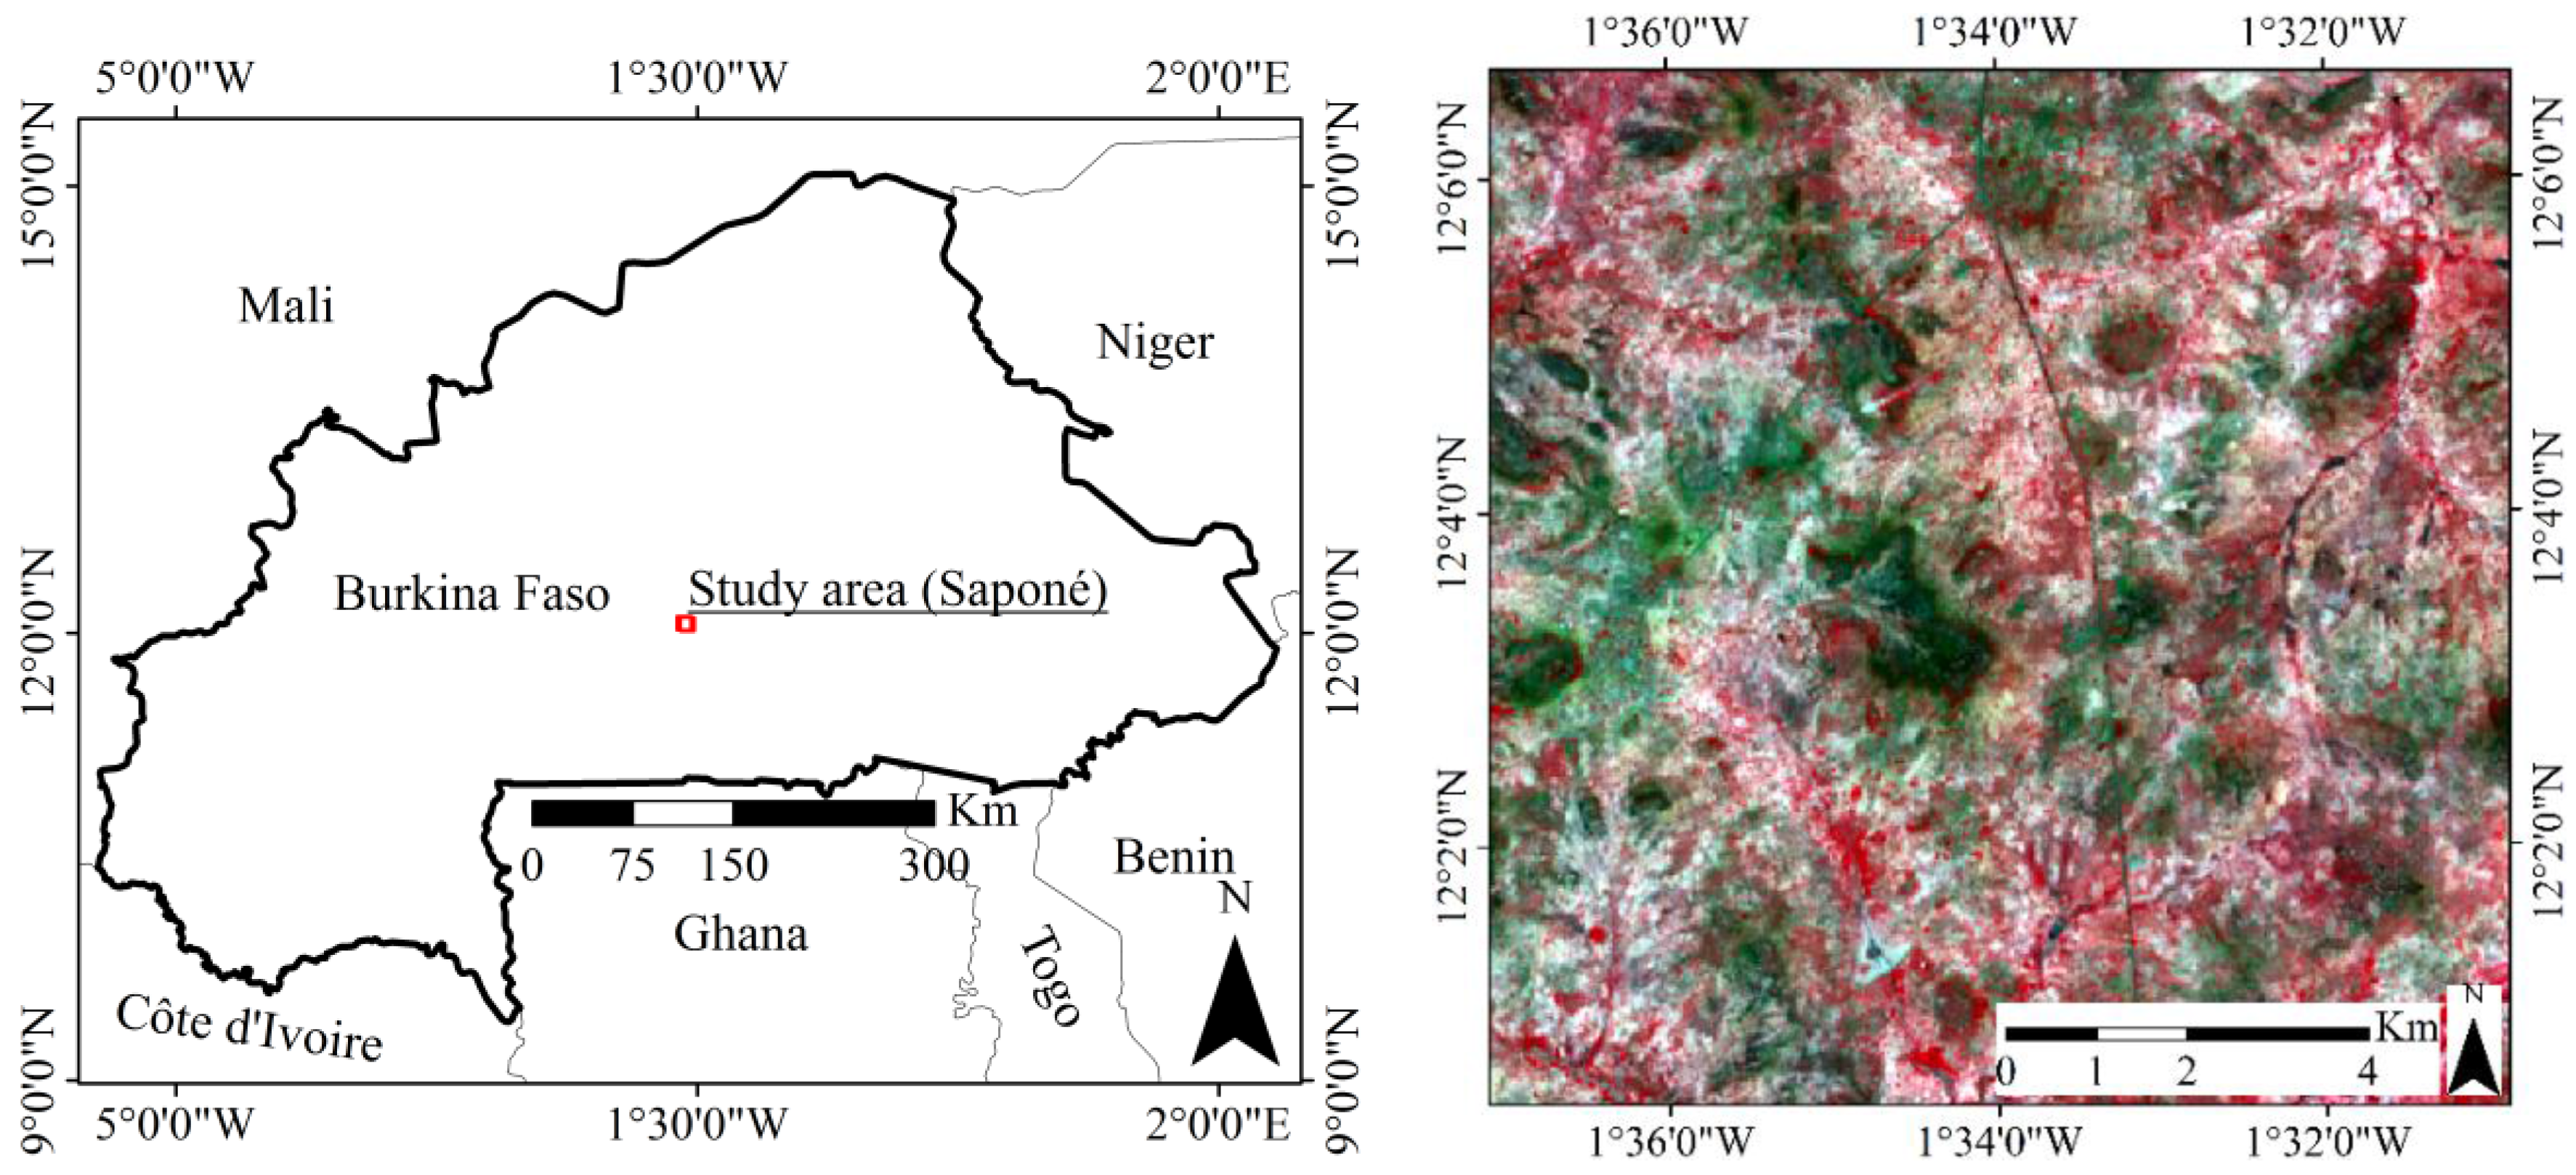
2.1. Study Area

2.2. Reference Data
2.2.1. Field Data

| Variable | Strata (Vegetation Density) | Plots (No.) | Min | Max | Mean | Standard Deviation |
|---|---|---|---|---|---|---|
| TCC (%) | Low | 25 | 0.2 | 23.2 | 10.1 | 7.5 |
| Medium | 27 | 0.4 | 58.7 | 18.9 | 11.3 | |
| High | 23 | 3.7 | 67.8 | 27.7 | 16.9 | |
| Total | 75 | 0.2 | 67.8 | 18.5 | 14.1 | |
| AGB (tons∙ha−1) | Low | 25 | 0.1 | 60 | 18.2 | 14.6 |
| Medium | 27 | 0.2 | 90.3 | 23.8 | 21.4 | |
| High | 23 | 1.1 | 140 | 27.4 | 29.9 | |
| Total | 75 | 0.1 | 140 | 23.2 | 22.7 |
| Tree Species | Input Variables | Location | References |
|---|---|---|---|
| Balanites aegyptiaca | DBH | Senegal | [61] |
| Eucalyptus camadulensis | DBH | Kenya | [62] |
| Guierra senegalensis | DBH | Burkina Faso | [63] |
| Acacia dudgeon, Anogeiosus leiocarpus, Combretom fragrance, Combretum collinum, Detarium microcarpum, Entada Africana, Piliostigma thonninghii | D20, DBH, H | Burkina Faso | [64] |
| Sclerocarya birrea | DBH, H, WD | South Africa | [65] |
| Tectona grandis | DBH | Indonesia | [66] |
| Vitellaria paradoxa | DBH, H | Burkina Faso | [67] |
| Other1 | DBH, H, WD | Pan-tropical | [61] |
2.2.2. WorldView-2 Data
2.3. Landsat 8 Data Acquisition and Pre-Processing
| Remote Sensing Data | Date | Season | Pixel Size | Usage |
|---|---|---|---|---|
| Landsat 8 OLI | 27 October 2013 | Dry season | MS: 30 m | Phenology variables |
| 28 November 2013 | ||||
| 30 December 2013 | ||||
| 31 January 2014 | ||||
| 16 February 2014 | ||||
| 4 March 2014 | ||||
| 8 June 2014 | Wet season | MS: 30 m Pan: 15 m | Spectral and texture variables | |
| WorldView-2 | 21 October 2012 | Dry season | MS: 0.5 m | Reference data |
2.4. Remote Sensing Predictor Variables
| Predictor Variables | Formula | Reference |
|---|---|---|
| Spectral | [71] | |
| Landsat 8 OLI bands 2–8 | ||
| Enhanced vegetation index (EVI) | [76] | |
| Generalized Difference Vegetation Index (GDVI) | (NIR2 − R2)/(NIR2 + R2) | [77] |
| Normalized Difference Vegetation Index (NDVI) | (NIR − Red)/(NIR + Red) | [60] |
| Normalized Difference Water Index (NDWI) | (NIR − SWIR 2)/(NIR + SWIR 2) | [78] |
| Specific Leaf Area Vegetation Index (SLAVI) | NIR/(Red + SWIR 2) | [79] |
| Simple Ratio (SR) | NIR/Red | [80] |
| Tasseled cap transformations | [50,51,52] | |
| Brightness (Br) | ||
| Greenness (Gr) | ||
| Wetness (We) | ||
| Texture (window sizes: 3 × 3, 5 × 5, 7 × 7 pixels) | [53] | |
| Homogeneity | ||
| Mean | ||
| Variance | ||
| Phenology (dry season NDVI) | [28] | |
| Maximum | ||
| Mean | ||
| Median | ||
| Minimum | ||
| Product | ||
| Standard deviation | ||
2.5. Spatial Aggregation and Sampling for Training and Validation
| Tree Cover Attribute | Number of Reference Pixels | Mean | Max | Standard Deviation |
|---|---|---|---|---|
| Tree canopy cover (%) | 150 | 21.9 | 88.9 | 18.4 |
| Aboveground biomass (tons∙ha−1) | 150 | 26.6 | 150 | 27.2 |
2.6. Random Forest Modeling
2.6.1. Predictor Variable Selection
2.6.2. Accuracy Assessment and Statistical Analyses
3. Results
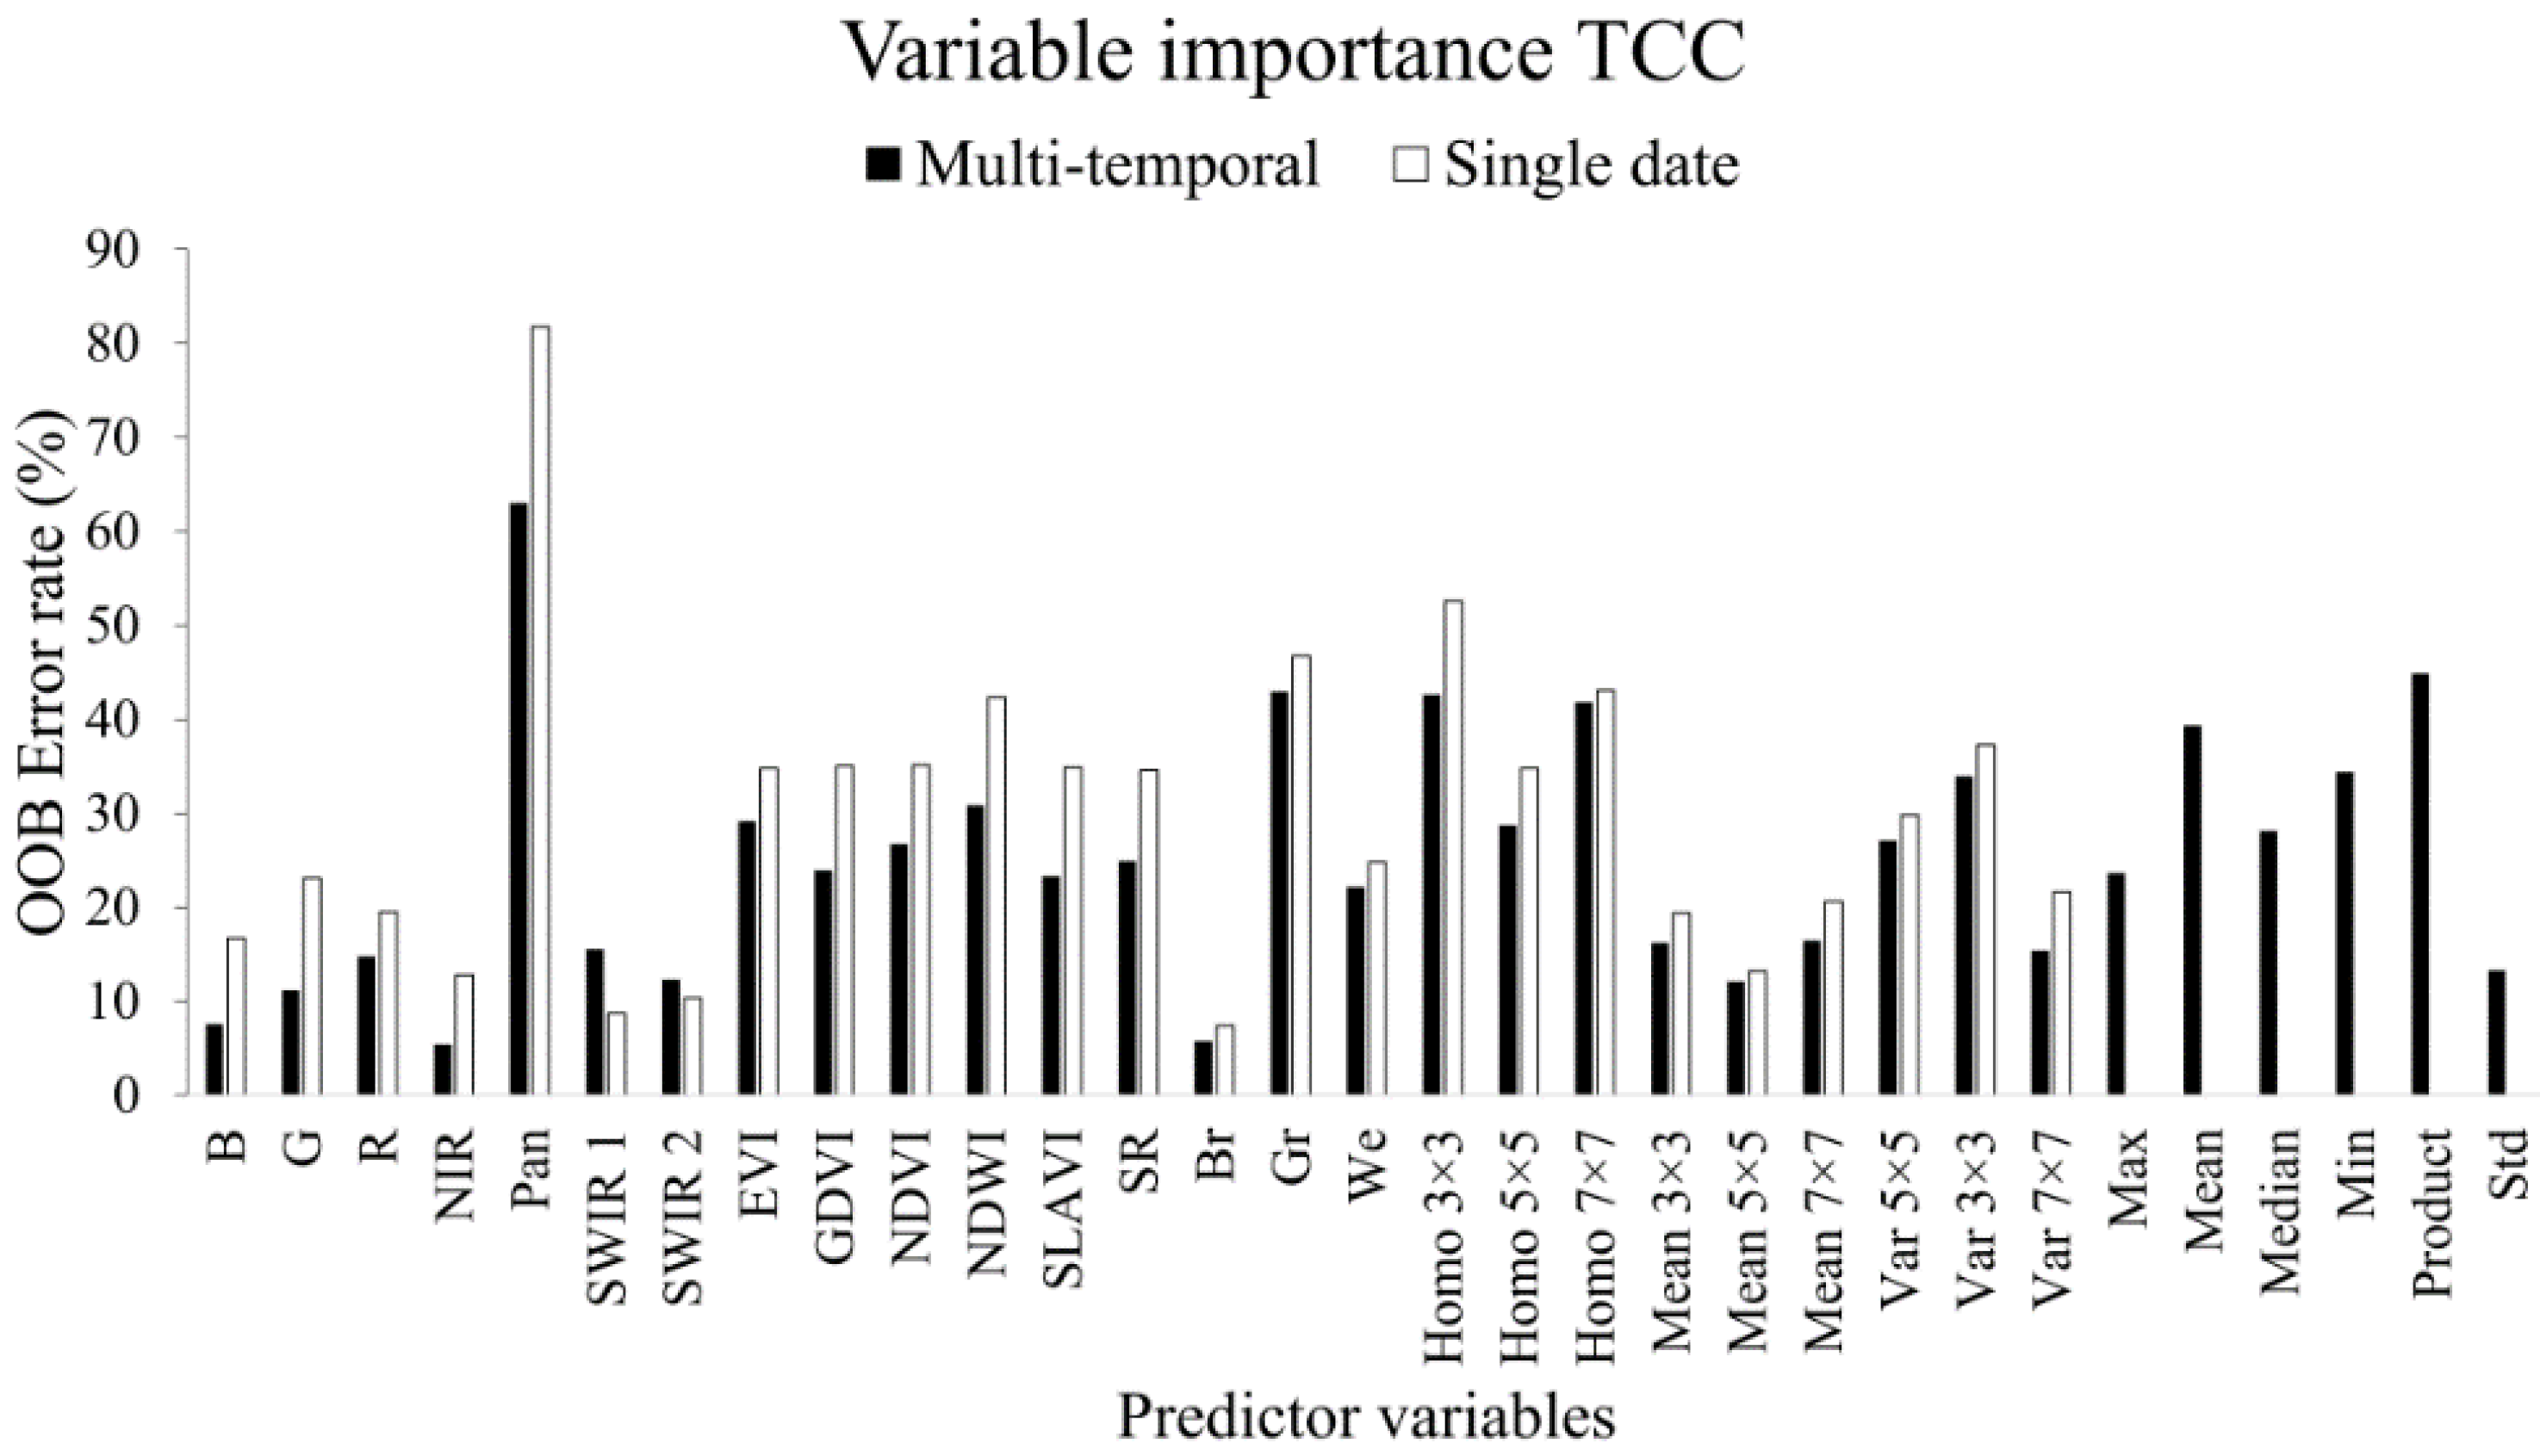
3.1. Variable Importance

3.1.1. Tree Canopy Cover
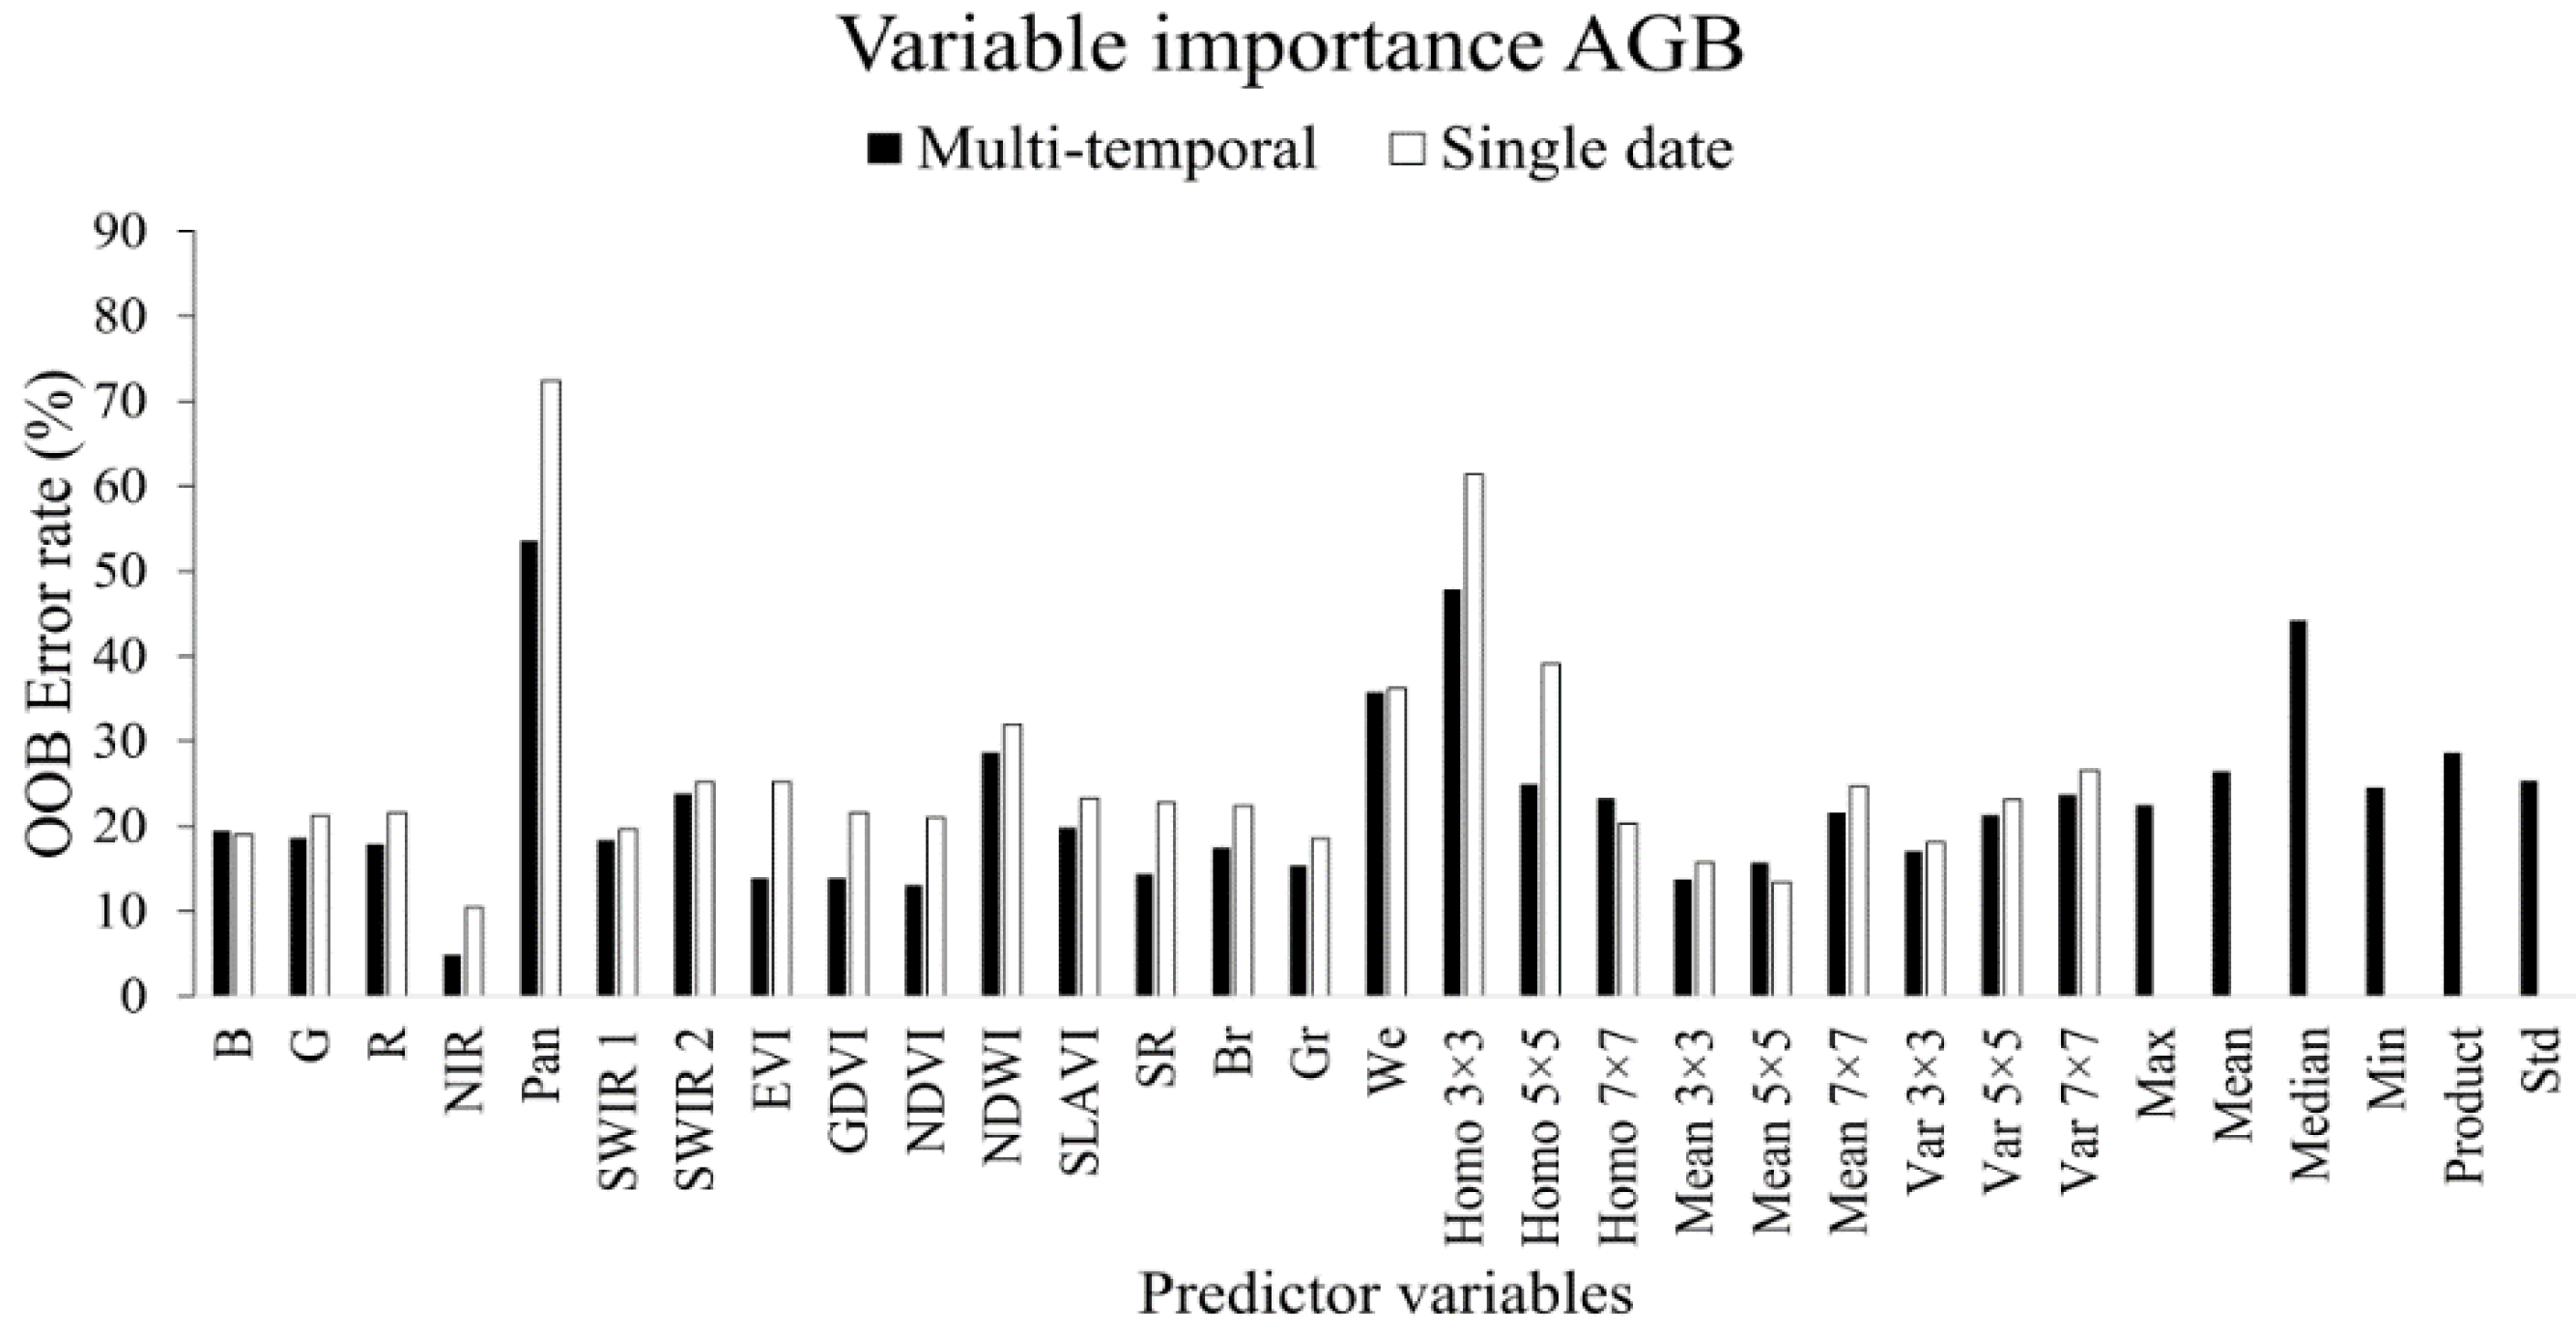
3.1.2. Aboveground Biomass
3.2. Variable Selection
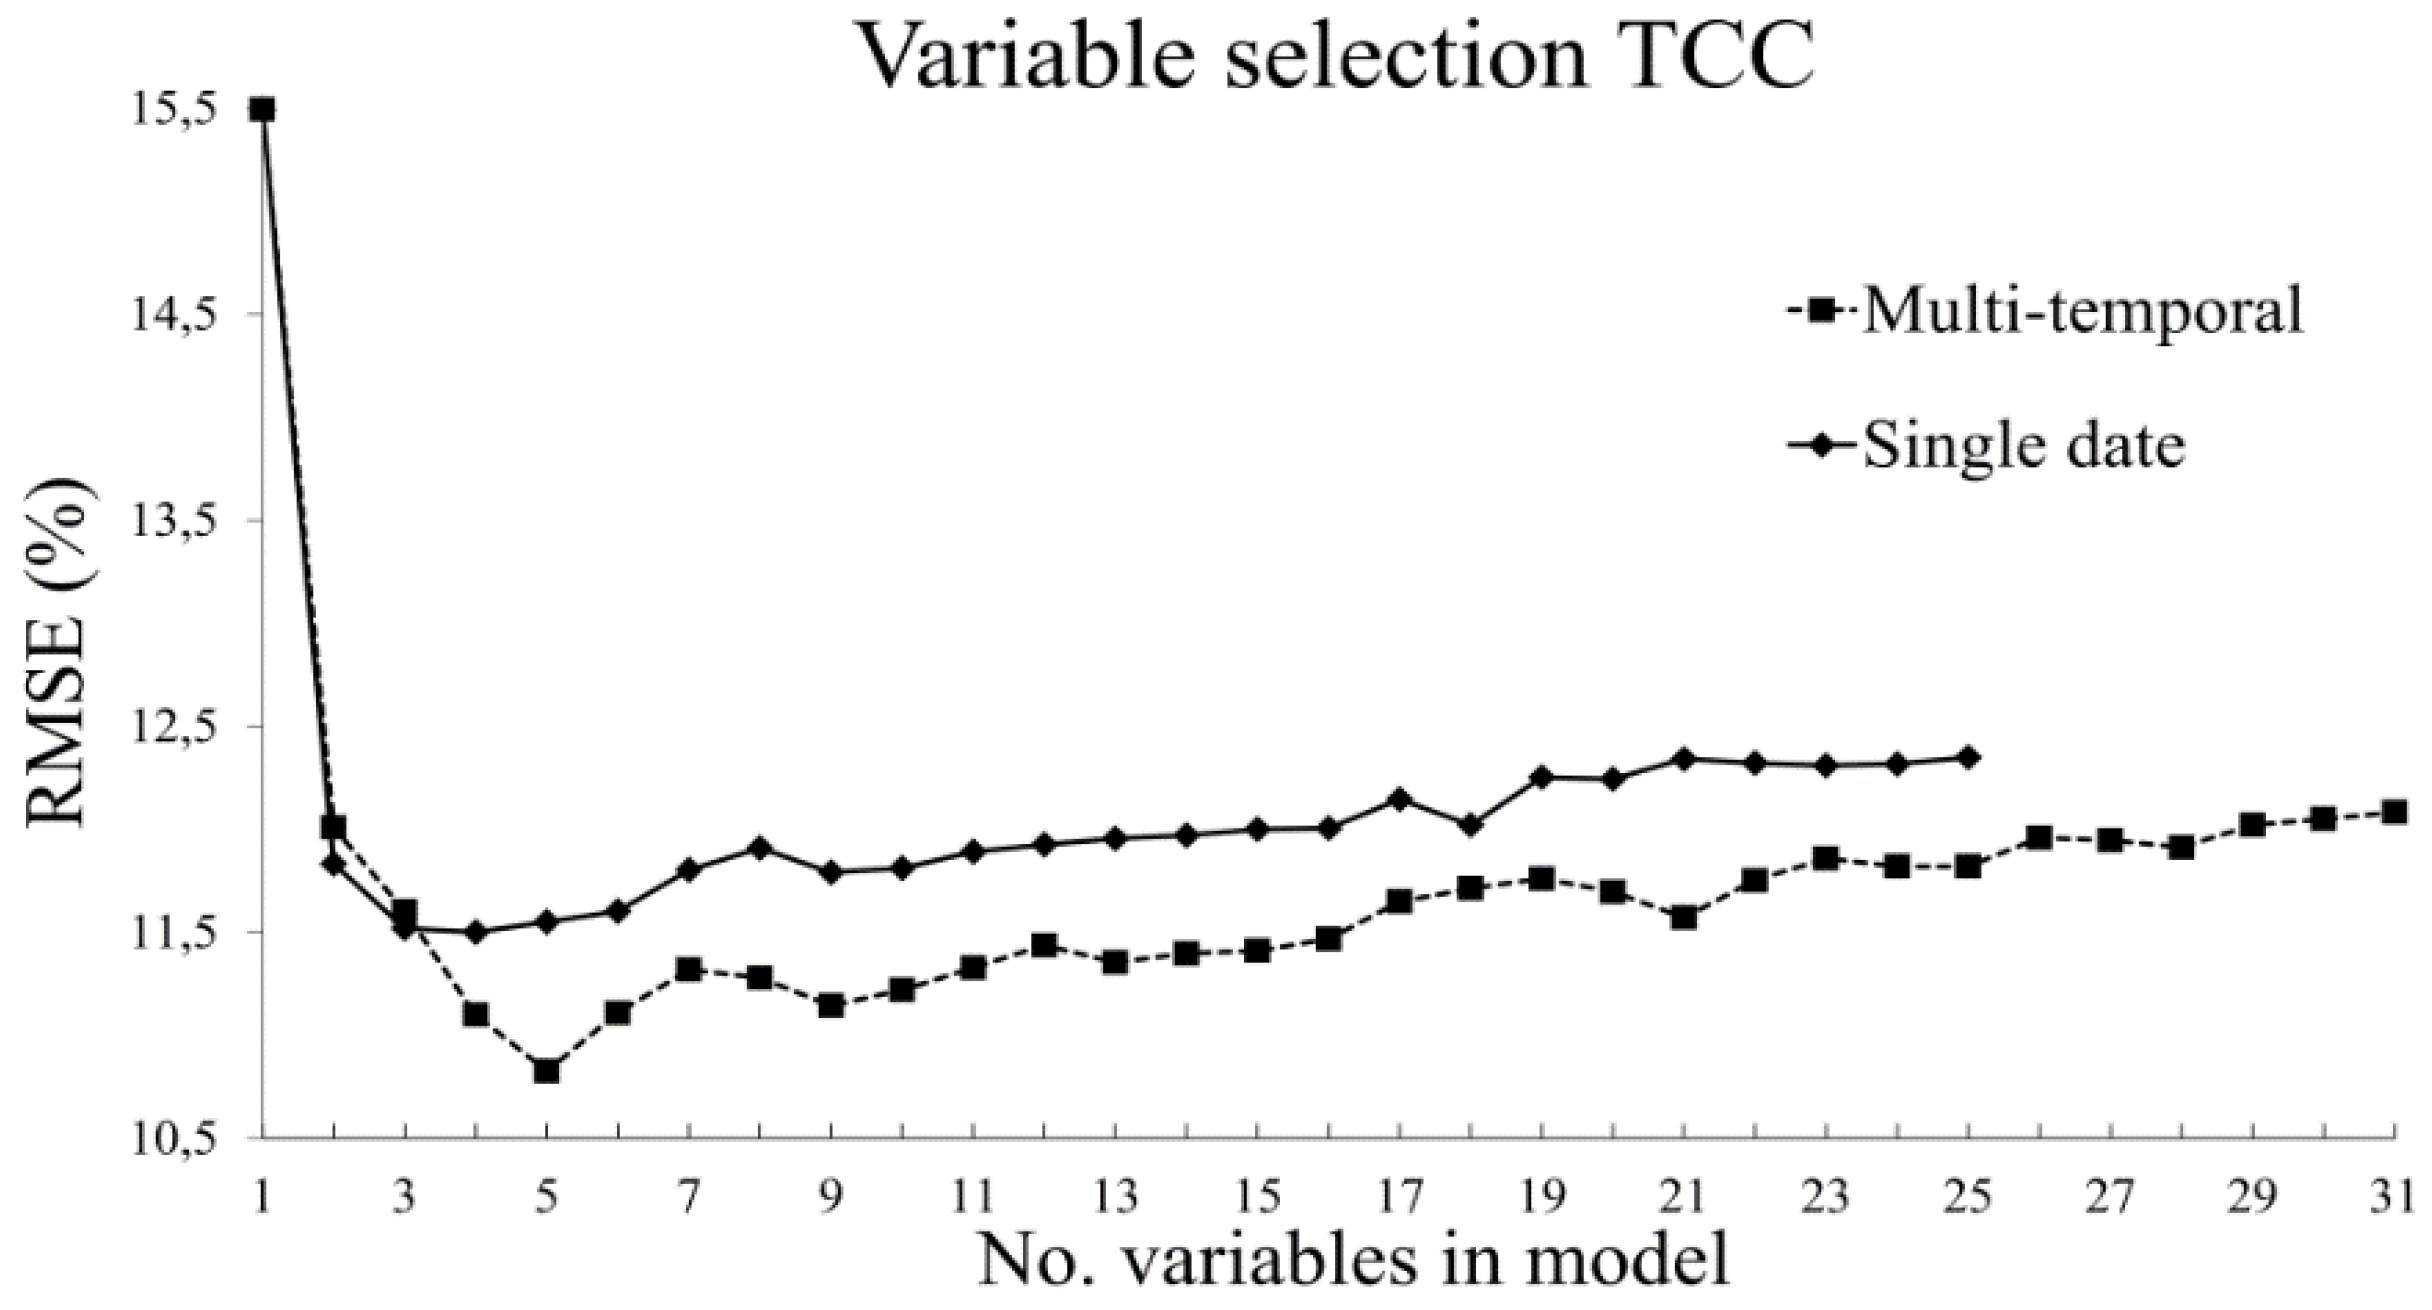
3.2.1. Tree Canopy Cover
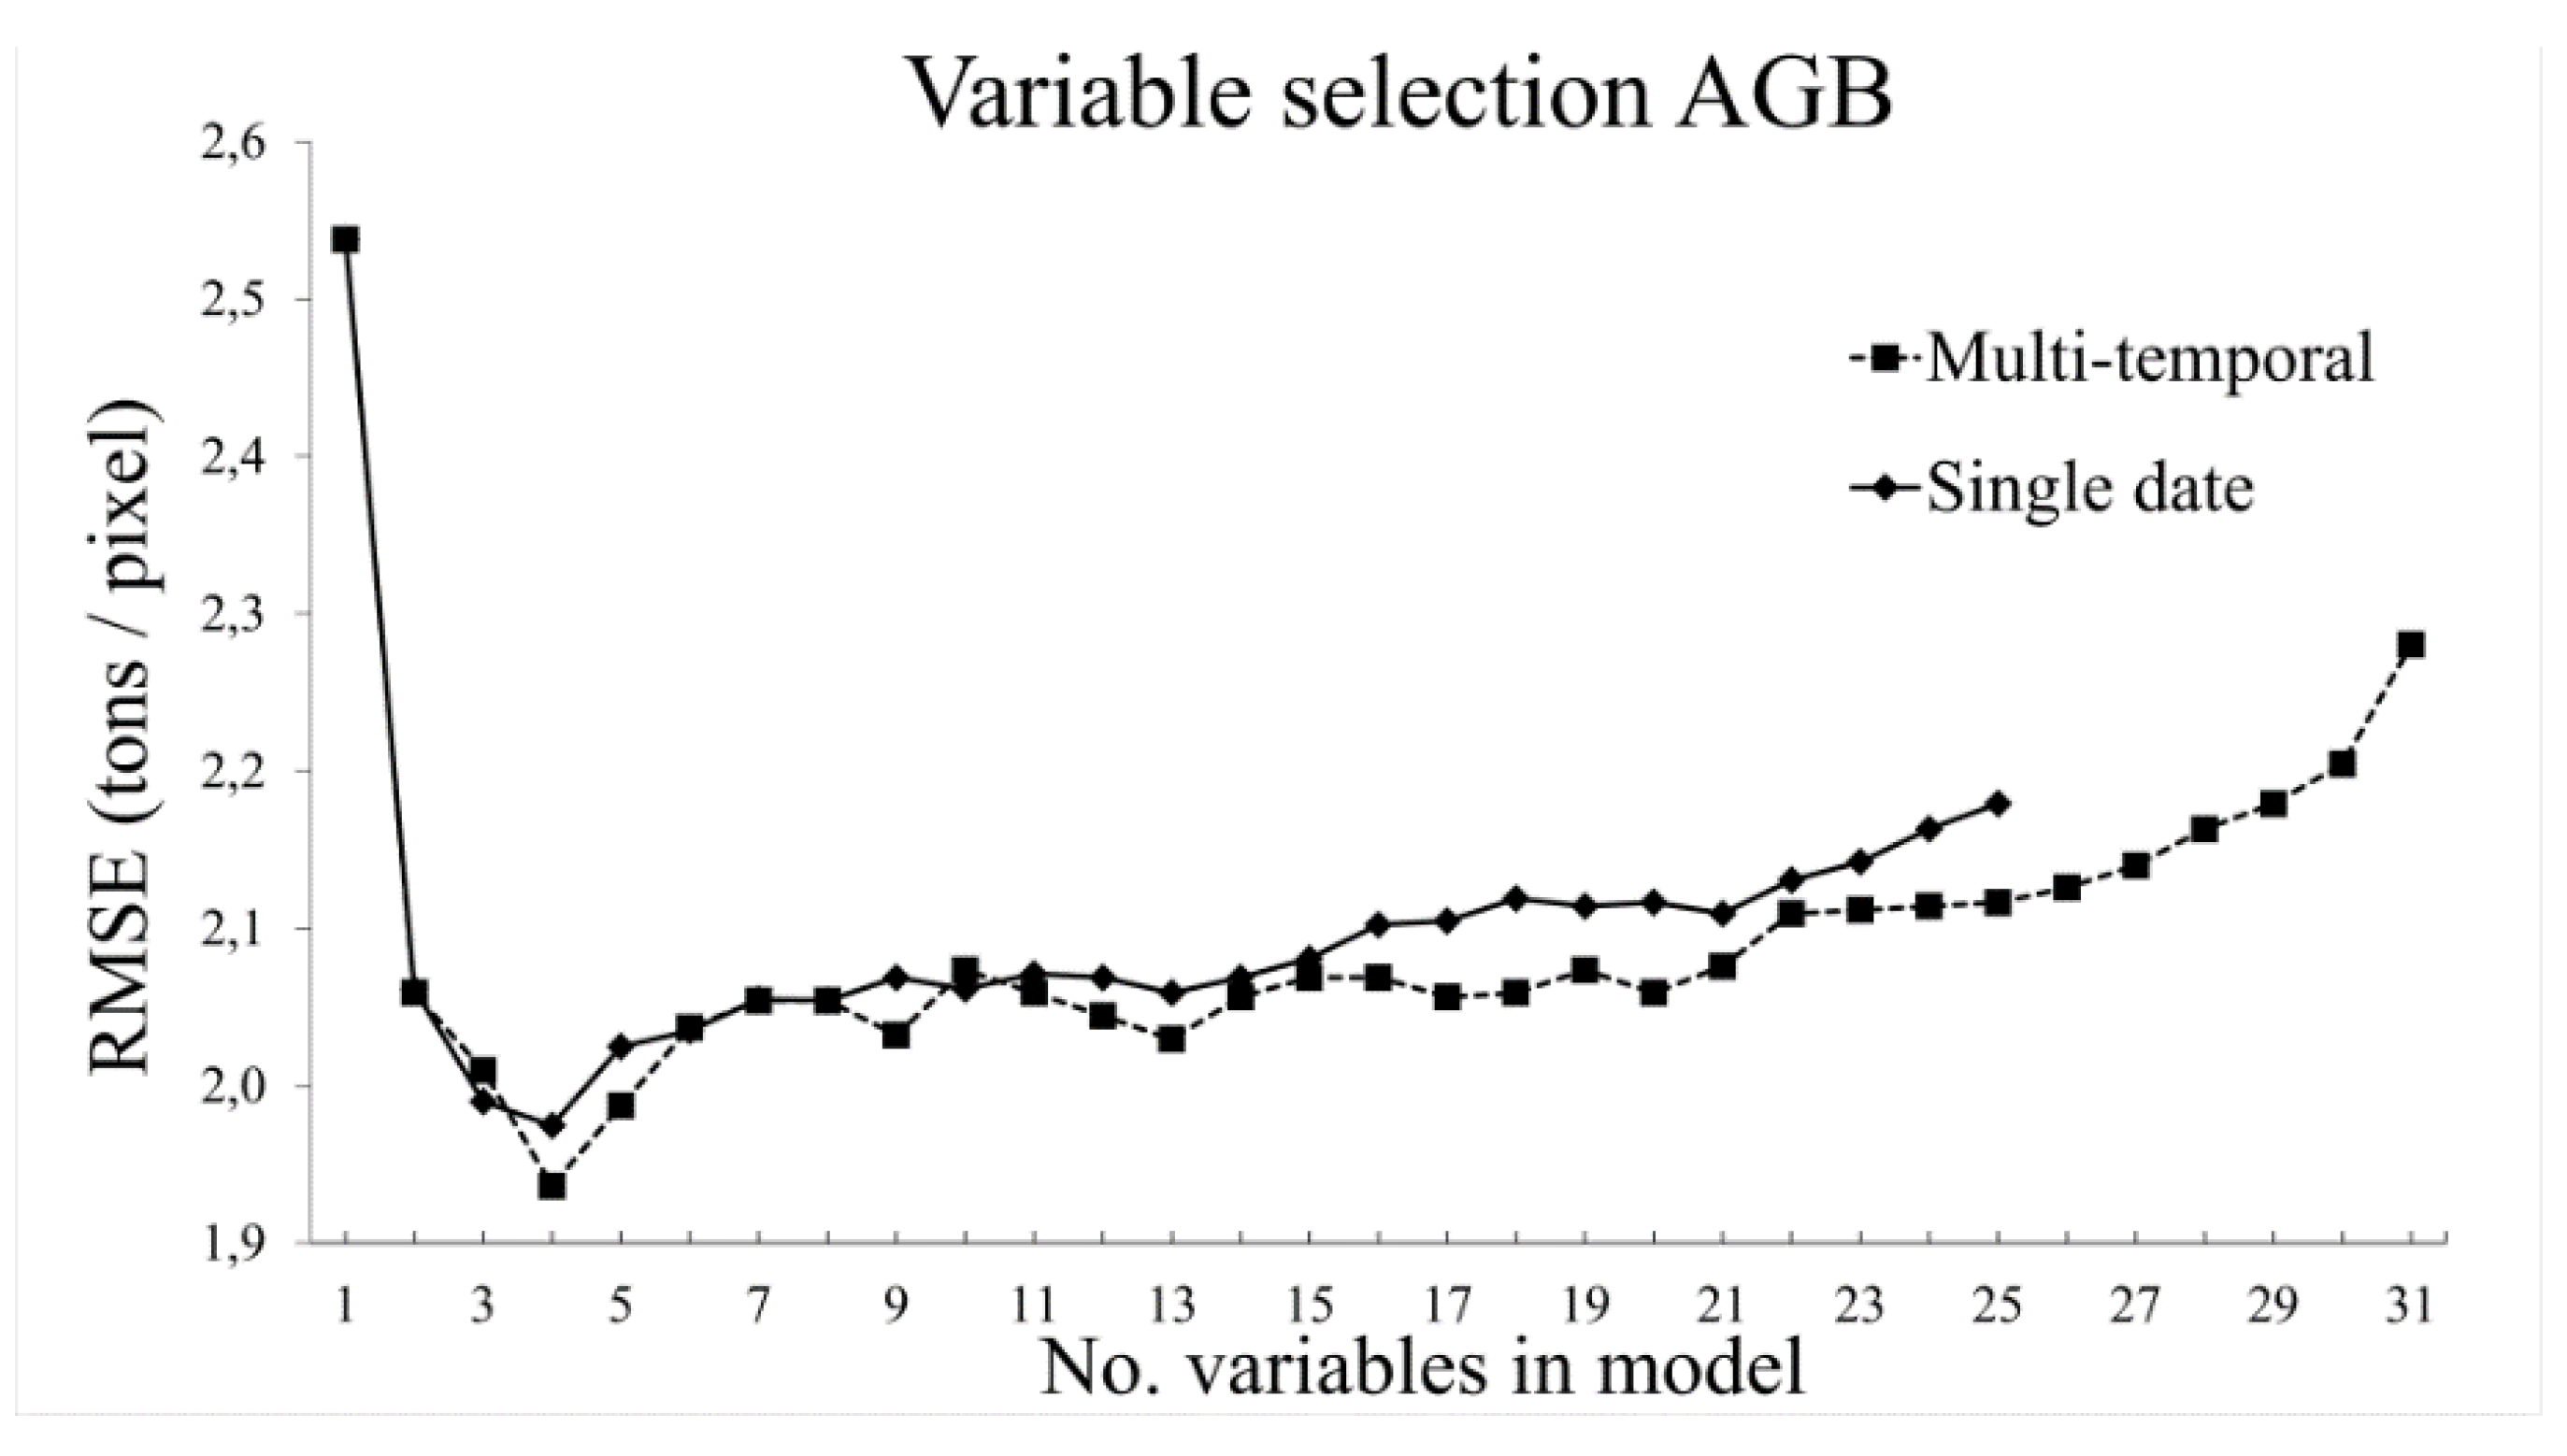
3.2.2. Aboveground Biomass
3.3. Predictive Performance of the RF Regression Models
| Variable | Variable Selection | Predictor Dataset | R2 | relRMSE (%) | RMSE | MBE |
|---|---|---|---|---|---|---|
| Tree canopy cover (%) | Full | Single date | 0.49 | 60.0 | 13.1 | 0.04 |
| Multi-temporal | 0.54 | 57.0 | 12.5 | 0.08 | ||
| Reduced | Single date | 0.65 | 49.7 | 10.9 | 0.02 | |
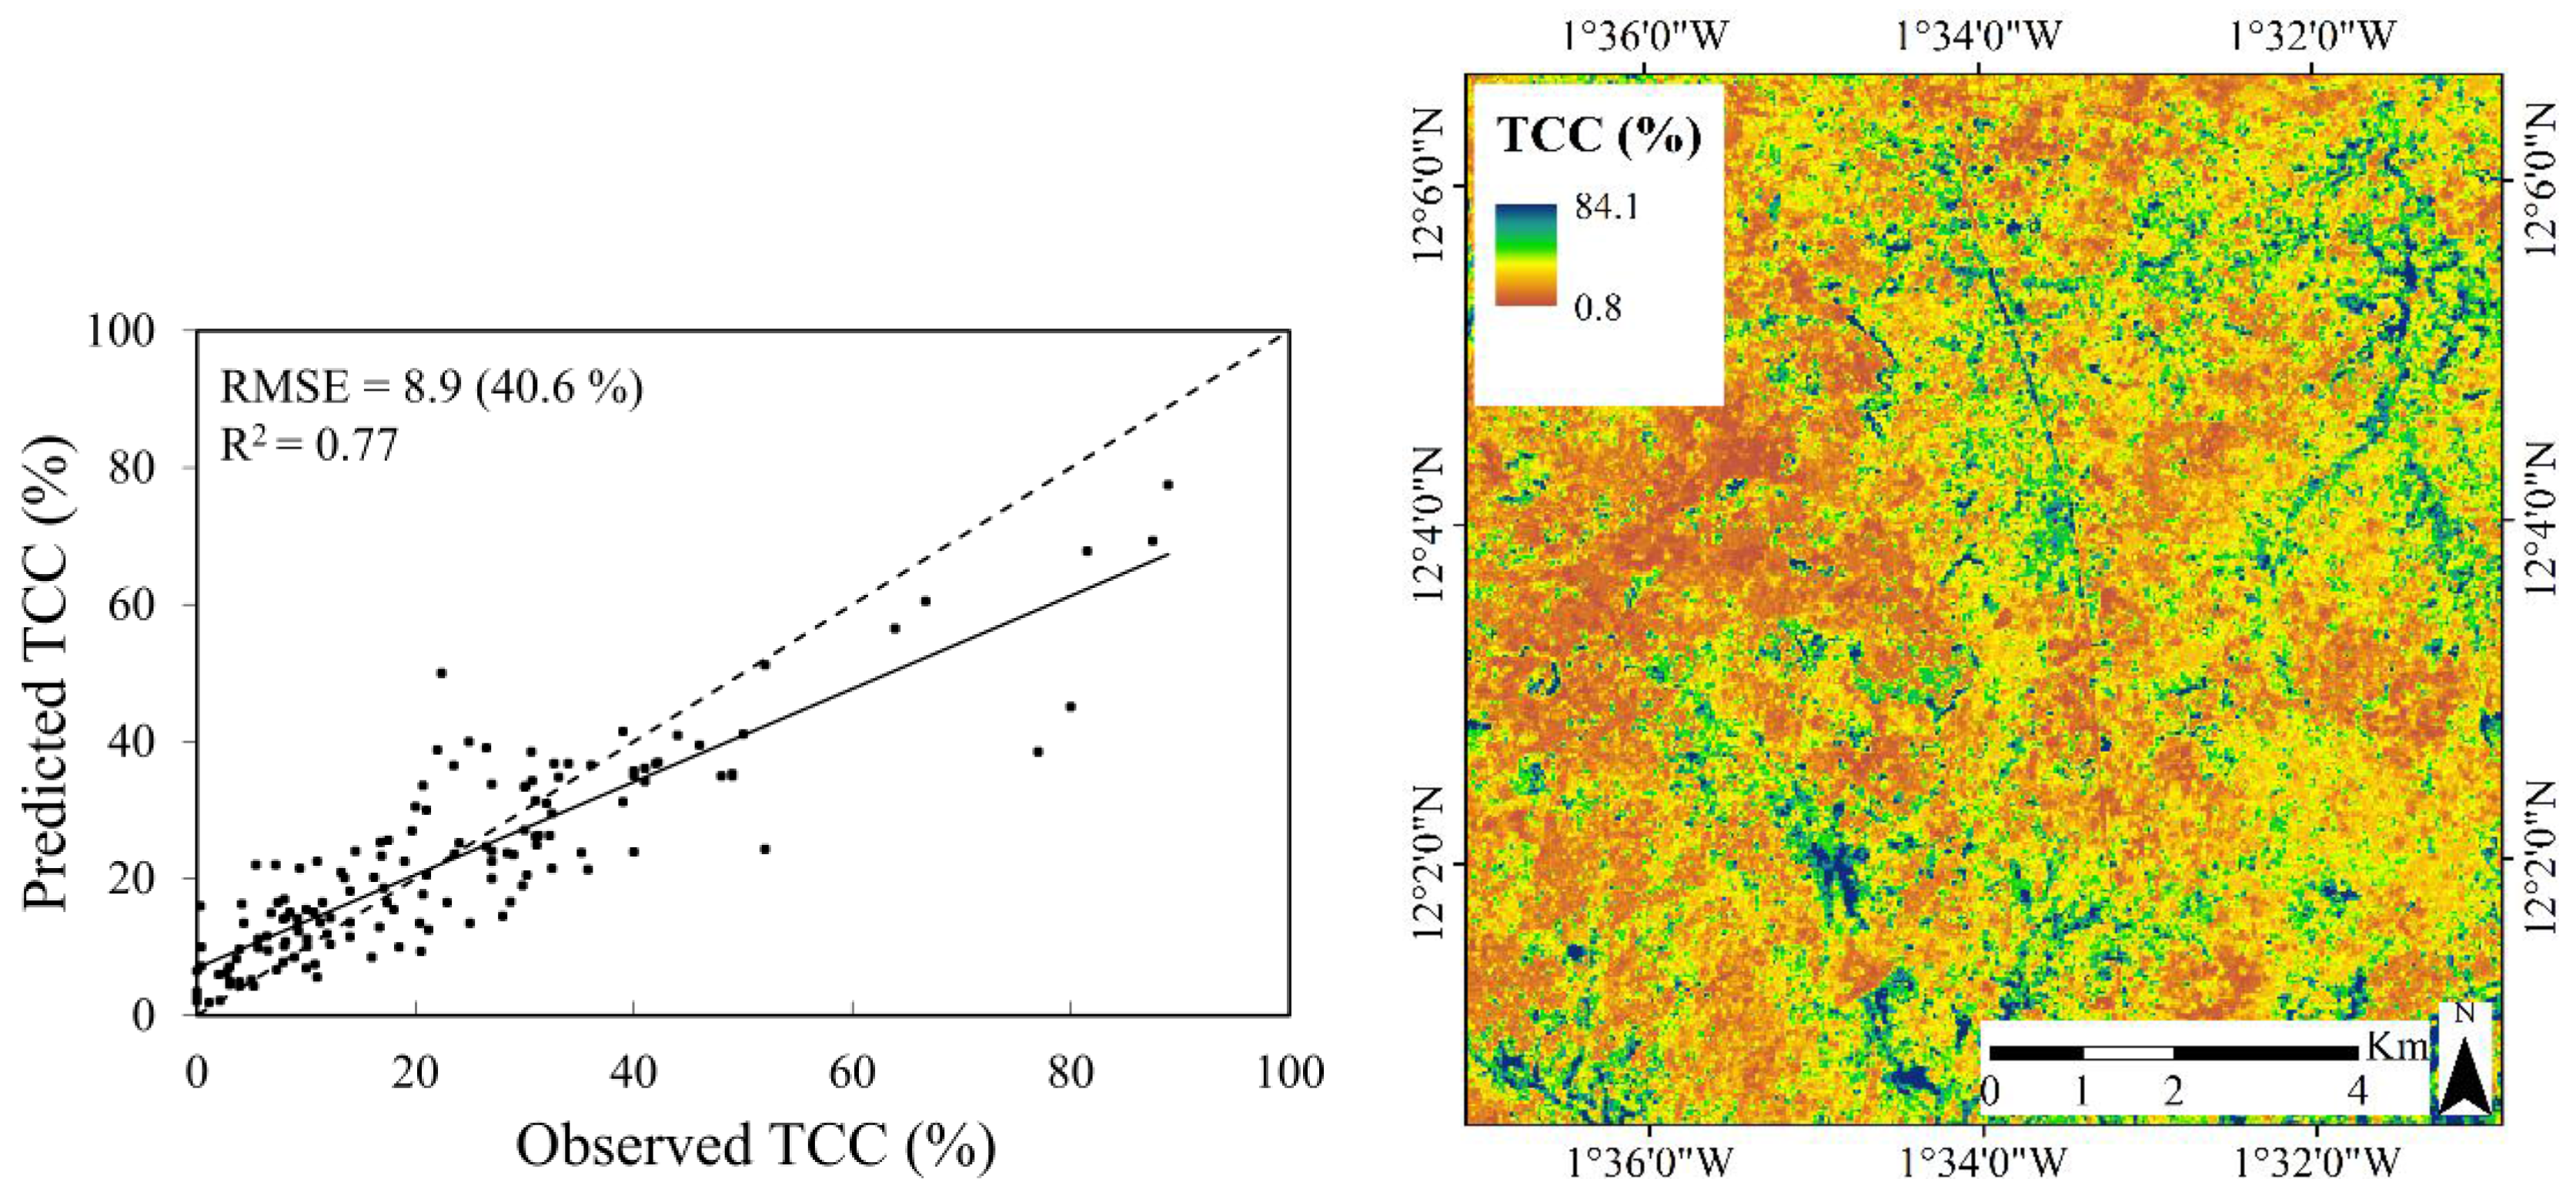
| Multi-temporal | 0.77 | 40.6 | 8.9 | 0.08 | ||
| Aboveground biomass (tons ha−1) | Full | Single date | 0.34 | 83.0 | 22.2 | 0.06 |
| Multi-temporal | 0.46 | 75.0 | 20 | −0.66 | ||
| Reduced | Single date | 0.44 | 75.0 | 20 | 0.44 | |
| Multi-temporal | 0.57 | 66.0 | 17.6 | 0.22 |
3.3.1. Tree Canopy Cover

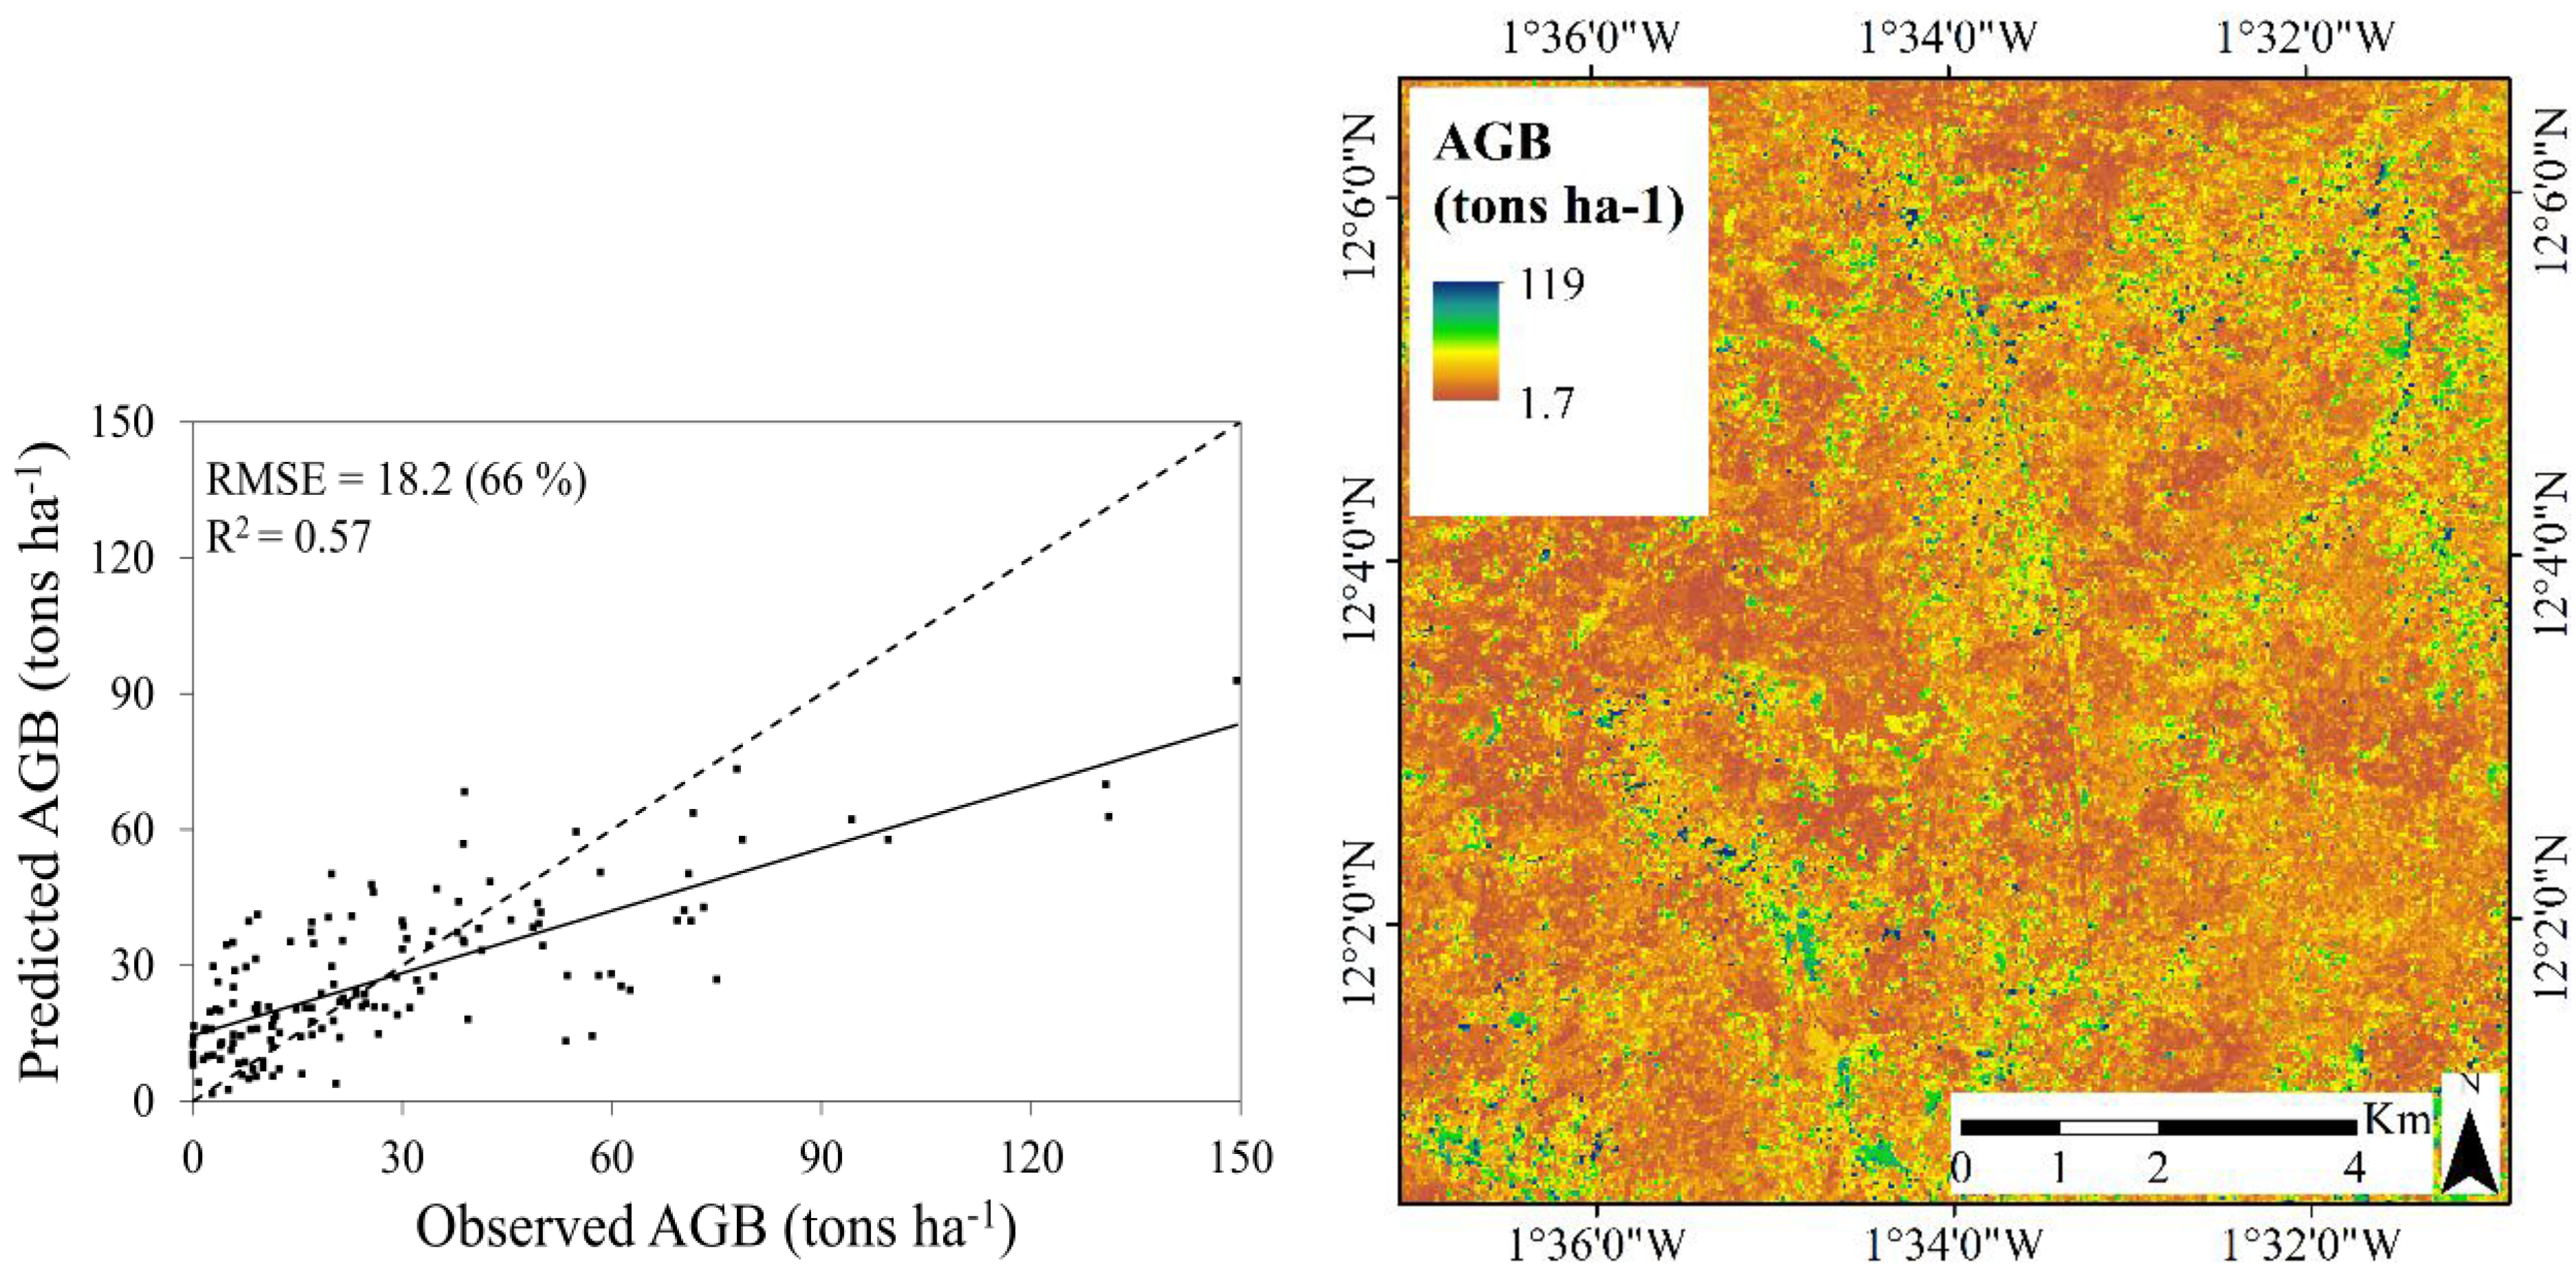
3.3.2. Aboveground Biomass
4. Discussion
4.1. Relationships between Predictor Variables and Tree Cover Attributes
4.2. Random Forest Regression and Variable Selection
5. Conclusions
- Landsat 8 is more suitable for mapping TCC compared to AGB in this landscape type: the best model for TCC resulted in a coefficient of determination (R2) of 0.77 and a root mean square error (RMSE) of 8.9 percent and the best model for AGB resulted in an R2 of 0.57 and a RMSE of 17.6 tons∙ha−1. The weaker relationship between the Landsat 8 data and AGB was expected, and can be explained by the difficulty of resolving information related to the three dimensional structure in optical satellite data.
- The use of variable selection to reduce the number of predictor variables improved the performance and interpretability of the RF models, and should therefore be considered when RF is used for similar tasks. From the total of 31 predictor variables, five were included in the best model for TCC and four were included for AGB.
- All three types of predictor variables (spectral, texture, and phenology), were included by the variable selection in the best model, which suggests that they provide complementary information to the predictions.
- The methods presented in this study are relatively simple and applicable over the Sudano-Sahelian woodlands where sufficient reference data for calibration and validation is available. High resolution satellite data, such as WorldView-2, represents a useful complement to field data in this context.
- The large contribution of Landsat’s 15 m panchromatic band and the phenology variables to the prediction success suggests that the upcoming Sentinel-2 optical sensor will have spatial and temporal features well suited for mapping tree cover attributes in Sudano-Sahelian woodlands.
Acknowledgments
Author Contributions
Conflicts of Interest
References
- Grainger, A. Constraints on modelling the deforestation and degradation of tropical open woodlands. Global Ecol. Biogeogr. 1999, 8, 179–190. [Google Scholar] [CrossRef]
- Chidumayo, E.; Gumbo, D.J. The Dry Forests and Woodlands of Africa: Managing for Products and Services; Earth Scan: London, UK, 2010. [Google Scholar]
- Boffa, J.M. Agroforestry Parkland in Sub-Saharan Africa: Fao Conservation Guide 34; United Nations-Food and Agricultural Organization: Rome, Italy, 1999. [Google Scholar]
- Dixon, R.K.; Brown, S.; Houghton, R.A.; Solomon, A.M.; Trexler, M.C.; Wisniewski, J. Carbon pools and flux of global forest ecosystems. Science 1994, 263, 185–190. [Google Scholar] [CrossRef] [PubMed]
- Lal, R. Carbon sequestration in dryland ecosystems. Environ. Manag. 2004, 33, 528–544. [Google Scholar] [CrossRef] [PubMed]
- Foley, J.A.; DeFries, R.; Asner, G.P.; Barford, C.; Bonan, G.; Carpenter, S.R.; Chapin, F.S.; Coe, M.T.; Daily, G.C.; Gibbs, H.K.; et al. Global consequences of land use. Science 2005, 309, 570–574. [Google Scholar] [CrossRef] [PubMed]
- Tappan, G.G.; Sall, M.; Wood, E.C.; Cushing, M. Ecoregions and land cover trends in Senegal. J. Arid Environ. 2004, 59, 427–462. [Google Scholar] [CrossRef]
- Intergovernmental Panel on Climate Change (IPCC). Climate Change 2014: Impacts, Adaptation, and Vulnerability. Part B: Regional Aspects. Contribution of Working Group II to the Fifth Assessment Report of the intErgovernmental Panel on Climate Change; Barros, V.R., Field, C.B., Dokken, D.J., Mastrandrea, M.D., Mach, K.J., Bilir, T.E., Chatterjee, M., Estrada, Y.O., Genova, R.C., Ebi, K.L., et al., Eds.; Cambridge University Press: New York, NY, USA, 2014. [Google Scholar]
- Gonzalez, P. Desertification and a shift of forest species in the West African Sahel. Clim. Res 2001, 17, 217–228. [Google Scholar] [CrossRef]
- Maranz, S. Tree mortality in the African Sahel indicates an anthropogenic ecosystem displaced by climate change. J. Biogeogr. 2009, 36, 1181–1193. [Google Scholar] [CrossRef]
- Gonzalez, P.; Tucker, C.J.; Sy, H. Tree density and species decline in the African Sahel attributable to climate. J. Arid Environ. 2012, 78, 55–64. [Google Scholar] [CrossRef]
- Brandt, M.; Mbow, C.; Diouf, A.A.; Verger, A.; Samimi, C.; Fensholt, R. Ground- and satellite-based evidence of the biophysical mechanisms behind the greening Sahel. Global Chang. Biol. 2015, 21, 1610–1620. [Google Scholar] [CrossRef] [PubMed]
- Reij, C.; Tappan, G.; Belemvire, A. Changing land management practices and vegetation on the central plateau of Burkina Faso (1968–2002). J. Arid Environ. 2005, 63, 642–659. [Google Scholar] [CrossRef]
- Tougiani, A.; Guero, C.; Rinaudo, T. Community mobilisation for improved livelihoods through tree crop management in Niger. GeoJournal 2009, 74, 377–389. [Google Scholar] [CrossRef]
- Sendzimir, J.; Reij, C.P.; Magnuszewski, P. Rebuilding resilience in the Sahel: Regreening in the Maradi and Zinder regions of Niger. Ecol. Soc. 2011, 16. [Google Scholar] [CrossRef]
- Lu, D.S. The potential and challenge of remote sensing-based biomass estimation. Int. J. Remote Sens. 2006, 27, 1297–1328. [Google Scholar] [CrossRef]
- Goetz, S.J.; Baccini, A.; Laporte, N.T.; Johns, T.; Walker, W.; Kellndorfer, J.; Houghton, R.A.; Sun, M. Mapping and monitoring carbon stocks with satellite observations: A comparison of methods. Carbon Balance Manag. 2009. [Google Scholar] [CrossRef] [PubMed]
- Eisfelder, C.; Kuenzer, C.; Dech, S. Derivation of biomass information for semi-arid areas using remote-sensing data. Int. J. Remote Sens. 2012, 33, 2937–2984. [Google Scholar] [CrossRef]
- Barbosa, J.M.; Broadbent, E.N.; Bitencourt, M.D. Remote sensing of aboveground biomass in tropical secondary forests: A review. Int. J. For. Res. 2014. [Google Scholar] [CrossRef]
- Sexton, J.O.; Song, X.P.; Feng, M.; Noojipady, P.; Anand, A.; Huang, C.; Kim, D.H.; Collins, K.M.; Channan, S.; DiMiceli, C.; et al. Global, 30-m resolution continuous fields of tree cover: Landsat-based rescaling of MODIS vegetation continuous fields with lidar-based estimates of error. Int. J. Digit. Earth 2013, 6, 427–448. [Google Scholar] [CrossRef]
- Hansen, M.C.; Townshend, J.R.G.; DeFries, R.S.; Carroll, M. Estimation of tree cover using MODIS data at global, continental and regional/local scales. Int. J. Remote Sens. 2005, 26, 4359–4380. [Google Scholar] [CrossRef]
- Franklin, J.; Strahler, A.H. Invertible canopy reflectance modeling of vegetation structure in semiarid woodland. IEEE Trans. Geosci. Remote Sens. 1988, 26, 809–825. [Google Scholar] [CrossRef]
- Franklin, J. Land cover stratification using Landsat Thematic Mapper data in Sahelian and Sudanian woodland and wooded grassland. J. Arid Environ. 1991, 20, 141–163. [Google Scholar]
- Cord, A.; Conrad, C.; Schmidt, M.; Dech, S. Standardized FAO-LCCS land cover mapping in heterogeneous tree savannas of West Africa. J. Arid Environ. 2010, 74, 1083–1091. [Google Scholar] [CrossRef]
- Tagesson, T.; Fensholt, R.; Guiro, I.; Rasmussen, M.O.; Huber, S.; Mbow, C.; Garcia, M.; Horion, S.; Sandholt, I.; Holm-Rasmussen, B.; et al. Ecosystem properties of semiarid savanna grassland in West Africa and its relationship with environmental variability. Global Chang. Biol. 2015, 21, 250–264. [Google Scholar] [CrossRef] [PubMed]
- Hansen, M.C.; DeFries, R.S.; Townshend, J.R.G.; Carroll, M.; Dimiceli, C.; Sohlberg, R.A. Global percent tree cover at a spatial resolution of 500 meters: First results of the MODIS vegetation continuous fields algorithm. Earth Interact. 2003, 7, 1–15. [Google Scholar] [CrossRef]
- Heiskanen, J. Evaluation of global land cover data sets over the tundra-taiga transition zone in northern most finland. Int. J. Remote Sens. 2008, 29, 3727–3751. [Google Scholar] [CrossRef]
- Gessner, U.; Machwitz, M.; Conrad, C.; Dech, S. Estimating the fractional cover of growth forms and bare surface in savannas. A multi-resolution approach based on regression tree ensembles. Remote Sens. Environ. 2013, 129, 90–102. [Google Scholar] [CrossRef]
- Herrmann, S.M.; Wickhorst, A.J.; Marsh, S.E. Estimation of tree cover in an agricultural parkland of Senegal using rule-based regression tree modeling. Remote Sens. 2013, 5, 4900–4918. [Google Scholar] [CrossRef]
- Broadbent, E.N.; Asner, G.P.; Peña-Claros, M.; Palace, M.; Soriano, M. Spatial partitioning of biomass and diversity in a lowland Bolivian forest: Linking field and remote sensing measurements. For. Ecol. Manag. 2008, 255, 2602–2616. [Google Scholar] [CrossRef]
- Lu, D. Aboveground biomass estimation using Landsat TM data in the Brazilian Amazon. Int. J. Remote Sens. 2005, 26, 2509–2525. [Google Scholar] [CrossRef]
- Fuchs, H.; Magdon, P.; Kleinn, C.; Flessa, H. Estimating aboveground carbon in a catchment of the Siberian forest tundra: Combining satellite imagery and field inventory. Remote Sens. Environ. 2009, 113, 518–531. [Google Scholar] [CrossRef]
- Eckert, S. Improved forest biomass and carbon estimations using texture measures from Worldview-2 satellite data. Remote Sens. 2012, 4, 810–829. [Google Scholar] [CrossRef]
- Kelsey, K.C.; Neff, J.C. Estimates of aboveground biomass from texture analysis of Landsat imagery. Remote Sens. 2014, 6, 6407–6422. [Google Scholar] [CrossRef]
- Karlson, M. Linköping University: Linköping, Sweden, Unpublished work. 2015.
- Horion, S.; Fensholt, R.; Tagesson, T.; Ehammer, A. Using earth observation-based dry season ndvi trends for assessment of changes in tree cover in the Sahel. Int. J. Remote Sens. 2014, 35, 2493–2515. [Google Scholar] [CrossRef]
- Kamusoko, C.; Gamba, J.; Murakami, H. Mapping woodland cover in the Miombo ecosystem: A comparison of machine learning classifiers. Land 2014, 3, 524–540. [Google Scholar] [CrossRef]
- Irons, J.R.; Dwyer, J.L.; Barsi, J.A. The next Landsat satellite: The Landsat data continuity mission. Remote Sens. Environ. 2012, 122, 11–21. [Google Scholar] [CrossRef]
- Dube, T.; Mutanga, O. Evaluating the utility of the medium-spatial resolution Landsat 8 multispectral sensor in quantifying aboveground biomass in Umgeni catchment, South Africa. ISPRS J. Photogramm. Remote Sens. 2015, 101, 36–46. [Google Scholar] [CrossRef]
- Pflugmacher, D.; Cohen, W.B.; Kennedy, R.E. Using Landsat-derived disturbance history (1972–2010) to predict current forest structure. Remote Sens. Environ. 2012, 122, 146–165. [Google Scholar] [CrossRef]
- Frazier, R.J.; Coops, N.C.; Wulder, M.A.; Kennedy, R. Characterization of aboveground biomass in an unmanaged boreal forest using Landsat temporal segmentation metrics. ISPRS J. Photogramm. Remote Sens. 2014, 92, 137–146. [Google Scholar] [CrossRef]
- Curran, P.J.; Hay, A.M. The importance of measurement error for certain procedures in remote sensing at optical wavelengths. Photogramm. Eng. Remote Sens. 1986, 52, 229–241. [Google Scholar]
- Cohen, W.B.; Maiersperger, T.K.; Gower, S.T.; Turner, D.P. An improved strategy for regression of biophysical variables and Landsat ETM+ data. Remote Sens. Environ. 2003, 84, 561–571. [Google Scholar] [CrossRef]
- Breiman, L. Statistical modeling: The two cultures. Stat. Sci. 2001, 16, 199–231. [Google Scholar] [CrossRef]
- Vapnik, V.N. An overview of statistical learning theory. IEEE Trans. Neural Netw. 1999, 10, 988–999. [Google Scholar] [CrossRef] [PubMed]
- Breiman, L.; Friedman, J.; Stone, C.J.; Olshen, R.A. Classification and Regression Trees; Taylor & Francis: New York, NY, USA, 1984; p. 368. [Google Scholar]
- Breiman, L. Random forests. Mach. Learn. 2001, 45, 5–32. [Google Scholar] [CrossRef]
- Powell, S.L.; Cohen, W.B.; Healey, S.P.; Kennedy, R.E.; Moisen, G.G.; Pierce, K.B.; Ohmann, J.L. Quantification of live aboveground forest biomass dynamics with Landsat time-series and field inventory data: A comparison of empirical modeling approaches. Remote Sens. Environ. 2010, 114, 1053–1068. [Google Scholar] [CrossRef]
- Fassnacht, F.E.; Hartig, F.; Latifi, H.; Berger, C.; Hernández, J.; Corvalán, P.; Koch, B. Importance of sample size, data type and prediction method for remote sensing-based estimations of aboveground forest biomass. Remote Sens. Environ. 2014, 154, 102–114. [Google Scholar] [CrossRef]
- Kauth, R.J.; Thomas, G.S. The Tasselled cap—A graphic description of the spectral-temporal development of agricultural crops as seen by Landsat. In Proceedings of the Symposium on Machine Processing of Remotely Sensed Data, West Lafayette, IN, USA, 29 June–1 July 1976; pp. 41–51.
- Crist, E.P.; Cicone, R.C. Physically-based transformation of Thematic Mapper data—The TM tasseled cap. IEEE Trans. Geosci. Remote Sens. 1984, GE-22, 256–263. [Google Scholar] [CrossRef]
- Baig, M.H.A.; Zhang, L.; Shuai, T.; Tong, Q. Derivation of a tasselled cap transformation based on Landsat 8 at-satellite reflectance. Remote Sens. Lett. 2014, 5, 423–431. [Google Scholar] [CrossRef]
- Haralick, R.M.; Shanmugam, K.; Dinstein, I. Textural features for image classification. IEEE Trans. Syst. Man Cybern. 1973, SMC-3, 610–621. [Google Scholar] [CrossRef]
- Jonsson, K.; Ong, C.K.; Odongo, J.C.W. Influence of scattered nere and karite trees on microclimate, soil fertility and millet yield in Burkina Faso. Exp. Agric. 1999, 35, 39–53. [Google Scholar] [CrossRef]
- Peel, M.C.; Finlayson, B.L.; McMahon, T.A. Updated world map of the Köppen-Geiger climate classification. Hydrol. Earth Syst. Sci. 2007, 11, 1633–1644. [Google Scholar] [CrossRef]
- Nicholson, S.E. A revised picture of the structure of the “monsoon” and land ITCZ over West Africa. Clim. Dyn. 2009, 32, 1155–1171. [Google Scholar] [CrossRef]
- Karlson, M.; Reese, H.; Ostwald, M. Tree crown mapping in managed woodlands (parklands) of semi-arid West Africa using Worldview-2 imagery and geographic object based image analysis. Sens. Switz. 2014, 14, 22643–22669. [Google Scholar] [CrossRef] [PubMed]
- Arbonnier, M. Trees, Shrubs and Lianas of West African Dry Zones, 2nd ed.; Magraf Publishers CIRAD: Paris, France, 2004; p. 573. [Google Scholar]
- Brown, S.L.; Schroeder, P.; Kern, J.S. Spatial distribution of biomass in forests of the eastern USA. For. Ecol. Manag. 1999, 123, 81–90. [Google Scholar] [CrossRef]
- Rouse, J.W.; Haas, R.H.; Schell, J.A.; Deering, D.W. Monitoring vegetation systems in the Great Plains with ERST. NASA Spec. Publ. 1973, 351, 309–317. [Google Scholar]
- Poupon, H. Structure et Dynamique de la Strate Ligneuse d’une Steppe Sahélienne au Nord du Sénégal; ORSTOM: Paris, France, 1980; p. 351. [Google Scholar]
- Kuyah, S.; Dietz, J.; Muthuri, C.; van Noordwijk, M.; Neufeldt, H. Allometry and partitioning of above- and below-ground biomass in farmed eucalyptus species dominant in Western Kenyan agricultural landscapes. Biomass Bioenergy 2013, 55, 276–284. [Google Scholar] [CrossRef]
- Neya, B.; Kaboré, C.; Kiboa, D.; Sedego, T. Production de bois, élaboration d’un tarif de cubage dans la forêt du Nazinon Ouest (Sobaka); Rapport Annuel de Project “Recherche sur l’amelioration et la gestion de la jachére en Afrique de l’Ouest—Project 7 ACP RPR 269; CORAF: Dakar, Senegal, 1998. [Google Scholar]
- Sawadogo, L.; Savadogo, P.; Tiveau, D.; Dayamba, S.D.; Zida, D.; Nouvellet, Y.; Oden, P.C.; Guinko, S. Allometric prediction of above-ground biomass of eleven woody tree species in the Sudanian savanna-woodland of West Africa. J. For. Res. 2010, 21, 475–481. [Google Scholar] [CrossRef]
- Colgan, M.S.; Asner, G.P.; Swemmer, T. Harvesting tree biomass at the stand level to assess the accuracy of field and airborne biomass estimation in savannas. Ecol. Appl. 2013, 23, 1170–1184. [Google Scholar] [CrossRef] [PubMed]
- Siregar, C.A. Develop Forest Carbon Standard and Carbon Accounting System for Small-Scale Plantation Based on Local Experiences; Project Technical Report RED-PD 007/09 Rev. 2 (F); Indonesia’s Ministry of Forestry: Jakarta, Indonesia; International Tropical Timber Organization: Yokohama, Japan, 2011. [Google Scholar]
- Koala, J. Influence des Utilisation des Terres sur la séCuestration du Carbone dans les écosystémes de Savane du Burkina Faso. Ph.D. Thesis, Université Polytechnique de Bobo Dioulasso, Bobo Dioulasso, Burkina Faso, 2015. [Google Scholar]
- Chave, J.; Réjou-Méchain, M.; Búrquez, A.; Chidumayo, E.; Colgan, M.S.; Delitti, W.B.C.; Duque, A.; Eid, T.; Fearnside, P.M.; Goodman, R.C.; et al. Improved allometric models to estimate the aboveground biomass of tropical trees. Global Chang. Biol. 2014, 20, 3177–3190. [Google Scholar] [CrossRef] [PubMed]
- Chave, J.; Coomes, D.; Jansen, S.; Lewis, S.L.; Swenson, N.G.; Zanne, A.E. Towards a worldwide wood economics spectrum. Ecol. Lett. 2009, 12, 351–366. [Google Scholar] [CrossRef] [PubMed]
- Zanne, A.E.; Lopez-Gonzalez, G.; Coomes, D.A.; Ilic, J.; Jansen, S.; Lewis, S.L.; Miller, R.B.; Swenson, N.G.; Wiemann, M.C.; Chave, J. Data from: Towards a worldwide wood economics spectrum. Dryad Data Repos. 2009. [Google Scholar] [CrossRef]
- Using the USGS the Landsat 8 Product. Available online: http://landsat.usgs.gov/Landsat8_Using_Product.php (accessed on 8 June 2015).
- Song, C.; Woodcock, C.E.; Seto, K.C.; Lenney, M.P.; Macomber, S.A. Classification and change detection using Landsat TM data: When and how to correct atmospheric effects? Remote Sens. Environ. 2001, 75, 230–244. [Google Scholar] [CrossRef]
- Larsson, H. Linear regressions for canopy cover estimation in Acacia woodlands using Landsat-TM, -MSS and SPOT HRV XS data. Int. J. Remote Sens. 1993, 14, 2129–2136. [Google Scholar] [CrossRef]
- Gasparri, N.I.; Parmuchi, M.G.; Bono, J.; Karszenbaum, H.; Montenegro, C.L. Assessing multi-temporal Landsat 7 ETM+ images for estimating above-ground biomass in subtropical dry forests of Argentina. J. Arid Environ. 2010, 74, 1262–1270. [Google Scholar] [CrossRef]
- Wu, W.; de Pauw, E.; Helldén, U. Assessing woody biomass in African tropical savannahs by multiscale remote sensing. Int. J. Remote Sens. 2013, 34, 4525–4549. [Google Scholar] [CrossRef]
- Huete, A.; Didan, K.; Miura, T.; Rodriguez, E.P.; Gao, X.; Ferreira, L.G. Overview of the radiometric and biophysical performance of the MODIS vegetation indices. Remote Sens. Environ. 2002, 83, 195–213. [Google Scholar] [CrossRef]
- Wu, W. The generalized difference vegetation index (GDVI) for dryland characterization. Remote Sens. 2014, 6, 1211–1233. [Google Scholar] [CrossRef]
- Gao, B.C. NDWI—A normalized difference water index for remote sensing of vegetation liquid water from space. Remote Sens. Environ. 1996, 58, 257–266. [Google Scholar] [CrossRef]
- Lymburner, L.; Beggs, P.J.; Jacobson, C.R. Estimation of canopy-average surface-specific leaf area using Landsat TM data. Photogramm. Eng. Remote Sens. 2000, 66, 183–191. [Google Scholar]
- Birth, G.S.; McVey, G.R. Measuring the color of growing turf with a reflectance spectrophotometer. Agron. J. 1968, 60, 640–643. [Google Scholar] [CrossRef]
- R Development Core Team. R: A Language and Environment for Statistical Computing; R Foundation for Statistical Computing: Vienna, Austria, 2013; p. 3551. [Google Scholar]
- Zvoleff, A. Calculate Textures from Grey-Level Co-Occurance Matrices. R Package Version 1.2. Available online: http://cran.r-project.org/web/packages/glcm/index.html (accessed on 8 June 2015).
- Liaw, A.; Wiener, M. Classification and regression by randomForest. R J. 2002, 2, 18–22. [Google Scholar]
- Ismail, R.; Mutanga, O. A comparison of regression tree ensembles: Predicting Sirex noctilio induced water stress in Pinus patula forests of Kwazulu-Natal, South Africa. Int. J. Appl. Earth Obs. Geoinform. 2010, 12, S45–S51. [Google Scholar] [CrossRef]
- Mutanga, O.; Adam, E.; Cho, M.A. High density biomass estimation for wetland vegetation using Worldview-2 imagery and random forest regression algorithm. Int. J. Appl. Earth Obs. Geoinform. 2012, 18, 399–406. [Google Scholar] [CrossRef]
- Beckschäfer, P.; Fehrmann, L.; Harrison, R.; Xu, J.; Kleinn, C. Mapping leaf area index in subtropical upland ecosystems using RapidEye imagery and the randomforest algorithm. iForest Biogeosciences For. 2014, 7, 1–11. [Google Scholar] [CrossRef]
- Reese, H.; Nyström, M.; Nordkvist, K.; Olsson, H. Combining airborne laser scanning data and optical satellite data for classification of alpine vegetation. Int. J. Appl. Earth Obs. Geoinform. 2014, 27, 81–90. [Google Scholar] [CrossRef]
- Díaz-Uriarte, R.; Alvarez de Andrés, S. Gene selection and classification of microarray data using random forest. BMC Bioinform. 2006, 7. [Google Scholar] [CrossRef] [PubMed]
- Shoshany, M.; Svoray, T. Multidate adaptive unmixing and its application to analysis of ecosystem transitions along a climatic gradient. Remote Sens. Environ. 2002, 82, 5–20. [Google Scholar] [CrossRef]
- Ravindranath, N.H.; Ostwald, M. Carbon Inventory Methods: Handbook for Greenhouse Gas Inventory, Carbon Mitigation and Roundwood Production Projects; Springer: Heidelberg, Germany, 2008; p. 306. [Google Scholar]
- Henry, M.; Picard, N.; Trotta, C.; Manlay, R.J.; Valentini, R.; Bernoux, M.; Saint-André, L. Estimating tree biomass of sub-saharan African forests: A review of available allometric equations. Silva Fenn. 2011, 45, 477–569. [Google Scholar] [CrossRef]
- Sinare, H.; Gordon, L.J. Ecosystem services from woody vegetation on agricultural lands in Sudano-Sahelian West Africa. Agric. Ecosyst. Environ. 2015, 200, 186–199. [Google Scholar] [CrossRef]
- Bayala, J.; Sanou, J.; Teklehaimanot, Z.; Kalinganire, A.; Ouédraogo, S.J. Parklands for buffering climate risk and sustaining agricultural production in the Sahel of West Africa. Curr. Opin. Environ. Sustain. 2014, 6, 28–34. [Google Scholar] [CrossRef]
- Zandler, H.; Brenning, A.; Samimi, C. Quantifying dwarf shrub biomass in an arid environment: Comparing empirical methods in a high dimensional setting. Remote Sens. Environ. 2015, 158, 140–155. [Google Scholar] [CrossRef]
- Couteron, P.; Deshayes, M.; Roches, C. A flexible approach for woody cover assessment from SPOT HRV XS data in Semi-Arid West Africa. Application in northern Burkina Faso. Int. J. Remote Sens. 2001, 22, 1029–1051. [Google Scholar] [CrossRef]
- Seghieri, J.; Floret, C.; Pontanier, R. Plant phenology in relation to water availability: Herbaceous and woody species in the savannas of northern Cameroon. J. Trop. Ecol. 1995, 11, 237–254. [Google Scholar] [CrossRef]
- Seghieri, J.; Carreau, J.; Boulain, N.; de Rosnay, P.; Arjounin, M.; Timouk, F. Is water availability really the main environmental factor controlling the phenology of woody vegetation in the central Sahel? Plant Ecol. 2012, 213, 861–870. [Google Scholar] [CrossRef]
- Sarker, L.R.; Nichol, J.E. Improved forest biomass estimates using alos AVNIR-2 texture indices. Remote Sens. Environ. 2011, 115, 968–977. [Google Scholar] [CrossRef]
- Kammerud, T.A. Soil impact on satellite based vegetation monitoring in Sahelian Mali. Geogr. Ann. Ser. A Phys. Geogr. 1996, 78, 247–259. [Google Scholar] [CrossRef]
- Tucker, C.J. Remote sensing of leaf water content in the near infrared. Remote Sens. Environ. 1980, 10, 23–32. [Google Scholar] [CrossRef]
- Fensholt, R.; Sandholt, I. Derivation of a shortwave infrared water stress index from MODIS near- and shortwave infrared data in a semiarid environment. Remote Sens. Environ. 2003, 87, 111–121. [Google Scholar] [CrossRef]
- Cohen, W.B.; Spies, T.A.; Fiorella, M. Estimating the age and structure of forests in a multi-ownership landscape of western Oregon, USA. Int. J. Remote Sens. 1995, 16, 721–746. [Google Scholar] [CrossRef]
- Cohen, W.B.; Maierspergers, T.K.; Spies, T.A.; Oetter, D.R. Modelling forest cover attributes as continuous variables in a regional context with Thermatic Mapper data. Int. J. Remote Sens. 2001, 22, 2279–2310. [Google Scholar] [CrossRef]
- Steininger, M.K. Satellite estimation of tropical secondary forest above-ground biomass: Data from Brazil and Bolivia. Int. J. Remote Sens. 2000, 21, 1139–1157. [Google Scholar] [CrossRef]
- Lawrence, R.L.; Wood, S.D.; Sheley, R.L. Mapping invasive plants using hyperspectral imagery and breiman cutler classifications (randomforest). Remote Sens. Environ. 2006, 100, 356–362. [Google Scholar] [CrossRef]
- Adam, E.; Mutanga, O.; Abdel-Rahman, E.M.; Ismail, R. Estimating standing biomass in papyrus (Cyperus papyrus l.) swamp: Exploratory of in situ hyperspectral indices and random forest regression. Int. J. Remote Sens. 2014, 35, 693–714. [Google Scholar] [CrossRef]
© 2015 by the authors; licensee MDPI, Basel, Switzerland. This article is an open access article distributed under the terms and conditions of the Creative Commons Attribution license (http://creativecommons.org/licenses/by/4.0/).
Share and Cite
Karlson, M.; Ostwald, M.; Reese, H.; Sanou, J.; Tankoano, B.; Mattsson, E. Mapping Tree Canopy Cover and Aboveground Biomass in Sudano-Sahelian Woodlands Using Landsat 8 and Random Forest. Remote Sens. 2015, 7, 10017-10041. https://doi.org/10.3390/rs70810017
Karlson M, Ostwald M, Reese H, Sanou J, Tankoano B, Mattsson E. Mapping Tree Canopy Cover and Aboveground Biomass in Sudano-Sahelian Woodlands Using Landsat 8 and Random Forest. Remote Sensing. 2015; 7(8):10017-10041. https://doi.org/10.3390/rs70810017
Chicago/Turabian StyleKarlson, Martin, Madelene Ostwald, Heather Reese, Josias Sanou, Boalidioa Tankoano, and Eskil Mattsson. 2015. "Mapping Tree Canopy Cover and Aboveground Biomass in Sudano-Sahelian Woodlands Using Landsat 8 and Random Forest" Remote Sensing 7, no. 8: 10017-10041. https://doi.org/10.3390/rs70810017
APA StyleKarlson, M., Ostwald, M., Reese, H., Sanou, J., Tankoano, B., & Mattsson, E. (2015). Mapping Tree Canopy Cover and Aboveground Biomass in Sudano-Sahelian Woodlands Using Landsat 8 and Random Forest. Remote Sensing, 7(8), 10017-10041. https://doi.org/10.3390/rs70810017